
The Effect of Different Sludge Pretreatment Methods on Microalgae Performance and the Release of Pollutants in Hydrolysis Acidification Solutions

1
Beijing Key Lab for Source Control Technology of Water Pollution, College of Environmental Science and Engineering, Beijing Forestry University, Beijing 100083, China
2
Engineering Research Center for Water Pollution Source Control & Eco-Remediation, College of Environmental Science and Engineering, Beijing Forestry University, Beijing 100083, China
*
Author to whom correspondence should be addressed.
Water 2023, 15(16), 2873; https://doi.org/10.3390/w15162873
Submission received: 29 June 2023
/
Revised: 3 August 2023
/
Accepted: 7 August 2023
/
Published: 9 August 2023
(This article belongs to the Special Issue Urban Wastewater Treatment and Resource Utilization Based on Microalgae)
Abstract
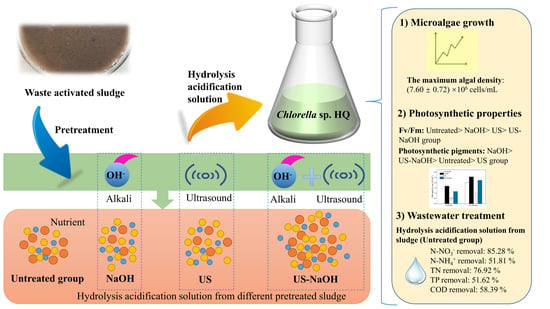
:Waste-activated sludge disposal has now become a serious global problem. After pretreatment, sludge was hydrolyzed and acidified to release nutrients. The effects of different sludge pretreatments on microalgal growth and contaminants in a hydrolysis acidification solution were compared. Alkalinization (NaOH), ultrasound (US), and combined pretreatment techniques (US-NaOH) all promoted contaminants’ release from the sludge by triggering microbial cell wall rupture and extracellular polymer dissolution. The organics released from the pretreated sludge were more readily and rapidly consumed due the presence of abundant microorganisms. The US group was more capable of releasing contaminants than the NaOH group, while the US-NaOH group overrode both. The growth characteristics, photosynthetic performance, and effluent treatment properties of Chlorella were observed in all group. In the untreated group, Chlorella exhibited higher algal density, maximum photochemical quantum yield, and effluent treatment capacity. The results demonstrated that sludge pretreatment could facilitate the release and rapid consumption of pollutants. Additionally, the NaOH pretreatment could remove the refractory organics to a higher degree, and could also accumulate more photosynthetic pigments. This study demonstrated the feasibility of Chlorella being used in practical scenarios such as hydrolytic acidification solutions for different sludge treatment methods, providing data for wastewater treatment and resource utilization.
1. Introduction
Waste-activated sludge (WAS) from wastewater treatment has now become a serious global problem [1]. The high cost of sludge disposal is a huge obstacle to the purification of WAS. In addition, the accumulation of WAS has a severe negative impact on the environment, and has caused public health concerns. The development of an efficient, low-carbon, and economical treatment technology for WAS is therefore a current hot topic in the wastewater treatment industry. In the absence of oxygen, organic matter in WAS is decomposed by anaerobic microorganisms, producing digestate and biogas, among other things [2]. The digestate contains high levels of chemical oxygen demand (COD), total nitrogen (TN), total phosphorus (TP), as well as heavy metals (HMs), and needs to be further treated to convert it into reusable bioenergy [3]. Anaerobic digestion aims to provide a substrate for the methanation phase by utilizing hydrolytic acidification. In the context of anaerobic digestion, researchers tend to focus on volatile fatty acids (VFAs) (acid production) and biogas (methane production) in depth [4]. Hydrolytic acidification, as one of the steps in anaerobic digestion, is able to degrade large organic matter into small molecules, which greatly improves the biodegradability of the wastewater. Additionally, WAS coupled with aerobic processes after hydrolytic acidification is considered a promising purification method [5]. For instance, a sludge hydrolysis acidification solution can be employed as a good medium for the growth of microalgae [6].
Microalgae combined with wastewater cultivation can minimize cultivation costs, including the cost of fresh water, nutrient salts, etc. [7]. They can also reduce greenhouse gases and energy waste resulting from the wastewater treatment process. In addition, the use of photosynthesis by microalgae to consume CO2 and as a feedstock for high-value by-products such as biofuels and fertilizers has received a lot of attention from researchers [8]. The utilization of a sludge hydrolysis acidification solution as a growth medium for microalgae may solve the problem of the high costs of nutrients and water in the microalgae culture process, achieving a harmless treatment while accomplishing energy and resource re-cycling. In this process, the multiple objectives of microalgae culture medium cost reduction, microalgae biomass production, and municipal residual sludge resource utilization are achieved simultaneously. As a growth medium for microalgae, the components of the sludge hydrolysis acidification solution play a crucial role. The WAS in its solid phase is initially broken down by the sludge hydrolysis acidification process, resulting in the transformation of some large and complex solid organic matter into small molecule organic matter [9]. The smaller soluble organic matter facilitates nutrient uptake by microalgae to accelerate the disposal of WAS and the wastewater treatment process. To further enhance the hydrolytic acidification process, the degradability of extracellular polymers (EPS) is enhanced, as well as the complex microstructures and components of microbial cells, mainly achieved through pretreatment of the WAS [10]. Typically, pretreatment methods include ultrasonication (US) [11], acidification/alkalization [12], thermal hydrolysis [13], microwave [14], oxidation [15], and free nitrous acid (FNA), etc. [16]. However, pretreated WAS has been studied mostly for the enhancement of acid and methanogenic stages (e.g., biogas, VFAs, etc.) [17], without considering the effect of digestion media or mechanical manipulation on sludge hydrolysis acidification and microalgal growth.
Ultrasound applied to the sludge liquid causes cavitation, followed by the bursting of microbubbles, causing large hydraulic shear forces, which in turn leads to microbial cell wall rupture and the dissolution of the sludge EPS. Similarly, alkalinization promotes the release of organic matter by swelling organic particles and dissolving fibrous components. A previous study [18] showed that monovalent bases, represented by NaOH, were more effective than divalent bases (e.g., Ca(OH)2, Mg(OH)2, etc.) for sludge pretreatment, since divalent bases are only partially soluble. In addition, the amount of alkali dosed has a different effect on the sludge pretreatment effect. A lower pH can destroy the sludge floc structure, while a higher pH can damage the cell walls of microorganisms and even denature proteins, saponify lipids, and hydrolyze DNA [19]. In this study, alkalization, US and US + alkalization methods were used to pretreat the residual sludge. The effect of sludge fermentation solution under different pretreatments on the growth of Chlorella sp. HQ was investigated, and the removal of pollutants from the acidified solution was also examined, thus providing a data basis for the treatment of sludge hydrolysis-acidified solution coupled with microalgae cultivation technology.
2. Materials and Methods
2.1. Microalgal Strain and Wastewater
The microalgae selected in this study were Chlorella sp. HQ (CGMCC7601), stored in the China General Microbiological Culture Collection Center. The BG11 medium was used for enrichment culture and storage of microalgae prior to the run of this study. The temperature was 25 ± 2 °C, the pH value was 7–8, the light intensity was 37.5 μmol m−2 s−1 and the light/dark ratio was 12 h/12 h.
Residual sludge was obtained from the Beijing Yongfeng Reclaimed Water Plant (Beijing, China). The inoculated sludge was anaerobically fermented inoculated sludge purchased from Anhui Huibo Environmental Protection Technology Engineering Co., Ltd. (Hefei, China) of China, and the sludge was kept in a refrigerator at 4 °C before use. The inoculated sludge was pre-treated by boiling at 100 °C for 30 min in order to kill methanogenic bacteria to prevent entering the gas and acid production stages. The hydrolyzed acidified solution was obtained after 5 d of anaerobic digestion of the sludge at a temperature of 35 ± 1 °C (residual sludge was mixed with inoculated sludge at a VS ratio of 1:1 for fermentation). The pH value of the initial residual sludge was 6.83, with a total solids (TS) content of 25.54 g/L and a volatile solids (VS) content of 14.56 g/L. The initial inoculated sludge pH value was 7.09, with TS and VS concentrations of 80.46 g/L and 61.96 g/L, respectively.
To accelerate the process of sludge hydrolysis and digestion, sludge was pretreated with alkalization (NaOH), US and US + alkalization (US-NaOH), i.e., a NaOH group, a US group, and a US-NaOH group, as well as untreated sludge as a control group. Among them, alkalinization pretreatment was carried out by adding a certain amount of NaOH. US pretreatment was performed using an ultrasonic cell crusher (SCIENTZ, JY98-IIIN (Ningbo Xinzhi Biological Co., Ltd., Ningbo, China)) with ultrasonic frequency of 20 kHz, an acoustic energy of 0.12 W/mL, and a time of 10 min (periodic 2 s ultrasonication and 2 s pause). In the case of the US-NaOH group, we used a combination of alkalinization and ultrasonication. The purpose of pretreatment is mainly to break up the sludge flocs, destroy the microbial cells, and secretion-generated EPS agglomerates in the sludge, and accelerate the hydrolysis and release of organic matter. Alkalization and ultrasound, as representative chemical and physical treatments, were employed to investigate the effect of sludge pretreatment on its hydrolysis effect and subsequent microalgae culture. The effects of the different pretreatment methods on the hydrolysis acidification solution are listed in Table 1.
2.2. Experimental Design
Various hydrolytic acidification solutions were obtained via different pretreatment methods. The residual sludge was pre-treated before inoculation, and for the NaOH group, 400 mL of residual sludge was taken in 1 L stoppered conical flasks, and 4 mol/L NaOH was added until the content was 0.04 g NaOH/g TS. After mixing, the conical flasks were poured with N2 for about 4 min to remove residual air, and then left at room temperature for 24 h. Moreover, 400 mL of residual sludge was placed in a 1 L beaker and sonicated for 10 min (working 2 s with 2 s intervals) to obtain the US group. Additionally, the US-NaOH group included the simultaneous action of the above NaOH group and the US group on the residual sludge. After pretreatment, the residual sludge was mixed with boiled inoculated sludge in equal quantities, and then anaerobically fermented in a thermostatic water bath at 35 ± 1 °C.
Chlorella sp. HQ was incubated for 12 d to examine the effect of different pretreatment methods on the culture of microalgae using the hydrolytic acidification solution produced by the different pretreatment methods as a nutrient source. Experiments were carried out in 250 mL conical flasks, with 150 mL of working solution. All treatment results were repeated. Microalgae culture conditions were consistent with the pre-culture. The temperature was 25 ± 2 °C, the pH value was 7–8, the light intensity was 37.5 μmol m−2 s−1, and the light/dark ratio was 12 h/12 h. The initial algal density was adjusted to 5 × 10⁵ cells/mL, and samples were taken at 2 d intervals to determine algal density and pH value. Photosynthetic pigments and maximum photochemical quantum yield of PS II (Fv/Fm) were measured at 6 d and 12 d to examine the effect of different pretreatment methods on microalgal photosynthesis. In addition, to determine the ability of the microalgae to remove contaminants from the hydrolytic acidification solution, the concentrations of N-NH4+, TN, TP, and COD were measured at 6 d and 12 d. In this case, the supernatant of the hydrolytic acidification solution was selected via centrifugation at 1740× g for 10 min, and filtered through a 0.45 μm membrane. The filtered supernatant was also analyzed via three-dimensional excitation emission matrix fluorescence spectroscopy (3D-EEM) (F-7000, HITACHI, Tokyo, Japan) to further determine the degradation of organic matter.
2.3. Analysis Methods
Algal density was counted via hemocytometry (0.1 mm, 1/400 mm2). Some 10 μL of algal cell suspension was taken and injected into the counting cell, and an optical microscope (XSZ-HS3, Chongqing Optical & Electrical Instrument Company, Chongqing, China) was utilized to count and convert algal cell densities. Photosynthetic pigments such as chlorophyll a, chlorophyll b, and carotene were measured according to the method of Liu et al. [20]. According to Equations (1)–(3), chlorophyll a (Cchla), chlorophyll b (Cchlb), and carotenoid (Ccar) contents were calculated as follows.
Cchla = 12.21A663 − 2.81A646
Cchlb = 20.13A646 − 5.03A663
Ccar = (1000A470 − 3.27Cchla − 104Cchlb)/229
Fv/Fm was recorded using chlorophyll fluorometry AquaPen-P (AP110-P, Brno, Czech Republic). Some 10 mL of algal solution was sampled and was adjusted for initial absorbance at 680 nm to 0.2 and left to stand under dark conditions for 15 min. Parameters such as the saturating light intensity and measured light intensity of the microalgae were debugged and determined for chlorophyll fluorescence-induced kinetics (OJIP test) determination to obtain parameters such as Fv/Fm. Water quality parameters such as N-NH4+, TN, TP and COD were measured according to the Chinese standard analytical method, and the specific steps can be found in the work of Liu et al. [20].
2.4. Statistical Analysis
All experiments in this study were repeated in triplicate. The data were analyzed with Origin 2021 software and expressed in the form of mean ± standard deviation.
3. Results and Discussion
3.1. Growth Characteristics of Chlorella sp. HQ
There was higher growth performance of Chlorella sp. HQ in the sludge hydrolysis acidification solution, and it was found to grow optimally in the sludge-untreated hydrolysis acidification solution (Figure 1a). After 12 d of incubation, the algal density in the untreated group reached (7.60 ± 0.72) ×106 cells/mL, which was 3.40, 3.15 and 2.50 times higher than that in the NaOH, US, and US-NaOH groups, respectively. Studies had shown that alkaline pH conditions favored the anaerobic hydrolysis process, and that the relevant functional hydrolase genes involved in regulating the expression of the corresponding hydrolysis process preferred rapid hydrolysis under alkaline conditions [21]. Thus, the US-NaOH group with alkaline pH had the highest degree of hydrolysis, as evidenced by the concentrations of carbon, nitrogen, and phosphorus in Table 1 and the EEM results of Figure 5d. Besides, the combined treatment group (US-NaOH group) had the highest concentrations of COD, N-NH4+, TN, and TP among all treatment groups. The result indicated that the combined treatment of ultrasonication and alkalization was superior to a single treatment and more conducive to enhancing sludge hydrolysis and the release of more pollutants. Concentrations of N-NH4+, TN, and TP were increased in a single treatment (NaOH, US) and combined treatment (US-NaOH group) as compared to the untreated group, whereas COD concentration was decreased in the single treatment group and increased in the combined treatment group. They speculated that different pretreatment methods were effective in increasing the release of organic matter, the sludge flocs were broken up after the single treatment, and the large number of microorganisms contained in their solution decomposed rapidly and outweighed the untreated group. Whereas, the combined treatment was effective in releasing the organic matter, but excessive nutrient salts caused the microorganisms to show inhibition of their growth, and they were unable to decompose rapidly. The hydrolysate was pretreated to hydrolyze macromolecules and release nutrients for removal or reuse in subsequent processes [4]. However, the density of microalgae growth in the three treatment groups, where nutrients were more readily absorbed, was much lower than in the untreated group. The lower algal density in the three treatment groups compared to the untreated group could be attributed to an imbalance in the ratio of carbon, nitrogen and phosphorus in the culture solution, which was detrimental to the division of microalgal cells and thus inhibited microalgal growth [22]. After alkalinization and ultrasonic pretreatment, the organic matter was more easily degradable during hydrolysis, further reducing the carbon content of the water. Hydrolysis acidification not only failed to reduce the nitrogen and phosphorus concentrations in the water but also promoted their increase, lowering the C/N ratio even more. The three pretreatment methods resulted in low C/N ratios and ammonia suppression, which was consistent with the study by Gao et al. [23].
According to Figure 1b, the pH value of the solution became lower during the hydrolytic acidification stage, and the pH value of the three pretreatment groups decreased more. There was little difference in pH among treatment groups during microalgae cultivation. As the microalgae grew and photosynthesis consumed H+, the pH value in the water gradually increased. The pH values increased in all groups, indicating that the microalgae grew normally in all treatment groups, which verified the results in Figure 1a.
3.2. Photosynthetic Characteristics
Photosynthetic pigments, as one of the significant factors affecting photosynthesis, can capture light energy to promote photosynthesis in microalgae. Studies have shown that microalgae are 10–50 times more efficient at photosynthetic carbon sequestration using solar energy than other terrestrial green plants [24]. This is due to the simple cell structure and short growth cycle of microalgae, which can reproduce rapidly and increase the efficiency of photosynthetic carbon sequestration. Chlorella relies primarily on the C3 pathway for photosynthetic carbon fixation, using nutrients such as carbon, nitrogen, and phosphorus, as well as consuming H+ to synthesize organic matter and O2 [25]. This is described by Equation (4):
106CO2 + 16NO3− + HPO42− + 122H2O + 18H+ → C106H263O110N16P + 138O2
The C3 pathway, also known as the Calvin cycle, involves CO2 fixation and C3 reduction and is the process by which microalgae use ATP and NADPH produced by light reactions to synthesize organic compounds [25]. This photosynthetic carbon fixation reaction occurs in the chloroplast stroma. Photosynthetic pigments are found in chloroplast thylakoid membranes and contain chlorophyll, reaction center pigments, and auxiliary pigments. Photosynthetic pigments can participate in the absorption and transfer of light energy or cause primary photochemical reactions in photosynthesis. The photosynthetic pigments of most algae contain chlorophyll a, b, and carotenoids, which capture light energy and pass it on to the light reaction centers. Meanwhile, the specific chlorophyll a, as a reaction center pigment, can utilize light energy to cause charge separation and photochemical reactions [26].
In Figure 2, the content of chlorophyll a, chlorophyll b, and carotene all accumulated as the microalgae grew. The NaOH group was ahead of the others, indicating that the NaOH-pretreated hydrolysate was more conducive to the accumulation of photosynthetic pigments. The chlorophyll a content ranged from high to low: NaOH > US-NaOH > Untreated > US, chlorophyll b concentration ranged from high to low: NaOH > US-NaOH > US > Untreated, and carotene content ranged from high to low: NaOH > Untreated > US-NaOH > US. Taken together, Figure 1a and Figure 2 showed that the algal density in the untreated group far exceeded that of the other treatment groups, but the chlorophyll content was lower than that obtained by culturing the microalgae in NaOH and US-NaOH-pretreated hydrolytic acidified solutions. It can therefore be inferred that the microalgae in the untreated group assimilated and absorbed the organic carbon in the water more easily, and heterotrophic metabolism occurred more actively, thereby interfering with photosynthesis [27]. In contrast, algal density was at the lowest level in all treatment groups when the NaOH-pretreated hydrolytic acidified solution was employed as a microalgal growth medium. However, in Figure 2, chlorophyll content dominated in the NaOH group, suggesting that microalgae in the NaOH group were predominantly photosynthesizing, even stimulating photosynthetic potential under the stress of uncomfortable environmental conditions. This conclusion was consistent with the result that in Figure 3, the NaOH group with the worst growth rate possessed a higher maximum quantum yield than the US and US-NaOH groups.
In addition, photosynthetic pigments are not the only factors that influence the intensity of photosynthesis. The synergistic action of the photoreactive centers PSI and PSII ensures that photosynthesis in microalgae proceeds smoothly. The maximum photochemical quantum yield of PSII (Fv/Fm), also known as the primary light energy conversion efficiency, indicates the maximum photosynthetic potential of microalgae. As shown in Figure 3, the Fv/Fm values of the untreated group remained high throughout the cultivation stage, which also corresponded to the much higher algal density results of the untreated group than the other treatment groups in Figure 1a. The Fv/Fm values of all three treatment groups decreased at the third day of microalgae cultivation, and rebounded at the sixth day. In the US-NaOH group, the Fv/Fm values decreased rapidly. Stablein et al. showed that microalgae under mixotrophy conditions focused on increasing biomass through heterotrophic culture, while photosynthesis was disturbed, reducing photosynthetic efficiency and CO2 fixation rates [28]. Furthermore, the photosynthetic reduction rate and carbon fixation rate were influenced by factors such as organic carbon concentration and type, and there was a difference in their inhibition effect [29]. Compared to autotrophy, chlorophyll content decreased by 74% in the medium supplemented with glucose, whereas it was not significantly inhibited in the medium supplemented with sodium acetate. Therefore, the photosynthetic contribution of microalgae cannot be generalized, even under mixotrophy conditions. Due to the complexity of the actual effluent, the photosynthetic characteristics of the microalgae in the effluent need to be analyzed on a case-by-case basis. In combination with Figure 1a, all groups of microalgae at the 3 d entered the logarithmic phase and achieved rapid growth. Correspondingly, at the 3 d, the most significant differences in photosynthetic potential among all the groups of microalgae were shown in Figure 3, in the order of Untreated > NaOH > US > US-NaOH group.
3.3. Contaminant Removal Using a Hydrolysis-Acidified Solution
Water quality parameters such as N-NO3−, TN, N-NH4+, TP, and COD are vital indicators of the characteristics of water. Microalgae can use nutrients such as carbon, nitrogen, and phosphorus to grow and reproduce. Similarly, when microalgae aged and died, the lysis of algal cells led to the release of nutrients such as carbon, nitrogen, and phosphorus. The change in concentration of water quality parameters reflected the level of degradation of the hydrolysis acidification solution. As shown in Figure 4, the removal of N-NO3−, TN, N-NH4+, TP, and COD was found to be effective in all treatment groups on day 7 of cultivation, indicating that Chlorella sp. HQ could use the pollutants in the acidified solution to synthesize the substances required for its growth. The removal rates of N-NO3−, N-NH4+, and TP in the untreated group were significantly higher than those in the other three groups at 6 days, with 35.27%, 42.92%, and 58.34%, respectively. By extending the cultivation period to 12 days, it was found that the removal rates of N-NO3− and N-NH4+ increased to 85.78% and 51.81% in the untreated group, while the removal rate of TN remained the same at 76.92%, and the removal rate of TP decreased (51.62%), which might be due to the metabolites secreted by the microalgae themselves. Microalgae utilize nutrients such as carbon, nitrogen, and phosphorus to grow and thus achieve the removal of carbon, nitrogen, and phosphorus. In anaerobic fermentation, the N-NH4+ concentration dominated the concentration of TN [30], which was consistent with the nitrogen concentrations in Figure 4a–c. The lower concentration of N-NO3− and the much lower removal of N-NO3− than of N-NH4+ in the early stages of microalgae cultivation proved that the microalgae preferred N-NH4+ in their uptake of nitrogen sources in this study. In Figure 4a, the increase was considerable in N-NO3− removal rates for each group from 6 d to 12 d, indicating that N-NO3− removal was mainly completed between 6 d and 12 d. At 6 d, the removal rate of N-NO3− was much higher in the untreated group than in the other treatment groups, while the lowest removal rate of 85.78% was achieved in the untreated group when the cultivation time was extended to 12 d. In contrast, the NaOH group showed the lowest removal rate (12.70%) on day 6, until the highest removal rate (93.71%) was reached at day 12. This was hypothesized to be due to alkaline conditions being more conducive to N-NO3−’s release and removal. According to Hao et al. [31], when the pH value exceeded 8, the formation of insoluble precipitates from phosphate in the effluent led to a reduction in TP concentration. Thus, TP removal was achieved through a combination of microalgal cell synthesis and insoluble precipitates generated by the alkaline environment. According to Figure 4e, the highest COD removal rate in the US group was 70.99% at day 6, but the rate decreased to 3.97% when the cultivation time was extended to 12 days. That indicated that more EPSs were secreted by the microalgae and bacteria in the US group pre-treated with ultrasound during the cultivation period. Combined with the results of the growth curves of microalgae in Figure 1a, it was found that after the growth of microalgae cells to the plateau stage, the efficient removal of C, N, P from water could not be ensured even with relatively high algal densities, which was related to the absorption capacity and EPS secretion of microalgae itself, and explained even more why a wide range of researchers have preferred to study the performance of microalgae in the logarithmic phase. In this study, a hydrolysis-acidified solution was employed as a growth medium, allowing microalgae for mixotrophic growth [4]. The organic and inorganic carbon from the effluent and CO2 from the air under light conditions were used simultaneously, allowing for side-by-side organic heterotrophy and photosynthetic autotrophy, thereby utilizing the advantages of short growth cycles and high biomass, simultaneously increasing the growth rate and nutrient removal efficiency of the microalgae [32].
3.4. Characteristics of Extracellular Polymer Substances
To investigate the nutrient removal mechanism of Chlorella sp. HQ in a hydrolytic acidification solution treated with different pretreatments, the fluorescence intensity of the different treatment groups at 0 d and 12 d was qualitatively analyzed using 3D-EEM. 3D-EEM is commonly used to characterize dissolved organic matter, which we identify as the dissolved organic matter present in the hydrolyzed acidified solution, as well as that secreted by microalgae and indigenous bacteria during the culture process. Dissolved organic matter was found to be associated with aromatic proteins, fulvic acid-like substances, soluble microbial by-products, and humic acid-like substances [33]. The corresponding EEM spectra could be divided into five regions, I and II representing tyrosine- and tryptophan-like substances (Ex = 200–250 nm, Em = 200–330 nm; Ex = 200–250 nm, Em = 330–380 nm), III representing fulvic acid-like substances (Ex = 200–250 nm, Em = 380–500 nm), and IV associated with soluble microbial by-products (Ex = 250–400 nm, Em = 200–380 nm) as well as V representing humic acid-like substances (Ex = 250–400 nm, Em = 380–500 nm) [20,34].
According to Figure 5a–d, the untreated group had the highest fluorescence intensity, that is, the highest contaminant content. The fluorescence intensities of the treatment groups were from the US, NaOH, and NaOH-US groups in descending order. These results indicated all three treatment groups were able to remove pollutants to some extent. Among them, the NaOH-US group had the highest removal capacity and the lowest initial dissolved organic matter content. Region IV represents soluble microbial products, and all treatment groups showed fluorescence peaks in region IV [35]. Comparing Figure 5a–c with Figure 5e–g, the untreated, NaOH, and US groups all had some contaminant removal capacity after 12 d of cultivation, with a significant reduction in the intensity of the fluorescence peak in region IV. However, between Figure 5d,h, the contaminant’s peak value became higher from 0 d to 12 d, reflecting the fact that the NaOH-US pretreatment method could significantly reduce dissolved organic matter in the hydrolysis acidification solution, but secreted EPSs during the microalgae culture. Due to microalgae and bacteria growth, even though EPSs as nutrients were assimilated by microalgae as well as oxidative decomposed by microorganisms, metabolic substances were inevitably secreted, leading to an increase in the peak value of Figure 5h. After 12 d of microalgae cultivation, fulvic acid-like substances and humic acid-like substances represented by regions III and V increased slightly in the US group, unlike the trend of decreasing fulvic acid-like substances and humic acid-like substances in the other groups. That may be because part of the microalgae cells lysed and died, and the polymeric substances synthesized inside the cells, such as humic substances, were released and degraded to humic and fulvic acids outside the cells. In addition, the lower content of macromolecules in Figure 5b,d verified the conclusion that an alkaline pH was more favorable for speeding up the hydrolysis process [36].
4. Conclusions
Chlorella sp. HQ had the highest algal density and optimal growth in the untreated group of the hydrolyzed acidified solution. Moreover, the Fv/Fm values of the untreated group also consistently occupied a higher position, indicating its higher photosynthetic potential. Furthermore, after 12 d of cultivation, the concentrations of TN, N-NH4+, TP, and COD in the hydrolytic acidified solution decreased in all treatment groups, with the untreated group showing higher pollutant removal than the NaOH, US, and US-NaOH groups. Therefore, the hydrolytic acidification solution obtained from the untreated sludge was more suitable for the growth of Chlorella sp. HQ. However, according to 3D-EEM, pretreatment reduced the soluble organic matter in the solution, especially the hard-to-degrade organic matter. Therefore, microalgae were more capable of accumulating biomass and photosynthetic carbon fixation as well as nutrient uptake in the untreated group, but when dissolved organic matter was considered, NaOH pretreatment sludge was selected to produce hydrolytic acidification solution, which can not only accumulate higher photosynthetic pigments, but can also remove hard-to-degrade organic matter.
Author Contributions
Conceptualization, X.W.; methodology, Y.H.; software, X.W.; validation, X.L.; formal analysis, X.W.; investigation, Y.H. and X.L.; resources, Y.H.; data curation, X.L.; writing—original draft preparation, X.W.; writing—review and editing, Y.H. and X.L.; supervision, Y.H.; project administration, Y.H.; funding acquisition, Y.H. All authors have read and agreed to the published version of the manuscript.
Funding
The study was financially supported by the National Natural Science Foundation of China (No. 52071030) and the Beijing Municipal Education Commission through the Innovative Transdisciplinary Program “Ecological Restoration Engineering”.
Data Availability Statement
Not applicable.
Conflicts of Interest
The authors declare no conflict of interest.
References
- Pang, H.; Jiao, Q.; He, J.; Zhang, Z.; Wang, L.; Yan, Z.; Lu, J. Enhanced short-chain fatty acids production through a short-term anaerobic fermentation of waste activated sludge: Synergistic pretreatment of alkali and alkaline hydrolase blend. J. Clean. Prod. 2022, 342, 130954. [Google Scholar] [CrossRef]
- He, D.; Xiao, J.; Wang, D.; Liu, X.; Li, Y.; Fu, Q.; Li, C.; Yang, Q.; Liu, Y.; Ni, B.J. Understanding and regulating the impact of tetracycline to the anaerobic fermentation of waste activated sludge. J. Clean. Prod. 2021, 313, 127929. [Google Scholar] [CrossRef]
- Zahedi, S.; Icaran, P.; Yuan, Z.; Pijuan, M. Assessment of free nitrous acid pretreatment on a mixture of primary sludge and waste activated sludge: Effect of exposure time and concentration. Bioresour. Technol. 2016, 216, 870–875. [Google Scholar] [CrossRef]
- Chong, C.C.; Cheng, Y.W.; Ishak, S.; Lam, M.K.; Lim, J.W.; Tan, I.S.; Show, P.L.; Lee, K.T. Anaerobic digestate as a low-cost nutrient source for sustainable microalgae cultivation: A way forward through waste valorization approach. Sci. Total Environ. 2022, 803, 150070. [Google Scholar] [CrossRef]
- Duan, N.; Khoshnevisan, B.; Lin, C.; Liu, Z.; Liu, H. Life cycle assessment of anaerobic digestion of pig manure coupled with different digestate treatment technologies. Environ. Int. 2020, 137, 105522. [Google Scholar] [CrossRef]
- Jimenez, R.; Markou, G.; Tayibi, S.; Barakat, A.; Monlau, F. Production of Microalgal Slow-Release Fertilizer by Valorizing Liquid Agricultural Digestate: Growth Experiments with Tomatoes. Appl. Sci. 2020, 10, 3890. [Google Scholar] [CrossRef]
- Chaudry, S. Integrating Microalgae Cultivation with Wastewater Treatment: A Peek into Economics. Appl. Biochem. Biotechnol. 2021, 193, 3395–3406. [Google Scholar] [CrossRef]
- Sharma, R.; Mishra, A.; Pant, D.; Malaviya, P. Recent advances in microalgae-based remediation of industrial and non-industrial wastewaters with simultaneous recovery of value-added products. Bioresour. Technol. 2022, 344, 126129. [Google Scholar] [CrossRef]
- Chen, Y.; Jiang, S.; Yuan, H.; Zhou, Q.; Gu, G. Hydrolysis and acidification of waste activated sludge at different pHs. Water Res. 2007, 41, 683–689. [Google Scholar] [CrossRef]
- Chen, Y.D.; Li, S.; Ho, S.H.; Wang, C.; Lin, Y.C.; Nagarajan, D.; Chang, J.S.; Ren, N.Q. Integration of sludge digestion and microalgae cultivation for enhancing bioenergy and biorefinery. Renew. Sustain. Energy Rev. 2018, 96, 76–90. [Google Scholar] [CrossRef]
- Riau, V.; De la Rubia, M.A.; Pérez, M. Upgrading the temperature-phased anaerobic digestion of waste activated sludge by ultrasonic pretreatment. Chem. Eng. J. 2015, 259, 672–681. [Google Scholar] [CrossRef]
- Wang, Q.; Wei, W.; Gong, Y.; Yu, Q.; Li, Q.; Sun, J.; Yuan, Z. Technologies for reducing sludge production in wastewater treatment plants: State of the art. Sci. Total Environ. 2017, 587–588, 510–521. [Google Scholar] [CrossRef] [PubMed]
- Kinnunen, V.; Yla-Outinen, A.; Rintala, J. Mesophilic anaerobic digestion of pulp and paper industry biosludge–long-term reactor performance and effects of thermal pretreatment. Water Res. 2015, 87, 105–111. [Google Scholar] [CrossRef]
- Gil, A.; Siles, J.A.; Martín, M.; Chica, A.F.; Estévez-Pastor, F.; Toro-Baptista, E. Effect of microwave pretreatment on semi-continuous anaerobic digestion of sewage sludge. Renew. Energy 2018, 115, 917–925. [Google Scholar] [CrossRef]
- Zhou, X.; Wang, Q.L.; Jiang, G.M. Enhancing methane production from waste activated sludge using a novel indigenous iron activated peroxidation pre-treatment process. Bioresour. Technol. 2015, 182, 267–271. [Google Scholar] [CrossRef] [Green Version]
- Zahedi, S.; Icaran, P.; Yuan, Z.; Pijuan, M. Exploring alternatives to reduce economical costs associated with FNA pre-treatment of waste activated sludge. Bioresour. Technol. 2017, 243, 315–318. [Google Scholar] [CrossRef] [PubMed] [Green Version]
- Zhang, L.W.; Yang, J.J.; Wu, B.D.; Liu, J.J.; Xu, X.Y.; Wu, W. Enhanced VFAs production from microalgal hydrolytic acidification with ultrasonic-alkali pretreatment. Algal Res. 2023, 71, 103056. [Google Scholar] [CrossRef]
- Jin, B.; Wang, S.; Xing, L.; Li, B.; Peng, Y. Long term effect of alkali types on waste activated sludge hydrolytic acidification and microbial community at low temperature. Bioresour. Technol. 2016, 200, 587–597. [Google Scholar] [CrossRef] [PubMed]
- Torres, M.L.; Lloréns, M.C.E. Effect of alkaline pretreatment on anaerobic digestion of solid wastes. Waste Manag. 2008, 28, 2229–2234. [Google Scholar] [CrossRef]
- Liu, X.Y.; Hong, Y.; Zhai, Q.Y.; Zhao, G.P.; Zhang, H.K.; Wang, Q. Performance and mechanism of Chlorella in swine wastewater treatment: Roles of nitrogen-phosphorus ratio adjustment and indigenous bacteria. Bioresour. Technol. 2022, 358, 127402. [Google Scholar] [CrossRef]
- Feng, L.Y.; Chen, Y.Z.; Chen, X.T.; Duan, X.; Xie, J.; Chen, Y.G. Anaerobic accumulation of short-chain fatty acids from algae enhanced by damaging cell structure and promoting hydrolase activity. Bioresour. Technol. 2018, 250, 777–783. [Google Scholar] [CrossRef]
- Kabir, S.B.; Khalekuzzaman, M.; Hossain, N.; Jamal, M.; Alam, M.A.; Abomohra, E.F. Progress in biohythane production from microalgae-wastewater sludge co-digestion: An integrated biorefinery approach. Biotechnol. Adv. 2022, 57, 107933. [Google Scholar] [CrossRef] [PubMed]
- Gao, F.; Yang, H.L.; Li, C.; Peng, Y.Y.; Lu, M.M.; Jin, W.H.; Bao, J.J.; Guo, Y.M. Effect of organic carbon to nitrogen ratio in wastewater on growth, nutrient uptake and lipid accumulation of a mixotrophic microalgae Chlorella sp. Bioresour. Technol. 2019, 282, 118–124. [Google Scholar] [CrossRef] [PubMed]
- Bohutskyi, P. Biogas Production from Algae and Cyanobacteria Through Anaerobic Digestion: A Review, Analysis, and Research Needs. In Advanced Biofuels and Bioproducts; Springer: New York, NY, USA, 2013; pp. 873–975. [Google Scholar] [CrossRef]
- Voon, C.P.; Law, Y.S.; Guan, X.Q.; Lim, S.L.; Xu, Z.; Chu, W.T.; Zhang, R.; Sun, F.; Labs, M.; Leister, D.; et al. Modulating the activities of chloroplasts and mitochondria promotes adenosine triphosphate production and plant growth. Energy Res. Manag. 2014, 2, e7. [Google Scholar] [CrossRef]
- Cherepanov, D.A.; Shelaev, I.V.; Gostev, F.E.; Petrova, A.; Semenov, A.Y. Primary charge separation within the structurally symmetric tetrameric Chl2APAPBChl2B chlorophyll exciplex in photosystem I. J. Photochem. Photobiol. B 2021, 217, 112154. [Google Scholar] [CrossRef] [PubMed]
- Bozdag, G.O.; Libby, E.; Pineau, R.; Reinhard, C.T.; Ratcliff, W.C. Oxygen suppression of macroscopic multicellularity. Nat. Commun. 2021, 12, 2838. [Google Scholar] [CrossRef]
- Stablein, M.J.; Baracho, D.H.; Watson, J.T.; Silva, J.C.; Zhang, Y.; Lombardi, A.T. Microalgal photosynthetic inhibition and mixotrophic growth in Post Hydrothermal Liquefaction Wastewater (PHW). Algal Res. 2021, 60, 102548. [Google Scholar] [CrossRef]
- Joun, J.; Sirohi, R.; Sim, S.J. The effects of acetate and glucose on carbon fixation and carbon utilization in mixotrophy of Haematococcus pluvialis. Bioresour. Technol. 2023, 367, 128218. [Google Scholar] [CrossRef]
- Xia, A.; Murphy, J.D. Microalgal Cultivation in Treating Liquid Digestate from Biogas Systems. Trends Biotechnol. 2016, 34, 264–275. [Google Scholar] [CrossRef]
- Hao, X.D.; Wang, C.C.; Lan, L.; van Loosdrecht, M.C.M. Struvite formation, analytical methods and effects of pH and Ca2+. Water Sci. Technol. 2008, 58, 1687–1692. [Google Scholar] [CrossRef]
- Wang, J.H.; Yang, H.Z.; Wang, F. Mixotrophic Cultivation of Microalgae for Biodiesel Production: Status and Prospects. Appl. Biochem. Biotechnol. 2014, 172, 3307–3329. [Google Scholar] [CrossRef]
- Pooi, C.K.; Loka, V.; Ng, H.Y. Treatment and hybrid modeling of domestic reverse osmosis concentrate using biological activated carbon. Desalination 2019, 468, 114047. [Google Scholar] [CrossRef]
- Wang, X.Y.; Ding, S.X.; Song, W.C.; Li, H.W.; Zhang, Y.H.; Ren, W.N.; Li, M.H.; Lu, J.; Ding, J.C. A collaborative effect of algae-bacteria symbiotic and biological activated carbon system on black odorous water pretreated by UV photolysis. Biochem. Eng. J. 2021, 169, 107983. [Google Scholar] [CrossRef]
- Wen, C.; Paul, W.; Leenheer, J.A.; Karl, B. Fluorescence excitation-emission matrix regional integration to quantify spectra for dissolved organic matter. Environ. Sci. Technol. 2003, 37, 5701–5710. [Google Scholar] [CrossRef]
- Qiu, Y.; Frear, C.; Chen, S.; Ndegwa, P.; Harrison, J.; Yao, Y.; Ma, J. Accumulation of long-chain fatty acids from Nannochloropsis salina enhanced by breaking microalgae cell wall under alkaline digestion. Renew. Energy 2020, 149, 691–700. [Google Scholar] [CrossRef]
Figure 1.
Growth curve (a) of Chlorella sp. HQ in different treatment groups of hydrolysis acidification solution and pH value change (b) in different treatment stages.
Figure 1.
Growth curve (a) of Chlorella sp. HQ in different treatment groups of hydrolysis acidification solution and pH value change (b) in different treatment stages.

Figure 2.
The photosynthetic pigment contents of Chlorella sp. HQ in different treatment groups of hydrolysis acidification solution: chlorophyll a (a), chlorophyll b (b), and carotenoids (c).
Figure 2.
The photosynthetic pigment contents of Chlorella sp. HQ in different treatment groups of hydrolysis acidification solution: chlorophyll a (a), chlorophyll b (b), and carotenoids (c).

Figure 3.
The Fv/Fm value of Chlorella sp. HQ in different treatment groups of hydrolysis acidification solution.
Figure 3.
The Fv/Fm value of Chlorella sp. HQ in different treatment groups of hydrolysis acidification solution.

Figure 4.
Pollutants’ removal in different treatment groups of hydrolysis acidification solution: N-NO3− (a) N-NH4+; (b) TN; (c) TP; (d) COD; (e) concentration.
Figure 4.
Pollutants’ removal in different treatment groups of hydrolysis acidification solution: N-NO3− (a) N-NH4+; (b) TN; (c) TP; (d) COD; (e) concentration.

Figure 5.
The EEM of Chlorella sp. HQ in different treatment groups of hydrolysis acidification solution: untreated (a) NaOH; (b) US; (c) NaOH-US; (d) group at 0 d and untreated (e) NaOH; (f) US; (g) NaOH-US; (h) group at 12 d.
Figure 5.
The EEM of Chlorella sp. HQ in different treatment groups of hydrolysis acidification solution: untreated (a) NaOH; (b) US; (c) NaOH-US; (d) group at 0 d and untreated (e) NaOH; (f) US; (g) NaOH-US; (h) group at 12 d.


Table 1.
Characteristics of sludge hydrolysis acidification solution in different pretreatments.
| Parameter | Untreated | NaOH | US | US-NaOH |
|---|---|---|---|---|
| pH | 7.26 ± 0.03 | 6.96 ± 0.10 | 6.60 ± 0.01 | 6.83 ± 0.02 |
| N-NH4+ (mg/L) | 259.99 | 383.66 (47.57%) | 453.71 (74.51%) | 485.04 (86.56%) |
| TN (mg/L) | 379.50 | 544.15 (43.39%) | 619.35 (63.20%) | 799.65 (110.71%) |
| TP (mg/L) | 12.05 | 22.10 (83.40%) | 21.83 (81.16%) | 33.70 (179.67%) |
| COD (mg/L) | 2462.75 | 1899.38 (−22.88%) | 1963.00 (−20.29%) | 2726.25 (10.70%) |
Notes: The changes (%) in the parameters of the different pretreatment groups compared to the untreated group are indicated in brackets.
Disclaimer/Publisher’s Note: The statements, opinions and data contained in all publications are solely those of the individual author(s) and contributor(s) and not of MDPI and/or the editor(s). MDPI and/or the editor(s) disclaim responsibility for any injury to people or property resulting from any ideas, methods, instructions or products referred to in the content. |
© 2023 by the authors. Licensee MDPI, Basel, Switzerland. This article is an open access article distributed under the terms and conditions of the Creative Commons Attribution (CC BY) license (https://creativecommons.org/licenses/by/4.0/).
Share and Cite
MDPI and ACS Style
Wang, X.; Hong, Y.; Liu, X. The Effect of Different Sludge Pretreatment Methods on Microalgae Performance and the Release of Pollutants in Hydrolysis Acidification Solutions. Water 2023, 15, 2873. https://doi.org/10.3390/w15162873
AMA Style
Wang X, Hong Y, Liu X. The Effect of Different Sludge Pretreatment Methods on Microalgae Performance and the Release of Pollutants in Hydrolysis Acidification Solutions. Water. 2023; 15(16):2873. https://doi.org/10.3390/w15162873
Chicago/Turabian StyleWang, Xiaoyan, Yu Hong, and Xiaoya Liu. 2023. "The Effect of Different Sludge Pretreatment Methods on Microalgae Performance and the Release of Pollutants in Hydrolysis Acidification Solutions" Water 15, no. 16: 2873. https://doi.org/10.3390/w15162873
Note that from the first issue of 2016, this journal uses article numbers instead of page numbers. See further details here.