


Risk Assessment and Control of Geological Hazards in Towns of Complex Mountainous Areas Based on Remote Sensing and Geological Survey
 ,
,
Abstract
:1. Introduction
2. Materials and Methods
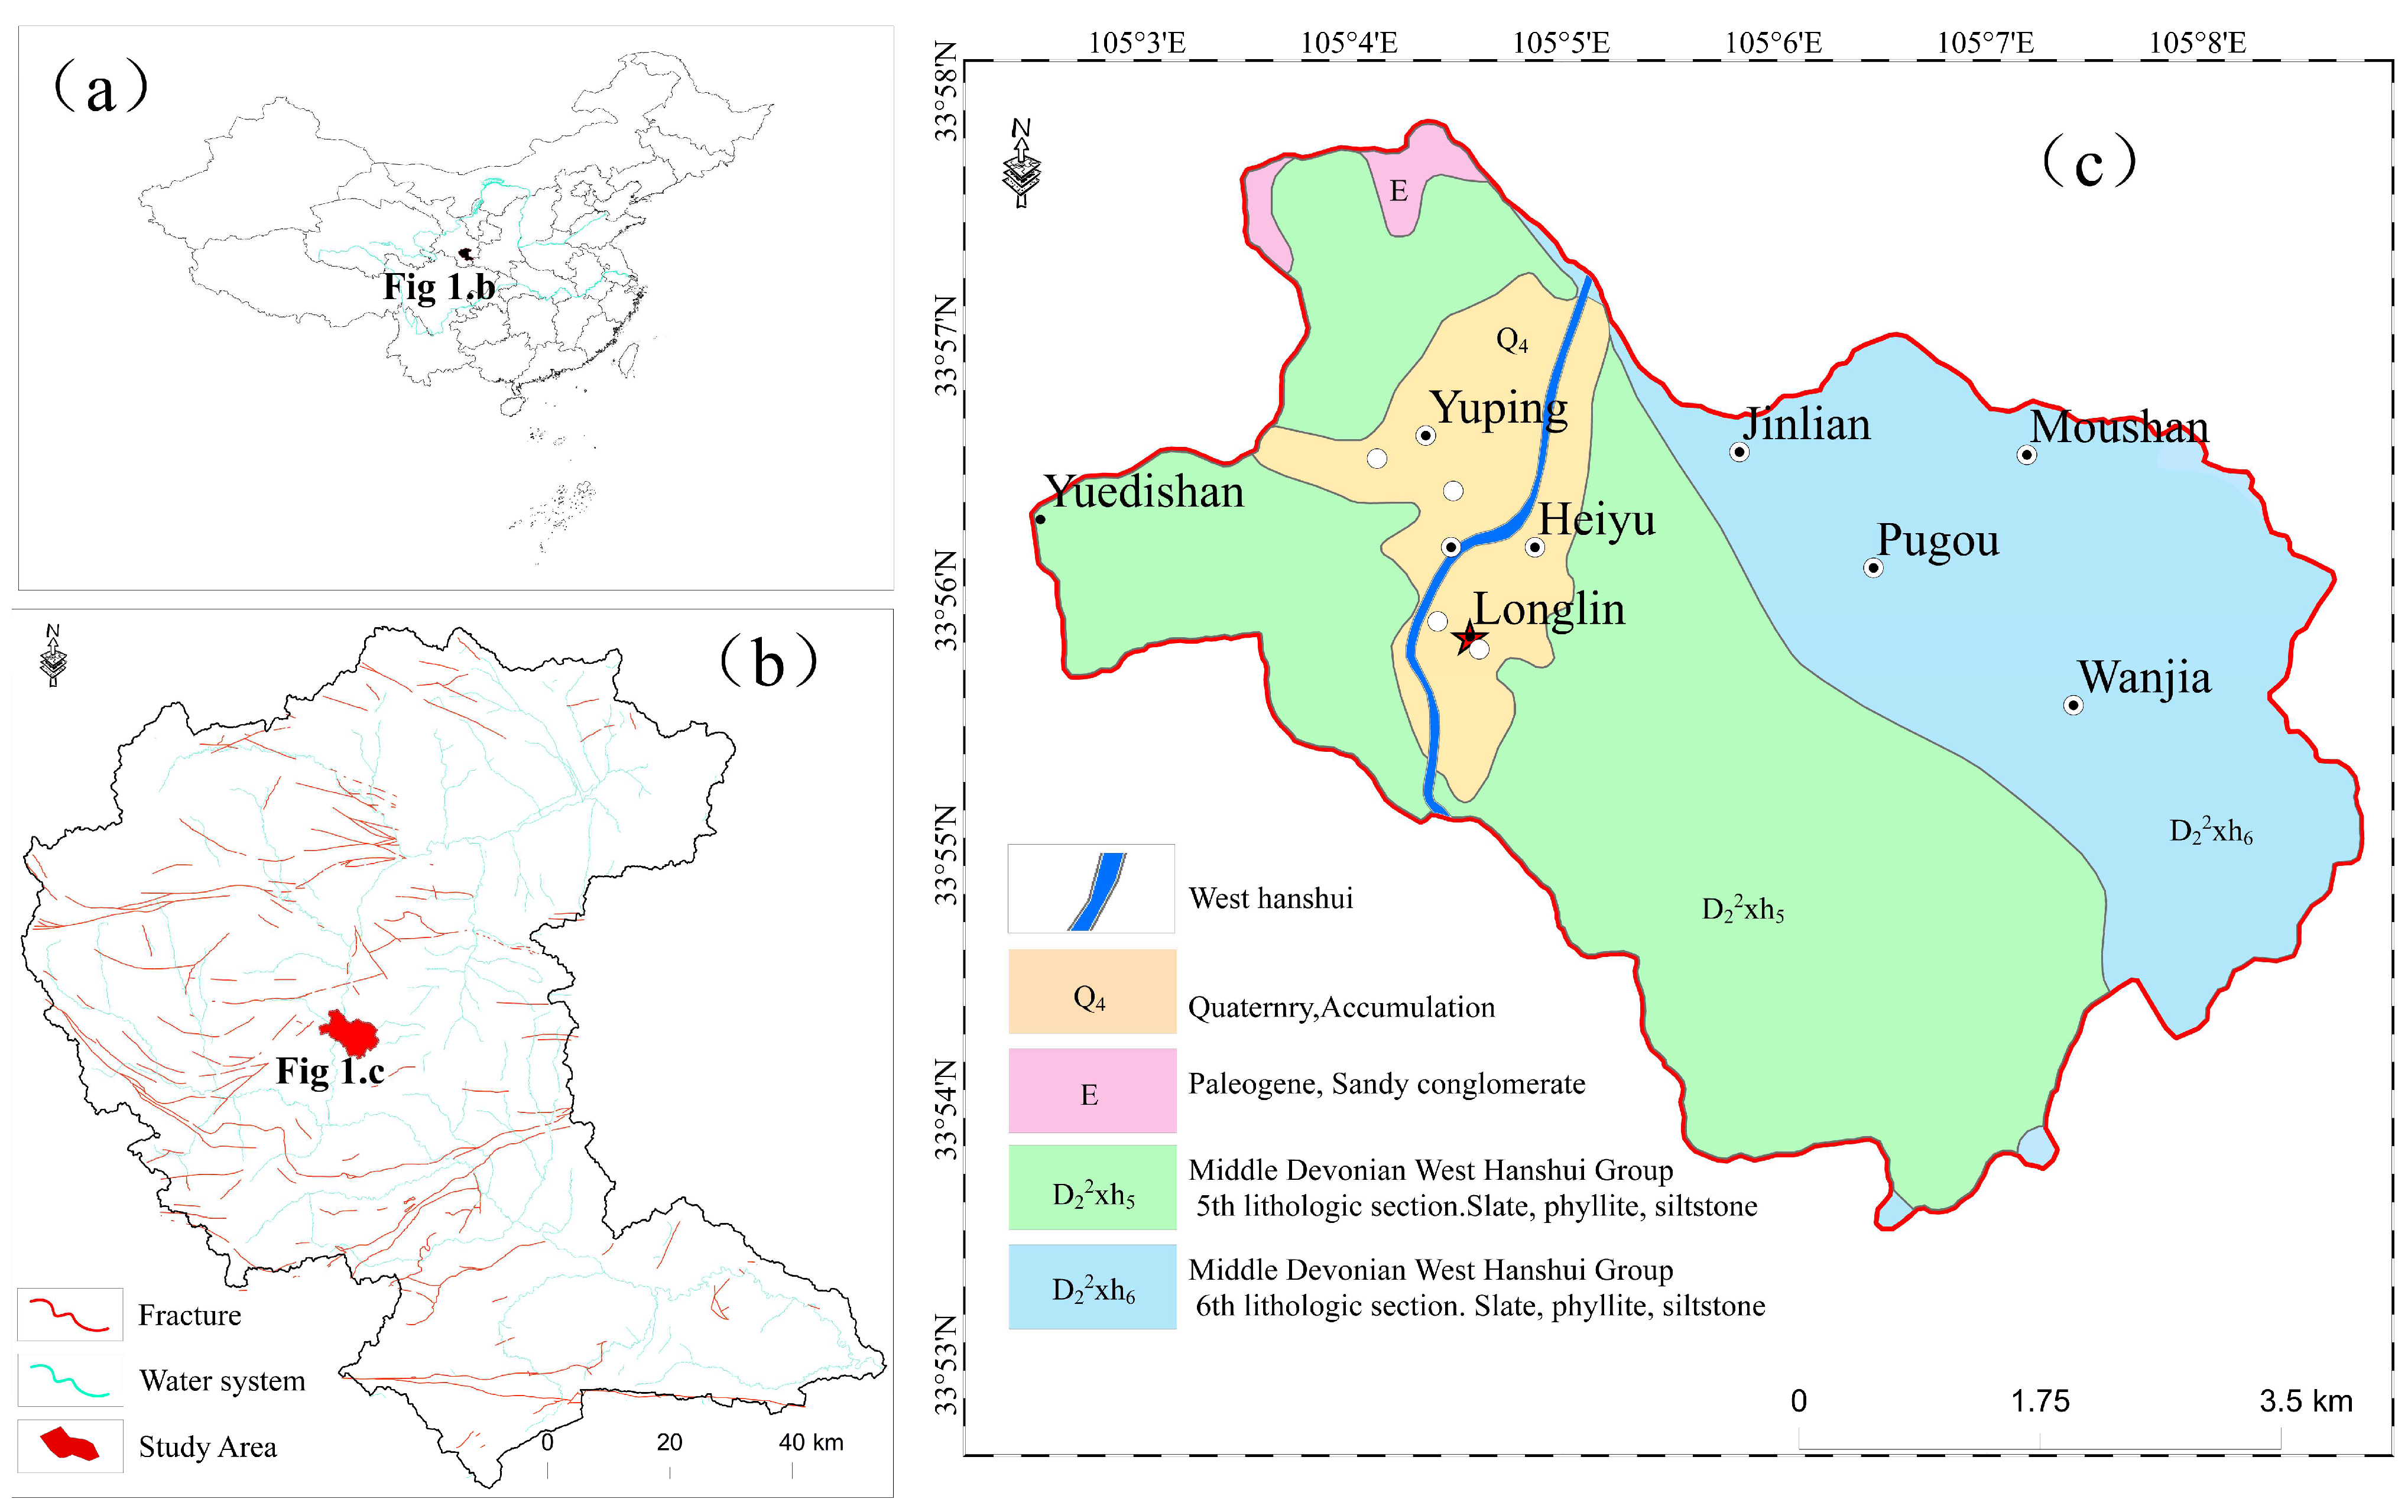
2.1. Overview of the Geological Environment of the Study Area
2.2. Study Data Sources
3. Methodology
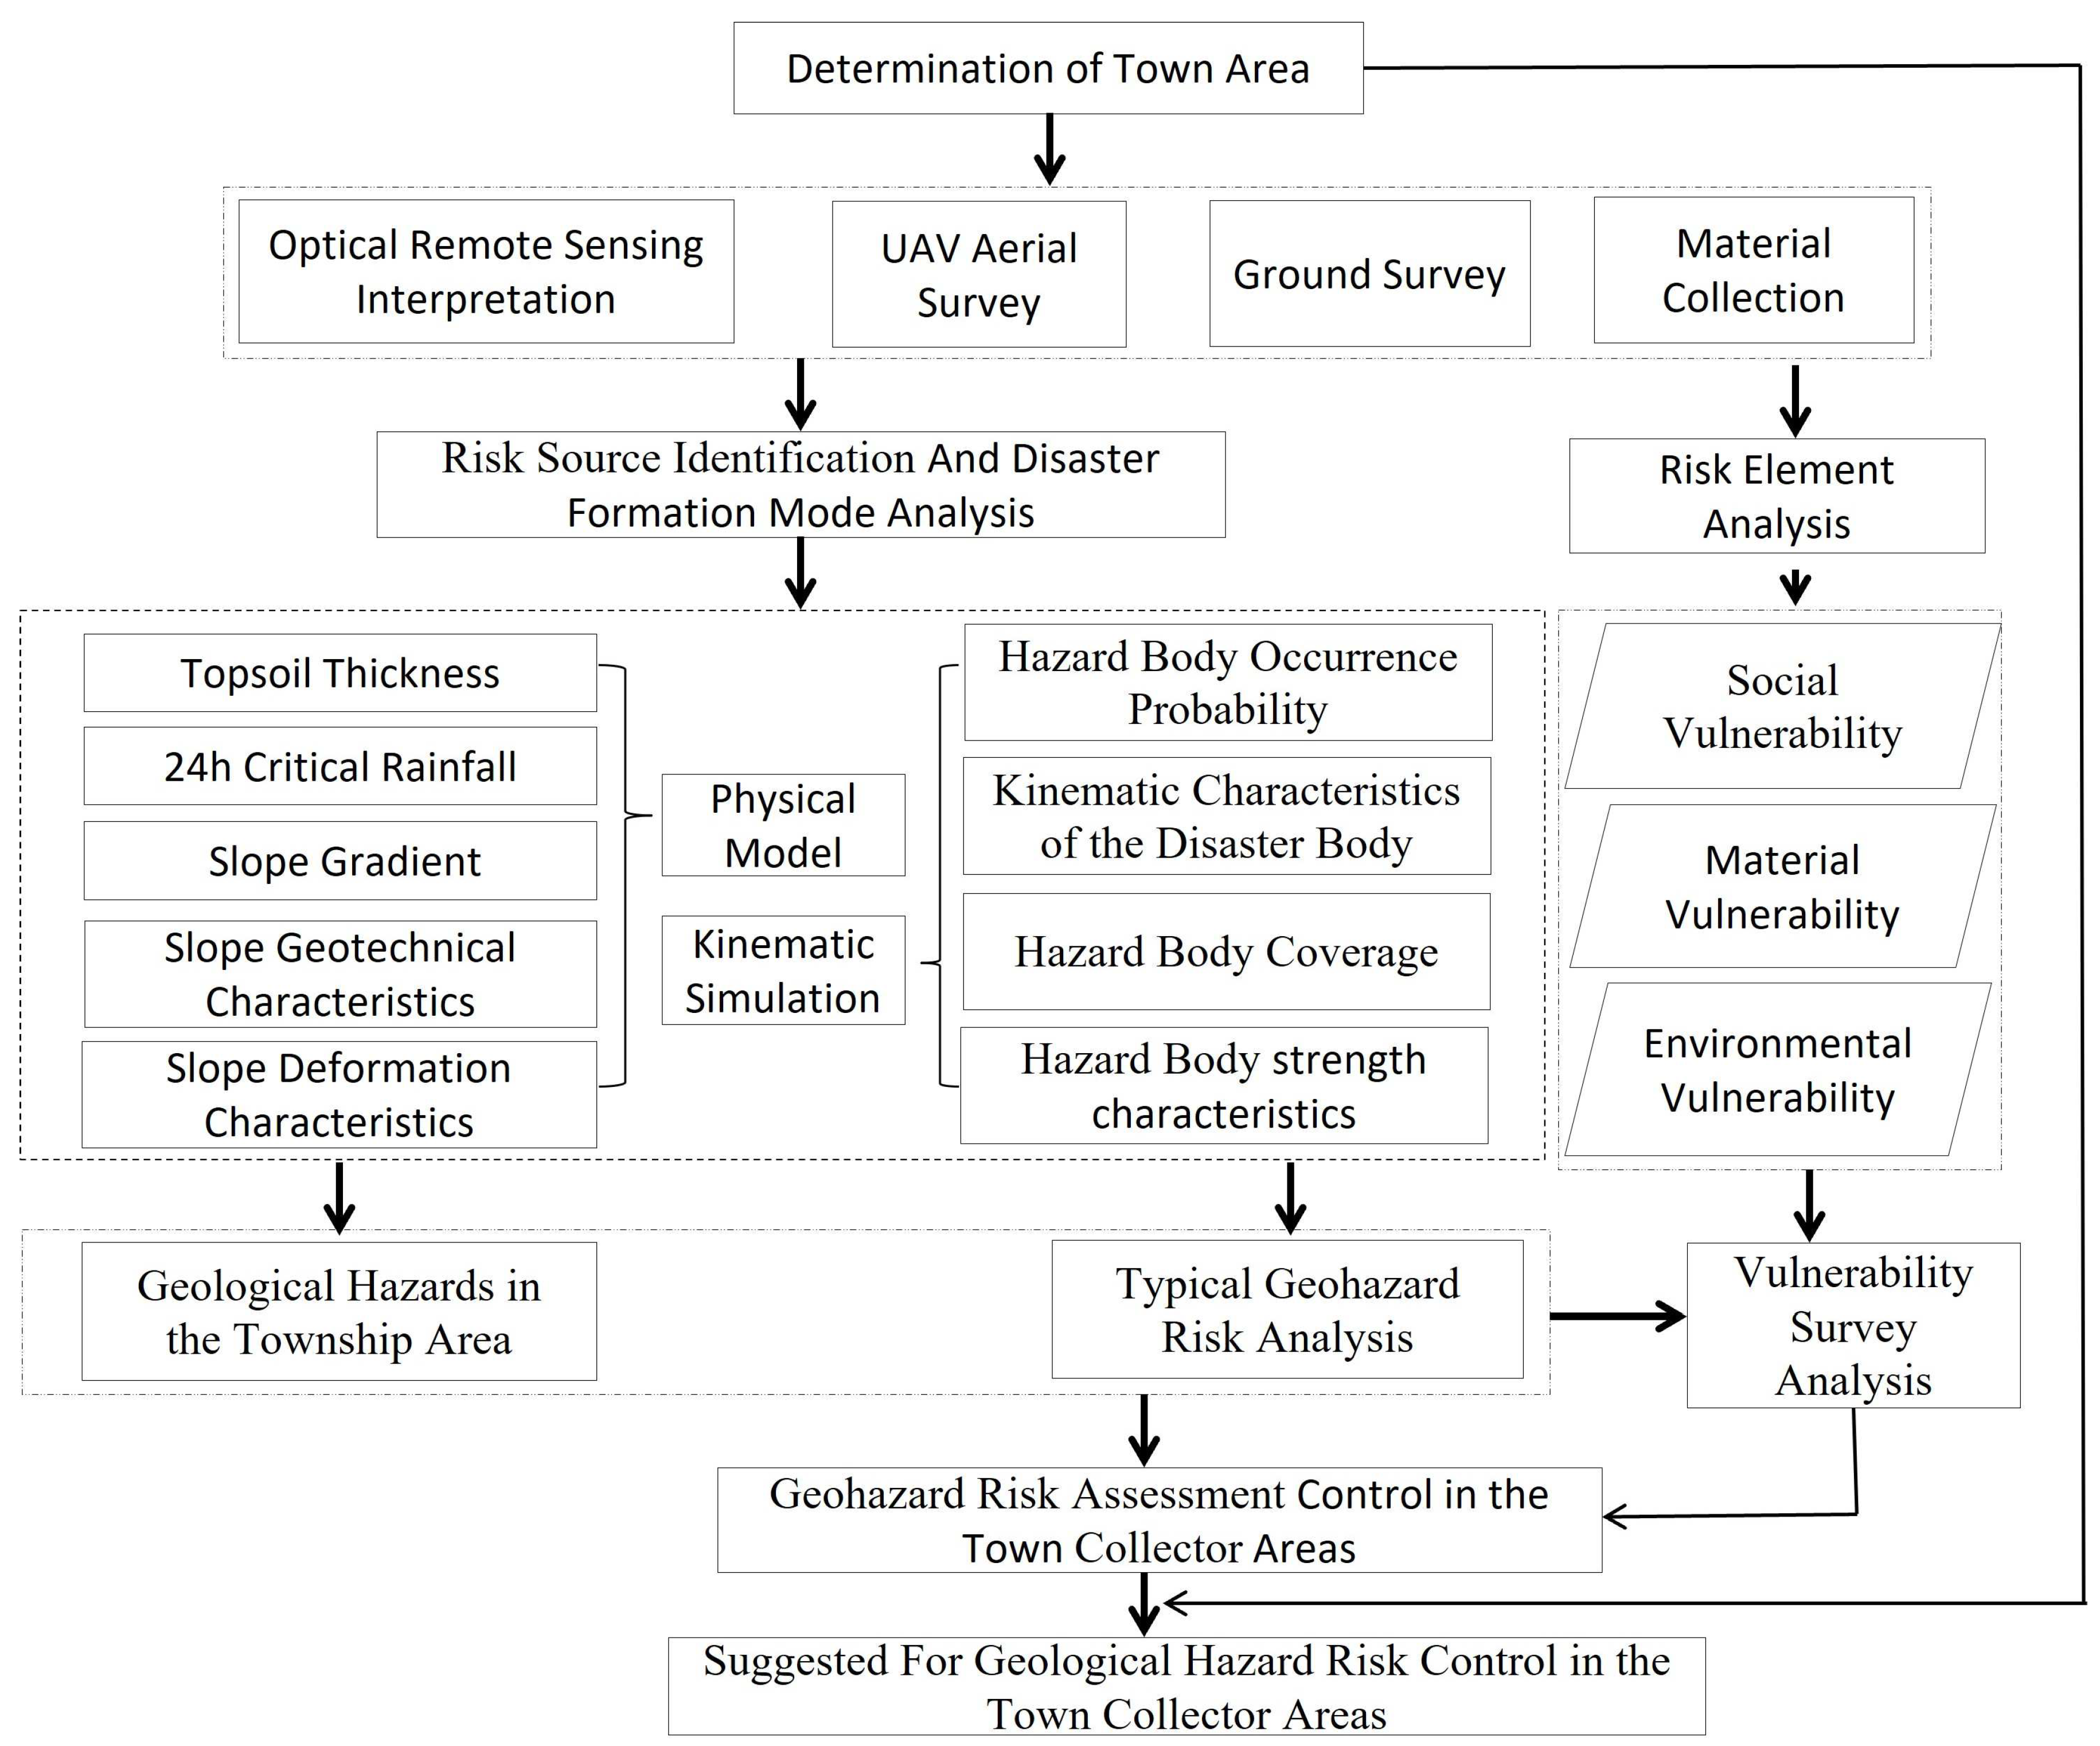
3.1. Town Risk Assessment Process
- Geological hazard risk identification.
- Research on the formation mode of geological hazards.
- Geohazard Risk Analysis.
- Vulnerability assessment of potential disaster-bearing bodies.
- Geological hazard risk assessment in the township area.
- Recommend countermeasures for risk control.
3.2. Geohazard Risk Identification and the Disaster Generation Model
3.3. Town Risk Assessment Methods and Models
3.3.1. The Slope Stability Evaluation Model
3.3.2. The FLO-2D Fluid Model
3.3.3. The River-Flow 2D Rheological Model
4. Model Validation and Results
4.1. Model Validation
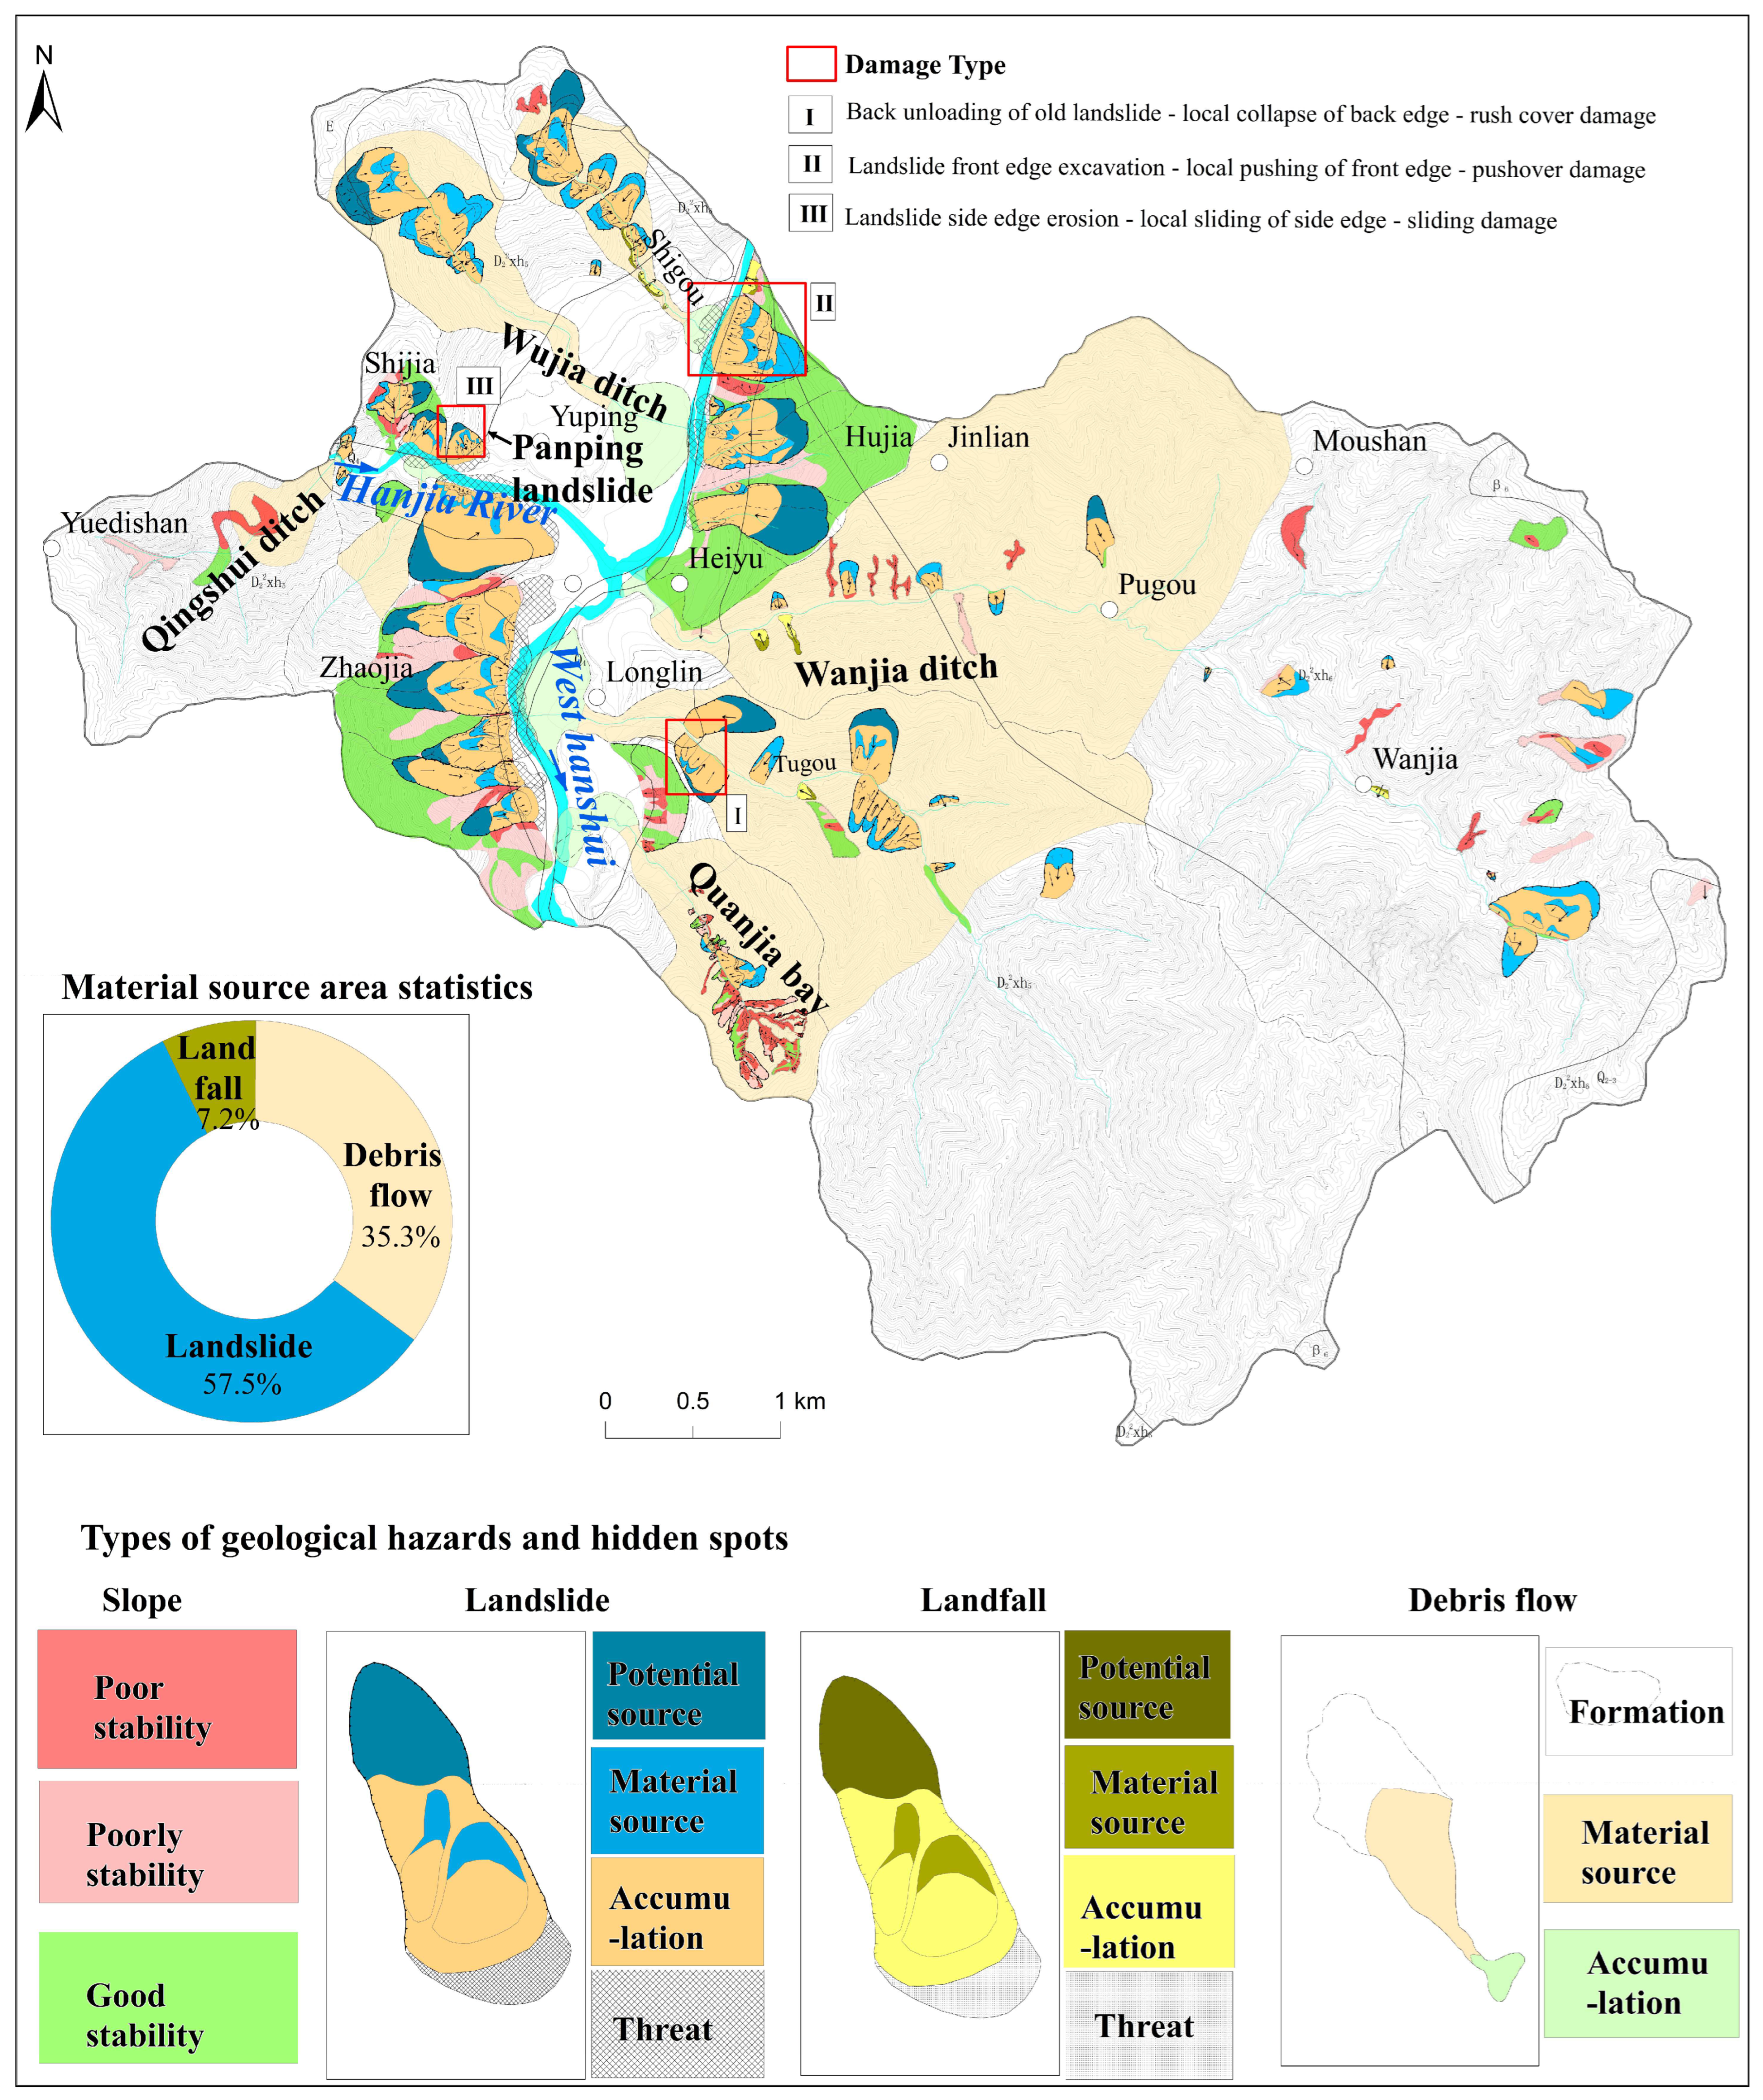
4.1.1. Town Slope Hazard Analysis
4.1.2. Typical Evaluation Demonstration
4.1.3. Typical Landslide Evaluation Demonstration
4.2. Results
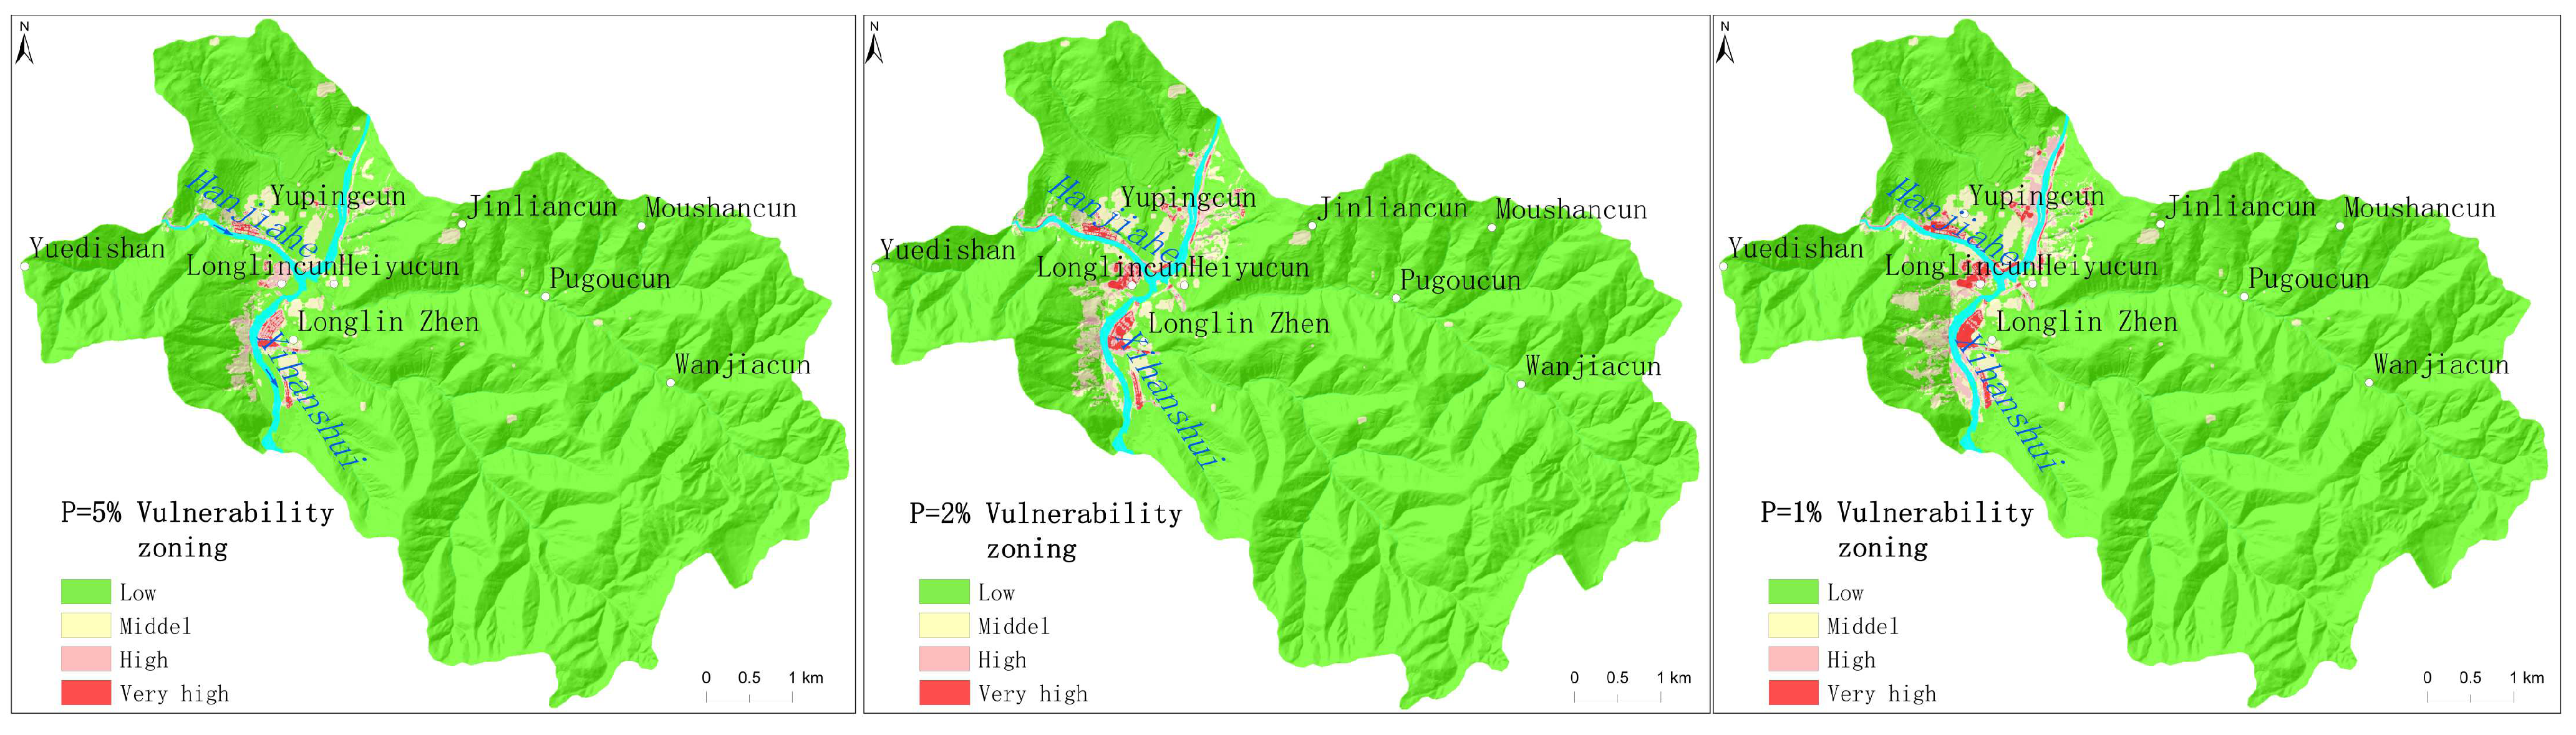
4.2.1. Assessment of the Vulnerability of Towns to Geological Hazards
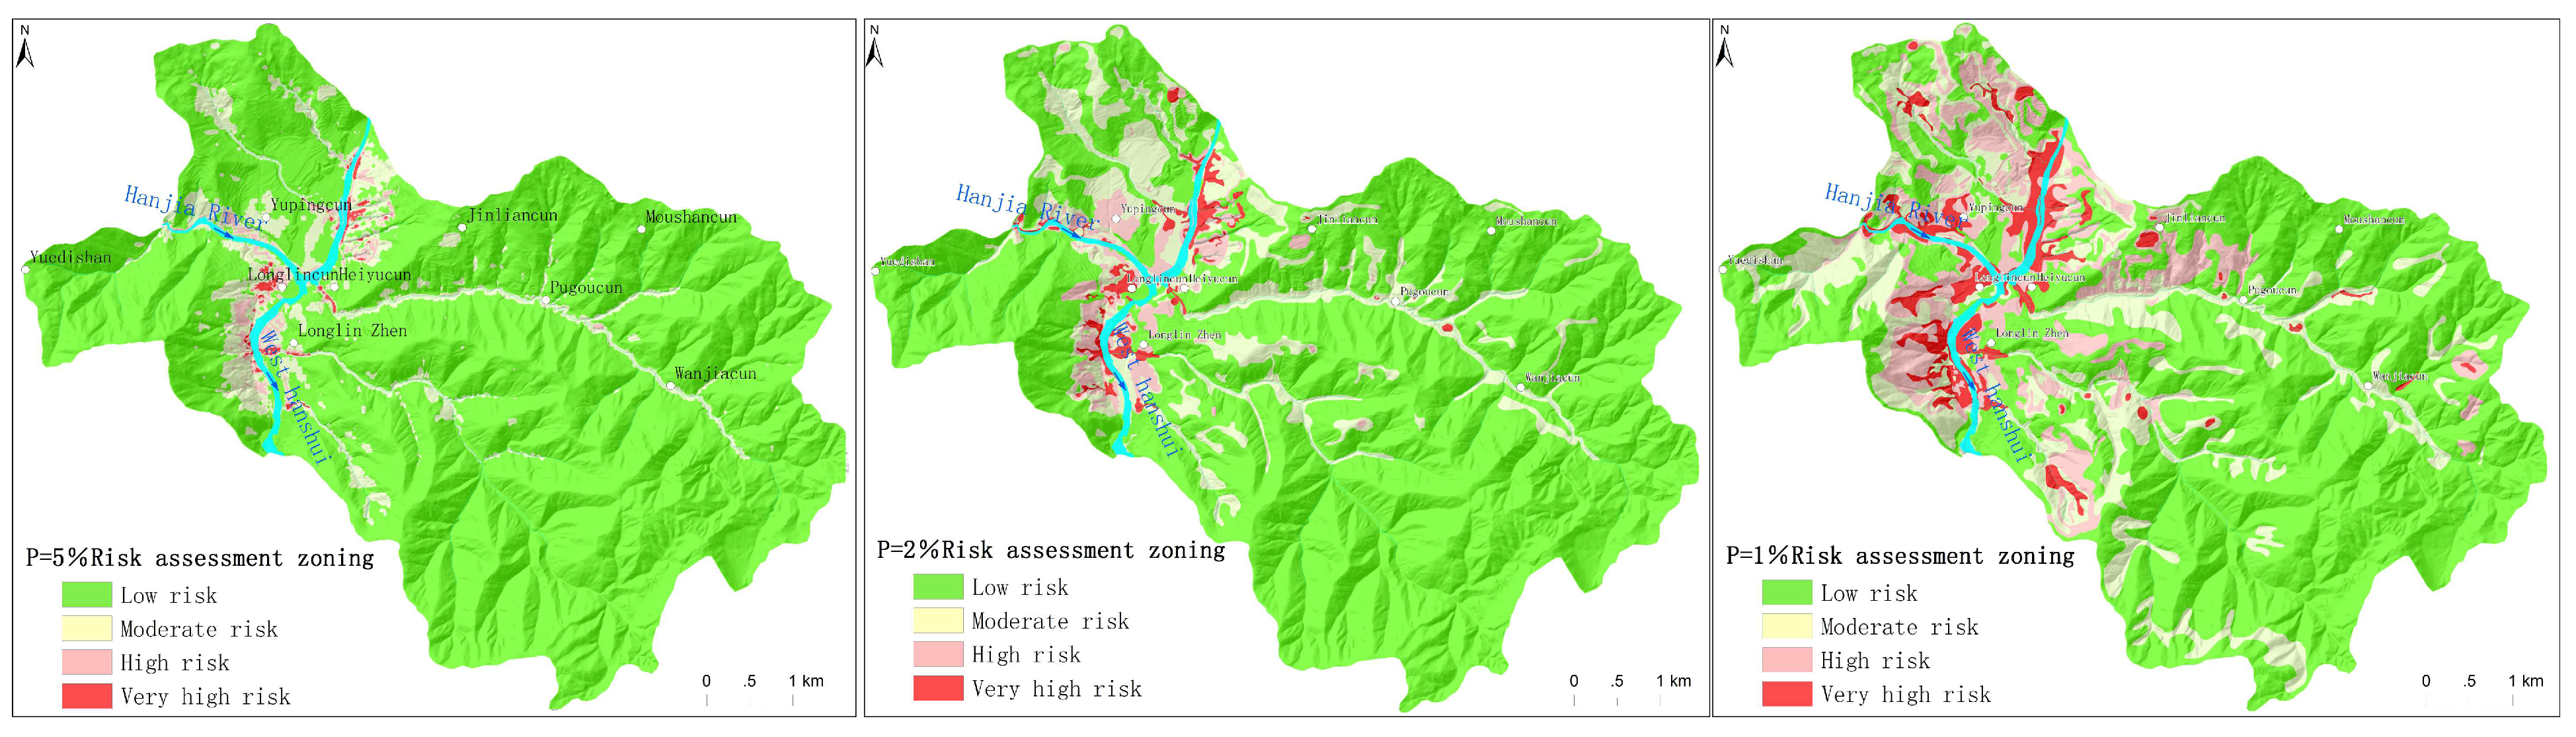
4.2.2. Risk Assessment of Urban Geological Hazards
5. Discussion
5.1. Disaster-Forming Pattern Identification Markers
5.2. Development and Evolution of Disasters under Different Rainfall Scenarios
5.3. Suggestions for Geological Hazard Risk Control
6. Conclusions
Author Contributions
Funding
Data Availability Statement
Acknowledgments
Conflicts of Interest
References
- Alam, E.; Ray-Bennett, N.S. Disaster risk governance for district-level landslide risk management in Bangladesh. Int. J. Disaster Risk Reduct. 2021, 59, 102220. [Google Scholar] [CrossRef]
- Damalas, A.; Mettas, C.; Evagorou, E.; Giannecchini, S.; Iasio, C.; Papadopoulos, M.; Konstantinou, A.; Hadjimitsis, D. Development and Implementation of a DECATASTROPHIZE platform and tool for the management of disasters or multiple hazards. Int. J. Disaster Risk Reduct. 2018, 31, 589–601. [Google Scholar] [CrossRef]
- Jaiswal, P.; Westen, C.; Jetten, V. Quantitative landslide hazard assessment along a transportation corridor in southern India. Eng. Geol. 2010, 116, 236–250. [Google Scholar] [CrossRef]
- Shi, J.S.; Zhang, Y.S.; Dong, C.; Wu, S.R. GIS-based landslides hazard zonation of the New Badong County site. Acta Geosci. Sin. 2005, 26, 275–282. [Google Scholar]
- Tang, Y.M.; Zhang, M.S.; Li, L.; Xue, Q. Discrimination to the landslide susceptibility, hazard and risk assessmennt. Hydrogeol. Eng. Geol. 2011, 38, 125–129. [Google Scholar]
- Wu, S.R.; Shi, J.S.; Zhang, C.S.; Wang, T. Preliminary discussion on technical guideline for geohazard risk assessment. Geol. Bull. China 2009, 28, 995–1005. [Google Scholar]
- Xu, Q.; Zhang, Y.F.; Chen, W. Vulnerability assessment of geohazards in south-west mountainous area Danba County, Sichuan, China as an example. Geol. Bull. China 2010, 29, 729–738. [Google Scholar]
- Zhang, C.S.; He, S.J.; Xin, P.; Sun, W.F.; Tan, C.X.; Wu, S.R.; Wang, T.; Liu, X. Risk evaluation of geological hazard in Weibin District, Bao Ji City, Shanxi Province, China. Geol. Bull. China 2009, 28, 1054–1063. [Google Scholar]
- Guo, F.Y.; Meng, X.M.; Zhang, Y.J.; Li, S.; Xie, Z.T.; Xiong, M.Q.; Guo, P. Geological disaster risk assessment methods for mountainous cities and towns in Gansu Province. J. Lanzhou Univ. Nat. Sci. 2014, 50, 604–610. [Google Scholar]
- Cui, P.; Zou, Q. Theory and method of risk assessment and risk management of debris flows and flash floods. Prog. Geogr. 2016, 35, 137–147. [Google Scholar]
- Zhang, M.S.; Xue, Q.; Jia, J.; Xu, J.W.; Gao, B.; Wang, J.Y. Methods and practices for the investigation and risk assessmengt of Geo-hazards in mountainous towns. Northwestern Geol. 2019, 52, 125–135. [Google Scholar]
- Wang, G.F.; Ye, Z.N.; Li, G.; Tian, Y.T.; Chen, Z.L.; Deng, B. Geological hazard risk assessment of Zhouqu county in Bailong river basin. J. Catastrophol. 2019, 34, 128–133. [Google Scholar]
- Zhou, C.; Chang, M.; Xu, L.; Che, H.X. Risk assessment of typical urban mine geological disasters in Guizhou province. Geomat. Inf. Sci. Wuhan Univ. 2020, 45, 1782–1791. [Google Scholar]
- Huang, B.L.; Yin, Y.P.; Li, B.; Feng, W.L.; Qin, Z.; Zhang, P. Study of risk assessment and mitigation for landslide-induced impulse wave near towns in reservoir areas. Acta Geol. Sin. 2021, 95, 1949–1961. [Google Scholar]
- Xiao, L.; Zhang, Y.; Peng, G. Landslide Susceptibility Assessment Using Integrated Deep Learning Algorithm along the China-Nepal Highway. Sensors 2018, 18, 4436. [Google Scholar] [CrossRef]
- Su, H.P.; Su, S.; Ma, J.Z.; Liu, D.F.; Zhang, P. Risk assessment of single debris flow gully in south Gansu province, China. Mt. Res. 2016, 34, 337–345. [Google Scholar]
- Du, J.; Yin, K.L.; Wang, H.H. Simulation of three-dimensional movement of landslide-debris flow based on finite volume method. Chin. J. Rock Mech. Eng. 2015, 34, 480–488. [Google Scholar]
- Wang, G.F.; Yang, Q.; Chen, Z.L.; Mao, J.R. Risk assessment of debris flow in the Ganjia gully of the Bailongjiang basin. J. Sediment. Res. 2020, 45, 66–73. [Google Scholar]
- Cascini, L. Applicability of landslide susceptibility and hazard zoning at different scales. Eng. Geol. 2008, 102, 164–177. [Google Scholar] [CrossRef]
- Chen, W.; Pourghasemi, H.; Zhao, Z. A GIS-based comparative study of Dempster-Shafer, logistic regression, and artificial neural network models for landslide susceptibility mapping. Geocarto Int. 2016, 32, 367–385. [Google Scholar] [CrossRef]
- van Westen, C.J.; Castellanos, E.; Kuriakose, S.L. Spatial data for landslide susceptibility, hazard, and vulnerability assessment: An overview. Eng. Geol. 2008, 102, 112–131. [Google Scholar] [CrossRef]
- Cui, P.; Peng, J.; Shi, P.; Tang, H.; Ouyang, C.; Zou, Q.; Liu, L.; Li, C.; Lei, Y. Scientific challenges of research on natural hazards and disaster risk. Geogr. Sustain. 2021, 2, 216–223. [Google Scholar] [CrossRef]
- Ma, Z.; Mei, G. Deep learning for geological hazards analysis: Data, models, applications, and opportunities. Earth-Sci. Rev. 2021, 223, 103858. [Google Scholar] [CrossRef]
- Ren, F.; Chen, W.; Han, W. Study on reason and spatial-temporal distribution characteristics of debris flow in Longnan area along G212. Chin. J. Rock Mech. Eng. 2008, 27, 3237–3243. [Google Scholar]
- Chen, C.; Ren, J.; Meng, G.; Yang, P.; Zhang, J.; Su, X. Analysis of modern activity of major faults in northeast margin of Baryan-Har Block. J. Geod. Geodyn. 2012, 3, 27–30. [Google Scholar]
- Yang, X.; Feng, X.; Huang, X.; Song, F.; Li, G.; Chen, X.; Zhang, L.; Huang, W. The Late Quaternary activity characteristics of the Lixian—Luojiabu fault: A discussion on the seismogenic mechanism of the Lixian M8 earthquake in 1654. Chin. J. Geophys. 2015, 58, 504–519. [Google Scholar]
- Han, Z.; Xaing, H.; Ran, Y. Activity analysis of Lixian-Luojiapu fault zone in the east boundary of Tibetan Plateau since the Late-Pleistocene. Seismol. Geol. 2001, 1, 43–48. [Google Scholar]
- Wei, R.; Zeng, Q.; Davies, T.; Yuan, G.; Wang, K.; Xue, X.; Yin, Q. Geohazard cascade and mechanism of large debris flows in Tianmo gully, SE Tibetan Plateau and implications to hazard monitoring. Eng. Geol. 2018, 233, 172–182. [Google Scholar] [CrossRef]
- Bayer, B.; Simoni, A.; Schmidt, D.; Bertello, L. Using advanced InSAR techniques to monitor landslide deformations induced by tunneling in the Northern Apennines, Italy. Eng. Geol. 2017, 226, 20–32. [Google Scholar] [CrossRef]
- Ciampalini, A.; Raspini, F.; Bianchini, S.; Frodella, W.; Bardi, F.; Lagomarsino, D.; Di Traglia, F.; Moretti, S.; Proietti, C.; Pagliara, P.; et al. Remote sensing as tool for development of landslide databases: The case of the Messina Province (Italy) geodatabase. Geomorphology 2015, 249, 103–118. [Google Scholar] [CrossRef]
- Sun, Q.; Zhang, L.; Ding, X.L.; Hu, J.; Li, Z.W.; Zhu, J.J. Slope deformation prior to Zhouqu, China landslide from InSAR time series analysis. Remote Sens. Environ. 2015, 156, 45–57. [Google Scholar] [CrossRef]
- Xu, C.; Xu, X. Comment on “Spatial distribution analysis of landslides triggered by 2008.5.12 Wenchuan Earthquake, China” by Shengwen Qi, Qiang Xu, Hengxing Lan, Bing Zhang, Jianyou Liu [Engineering Geology 116 (2010) 95–108]. Eng. Geol. 2012, 133–134, 40–42. [Google Scholar] [CrossRef]
- Zhao, C.; Liu, C.; Zhang, Q.; Lu, Z.; Yang, C. Deformation of Linfen-Yuncheng Basin (China) and its mechanisms revealed by Π-RATE InSAR technique. Remote Sens. Environ. 2018, 218, 221–230. [Google Scholar] [CrossRef]
- Tsunetaka, H.; Hotta, N.; Imaizumi, F.; Hayakawa, Y.S.; Masui, T. Variation in rainfall patterns triggering debris flow in the initiation zone of the Ichino-sawa torrent, Ohya landslide, Japan. Geomorphology 2021, 375, 107529. [Google Scholar] [CrossRef]
- Ba, R.; Deng, Q.; Liu, Y.; Yang, R.; Zhang, H. Multi-hazard disaster scenario method and emergency management for urban resilience by integrating experiment–simulation–field data. J. Saf. Sci. Resil. 2021, 2, 77–89. [Google Scholar] [CrossRef]
- Huang, Y.; Dai, Z. Large deformation and failure simulations for geo-disasters using smoothed particle hydrodynamics method. Eng. Geol. 2014, 168, 86–97. [Google Scholar] [CrossRef]
- Małkowski, P.; Niedbalski, Z. A comprehensive geomechanical method for the assessment of rockburst hazards in underground mining. Int. J. Min. Sci. Technol. 2020, 30, 345–355. [Google Scholar] [CrossRef]
- Mohammadi, S.; Taiebat, H. Finite element simulation of an Excavation-triggered landslide Using large deformation theory. Eng. Geol. 2016, 205, 67–72. [Google Scholar] [CrossRef]
- Pistolesi, M.; Cioni, R.; Rosi, M.; Aguilera, E. Lahar hazard assessment in the southern drainage system of Cotopaxi volcano, Ecuador: Results from multiscale lahar simulations. Geomorphology 2014, 207, 51–63. [Google Scholar] [CrossRef]
- Prieto, J.A.; Journeay, M.; Acevedo, A.B.; Arbelaez, J.D.; Ulmi, M. Development of structural debris flow fragility curves (debris flow buildings resistance) using momentum flux rate as a hazard parameter. Eng. Geol. 2018, 239, 144–157. [Google Scholar] [CrossRef]
- Caviedes-Voullième, D.; García-Navarro, P.; Murillo, J. Influence of mesh structure on 2D full shallow water equations and SCS Curve Number simulation of rainfall/runoff events. J. Hydrol. 2012, 448–449, 39–59. [Google Scholar] [CrossRef]
- Naef, D.; Rickenmann, D.; Rutschmann, P.; McArdell, B.W. Comparison of flow resistance relations for debris flows using a one-dimensional finite element simulation model. Nat. Hazards Earth Syst. Sci. 2006, 6, 155–165. [Google Scholar] [CrossRef]
- Siviglia, A.; Stecca, G.; Vanzo, D.; Zolezzi, G.; Toro, E.F.; Tubino, M. Numerical modelling of two-dimensional morphodynamics with applications to river bars and bifurcations. Adv. Water Resour. 2013, 52, 243–260. [Google Scholar] [CrossRef]
- Septian, A.; Llano-Serna, M.A.; Ruest, M.R.; Williams, D.J. Three-dimensional Kinematic Analysis of Bingham Canyon Mine Pit Wall Slides. Procedia Eng. 2017, 175, 86–93. [Google Scholar] [CrossRef]
- Kumar, V.; Gupta, V.; Jamir, I.; Chattoraj, S.L. Evaluation of potential landslide damming: Case study of Urni landslide, Kinnaur, Satluj valley, India. Geosci. Front. 2019, 10, 753–767. [Google Scholar] [CrossRef]
- Salvatici, T.; Di Roberto, A.; Di Traglia, F.; Bisson, M.; Morelli, S.; Fidolini, F.; Bertagnini, A.; Pompilio, M.; Hungr, O.; Casagli, N. From hot rocks to glowing avalanches: Numerical modelling of gravity-induced pyroclastic density currents and hazard maps at the Stromboli volcano (Italy). Geomorphology 2016, 273, 93–106. [Google Scholar] [CrossRef]
- Zhang, W.; Ji, J.; Gao, Y.; Li, X.; Zhang, C. Spatial variability effect of internal friction angle on the post-failure behavior of landslides using a random and non-Newtonian fluid based SPH method. Geosci. Front. 2020, 11, 1107–1121. [Google Scholar] [CrossRef]
- Chigira, M.; Duan, F.; Yagi, H.; Furuya, T. Using an airborne laser scanner for the identification of shallow landslides and susceptibility assessment in an area of ignimbrite overlain by permeable pyroclastics. Landslides 2004, 1, 203–209. [Google Scholar] [CrossRef]
- Ciampalini, A.; Raspini, F.; Frodella, W.; Bardi, F.; Bianchini, S.; Moretti, S. The effectiveness of high-resolution LiDAR data combined with PSInSAR data in landslide study. Landslides 2015, 13, 399–410. [Google Scholar] [CrossRef]
- Horton, P.; Jaboyedoff, M.; Rudaz, B.; Zimmermann, M. Flow-R, a model for susceptibility mapping of debris flows and other gravitational hazards at a regional scale. Nat. Hazards Earth Syst. Sci. 2013, 13, 869–885. [Google Scholar] [CrossRef]
- Miao, S.; Zhu, Q.; Zhang, B.; Ding, Y.; Zhang, J.; Zhu, J.; Zhou, Y.; He, H.; Yang, W.; Chen, L. Knowledge-guided consistent correlation analysis of multimode landslide monitoring data. Int. J. Geogr. Inf. Sci. 2017, 31, 2255–2271. [Google Scholar] [CrossRef]
- Bui, D.T.; Tuan, T.A.; Klempe, H.; Pradhan, B.; Revhaug, I. Spatial prediction models for shallow landslide hazards: A comparative assessment of the efficacy of support vector machines, artificial neural networks, kernel logistic regression, and logistic model tree. Landslides 2015, 13, 361–378. [Google Scholar]
- Gorum, T. Landslide recognition and mapping in a mixed forest environment from airborne LiDAR data. Eng. Geol. 2019, 258, 105155. [Google Scholar] [CrossRef]
- Lan, H.; Martin, D.; Zhou, C.; Lim, C. Rockfall hazard analysis using LiDAR and spatial modeling. Geomorphology 2010, 118, 213–223. [Google Scholar] [CrossRef]
- Kromer, R.A.; Hutchinson, D.J.; Lato, M.J.; Gauthier, D.; Edwards, T. Identifying rock slope failure precursors using LiDAR for transportation corridor hazard management. Eng. Geol. 2015, 195, 93–103. [Google Scholar] [CrossRef]
- Skempton, A.W.; Delory, F.A. Stability of natural slopes in London clay. In Selected Papers on Soil Mechanics; Thomas Telford Publishing: London, UK, 1984; pp. 70–73. [Google Scholar]
- Wang, G.F.; Chen, Z.L.; Mao, J.R.; Tian, Y.T.; Gao, Y.L.; Deng, B. Debris flow risk assessment in Bailong river basin under different engineering scenarios and rainfall frequency conditions. J. Shandong Univ. Sci. Technol. Nat. Sci. 2020, 39, 30–40. [Google Scholar]
- Erena, S.H.; Worku, H.; De Paola, F. Flood hazard mapping using FLO-2D and local management strategies of Dire Dawa city, Ethiopia. J. Hydrol. Reg. Stud. 2018, 19, 224–239. [Google Scholar] [CrossRef]
- Fang, Q.; Tang, C.; Chen, Z.; Wang, S.; Yang, T. A calculation method for predicting the runout volume of dam-break and non-dam-break debris flows in the Wenchuan earthquake area. Geomorphology 2019, 327, 201–214. [Google Scholar] [CrossRef]
- Caccavale, M.; Matano, F.; Sacchi, M. An integrated approach to earthquake-induced landslide hazard zoning based on probabilistic seismic scenario for Phlegrean Islands (Ischia, Procida and Vivara), Italy. Geomorphology 2017, 295, 235–259. [Google Scholar] [CrossRef]
- Harp, E.L.; Keefer, D.K.; Sato, H.P.; Yagi, H. Landslide inventories: The essential part of seismic landslide hazard analyses. Eng. Geol. 2011, 122, 9–21. [Google Scholar] [CrossRef]
- Neaupane, K.; Piantanakulchai, M. Analytic network process model for landslide hazard zonation. Eng. Geol. 2006, 85, 281–294. [Google Scholar] [CrossRef]
- Van Den Eeckhaut, M.; Hervás, J. State of the art of national landslide databases in Europe and their potential for assessing landslide susceptibility, hazard and risk. Geomorphology 2012, 139–140, 545–558. [Google Scholar] [CrossRef]
- Qiao, J.P.; Yang, Z.J. The K-P method based failure probability calculation on landslides. Chin. J. Geol. Hazard Control 2013, 24, 1–5. [Google Scholar]
- Chen, L.X.; van Westen, C.J.; Haydar, H.; Roxana, L.C.; Thea, T.; Diana, C.R.; Dhruba, P.S. Integrating expert opinion with modelling for quantitative multi-hazard risk assessment in the Eastern Italian Alps. Geomorphology 2016, 273, 150–167. [Google Scholar] [CrossRef]
- Martha, T.R.; van Westen, C.J.; Kerle, N.; Jetten, V.; Kumar, K.V. Landslide hazard and risk assessment using semi-automatically created landslide inventories. Geomorphology 2013, 184, 139–150. [Google Scholar] [CrossRef]
- Rabiya, M. Review of National Multi-Hazard Early Warning System Plan of Pakistan in context with Sendai Framework for Disaster Risk Reduction. Procedia Eng. 2018, 212, 206–213. [Google Scholar]


| Basic Data | Data Source and Production | Data Format |
|---|---|---|
| Geohazard data | From the Longnan West Hanshui Basin Disaster Geological Survey (2019–2021) project database | 1:10,000 precision vector data |
| DEM | Geospatial data to extract slope, gully density, debris flow gully bed ratio drop, etc. | 5 m × 5 m raster data |
| DOM/DLG | Land use type data | 5 m × 5 m raster/vector data |
| Remote Sensing Data | Interpretation for risk source identification, carrier types, etc. | P-star and UAV data, raster data |
| Rainfall information | Lanzhou Central Weather Station, Longnan town geohazard Professional Monitoring Network | Vector data |
| Geological data | Lithological zoning, fracture structure | 1:200,000 regional geological map, vector data |
| Survey and test data | Physical and mechanical indicators such as geotechnical density/capacity, water content/permeability coefficient, and angle of internal friction, cohesion, etc., for model calculation and analysis | Text Data Format |
| Type | Initial State | Ageing Deformation Stage | Progressive Deformation Damage Stage | Post-Damage State | Description of Model Elements |
|---|---|---|---|---|---|
| Type I |  |  |  |  | 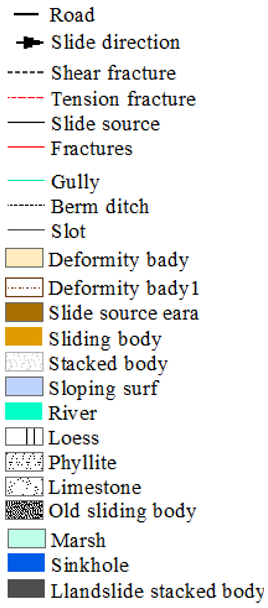 |
| Type II |  |  |  |  | |
| Type III |  |  |  |  |
| Grading | Landslide Stability Calculation Concerning Surface Macro Deformation | Landslide Development Rate Evaluation Reference | ||||
|---|---|---|---|---|---|---|
| Surface Macro Deformation Characteristics | Stable State | Reference Value of Stability Coefficient | Developmental Status | Landslide Development Characteristics | Fertility Reference Values | |
| Extremely high | Signs of overall landslide sliding can be clearly observed on the surface, and the slide body can be separated from the slide bed | Landslide initiation | <0.9 | Full developmental maturity | Landslide has been initiated and overall sliding is highly probable | 0.9~1 |
| High | Landslides can be initiated when there is localized damage to the ground surface, and overall sliding precursors appear | Unstable | 0.9~1.00 | Developmental maturity | Slippery slope can be started, the overall sliding possibility is high | 0.7~0.9 |
| Medium | Signs of surface deformation begin to intensify and the landslide progresses rapidly toward the initiation phase; or the surface shows significant local deformation, but the rate of deformation is slow | Critical state or less stable | 1.00~1.10 | Developmental immaturity or onset of development | Accelerated deformation of the landslide, with the possibility of overall sliding; or local deformation of the slope, with the possibility of forming a landslide | 0.3~0.7 |
| Low | There are only local signs of minor deformation on the surface, and there is no development trend for the time being, or no signs of deformation are observed on the surface for the time being | Basically, stable or stable | 1.10~1.20 | Not yet developed or not developed | The slope deformation range is very small and the possibility of landslide formation is minimal; or no landslide | <0.3 |
| Projects | Frequency of Rainstorms | Simulation Parameters | Value | ||
|---|---|---|---|---|---|
| P = 5% | P = 2% | P = 1% | |||
| Watershed area/(km2) | 1.26 | Calculation grid/(m) | 5 × 5 | ||
| Total material sources/(104 m3) | 242.38 | Manning roughness coefficient | 0.15/Residential district | ||
| Debris flow capacity/(t/m3) | 1.77 | 1.89 | 1.97 | 0.05/Road | |
| Debris flow peak/(m3/s) | 6.49 | 10.38 | 12.97 | 0.22/Cultivated land | |
| Sediment correction factor | 0.89 | 1.17 | 1.44 | 0.2/Bare ground | |
| Sediment blockage factor | 3.5 | 0.8/Woodland | |||
| Debris flow discharge/(m3/s) | 42.94 | 78.8 | 110.82 | laminar flow friction factor K | 2280 |
| Volumetric concentration | 0.47 | 0.54 | 0.59 | 0.811 | |
| Debris flow amplification factor | 1.89 | 2.17 | 2.44 | 0.00462 | |
| Simulation flow/(m3/s) | 81.21 | 170.93 | 270.45 | 13.72 | |
| Simulation time/(h) | 0.3 | 0.8 | 1.5 | 11.24 | |
| Simulation accuracy/(%) | 81.38 | 75.53 | 86.74 | Sediment specific gravity/(t/m3) | 2.65 |
| Projects | P = 5% | P = 2% | P = 1% |
|---|---|---|---|
| Internal friction angle θb/(°) | 14.4 | 12.96 | 11.6 |
| Slip density ρ/(kg/m3) | 20.2 | 23.23 | 25.05 |
| Volumetric concentration CV | 0.618 | 0.802 | 0.912 |
| Slip body yield stress τy/(MPa) | 0.886 | 1.422 | 1.886 |
| Slip viscous stress τμ/(MPa) | 0.141 | 0.212 | 0.270 |
Disclaimer/Publisher’s Note: The statements, opinions and data contained in all publications are solely those of the individual author(s) and contributor(s) and not of MDPI and/or the editor(s). MDPI and/or the editor(s) disclaim responsibility for any injury to people or property resulting from any ideas, methods, instructions or products referred to in the content. |
© 2023 by the authors. Licensee MDPI, Basel, Switzerland. This article is an open access article distributed under the terms and conditions of the Creative Commons Attribution (CC BY) license (https://creativecommons.org/licenses/by/4.0/).
Share and Cite
Ding, W.; Wang, G.; Yang, Q.; Xu, Y.; Gao, Y.; Chen, X.; Xu, S.; Han, L.; Yang, X. Risk Assessment and Control of Geological Hazards in Towns of Complex Mountainous Areas Based on Remote Sensing and Geological Survey. Water 2023, 15, 3170. https://doi.org/10.3390/w15183170
Ding W, Wang G, Yang Q, Xu Y, Gao Y, Chen X, Xu S, Han L, Yang X. Risk Assessment and Control of Geological Hazards in Towns of Complex Mountainous Areas Based on Remote Sensing and Geological Survey. Water. 2023; 15(18):3170. https://doi.org/10.3390/w15183170
Chicago/Turabian StyleDing, Weicui, Gaofeng Wang, Qiang Yang, Youning Xu, Youlong Gao, Xuanhua Chen, Shenglin Xu, Lele Han, and Xinru Yang. 2023. "Risk Assessment and Control of Geological Hazards in Towns of Complex Mountainous Areas Based on Remote Sensing and Geological Survey" Water 15, no. 18: 3170. https://doi.org/10.3390/w15183170