Article

Survey on Lombardy Region Wastewater Effluents and Application of Biochar from Biological Sewage Sludge for Wastewater Treatment

by
Maria Cristina Collivignarelli
1,2,
Francesca Maria Caccamo
1,*,
Stefano Bellazzi
1,*,
Maria Medina Llamas
3,4,
Sabrina Sorlini
5 and
Chiara Milanese
3
1
Department of Civil and Architectural Engineering, University of Pavia, Via Ferrata 3, 27100 Pavia, Italy
2
Interdepartmental Centre for Water Research, University of Pavia, Via Ferrata 3, 27100 Pavia, Italy
3
Pavia Hydrogen Lab, Department of Chemistry, University of Pavia & C.S.G.I., Viale Taramelli 16, 27100 Pavia, Italy
4
Unidad Académica Preparatoria, Plantel II, Universidad Autónoma de Zacatecas, Zacatecas 98068, Mexico
5
Department of Civil, Environmental, Architectural Engineering and Mathematics, University of Brescia, Via Branze 43, 25123 Brescia, Italy
*
Authors to whom correspondence should be addressed.
Water 2023, 15(20), 3636; https://doi.org/10.3390/w15203636
Submission received: 15 September 2023 / Revised: 12 October 2023 / Accepted: 14 October 2023 / Published: 17 October 2023
(This article belongs to the Special Issue Resource Recovery Monitoring and Circular Economy Model in Wastewater)

Abstract

:
Due to decreasing rainfall, drought is an environmental problem becoming even more alarming every year. The direct reuse of treated wastewater (WW), in compliance with current legislation, can be one of the applicable solutions to deal with water scarcity. In this study, an analysis of wastewater treatment plants (WWTPs) (>400 population equivalent) in the Lombardy region (Northern Italy) was performed to identify the most critical parameters in their effluents (total and ammonia nitrogen, and phosphorous). Biochar filters, as final adsorption means for WWTP effluents, could improve water quality for direct reuse. Biochar from biological sewage sludge produced by an urban WWTP (130,000 population equivalent) was prepared via pyrolysis (350–650–950 °C) and chemical activation with KOH. In each preparation step, the material was analyzed to follow the physicochemical transformations. The removal efficiency of COD, N-NH4+, N-NO3-, and P from real WW was studied using batch adsorption tests. Pyrolysis at 650 °C + KOH activation guaranteed higher yields for N-NH4+ (32%), P (44%), and N-NO3 (66%) with a contact time in the batch test of 6 h for N-NH4+ and P, and 3 h for N-NO3. Up to 50% COD removal was achieved in 6 h with 950 °C pyrolyzed + KOH-activated biochar.

1. Introduction

Decreased rainfall and accelerated evaporation caused by climate change reduce available water resources for human communities and agricultural irrigation [1,2,3]. Water scarcity can lead to competition between sectors and the emergence of conflicts related to water resources [4]. Droughts can be addressed through sustainable water management policies, investment in water infrastructure, efficient agricultural practices, and adaptive solutions to address climate change [5,6]. The reuse of treated wastewater (WW) in agriculture can represent one of the effective techniques for tackling the problem of drought [7,8], as promoted by the European Union [9].
It is universally known that treated effluents of wastewater treatment plants (WWTPs), in compliance with regulatory impositions, can be discharged into surface water bodies for indirect reuse [10]. The direct reuse of WWTP effluents for irrigation, civil, and industrial uses, with dedicated water distribution pipelines, is an increasingly shared approach at the European level [11]. The reuse of water for irrigation purposes in agriculture can help promote a circular economy by recovering nutrients (such as nitrogen, phosphorus, and potassium) from treated urban WW and potentially reducing the application of mineral fertilizer [9]. This approach to appropriate water reuse should be consistent with EU water policy and should contribute to achieving the United Nations Sustainable Development Goals for 2030, in particular Goal 6 of ensuring the availability and sustainable management of water [12].
WWTP effluents may not comply with limit values for direct reuse, being more stringent than emission limits for urban WWTP into surface waters. WWTP effluents may need additional treatment to meet direct reuse requirements [13]. The qualitative characteristics of these waters could improve with the application of an adsorption process just before the final disinfection. The use of recycled adsorbent material represents a further contribution to a circular economy, reducing the use of mineral-activated carbon. Biochar obtained from sewage sludge can represent an interesting alternative for water utilities, as the treatment and disposal of sewage sludge can account for 20–60% of the total operating costs of a full-scale WWTP [14]. WWTP managers are faced with two challenges: on the one hand, the demand for ever higher water quality standards increases the production of sewage sludge [15,16]; on the other hand, the possibilities for the recovery/final disposal of sewage sludge are changing in an increasingly demanding and challenging way [17,18,19]. The global annual production of dry sludge is estimated to be approximately 45 million tons [20]. In Italy, in 2020, the amount of sewage sludge from urban WW treatment reached approximately 3.4 million tons (in terms of wet matter). Lombardy is the region with the greatest production of almost 469,000 tons, 13.8% of the total national production [21]. The transformation of biological sewage sludge into biochar via thermochemical treatments is a promising technology for sludge management within the same WWTP that produced it [22].
Biochar production has increased over the years due to its growing practical applications in different industrial sectors such as soil amendments, pollution removal, energy and gas sequestration and storage [23]. The most widely used technique for obtaining biochar is thermochemical conversion via different processes such as pyrolysis, gasification, hydrothermal carbonization, and torrefaction. Pyrolysis consists of heating the biomass at different temperatures under inert gas flux with no or little oxygen sources. Depending on the kind of biomass, heating environment, and heating rate, biochar with different surface characteristics and different compositions can be obtained [24]. Pyrolysis weakens the interactions between the polymers in lignin biomass, resulting in the depolymerization of cellulose and hemicellulose, reducing biomass tenacity and thus enhancing grindability [25]. Via cellulose pyrolysis, oligosaccharides are obtained, which are cleaved by the glycosidic link to produce d-glucose, which is subsequently intermolecularly rearranged to make levoglucosan, which is finally dehydrated to produce levoglucosenone. This substance is finally dehydrated, decarboxylated, aromatized, and intramolecularly condensed to create an aromatic biochar network [23]. Hemicellulose is also converted during pyrolysis to obtain biochar [26]. Oligosaccharides release xylosan, which has already undergone dehydration, decarboxylation, and aromatization. Biochar is obtained as a result of intramolecular condensation reactions in this mixture. The generated biochar is activated using physical, chemical, or biological approaches. Physical activation generally has lower activation effectiveness than chemical activation, which generally needs a lower temperature [27]. Chemical activation of biochar is more corrosive than physical activation, though its exact mechanism of action has yet to be clarified. Physical activation methods, such as with steam and gas like CO2, can enhance biochar’s attributes by changing its physical characteristics, density, and moisture content [28]. Steaming biochar for 45 min at 800 °C significantly enhanced its surface area and micropore volume, from less than 5 m2 g−1 up to 800 m2 g—1. This material shows improvement in its ability to adsorb metal ions [29]. Chemical agents, such as acids, alkalis, and metal salts, are frequently used in biochar activation. Acid treatment can improve biochar’s pore properties, such as porosity and surface area, by washing away impurities that exist on the surface. Alkali treatment can tune the porous structure, which is crucial for environmental applications [30]. Moreover, chemical activation introduces functional groups onto the biochar surface not present in the starting material.
It has been shown in the literature that biochar has potent adsorption effects on organic contaminants in liquid media (phenols, herbicides, etc.). Electrostatic forces and intermolecular gravity influence the physical adsorption of organic contaminants into biochar, while during chemisorption, ionic or covalent bonds between contaminants and the biochar-based material form. Adsorption is highly pH dependent, and cations like calcium and potassium promote better adsorption efficiency [31].
Kamali et al. [32] reported cadmium, zinc, and copper adsorption in WW using biochar from woody biomass. Rice-husk- and corncob-biomass-derived biochar resulted in a 589 mg g−1 phenol adsorption capacity with a mechanism involving acid–base and hydrogen bonding interactions. Wheat husk biochar showed better adsorption of 2,4-dichlorophenol, while sugarcane-bagasse-derived biochar was used for 2,4,6-trichlorophenol adsorption [33].
However, in the scientific literature, the studies on biochar for water treatment are mainly based on laboratory scenarios [34,35,36,37], and the operating conditions for a large scale certainly need to be investigated [38]. Furthermore, the adsorption of individual pollutants in synthetic aqueous solutions has been studied (e.g., phosphate [35], copper [36], and hexavalent chromium [37]). This methodology is not representative of real situations, in which biochar should be applied to complex waters simultaneously rich in different pollutants and interferents.
This work is composed of two parts. The first one reports a survey on the effluents of WWTPs (> 400 population equivalent) located in Lombardy, a region of northern Italy. The quality of the effluents was studied to identify any critical parameter in view of a direct recovery, mainly for irrigation uses, according to the regulations in force. In the second part, the application of biochar obtained from the thermochemical treatment of biological sewage sludge to improve the qualitative characteristics of a full-scale WWTP effluent is discussed. Batch adsorption tests were performed to study the removal efficiency of some chemical parameters from a WWTP effluent. The optimal operating conditions for (i) thermochemical processes for biochar preparation (pyrolysis temperature, chemical activation, etc.) and (ii) adsorption tests for WW treatment (contact time, biochar dosage, etc.) were studied to ensure the technical and energy sustainability of the treatment chain. This integrated approach represents a contribution to the sustainable recovery of resources and promotes a circular economy based on WW treatment [14,39].

2. Materials and Methods

2.1. WWTP Effluent Analysis

2.1.1. Monitoring Data

The processed data were obtained from the online site of SIRe Acque [40], an information system of the Lombardy region dedicated to water, which collects official data regarding sewerage, collection, and purification services. The first section of the SIRe Acque system is responsible for collecting and organizing the results of samples taken from the WWTPs in Lombardy. The Lombardy region, through the analysis of these samples, verifies whether the treated effluents comply with the concentration limits and standards for the removal of polluting substances, as required by regional, national, and community legislation. In this way, the control body guarantees that the water respects the legal limits and can be safely released into the environment.
In this research, data relating to the years 2019 and 2022 were taken into consideration, and WWTPs with a treatment potential of greater than 400 population equivalents were included. The WWTPs studied were divided into 4 potential classes based on the population equivalent (PE) of the reference agglomeration: (i) 400 ≤ PE ≤ 2000, (ii) 2000 ≤ PE ≤ 10,000, (iii) 10,000 ≤ PE ≤ 50,000, and (iv) PE ≥ 50,000. Further information, reported in the regional database and elaborated by the researchers, included the treatment chains of the WWTPs: P—primary treatment; S—secondary treatment; deN—specific treatments for nitrogen; deP—specific treatments for phosphorus; and deNP—specific treatments for nitrogen and phosphorus.

2.1.2. Regulatory Framework for WW Reuse

The European Union Regulation 2020/741 [9] was issued in May 2020 and applied starting from 26 June 2023. The regulation highlighted the growing pressures on water resources caused by climate change and drought. To address these challenges, the European Union promoted widespread WW reuse where appropriate and cost-effective. A framework was created to enable member states to reuse WW if they wish or need to. The main topic of the regulation was reuse for irrigation in agriculture. Based on different types of crops, different classes of reclaimed water quality were defined. The EU defined WW for irrigation reuse (called reclaimed water) as urban WW treated in accordance with Directive 91/271/EEC and resulting from further treatment in a reclamation facility.
At a national level, Ministerial Decree No. 185 of 2003 was issued in Italy [41], which regulated the reuse of WW for irrigation, and civil or industrial use. WW recovered for irrigation or civil reuse has to meet chemical–physical and microbiological quality requirements at the time of emission from the recovery plant (WWTP).
In this research, five parameters provided by the SIRe Acque database were considered: BOD5, COD, total suspended solids (TSSs), total phosphorus (TP), total nitrogen (TN), and ammonia (NH4), referring to the WWTP effluents. The analysis of the parameters showed how many WWTPs in Lombardy exceeded, in the years 2019 and 2020, the most restrictive limit value established by the European and/or Italian regulations. Table 1 shows the most restrictive requirements considered for the data processing for WWTP effluents. The identification of the critical parameters for the reuse of WWTP effluents in Lombardy was the aim of the data analysis.
Furthermore, Regional Regulation No. 6 of 2019 is in force in the Lombardy region for domestic and urban WW discharges [42]. The limit values are differentiated according to the WWTP treatment potential and the type of receptor. For COD, TP, and TN, this regulation sets stricter limits than the standards described above for WW reuse, as compared in Table 1. These emission values are imposed on WWTPs with a PE of >50,000 and for TP and TN in effluents discharged outside of lake drainage basins. In the case of effluents flowing to lakes or the relative lake drainage basins, the TP limits are even lower (not considered in this research). The effluent data processing was carried out under two conditions: (i) considering the European and national limits and excluding the regional ones; (ii) including the even stricter limits of the Lombardy region for WWTPs with a ≥ 50,000 PE.

2.2. Sewage-Sludge-Derived Biochar

2.2.1. Biological Sewage Sludge

The biological sewage sludge for biochar production was sampled from an urban WWTP located in the Lombardy region (Northern Italy) with limited industrial input, serving a population of 130,000 PE. It was mesophilic sludge, a mixture of primary and secondary sewage sludge. The WWTP water line included a pre-aeration, degreasing, and sand removal tank, a primary settler, a conventional activated sludge compartment, and a post-denitrification process. The primary sludge came from the primary settler, which guaranteed removal yields of 30% for BOD5, 90% for suspended solids, and 10% for TP and TKN. The secondary sludge came from the secondary settler with a residence time of ≥ 2 h and a hydraulic loading rate of less than 1.5 m h−1. The sludge age in the oxidation tank was in the range of 3–4 days. The sludge line was composed as follows: static thickener, dynamic thickener, anaerobic digestion system, and final dewatering with a centrifuge. The dewatered biological sewage sludge used for biochar production had an average concentration of total solids equal to 240 kg m−3 and a percentage of volatile solids of 58%.

2.2.2. Biochar Preparation

The sewage sludge (200 g) was dried at 105 °C for 24 h in a muffle under air in a ceramic crucible to remove the water. A brownish solid was obtained, which was subjected to pyrolysis and subsequent chemical–thermal activation to obtain the biochar and the activated carbon, respectively. In particular, biochar was obtained via pyrolysis performed at three different temperatures (350 °C, 650 °C, and 950 °C) by weighing approximately 2 g of dried powder in an alumina boat, heating it in a horizontal Carbolite oven under nitrogen at 10 °C/min up to the desired temperature value, keeping the temperature constant for 2 h, and cooling down to room temperature at 10 °C/min. The temperature values were chosen from the results of the thermogravimetric analysis (see the following paragraphs) as the values at which the two main observed decomposition processes were over 350 °C and 650 °C, and the value at which the residual mass was constant (950 °C). The obtained black powder (biochar) was activated in 2 steps. The first chemical step consisted of mixing it with KOH (6:1 weight ratio), preparing a dispersion in water (25 mL for each g of biochar), magnetically mixing for 2 h, and subsequently heating in a Control AG-System muffle (Fratelli Galli, Fizzonasco, Italy) at 110 °C for 12 h to obtain a dry powder. The second step was a thermal treatment performed on the obtained powder following the same procedure as the 650 °C pyrolysis process (heating ramp, 2 h of isothermal treatment, and cooling ramp, all the steps performed under a nitrogen atmosphere). The activated samples were washed with 0.5 M HCl up to pH = 7, filtered under vacuum, and washed with water under vacuum. Finally, the powders were dried in a Control AG-System muffle (Fratelli Galli, Fizzonasco, Italy) at 110 °C for 12 h to obtain the activated carbon samples.

2.2.3. Biochar Characterization and Analytical Methods

The physicochemical characterization of the dried sludge, the biochar, and the activated carbon was performed using several different analytical techniques. Thermogravimetric analysis (TGA) was conducted with a Q5000 apparatus (TA Instruments, New Castle, DE, USA) interfaced with a TA5000 data station under nitrogen flux (10 mL min−1) in a platinum pan by heating approximately 3 mg of each sample from room temperature up to 1000 °C (10 K min−1 heating rate). The TGA data were analyzed using the Universal Analysis software V4.5A by TA Instruments, which allowed us to also obtain the derivative of the thermogravimetric curves (DTG), which was useful for determining the starting and ending temperatures of the different decomposition processes.
A Zeiss EVO MA10 (Carl Zeiss, Oberkochen, Germany) scanning electron microscope (SEM) was used for the morphological study of gold-sputtered samples (secondary electron detector). The measurements were performed at 20 kV with a working distance of 8.5 mm. Energy dispersive analyses were performed with an XMax 50mm2 probe (Oxford Instruments, Abingdon, UK) coupled with the SEM.
Powder X-ray diffraction (PXRD) measurements were performed at room temperature after manual grinding in an agate mortar. A Bruker D2 Phaser diffractometer (Bruker Corporation, Billerica, MA, USA) with Cu-Kα radiation was employed. The measurements were performed from 5° to 50° in 2θ with the following step scan mode: a scan step of 0.02° and a counting time of 3 s per step. The X-ray tube working conditions were 40 kV and 40 mA. Fourier-transform infrared spectroscopy analyses (FT-IR) were performed with a Nicolet FT-IR iS10 spectrometer (Nicolet, Madison, WI, USA) equipped with an attenuated total reflectance (ATR) sampling accessory (Smart iTR with a diamond plate). Thirty-two scans in the 4000–600 cm−1 range at a 4 cm−1 resolution were co-added. Well-ground powder samples were used, and spectra were obtained after pressing the samples onto an ATR diamond crystal at room temperature (20 °C). Peak wavenumbers were attributed using the “Find peaks” function of the OMNIC™ Spectra Software. The specific surface areas of the samples were determined with Sorptomatic 1990 equipment (Thermo Fisher Scientific, Waltham, Massachusetts, US) operating with the static volumetric principle.
Approximately 150 mg of each sample was charged in the glass sample holder and degassed at 250 °C for 12 h. Subsequently, the samples were cooled down at −196 °C, and an adsorption run was performed (using the BET method, N2 as the analyzing gas, 20 points for the run, and a blank performed in He). The correction for the volume of the sample was performed by measuring He adsorption.

2.2.4. Adsorption Batch Experiments

Raw Wastewater

The raw WW treated with sewage sludge biochar during the adsorption tests was sampled from an urban WWTP (20,000 PE) in Lombardy (Northern Italy). The real WW came from a combined sewer receiving several industrial, as well as domestic, discharges. The characteristics of the WW are reported in Table 2.

Experimental Procedures

To evaluate the adsorption performance of the biochar obtained via the pyrolyzed sewage sludge, batch adsorption tests were carried out, following a standard methodology provided by ASTM International [43]. Two types of adsorption tests were conducted, and the methodological approach adopted is described below:
  • Search for the “optimal thermo-chemical conditions of pyrolysis”: a constant concentration for each biochar (approximately 4.0 gbiochar LWW−1) was used to identify the most effective biochar for the WW adsorption treatment. The different biochar samples were obtained from different thermochemical conditions during the biochar preparation.
  • Identification of the “optimal biochar concentration”: different biochar concentrations (0.25–0.4–0.8–1.7–4.0–5.8 gbiochar LWW−1) were used to determine the optimal quantity for the adsorption treatment of the WW, for each of the most promising thermo-chemical treatments.
Initially, the real WW was filtered through 0.45 µm filter paper, and the pH was measured with a WTW-IDS probe, model SenTix® 940 (Xylem Analytics Germany Sales GmbH & Co., Mainz, Germany). Glass beakers containing 60 mL of WW each were placed in a magnetic stirrer and kept under constant stirring (600 rpm). A specific quantity of biochar was weighed with an analytical balance and introduced into each of the beakers. Each adsorption test lasted six hours, during which multiple samplings (10 mL each) were performed: at the beginning of the test, after only 3 h for the first type of experimental test, and after 6 h. Biochar was separated from the WW via 0.45 μm filtration. The samples were stored at a temperature of approximately 4 °C and subsequently sent to a chemical analysis laboratory for the determination of COD, NH4, N-NO3, and TP levels, some of the parameters indicated in the minimum requirements for the reuse of water, as described above. By measuring the residual concentration of the adsorbate (chemical parameter) in the WW, the removal yield of each parameter by the biochar (adsorbent) was determined as follows:
Removal   yield   % = Initial   concentration   mg   L 1   final   concentration   ( mg   L 1 ) Initial   concentration   ( mg   L 1 )   ×   100

Analytical Procedures

COD was measured according to the ISPRA 5135 method [44]. N-NH4+ was studied following the APAT-IRSA-CNR 4030 [45] method. N-NO3 concentrations were studied according to EPA method 300.1 [46]. TP was analyzed according to EPA method 3051A [47] and EPA method 6010D [48].

3. Results and Discussion

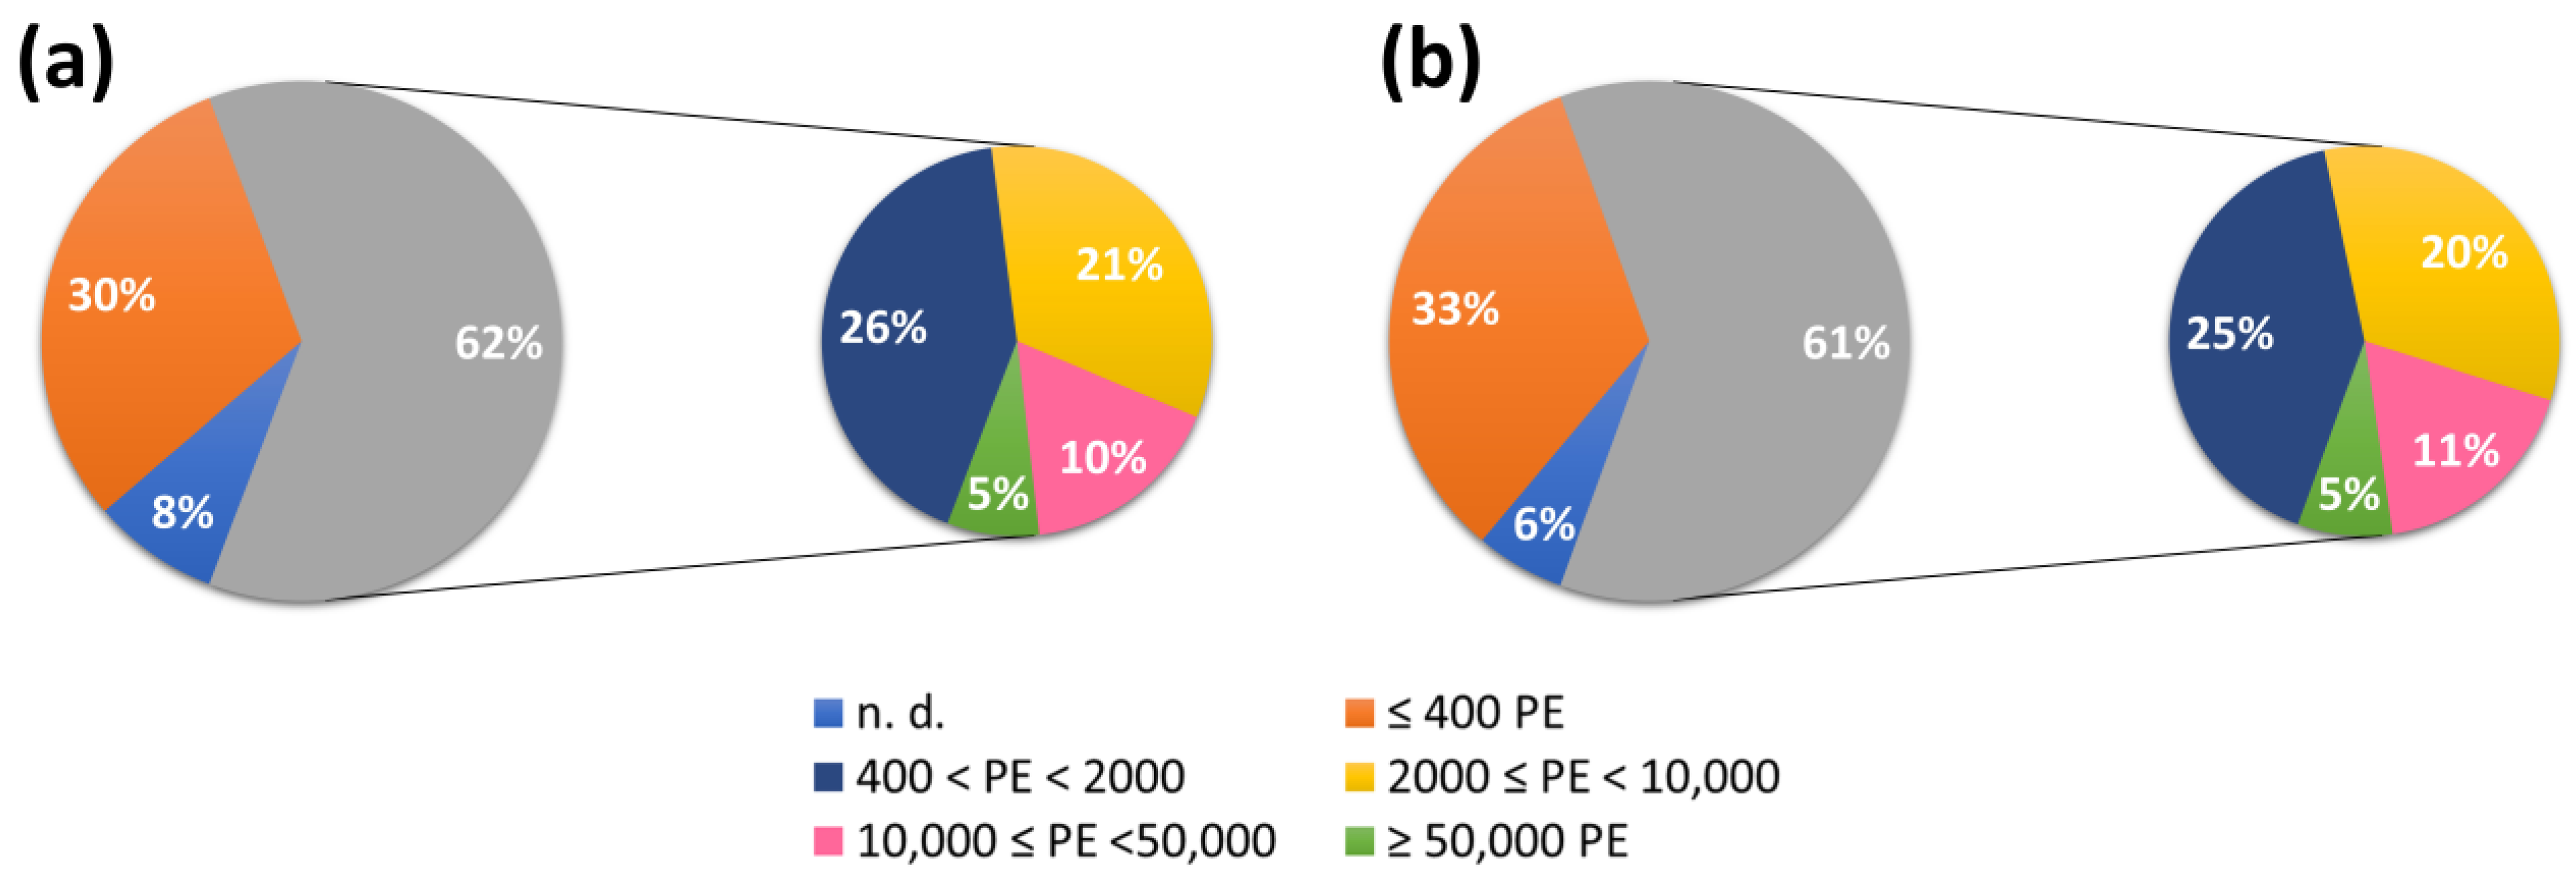
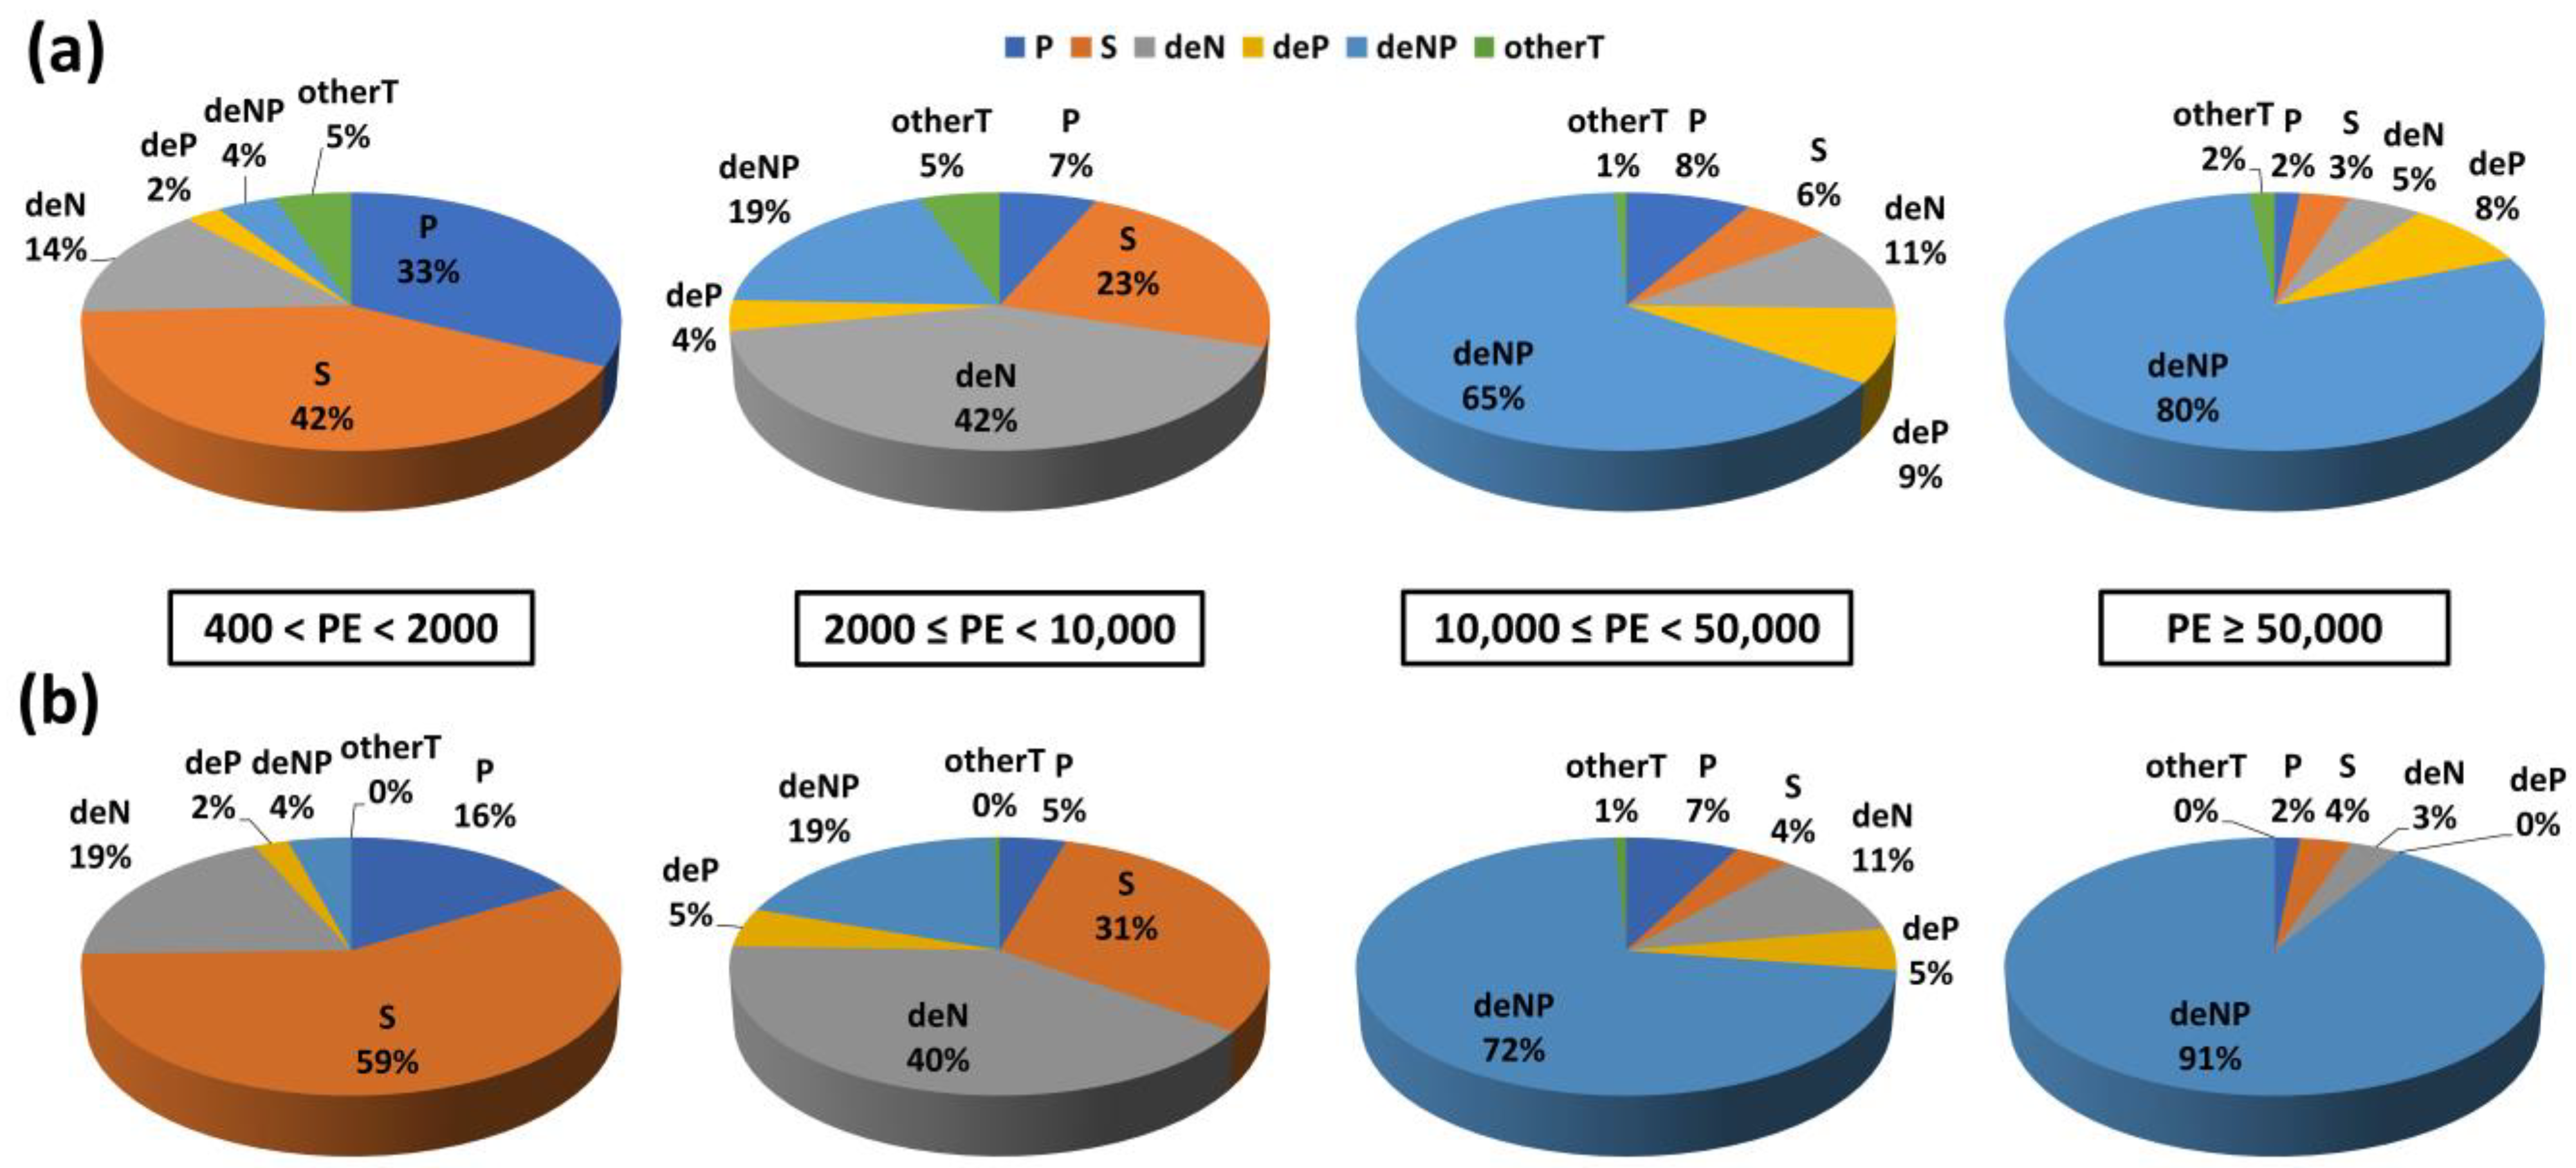
3.1. WWTP Effluent Analysis

In the Lombardy region (Northern Italy), the total number of WWTPs was 1257 in the year 2019 (Figure 1a) and 1206 in the year 2022 (Figure 1b).
This decreasing trend could indicate the closure of some WWTPs in favor of greater centralization of WW treatment. Figure 1 shows the subdivision of the WWTPs located in the Lombardy region into five potential classes. From 2019 to 2022, no major changes were visible, only a 2% reduction in data gaps and a 3% increase in the lowest potential class (PE ≤ 400). In subsequent data analyses, WWTPs with a potential of >400 PE were studied. Also excluding the WWTPs with a lack of data, approximately 60% of the WWTPs were considered, corresponding to a treated PE of 99.7% of the total in the Lombardy region. WWTPs with a PE of ≤400 served only 0.3% of the total population.
Figure 2 shows the different WW treatments for the four potential classes of WWTPs in the years 2019 (Figure 2a) and 2022 (Figure 2b).
For 400 < PE < 2000, there was an increase (17%) in the secondary treatment, to the detriment of the primary one, which halved from 2019 to 2022. A 5% increase in specific treatments for the removal of nitrogen was also observed. With an increase in potential, the water line treatment chains became increasingly complete, with more and more specific treatments. In WWTPs with 2000 ≤ PE < 10,000, approximately 40% of the water lines were equipped with a specific process for nitrogen removal, with the presence of treatments for both nitrogen and phosphorus increasing by up to 19%. WWTPs with only secondary water treatment were halved compared with the lower capacity class. The two major potential classes had a similar division in terms of process equipment. Most WWTPs also consisted of specific treatments for the removal of nitrogen and phosphorus, with an almost complete water line. For 10,000 ≤ PE < 50,000, from 2019 to 2022, the number of WWTPs with only phosphorus removal decreased from 9 to 5% thanks to the inclusion of processes such as denitrification, with an increase from 65 to 72% for deNP. The same happened for PE > 50,000, introducing processes for the removal of phosphorus if there were only processes for nitrogen, and vice versa. The WWTPs with both treatments simultaneously increased from 80 to 91% over the years. In general, for all potential classes, a revamping of WWTPs was observed from 2019 (Figure 2a) to 2022 (Figure 2b), thanks to the inclusion of additional treatments to increase the quality of the treated WW.
Figure 3 focuses on WWTP effluents and the regulatory limits imposed by European and Italian legislation for WW reuse [9,41]. The highest percentages of exceedances of the regulatory limits were observed for the low potential of 400 < PE < 2000 (Figure 3a). With an increase in PE, the discharge overruns clearly decreased (Figure 3b–d). The same concept was found in the data gap analysis (n.d.), resulting in a more myopic view of small WWTPs. These aspects can be linked to the better management of large WWTPs, manned and controlled by the operators daily. Smaller WWTPs with more compact treatment chains can be neglected, resulting in less monitoring and poorer effluent quality. Certainly, from the year 2019 to the year 2022, the lack of data decreased for all potential classes, realizing a more accurate overall view in 2022. Major overruns were observed for TN and TP in over 70% of WWTPs with 400 < PE < 2000 (Figure 3a). The same parameters plus NH4 saw approximately 40% limit breaches in 2022 for 2000 ≤ PE < 10,000 (Figure 3b). For 10,000 ≤ PE < 50,000 (Figure 3c), except for COD, which always complied with the regulations, the other parameters showed overruns in the range of 15–27%. The outflow from legal requirements reached a maximum of 27% in 2022 for TN and NH4. In the highest potential class (PE ≥ 50,000, Figure 3d), the most critical parameters in 2022 were NH4, SS, TN, and BOD5, with respective exceedances of 19%, 14%, and 12% for both TN and BOD5. Finally, with reference to all the studied classes, the most critical parameters in the effluents were TN, NH4, and TP.
Figure 4 focuses on the requirements for the direct reuse of WWTP effluents imposed by the Lombardy region (Northern Italy), which are more restrictive than the Italian legislation for COD, TP, and TN [42].
Figure 4 should be compared with Figure 3d for the COD, TP, and TN parameters. In 2019, considering the Lombardy legislation, failure to comply with the limits increased as follows: from 2 to 7% for COD, from 10 to 20% for TP, and from 14 to 17% for TN. In 2022, the increase was from 2 to 5%, from 7 to 16%, and from 12 to 19% in the case of COD, TP, and TN, respectively. In 2022, for PE ≥ 50,000, more than 10% of WWTPs showed exceedances of the limits for all parameters, except for COD.

3.2. Powder Characterization

The thermogravimetric curve of the dried sludge (Figure 5) shows three main mass loss steps, with the first one starting from room temperature and ending at approximately 150 °C due to the water release (approximately 8 wt%); the second one ending at 380 °C due to an initial decomposition step of the organic matter present in the biomass (31.9 wt%), such as lignin and humic substances [49], proteins, and carbohydrates [50] and the third one, due to the subsequent evolution of several different decomposition processes (as testified by the derivative curve of the thermogravimetric signal (DTG)), ending at 550 °C (31.6 wt%) due to the presence of organic components or polluting compounds that are thermally more stable than the polymeric compounds previously quoted. After a very small further mass decrease (1.2%), the sample mass was constant starting from approximately 660 °C. Considering that pyrolysis is performed on a higher sample mass with respect to TGA but with an appended isothermal step, the temperature values of 350 °C (close to the end of the first decomposition step), 650 °C (constant mass), and 950 °C (to maintain a 300 °C increment) were chosen for the pyrolysis.
Apart from the humidity release, the biochar obtained from the thermal treatment at 350 °C was thermally stable up to 200 °C, while the ones obtained at 650 °C and 950 °C were stable up to 400 °C, as evident in the thermogravimetric curves reported in Figure S1a,b. The specific surface of the dried sludge was 1.7 m2 g−1, with a micropore total surface area of 0.3205 m2/g. After pyrolysis, the surface area increased to 2.5 m2 g−1, 5.8 m2 g−1, and 9.7 m2 g−1 for the treatments at 350 °C, 650 °C, and 950 °C, respectively, while after activation, the values increased to 45.2 m2 g−1, 85.3 m2 g−1, and 97.7 m2 g−1 (with micropore total surface areas of 12.4 m2 g−1, 23.3 m2 g−1, and 28.8 m2 g−1), respectively.
The EDS analyses performed on the powder obtained after sludge drying (Table 3) revealed that carbon and oxygen were the most important components of the sample, with weight percentages of up to 41 and 44m respectively. Ca and P were present in meaningful amounts of up to 3.5 wt% and 3.0%, respectively, followed by Fe (2.8%), Al (2.5%), and Si (2.2%). Traces of S (<1 wt%), Na and Mg (0.3%), and K (0.2%) were also revealed. After pyrolysis, the C and O amounts decreased due to the decomposition of the sludge components with the release of carbon dioxide, moisture, hydrogen, carbon monoxide, light incondensable hydrocarbons, and methane [51], with the largest variations registered for the treatment at 350 °C and smaller changes for the treatments at the other two considered temperatures, leading to very similar ending values (C and O’s wt% values were equal to 35 and 38% at 350 °C, 26 and 37% at 650 °C, and 25 and 36% at 950 °C). All the elements detected in the sludge were still present after pyrolysis, with the maximum increases being in the amounts of Ca (increasing up to 10 wt% for the treatment at 950 °C), P (up to 8 wt%), Al and Si (up to 7 wt%), and Fe (up to 5 wt%). After activation, for all the samples, the C content dropped, reaching values lower than 10 wt% for the 350 °C treated sample and approximately 18% for the other two, pointing out that the erosion enacted by the strong base was useful for creating pores in the C structure and stronger for the material richer in organic compounds due to their further reaction/decomposition. O was present in a high amount, followed by Al, P, Si, and P. Na and Cl were no longer detectable. The sample obtained at 950 °C was richer in P, Fe, and K compared with the one prepared at 650 °C, while Si was less abundant.
The SEM images (Figure S2a,b) of the dried sludge show the presence of compacted grains with squared borders and sizes ranging from 50 μm to 100 μm. After pyrolysis, a number of small grains and a decrease in the size of the powders were evident upon increasing the treatment temperature (Figure S2c,d), and the surfaces of the grains appeared more fragile and softer. Activation (Figure S2e,g) further decreased the grain size, leading to a few larger grains surrounded by fine powders. For the sample pyrolyzed at 350 °C (Figure S2f), the surfaces of the grains were very porous and appeared fragile and soft, in agreement with the EDX results, outlining the strong erosion enacted by the base in the presence of a high amount of organic matter. For the samples treated at 650 °C (Figure S2h) and 950 °C, the surfaces of the grains appeared harder and were composed of a subsequence of small particles whose borders touched each other at a few contact points, creating pores and holes. This observation points out that pyrolysis at the two highest temperatures caused the decomposition of a higher amount of organic compounds, activation caused a weaker erosion of the C skeleton, and the subsequent thermal treatment helped in sintering the C-based material around the pores.
The XRPD analysis confirmed the success of the pyrolysis and activation. In the dried sludge (Figure S3a), a halo trend pointing for a mainly amorphous solid was evident, with superimposed peaks attributable to the presence of crystalline phases that due to the nature of the organic materials and the EDX analyses, can be hypothesized as containing Si (SiO2; 21°), C (graphitic; 26°), P (aluminum phosphate; 28° and 35°), and calcium (calcium carbonate; 29°). The thermal treatment seemed to decrease the amounts of amorphous phases, with the peaks at 21° and 26° due to Si- and C-containing phases emerging from the background (Figure S3b; the results obtained for the sample treated at 650 °C are shown as an example). On the contrary, after activation, the halo characteristic became predominant, with the presence of an intense peak at 45° probably attributable to metallic Fe (Figure S3c).
Concerning the FT-IR analyses, the dried sludge (Figure S4a) presented a very simple spectrum, with a wide band of low intensity from 3800 cm−1 to 3200 cm−1 attributable to -OH groups due to a small amount of water left, a peak at 2917 cm−1 attributable to -CH from alkanes, a signal at 2360 cm−1 due the presence of compounds with C≡C bonds, and finally, a band at 1021 cm−1 due to Si-O-Si bonds, which was in agreement with the presence of C and Si revealed with EDX. The spectra of the pyrolyzed samples appeared very different: for the sample treated at 350 °C (Figure S4b), the band for -OH stretching was larger, the signal for -CH vibrations was still evident, while the peak attributable to C=C bonds (1593 cm−1) appeared, and the band for the presence of Si-O-Si increased its intensity. In the sample treated at 650 °C, only the signals due to C=C and Si-O-Si bonds were detectable. Finally, for the sample annealed at the highest temperature (Figure S4d), the C=C bond signal became predominant, a small peak for Si-O-Si bonds was visible, and starting from 2000 cm−1, the signal decreased, as expected for an amorphous material.
After activation, the FTIR spectrum of the biochar prepared at 350 °C (Figure S4c) mainly showed a band for -OH bonds and a peak for Si-O-Si bonds, while the samples pyrolyzed at 650 °C and 950 °C (Figure S4e) showed an intense peak at 2360 cm−1 due the presence of compounds with C≡C bonds, a signal at 1736 cm−1 due the presence of compounds with C=O bonds, and a peak due to Si-O-containing compounds.

3.3. Adsorption Batch Experiments

3.3.1. Removal Yields as a Function of the Pyrolysis Operating Conditions

Figure 6 shows the removal of the chemical parameters (COD, N-NH4+, N-NO3, and TP) with sewage sludge biochar prepared under different operating conditions: different pyrolysis temperatures, with or without subsequent chemical activation.
The results after contact times between the WW and biochar of 3 h and 6 h are reported. In general, the contact time of 6 h guaranteed better removal yields, except for phosphorus with biochar pyrolyzed at 950 °C, both with and without chemical activation.
The best COD removal efficiencies from treated WW were 46 and 50% for biochar derived from pyrolyzed sewage sludge at 650 °C and 950 °C, respectively, followed by chemical activation with KOH (Figure 6a). The increase in adsorbent capacity following chemical activation has been confirmed by several researchers [52,53,54]. Chemical activation of sludge can improve its surface area and porosity by removing impurities, such as ash and inorganic compounds, from the sludge [52]. Sludge-based activated carbons and chars, thanks to their macro- and mesoporous nature inherited from the bacterial cell wall structure and the cleavage of glycosidic and amide bonds during pyrolysis, have a good adsorption capacity for large-molecular-weight compounds compared with smaller molecules [52,55]. The contact time of 3 h allowed a removal efficiency of approximately 30% for both biochars to be reached. Ammonia nitrogen was not removed with the biochar pyrolyzed at 350 °C, even with chemical activation (Figure 6b). This result is in line with the recent study by Tang et al. [56] on ammonium removal in municipal WW with biochar obtained from anaerobic digester sludge. They showed that biochar pyrolyzed at 350 and 400 °C, without chemical activation, had relatively lower ammonium adsorption capacities, compared with biochar pyrolyzed at higher temperatures, due to the lack of carbonization [56]. Pyrolysis at 650 °C followed by chemical activation ensured the best yields (32%) with the maximum contact time for N-NH4+. The same thermochemical preparation reached a 22% yield with a 3 h contact time, which was slightly lower than that with pyrolysis at 950 °C followed by activation after 6 h (26%). The same treatments were also effective for nitric nitrogen (Figure 6c). Efficiencies of 66 and 52% were achieved with pyrolysis at 650 °C + chemical activation with 3 and 6 h contact times, respectively. Furthermore, 47% of N-NO3- was removed after 6 h with the biochar pyrolyzed at 950 °C and chemically activated. For TP (Figure 6d), similar removal results were obtained with pyrolysis alone at 650 °C after a 6 h contact time (41%), pyrolysis at 650 °C followed by activation after a 6 h contact time (44%), and pyrolysis alone at 950 °C after a contact time of 3 h (42%). Only for TP, with biochar pyrolyzed at 950 °C, the removal efficiency decreased appreciably as the contact time of the adsorption test increased. With pyrolysis at 950 °C alone, there was a decrease from 42 to 26%, and with pyrolysis at 950 °C + activation, from 34 to 28%. Further investigations are needed, for example, with elution tests on the biochar, to verify the possible release of phosphorus into the water by the biochar.
Lanthanum hydroxide-engineered sewage sludge biochar was used by Elkhlifi et al. [57] to investigate its adsorption performance for phosphate removal from river water. With an initial phosphate concentration of 17.2 mg L−1 and an adsorbent concentration of 0.5 g L−1, a total removal efficiency was observed. These higher performances compared with our study could be related to the different biochar modifications. Furthermore, the waters used in the tests had different and non-comparable origins. Yu and Zhong [53] prepared different types of biochar from sewage sludges pyrolyzed at 550 °C and used a complex of ZnCl2 and H2SO4 (5 mol L−1) as an activating agent. In a static adsorption test, with a biochar concentration of 5 g L−1, the COD and TP removal rates were in the ranges of 68–79% and 98.3–96.6%, respectively. Higher yields were obtained for both COD and TP, but the results are not fully comparable to our study. The starting raw materials for the biochar preparation and the biochar concentrations in the adsorption tests were similar in both experiments, which was on the contrary for the activating species used and for the operating conditions of the biochar preparation, including the pyrolysis temperature.
Hwang et al. [58] performed the application of a sewage-sludge-based adsorbent to a WWTP’s effluent water with a column test (flow rate: 23 mL min−1). The adsorbent was obtained from mixtures of sewage sludge and coal-tar pitch pyrolyzed at 700 °C and using a KOH activation agent (1 mol L−1). The adsorbent with an activation temperature of 800 °C had the highest COD efficiency of approximately 58%. The activation temperature of 850 °C guaranteed the highest removals of TN and TP, equal to 3.5 and 4.9%, respectively. Although a partially different material was employed for the biochar preparation, and some different operating conditions for the pyrolysis, activation, and adsorption tests were followed, the COD removal efficiencies were comparable to those in our work, and much lower TP efficiencies were obtained.

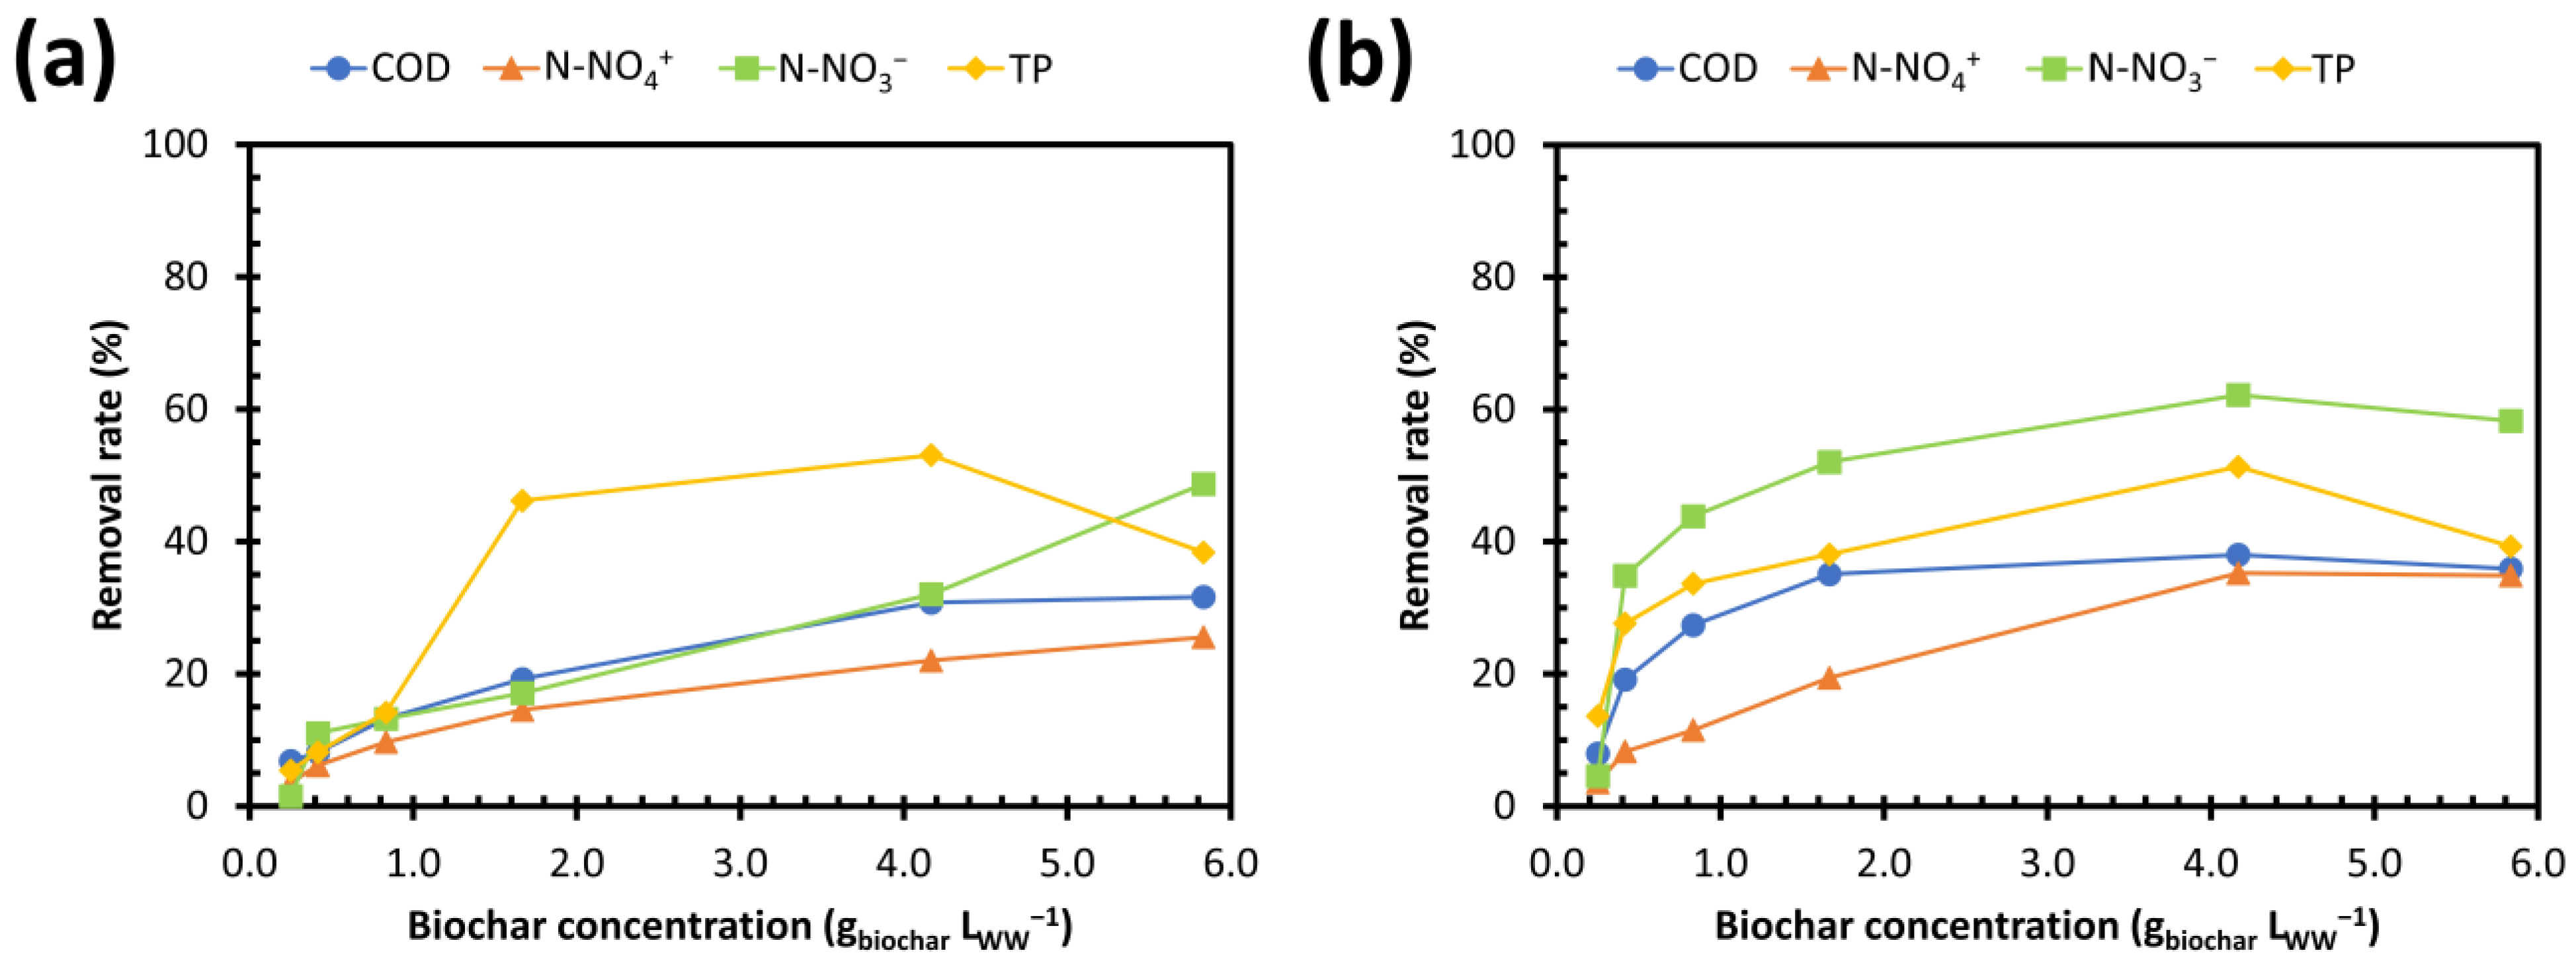
3.3.2. Removal Yields as a Function of Biochar Concentration

The results of the experimental tests at variable biochar concentrations are shown in Figure 7.
The two biochars with the overall best results in the previous measurements (at a constant biochar concentration) were tested, namely, the ones pyrolyzed at 650 °C + KOH activation (Figure 7a) and those pyrolyzed at 950 °C + KOH activation (Figure 7b).
Figure 7a depicts increases in the parameter removal yields with an increasing biochar concentration, excluding TP. The initial concentrations of COD, N-NH4+, N-NO3, and TP in the WW were 234 mg L−1, 22.7 mg L−1, 0.46 mg L−1, and 5.4 mg L−1, respectively. In the case of TP, with a concentration higher than 5.8 gbiochar LWW−1, the yield decreased from 53 to 38%. For optimal TP removal, the biochar concentration should not exceed approximately 6 gbiochar LWW−1. With higher dosages of biochar in the water, the release of TP from the biochar may occur. As also pointed out for the previous tests, further investigations of TP release into the water are necessary. In the cases of COD and N-NH4+, the yields were affected by a slight increase between 4.2 and 5.8 gbiochar LWW−1, 31 to 32% and 22 to 26%, respectively. Although an equilibrium plateau had not yet been reached, the yields were acceptable even at concentrations not exceeding 4.2 gbiochar LWW−1. Only for N-NO3, the equilibrium condition was not identified, as the yield increased from 32 to 49% with the highest tested concentration (5.8 gbiochar LWW−1). To find the equilibrium concentration necessary for maximum N-NO3- removal, the dosages of biochar in WW should be further increased.
For the biochar pyrolyzed at 950 °C and then chemically activated, the equilibrium conditions were reached for the removal of all parameters, except for TP (Figure 7b). The initial concentrations of the WW pollutants were 376 mg L−1 for COD, 27.8 mg L−1 for N-NH4+, 0.61 mg L−1 for N-NO3-, and 5.0 mg L−1 for TP. COD, N-NH4+, and N-NO3 showed constant removal yields for concentrations higher than 4.2 gbiochar LWW−1, equal to approximately 37, 35, and 60%, respectively. Meanwhile, for TP, the yield decreased from 51 to 39%, as already observed in Figure 7a. Therefore, for the biochar pyrolyzed at 950 °C and activated, the optimal concentration for maximum pollutant removal was 4.2 gbiochar LWW−1.

3.4. Future Outlooks

In the scientific background, most of the studies on adsorption are based on synthetic aqueous solutions and simulated WW containing single pollutants. As Deng et al. [59] and Rangabhashiyam et al. [60] pointed out, these limitations should be overcome. The strengths of this work were (i) the use of real WW from full-scale WWTPs containing simultaneously different pollutants, (ii) the comparison of different thermochemical treatments during biochar preparation, and (iii) the evaluation of the simultaneous removal of single and multi-component pollutants. However, further future experimental tests are needed to determine (i) the adsorption isotherms of sewage sludge biochar; (ii) the adsorption kinetics of pollutants on sewage sludge biochar; and (iii) the equilibrium adsorption capacities of the pollutants studied. Furthermore, elution tests on biochar could clarify the mechanism of the release and desorption of pollutants in treated water.

4. Conclusions

The direct reuse of WW could be one of the solutions to fight against increasingly worrying drought. Via a survey of the WWTPs in the Lombardy region (Northern Italy), TN, N-NH4+, and TP were found to be the critical parameters that currently stop the direct recovery of WWTP effluents according to the European and national regulations in force. In this study, a final adsorption treatment using biochar filters was proposed to improve the WW quality. Biological sewage sludge was pyrolyzed at different temperatures (350–650–950 °C) and chemically activated with KOH to obtain biochar for batch adsorption tests performed with real WW, 3–6 h biochar–WW contact times, and 0.25–0.4–0.8–1.7–4.0–5.8 gbiochar LWW−1. For the removal of pollutants in real WW, the results show the following optimal operative conditions:
(i)
Pyrolysis at 650 °C + KOH activation for N-NH4+ (32%), P (44%), and N-NO3 (66%);
(ii)
Pyrolysis at 950 °C + KOH activation for COD (50%);
(iii)
A contact time of 6 h in a batch test for COD, N-NH4+, and P, and 3 h for N-NO3;
(iv)
A concentration range of 4.2–5.8 gbiochar LWW−1 for the highest removal yields.
The most promising behaviors of the samples treated at 650 °C and 950 °C compared with the one obtained at 350 °C after the same activation procedure seem to be due to higher C contents and higher amounts of C≡C and C=O residues on the materials’ surfaces, as obtained via the EDS and FT-IR analyses. The preliminary results of this work suggest that the sample obtained at 350 °C, which was richer in Si and poorer in P, is more efficient for the adsorption of P and N species. Studies to understand the adsorption mechanism are in progress.

Supplementary Materials

The following supporting information can be downloaded at https://www.mdpi.com/article/10.3390/w15203636/s1: Figure S1: Thermogravimetric (black line) and weight derivative (blue line) curves obtained for the dried sludge pyrolysed at 350 °C (a) and 950 °C (b); Figure S2: SEM images for (a,b) the dried sludge, the samples pyrolyzed at 350 °C (c) and 650 °C (d), and the samples activated after pyrolysis at 350 °C (e,f) and 650 °C (g,h). Higher magnification: 10,000×; lower magnification: 500×.; Figure S3 XRPD patterns for (a) the dried sludge, (b) the sample pyrolyzed at 650 °C, (c) the sample pyrolyzed at 650 °C and activated.; Figure S4 FT-IR spectra for (a) the dried sludge, (b) the sample pyrolysed at 350 °C, (c) the sample pyrolyzed at 350 °C and activated, (d) the sample pyrolyzed at 950 °C, (e) the sample pyrolysed at 950 °C and activated.

Author Contributions

Conceptualization, M.C.C., F.M.C. and C.M.; methodology, F.M.C., C.M. and M.M.L.; validation, S.B. and S.S.; formal analysis, M.M.L., F.M.C. and C.M.; investigation, F.M.C., C.M., M.M.L. and S.B.; resources, C.M. and M.C.C.; data curation, F.M.C., C.M. and M.M.L.; writing—original draft preparation, F.M.C. and C.M.; writing—review and editing, S.B. and S.S.; visualization, F.M.C. and C.M.; supervision, M.C.C., C.M. and M.M.L.; project administration, M.C.C. and C.M.; funding acquisition, C.M. All authors have read and agreed to the published version of this manuscript.

Funding

This publication is part of the project NODES, which has received funding from the MUR—M4C2 1.5 of the PNRR funded by the European Union—NextGenerationEU (grant agreement no. ECS00000036).

Institutional Review Board Statement

Not applicable.

Informed Consent Statement

Not applicable.

Data Availability Statement

All data generated or analyzed during this study are included in this published article.

Acknowledgments

The authors want to thank Silvia Pennacchio, Alice Silva, and Alessandro Girella for their valuable support in the experimental tests.

Conflicts of Interest

The authors declare no conflict of interest.

Abbreviations

ATRAttenuated total reflectance
BOD5Biological oxygen demand at 5 days
CODChemical oxygen demand
PEPopulation equivalent
PXRDPowder X-ray diffraction
TGAThermogravimetric analysis
TNTotal nitrogen
TPTotal phosphorous
TSSTotal suspended solids
WWWastewater
WWTPWastewater treatment plant

References

  1. Zhao, R.; Sun, H.; Xing, L.; Li, R.; Li, M. Effects of anthropogenic climate change on the drought characteristics in China: From frequency, duration, intensity, and affected area. J. Hydrol. 2023, 617, 129008. [Google Scholar] [CrossRef]
  2. Patra, S.; Shilky; Kumar, A.; Saikia, P. Impact of Land Use Systems and Climate Change on Water Resources: Indian Perspectives. In Advances in Water Resource Planning and Sustainability; Springer Nature: Singapore, 2023; pp. 97–110. [Google Scholar]
  3. Mahmoud, M.A. Impact of Climate Change on the Agricultural Sector in Egypt. In Conventional Water Resources and Agriculture in Egypt; Springer: Berlin/Heidelberg, Germany, 2017; pp. 213–227. [Google Scholar]
  4. Suo, X.; Yu, Z.; Cao, S. Utilizing water resources from the Tibetan Plateau: Benefits, risks, and future research requirements. Catena 2023, 230, 107256. [Google Scholar] [CrossRef]
  5. Marengo, J.A.; Galdos, M.V.; Challinor, A.; Cunha, A.P.; Marin, F.R.; Vianna, M.d.S.; Alvala, R.C.S.; Alves, L.M.; Moraes, O.L.; Bender, F. Drought in Northeast Brazil: A review of agricultural and policy adaptation options for food security. Clim. Resil. Sustain. 2022, 1, e17. [Google Scholar] [CrossRef]
  6. Karimi, V.; Karami, E.; Keshavarz, M. Climate change and agriculture: Impacts and adaptive responses in Iran. J. Integr. Agric. 2018, 17, 1–15. [Google Scholar] [CrossRef]
  7. Kilinc, E.A.; Tanik, A.; Hanedar, A.; Gorgun, E. Climate change adaptation exertions on the use of alternative water resources in Antalya, Türkiye. Front. Environ. Sci. 2023, 10, 162527. [Google Scholar] [CrossRef]
  8. Gil-Meseguer, E.; Bernabé-Crespo, M.B.; Gómez-Espín, J.M. Recycled Sewage—A Water Resource for Dry Regions of Southeastern Spain. Water Resour. Manag. 2019, 33, 725–737. [Google Scholar] [CrossRef]
  9. European Union Regulation (EU) 2020/741 of the European Parliament and of the Council of 25 May 2020 on Minimum Requirements for Water Reuse. Available online: https://eur-lex.europa.eu/legal-content/EN/TXT/?uri=CELEX%3A32020R0741 (accessed on 14 July 2023).
  10. Vasantha Raman, N.; Dubey, A.; Millar, E.; Nava, V.; Leoni, B.; Gallego, I. Monitoring contaminants of emerging concern in aquatic systems through the lens of citizen science. Sci. Total Environ. 2023, 874, 162527. [Google Scholar] [CrossRef]
  11. Salgot, M.; Folch, M. Wastewater treatment and water reuse. Curr. Opin. Environ. Sci. Health 2018, 2, 64–74. [Google Scholar] [CrossRef]
  12. United Nations Sustainable Development Goals. Available online: https://sdgs.un.org/goals (accessed on 21 July 2023).
  13. Tarpani, R.R.Z.; Azapagic, A. Life cycle costs of advanced treatment techniques for wastewater reuse and resource recovery from sewage sludge. J. Clean. Prod. 2018, 204, 832–847. [Google Scholar] [CrossRef]
  14. Gopinath, A.; Divyapriya, G.; Srivastava, V.; Laiju, A.R.; Nidheesh, P.V.; Kumar, M.S. Conversion of sewage sludge into biochar: A potential resource in water and wastewater treatment. Environ. Res. 2021, 194, 110656. [Google Scholar] [CrossRef] [PubMed]
  15. Collivignarelli, M.C.; Canato, M.; Abbà, A.; Carnevale Miino, M. Biosolids: What are the different types of reuse? J. Clean. Prod. 2019, 238, 117844. [Google Scholar] [CrossRef]
  16. Collivignarelli, M.C.; Abbà, A.; Frattarola, A.; Miino, M.C.; Padovani, S.; Katsoyiannis, I.; Torretta, V. Legislation for the reuse of biosolids on agricultural land in Europe: Overview. Sustainability 2019, 11, 6015. [Google Scholar] [CrossRef]
  17. Ifthikar, J.; Jiao, X.; Ngambia, A.; Wang, T.; Khan, A.; Jawad, A.; Xue, Q.; Liu, L.; Chen, Z. Facile One-Pot Synthesis of Sustainable Carboxymethyl Chitosan—Sewage Sludge Biochar for Effective Heavy Metal Chelation and Regeneration. Bioresour. Technol. 2018, 262, 22–31. [Google Scholar] [CrossRef] [PubMed]
  18. Fan, X.; Qian, Z.; Liu, J.; Geng, N.; Hou, J.; Li, D. Investigation on the adsorption of antibiotics from water by metal loaded sewage sludge biochar. Water Sci. Technol. 2021, 83, 739–750. [Google Scholar] [CrossRef]
  19. Campo, G.; Cerutti, A.; Lastella, C.; Leo, A.; Panepinto, D.; Zanetti, M.; Ruffino, B. Production and Destination of Sewage Sludge in the Piemonte Region (Italy): The Results of a Survey for a Future Sustainable Management. Int. J. Environ. Res. Public Health 2021, 18, 3556. [Google Scholar] [CrossRef]
  20. Hu, J.; Zhao, L.; Luo, J.; Gong, H.; Zhu, N. A sustainable reuse strategy of converting waste activated sludge into biochar for contaminants removal from water: Modifications, applications and perspectives. J. Hazard. Mater. 2022, 438, 129437. [Google Scholar] [CrossRef]
  21. ISPRA Special Waste Report. Available online: https://www.isprambiente.gov.it/it/pubblicazioni/rapporti/rapporto-rifiuti-speciali-edizione-2022 (accessed on 17 July 2023). (In Italian)
  22. Regkouzas, P.; Diamadopoulos, E. Adsorption of selected organic micro-pollutants on sewage sludge biochar. Chemosphere 2019, 224, 840–851. [Google Scholar] [CrossRef]
  23. Godvin Sharmila, V.; Kumar Tyagi, V.; Varjani, S.; Rajesh Banu, J. A review on the lignocellulosic derived biochar-based catalyst in wastewater remediation: Advanced treatment technologies and machine learning tools. Bioresour. Technol. 2023, 387, 129587. [Google Scholar] [CrossRef] [PubMed]
  24. Sun, J.; Norouzi, O.; Mašek, O. A state-of-the-art review on algae pyrolysis for bioenergy and biochar production. Bioresour. Technol. 2022, 346, 126258. [Google Scholar] [CrossRef]
  25. Singh, V.; Srivastava, V.C. Waste-derived biochar/carbon for various environmental and energy applications. In Green Nanomaterials for Industrial Applications; Elsevier: Amsterdam, The Netherlands, 2022; pp. 339–363. [Google Scholar]
  26. Ghodake, G.S.; Shinde, S.K.; Kadam, A.A.; Saratale, R.G.; Saratale, G.D.; Kumar, M.; Palem, R.R.; AL-Shwaiman, H.A.; Elgorban, A.M.; Syed, A.; et al. Review on biomass feedstocks, pyrolysis mechanism and physicochemical properties of biochar: State-of-the-art framework to speed up vision of circular bioeconomy. J. Clean. Prod. 2021, 297, 126645. [Google Scholar] [CrossRef]
  27. Liu, H.; Xu, F.; Xie, Y.; Wang, C.; Zhang, A.; Li, L.; Xu, H. Effect of modified coconut shell biochar on availability of heavy metals and biochemical characteristics of soil in multiple heavy metals contaminated soil. Sci. Total Environ. 2018, 645, 702–709. [Google Scholar] [CrossRef] [PubMed]
  28. Kumar, M.; Ambika, S.; Hassani, A.; Nidheesh, P.V. Waste to catalyst: Role of agricultural waste in water and wastewater treatment. Sci. Total Environ. 2023, 858, 159762. [Google Scholar] [CrossRef] [PubMed]
  29. Lima, I.M.; Boateng, A.A.; Klasson, K.T. Physicochemical and adsorptive properties of fast-pyrolysis bio-chars and their steam activated counterparts. J. Chem. Technol. Biotechnol. 2010, 85, 1515–1521. [Google Scholar] [CrossRef]
  30. Do Minh, T.; Song, J.; Deb, A.; Cha, L.; Srivastava, V.; Sillanpää, M. Biochar based catalysts for the abatement of emerging pollutants: A review. Chem. Eng. J. 2020, 394, 124856. [Google Scholar] [CrossRef]
  31. Zeghioud, H.; Fryda, L.; Djelal, H.; Assadi, A.; Kane, A. A comprehensive review of biochar in removal of organic pollutants from wastewater: Characterization, toxicity, activation/functionalization and influencing treatment factors. J. Water Process Eng. 2022, 47, 102801. [Google Scholar] [CrossRef]
  32. Kamali, M.; Appels, L.; Kwon, E.E.; Aminabhavi, T.M.; Dewil, R. Biochar in water and wastewater treatment—A sustainability assessment. Chem. Eng. J. 2021, 420, 129946. [Google Scholar] [CrossRef]
  33. Mohan, D.; Sarswat, A.; Ok, Y.S.; Pittman, C.U. Organic and inorganic contaminants removal from water with biochar, a renewable, low cost and sustainable adsorbent—A critical review. Bioresour. Technol. 2014, 160, 191–202. [Google Scholar] [CrossRef]
  34. Zeng, H.; Qi, W.; Zhai, L.; Wang, F.; Zhang, J.; Li, D. Preparation and Characterization of Sludge-Based Magnetic Biochar by Pyrolysis for Methylene Blue Removal. Nanomaterials 2021, 11, 2473. [Google Scholar] [CrossRef]
  35. Li, J.; Li, B.; Huang, H.; Lv, X.; Zhao, N.; Guo, G.; Zhang, D. Removal of phosphate from aqueous solution by dolomite-modified biochar derived from urban dewatered sewage sludge. Sci. Total Environ. 2019, 687, 460–469. [Google Scholar] [CrossRef]
  36. Shen, T.; Tang, Y.; Lu, X.Y.; Meng, Z. Mechanisms of copper stabilization by mineral constituents in sewage sludge biochar. J. Clean. Prod. 2018, 193, 185–193. [Google Scholar] [CrossRef]
  37. Zhang, L.; Pan, J.; Liu, L.; Song, K.; Wang, Q. Combined physical and chemical activation of sludge-based adsorbent enhances Cr(Ⅵ) removal from wastewater. J. Clean. Prod. 2019, 238, 117904. [Google Scholar] [CrossRef]
  38. Wang, X.; Guo, Z.; Hu, Z.; Zhang, J. Recent advances in biochar application for water and wastewater treatment: A review. PeerJ 2020, 8, e9164. [Google Scholar] [CrossRef] [PubMed]
  39. Mulchandani, A.; Westerhoff, P. Recovery opportunities for metals and energy from sewage sludges. Bioresour. Technol. 2016, 215, 215–226. [Google Scholar] [CrossRef] [PubMed]
  40. Lombardy Region SIRe Acque. Available online: https://www.regione.lombardia.it/wps/portal/istituzionale/HP/DettaglioServizio/servizi-e-informazioni/Enti-e-Operatori/Territorio/governo-delle-acque/servizio-idrico-integrato/sire-acque-controllo-scarichi-impianti-trattamento-acque-reflue-urbane/sire-acq (accessed on 14 July 2023). (In Italian).
  41. Italian Republic DECREE 12 June 2003, No. 185. Regulation Containing TECHNICAL standards for the Reuse of Wastewater in Implementation of article 26, Paragraph 2, of the Legislative Decree 11 May 1999, n. 152. Available online: https://www.gazzettaufficiale.it/eli/id/2003/07/23/003G0210/sg (accessed on 14 July 2023).
  42. Lombardy Region Regional Regulation 29 March 2019, n. 6. Available online: https://www.regione.lombardia.it/wps/portal/istituzionale/HP/DettaglioRedazionale/servizi-e-informazioni/Enti-e-Operatori/territorio/governo-delle-acque/scarichi-acque-reflue-impianti-depurazione/scarichi-acque-reflue-impianti-depurazione (accessed on 18 July 2023). (In Italian).
  43. ASTM D3860-98(2020); Standard Practice for Determination of Adsorptive Capacity of Activated Carbon by Aqueous Phase Isotherm Technique. ASTM International: West Conshohocken, PA, USA, 2020.
  44. ISPRA. Measurement Procedure for the Determination of the Chemical Oxygen Demand (COD) by Cuvette Test: Method 5135; ISPRA: Rome, Italy, 2014; p. 88. (In Italian) [Google Scholar]
  45. APAT-IRSA-CNR; Analytical Methods for Water. Section 4000—Non-Metallic Inorganics. 4030—Ammonia Nitrogen. Non-Metallic Inorganic Constituents. Method A1—Spectrophotometric Determination of Indophenol. Italian Agency for the Protection of the Environment and for Technical Services: Rome, Italy, 2003. (In Italian)
  46. U.S. EPA. Method 300.1; Determination of Inorganic Anions in Drinking Water by Ion Chromatography—Revision 1.0. United States Environmental Protection Agency: Cincinnati, OH, USA, 1997.
  47. U.S. EPA. Method 3051A (SW-846); Microwave Assisted Acid Digestion of Sediments, Sludges, and Oils—Revision 1.0. United States Environmental Protection Agency: Washington, DC, USA, 2007.
  48. U.S. EPA. Method 6010D (SW-846); Inductively Coupled Plasma—Optical Emission Spectrometry—Revision 5.0. United States Environmental Protection Agency: Washington, DC, USA, 2018.
  49. Brebu, M.; Vasile, C. Thermal degradation of lignin—A review. Cellul. Chem. Technol. 2010, 44, 353–363. [Google Scholar]
  50. Shon, H.K.; Vigneswaran, S.; Snyder, S.A. Effluent Organic Matter (EfOM) in Wastewater: Constituents, Effects, and Treatment. Crit. Rev. Environ. Sci. Technol. 2006, 36, 327–374. [Google Scholar] [CrossRef]
  51. Luo, M.; Lin, H.; He, Y.; Li, B.; Dong, Y.; Wang, L. Efficient simultaneous removal of cadmium and arsenic in aqueous solution by titanium-modified ultrasonic biochar. Bioresour. Technol. 2019, 284, 333–339. [Google Scholar] [CrossRef]
  52. Devi, P.; Saroha, A.K. Utilization of sludge based adsorbents for the removal of various pollutants: A review. Sci. Total Environ. 2017, 578, 16–33. [Google Scholar] [CrossRef]
  53. Yu, L.; Zhong, Q. Preparation of adsorbents made from sewage sludges for adsorption of organic materials from wastewater. J. Hazard. Mater. 2006, 137, 359–366. [Google Scholar] [CrossRef]
  54. Hadi, P.; Xu, M.; Ning, C.; Sze Ki Lin, C.; McKay, G. A critical review on preparation, characterization and utilization of sludge-derived activated carbons for wastewater treatment. Chem. Eng. J. 2015, 260, 895–906. [Google Scholar] [CrossRef]
  55. Martin, M.J.; Serra, E.; Ros, A.; Balaguer, M.D.; Rigola, M. Carbonaceous adsorbents from sewage sludge and their application in a combined activated sludge-powdered activated carbon (AS-PAC) treatment. Carbon 2004, 42, 1389–1394. [Google Scholar] [CrossRef]
  56. Tang, Y.; Alam, M.S.; Konhauser, K.O.; Alessi, D.S.; Xu, S.; Tian, W.; Liu, Y. Influence of pyrolysis temperature on production of digested sludge biochar and its application for ammonium removal from municipal wastewater. J. Clean. Prod. 2019, 209, 927–936. [Google Scholar] [CrossRef]
  57. Elkhlifi, Z.; Sellaoui, L.; Zhao, M.; Ifthikar, J.; Jawad, A.; Shahib, I.I.; Sijilmassi, B.; Lahori, A.H.; Selvasembian, R.; Meili, L.; et al. Lanthanum hydroxide engineered sewage sludge biochar for efficient phosphate elimination: Mechanism interpretation using physical modelling. Sci. Total Environ. 2022, 803, 149888. [Google Scholar] [CrossRef] [PubMed]
  58. Hwang, H.-R.; Choi, W.-J.; Kim, T.-J.; Kim, J.-S.; Oh, K.-J. The preparation of an adsorbent from mixtures of sewage sludge and coal-tar pitch using an alkaline hydroxide activation agent. J. Anal. Appl. Pyrolysis 2008, 83, 220–226. [Google Scholar] [CrossRef]
  59. Deng, Y.; Huang, Q.; Gu, W.; Li, S. Application of sludge-based biochar generated by pyrolysis: A mini review. Energy Sources Part A Recover. Util. Environ. Eff. 2020, 00, 1–10. [Google Scholar]
  60. Rangabhashiyam, S.; Lins, P.V.d.S.; Oliveira, L.M.T.d.M.; Sepulveda, P.; Ighalo, J.O.; Rajapaksha, A.U.; Meili, L. Sewage sludge-derived biochar for the adsorptive removal of wastewater pollutants: A critical review. Environ. Pollut. 2022, 293, 118581. [Google Scholar] [CrossRef]
Figure 1. Potential classes of WWTPs in the Lombardy region, referring to the years (a) 2019 and (b) 2022. PE: population equivalent; n.d.: no data.
Water 15 03636 g001
Figure 2. Water line treatments of Lombardy WWTPs: (a) 2019; (b) 2022. P: primary treatment; S: secondary treatment; deN: specific treatments for nitrogen; deP: specific treatments for phosphorus; deNP: specific treatments for nitrogen and phosphorus; otherT: other treatments not specified.
Water 15 03636 g002
Figure 3. Compliance with the legislative requirements for direct reuse referring to the effluents of Lombardy WWTPs in the years 2019 and 2022. European and Italian requirements [9,41]: BOD5 ≤ 10 mg L−1; COD ≤ 100 mg L−1; SS ≤ 10 mg L−1; TP ≤ 2 mg L−1; TN ≤ 15 mg L−1; and NH4 ≤ 2 mg L−1. (a) 400 < PE < 2000; (b) 2000 ≤ PE < 10,000; (c) 10,000 ≤ PE < 50,000; (d) PE ≥ 50,000. In: regulatory limit respected; Out: regulatory limit not respected; n.d.: no data.
Water 15 03636 g003
Figure 4. Compliance with the legislative requirements of the Lombardy region for direct reuse referring to the effluents of Lombardy WWTPs of ≥50,000 PE in the years 2019 and 2022. Lombardy requirements [42]: COD ≤ 60 mg L−1 for PE ≥ 50,000; TP ≤ 1 mg L−1 for PE ≥ 50,000; TN ≤ 10 mg L−1 for PE ≥ 100,000. In: regulatory limit respected; Out: regulatory limit not respected; n.d.: no data.
Water 15 03636 g004
Figure 5. Thermogravimetric (black line) and weight derivative (blue line) curves obtained for the dried sludge.
Water 15 03636 g005
Figure 6. Yields of chemical parameter removal in WW for different thermochemical treatments of biochar. (a) COD; (b) N-NH4+; (c) N-NO3; (d) Pyro: pyrolysis; act: chemical activation; COD: chemical oxygen demand; TP: total phosphorous. 3 h; 6 h: contact times between biochar and WW during the experimental tests.
Water 15 03636 g006
Figure 7. COD, N-NH4+, N-NO3, and TP removal yields as a function of biochar concentration in treated WW. (a) Pyrolysis at 650 °C + chemical activation; (b) pyrolysis at 950 °C + chemical activation. COD: chemical oxygen demand; TP: total phosphorous.
Water 15 03636 g007
Table 1. Reclaimed WW quality requirements for direct reuse at European and Italian levels. PE: population equivalent; BOD5: biological oxygen demand at 5 days; COD: chemical oxygen demand.
ParameterSource of the Legislation and Limit Value (mg L−1)References
BOD5EU: 10 (*)[9]
CODItaly: 100[41]
Lombardy: 60; PE ≥ 50,000[42]
TSSEU, Italy: 10 (*) [9,41]
TPItaly: 2[41]
Lombardy: 1 (**) (PE ≥ 50,000)[42]
TNItaly: 15[41]
Lombardy: 10 (PE ≥ 100,000)[42]
NH4Italy: 2[41]
Notes: (*) The European requirements relating to the quality of treated WW refer to irrigation reuse in agriculture. (**) Refers to effluents delivered outside drainage basins to lakes.
Table 2. Qualitative characteristics of real WW. n: number of data.
ParameterMean ValueConfidence Interval
pH7.9
(n: 8)
±0.2
COD (mg L−1)362
(n: 8)
±190
N-NH4+ (mg L−1)24.4
(n: 8)
±10.2
N-NO3- (mg L−1)0.6
(n: 8)
±0.1
TP (mg L-1)4.3
(n: 8)
±1.0
Table 3. Elemental compositions of the dried sludge and of the derived biochar powders obtained using EDS analysis (the values are the means of three independent measurements performed on different areas of each sample. Each EDS analysis involved the quantification of the elements in a small portion of the sample. Five different points of interest were analyzed for each sample, and the average values for each element are reported in the table).
SampleWeight %
CONaMgAlSiPSClKCaTiFe
Dried sludge40.6343.530.290.32.552.212.990.96-0.23.54-2.81
Pyrolyzed at 350 °C34.8637.360.280.655.54.585.940.8-0.495.09-4.28
Pyrolyzed at 650 °C26.236.770.290.96.337.026.790.850.270.827.320.276.18
Pyrolyzed at 950 °C24.5134.530.430.897.157.147.970.840.380.969.970.44.85
Pyrolyzed at 350 °C + activation8.7147.97-0.229.2712.811.5--14.482.34-2.69
Pyrolyzed at 650 °C + activation18.446.42-0.2713.6510.380.330.33-7.061.57-1.6
Pyrolyzed at 950 °C + activation18.643.43-0.2813.46.245.090.26-8.051.330.233.08
Disclaimer/Publisher’s Note: The statements, opinions and data contained in all publications are solely those of the individual author(s) and contributor(s) and not of MDPI and/or the editor(s). MDPI and/or the editor(s) disclaim responsibility for any injury to people or property resulting from any ideas, methods, instructions or products referred to in the content.

