
Study on Plugging Material and Plugging Mechanism of Crude Oil Sand Water Filter Pipe
by

Wenhui Zhang
1,
Qingfeng Liu
2,
Hengyu Chen
1,
Huibin Sheng
3,
Jingen Yan
4,
Yongtao Gu
4,
Xianqiang Huang
5,* and
Bingchuan Yang
1,5,* 1
College of Chemistry and Chemical Engineering, Qilu Normal University, Jinan 250013, China
2
Shengli Oil Field Zhongsheng Petroleum Development Company, Dongying 257237, China
3
Shandong Institute of Geophysical and Geochemical Exploration, Jinan 250013, China
4
Gudong Oil Production Plant, Shengli Oilfield Company, China Petroleum Chemical Corporation, Dongying 257237, China
5
School of Chemistry and Chemical Engineering, Liaocheng University, Liaocheng 252059, China
*
Authors to whom correspondence should be addressed.
Water 2023, 15(21), 3714; https://doi.org/10.3390/w15213714
Submission received: 17 August 2023
/
Revised: 2 October 2023
/
Accepted: 18 October 2023
/
Published: 24 October 2023
(This article belongs to the Special Issue Science and Technology for Water Purification)
Abstract
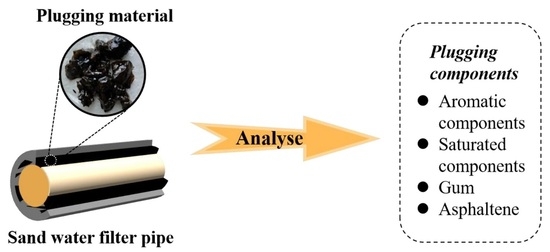
:In order to develop the biological self-cleaning anti-clogging high-permeability sand filter tube, it is very important to analyze the plugging material and plugging mechanism of crude oil sand water filter. Under laboratory conditions, based on vacuum drying, condensation reflux, chromatographic separation, and other technologies, the plugging components were preliminarily analyzed. The plugging components were analyzed via XRD, infrared analysis, 1H NMR, and 13C NMR. Through analysis and testing, XRD results showed that the solid compositions were clay and sand grains. Meanwhile, the infrared analysis, 1H NMR, and 13C NMR demonstrated that the main components of the plug are asphaltene crude oil, and the proportion of aromatic components and saturated components is close.
1. Introduction
Developing the loose sandstone hydrocarbon reservoirs, which account for a large proportion of China’s oil and gas, is crucial [1]. However, frequent sanding from oil wells during development has hindered further development of the loose sandstone oil reservoirs, and the specific nature of the reservoir has been one of the main conflicts in the rapid development of the loose sandstone oil reservoirs [2,3]. As a result, it has become the primary problem in removing the sand out of the well.
The biggest difficulty encountered in the use of conventional sand filter pipes is clogging [4]. The blockage of the sand filter tubes can cause a reduction in the fluid output of oil well or even lead to the blockage of oil wells [5,6]. In addition, replacing the clogged sand filter pipes carries certain risks, as the pipes can easily fracture or break during replacement, leading to wellbore blockage and abandonment [7,8]. The biological self-cleaning anti-clogging high permeability sand filter tube, which has applied electrocatalytic technology, is a new direction for enhanced oil recovery [9,10,11,12]. However, clogging issues have prevented its widespread usage. Consequently, the investigation of crude oil clogging in sand filter pipes and the exploration of clogging mechanisms have emerged as crucial research areas for effective sand control in oil wells [13,14,15].
According to statistical data, the filling layer of polymer-aided flooding reservoirs is severely blocked, resulting in low liquid volume, rapid decrease in liquid volume, and a short effective period [16,17]. Conventional sand control methods have poor adaptability to post-polymer flooding reservoirs during high water cut periods. The main reasons for this include the exacerbation of particle transport caused by polymer carriage and drag, as well as the accumulation of aged polymers, which block the screen pipes and filling layer, leading to a rapid decrease in liquid volume and a shortened effective period [18]. Ma et al. presented a systematic approach to investigate the performance of sand control screens, including the processing of the sand control simulation unit, the analysis of formation parameters, the determining of pressure drop through the sand retaining medium, the calculation of oil-production index, and so on [19]. However, it does not solve the root cause of the clogging problem of clogged sand filter tubes. Therefore, in this paper, we analyzed the blockage mechanism and the blockages in the original oil filter sand pipes. It provides an effective avenue for addressing the problem of blockage of traditional sand control tools.
2. Oilfield Overview
Located in the Yellow River Delta region, Shengli Oilfield, the second largest oilfield in China is situated in the northern part of Shandong Province. Its main working area covers approximately 4.4 × 10⁴ km2. As a typical loose sandstone of a compound oil-bearing basin, Shengli Oilfield is characterized by complex geological conditions, a variety of oil-bearing layers, diverse types of reservoirs, and rich types of oil reservoirs, as well as significant variations in reservoir properties [20,21,22].
Shengli Oilfield has discovered 38 porous sandstone oilfields, with reserves of 3.716 billion tons and an annual output of 23.244 million tons, accounting for more than 80% of the oilfield’s reserves and annual output. As a fundamental technology for developing porous sandstone reservoirs, sand control technology is the dominant technology for ensuring the normal production of such reservoirs. With an average annual construction of 2365 wells, accounting for more than 20% of the oilfield’s measures, sand control plays a critical role in ensuring sustained and stable production of the oilfield [23,24].
3. Experimental Part
3.1. Experimental Reagent
Dichloromethane (analytical pure), petroleum ether (analytical pure), toluene (analytical pure), and alumina (column chromatography grade) were purchased from Shanghai in China. The water is primarily distilled water.
3.2. Experimental Instrument
The Fourier transform infrared spectrometry (FT-IR) analyses were measured on a Nicolet 5700 spectrophotometer in the range of 400–4000 cm−1. 1H NMR and 13C NMR spectra were recorded on a 400 MHz (Bruker Company in German, Bremen Germany) instrument, and CDCl3 (7.26 ppm for 1H NMR, 77.16 ppm for 13C NMR) was used as a reference. The X-ray diffraction (PXRD) patterns were recorded on a Rigaku Smartlab3 X-ray Powder Diffractometer (Rigaku Company in Japan, Tokyo, Japan) equipped with a Cu-sealed tube (λ = 1.54178 Å) in the range of 5° to 50° at room temperature. Microscope visual rheometer (MCR302, Anton Paar, Graz, Steiermark, Austria).
3.3. Crude Oil Composition Analysis
Crude oil samples from wells in different oil blocks were selected for compositional analysis: well 641X15 in Block 641, well 822P5 in Block 821, well 827P1 in Block 827, well 9P13 in Block 9, and well 10N14 in Block 4. Crude oil samples are shown in Figure 1.
4. Analysis of Experiment
Approximately 3 g samples were taken, respectively (as shown in Figure 2), and dried under vacuum at 110 °C and −1000 KPa for 1 h after cooling and weighing (accurate to 0.001 g). For every 1 g of the sample, 30 mL of crude ether was added, boiled, and refluxed in a reflux condenser. The sample was then filtered after standing in a dark condenser at room temperature for 1.5–2.5 h. The insoluble material was extracted with the filtrate, and the liquid at the bottom of the extractor was removed, placed on filter paper, and allowed to evaporate. If there was no residue on the filter paper, a solution of the soluble matter was obtained.
The extraction of the filter paper continued according to the proportion of 30 mL of toluene added to each 1 g of the sample to obtain the asphalt solution. After vacuum drying the soluble component solution with 30 mL of crude ether, it can be separated into three components using a chromatographic column containing alumina in the following order: saturated components, aromatic components, and resin components. After evaporating most of the solvent from the component solution, it was dried under vacuum at 110 °C and −1000 KPa for 1 h, cooled to room temperature, and weighed, and the content of all components was calculated.
4.1. Experimental Results
The experiments showed that the crude oil from the Gudong Oil Production Area of the Shengli Oilfield has a high content of gums and asphaltenes, and the aromatic and saturated fractions are close to each other.
Due to the high gum and asphaltene content, crude oil is easily agglomerated to form a high-viscosity crude oil block while adhering to the surface of pipes, containers, and rock formations. At the same time, due to the strong binding ability, crude oil block partially wrapped in stratum sand and clay, forming inorganic and organic compounds difficult to decompose soft scale block.
Through an NMR analysis of crude oil and blockages, it can be determined that the main component of the crude oil blockage is the asphalt and colloidal components of the crude oil, which have strong adhesion capabilities and cause pore blockage in filter sand pipes, resulting in a gradual reduction in the production liquid over time. We confirmed the proportion of the component of crude oil through five repetitions of the experiment and listed the results of the averages in Table 1.
4.2. Composition Analysis of Plugging Materials
The samples of pipeline and screen pipe blockages taken from the injection–production wells for sand control in Gudong Oilfield are shown in Figure 3 and Figure 4. In order to analyze the composition of clogging deposits, 3 g of the clogging deposits were weighed and vacuum dried at 110 °C and −1000 KPa for 1 h, followed by cooling and weighing (accurate to 0.001 g).
First, 30 mL of petroleum ether was added to each 1 g sample, which was then boiled and refluxed in a reflux condenser, after which it was allowed to stand for 1.5–2.5 h at room temperature in a dark box. After filtration, the insoluble material was extracted until the liquid at the bottom of the extractor was removed. The liquid is applied to the filter paper and allowed to evaporate. If no residue remains on the filter paper, the result is a soluble solution. The saturated hydrocarbons, aromatic hydrocarbons, and gums from the stopper were separated. Continuing with the same 1 g sample to 30 mL toluene ratio, the filter paper was further extracted, obtaining an asphaltene solution.
The asphaltene in clogging deposits was separated, and clay and sand grains were separated by adding distilled water. The XRD results (Figure 5) showed that the main component of clogging deposits was crude oil (excluding asphaltene), accounting for 61.0%, followed by clay and formation sand, accounting for 20.8%, and asphaltene, accounting for 18.2%. XRD analysis was used to determine the composition of clay and sand grains, which contained 36% quartz (α-SiO2), 21% plagioclase (CaAl2Si2O8), 16% forsterite (Mg2SiO4), 11% aluminosilicate (Al2SiO5), 9% pyroxene (NaAlSi3O8), and 7% clay. The main components are all SiO2 and silicates.
In addition, the blockage sample was subjected to infrared and nuclear magnetic resonance 1H NMR and 13C NMR tests and the results were shown in Figure 6, Figure 7 and Figure 8. An analysis of the test results confirmed that the main component of the blockage was crude oil containing asphaltene, with a similar ratio of aromatic components to saturated components.
The results of the testing of the clogging deposits in the oil pipeline show that it is a mixture of saturated hydrocarbons, unsaturated alkenes, and aromatic hydrocarbons, as revealed in the NMR spectrum. The infrared spectrum shows a vibration peak of double bonds at 1800, indicating the presence of unsaturated hydrocarbons, and the characteristic C-H of aromatic ring absorption peak at 750 cm−1. The hydrogen spectrum of the mixture shows saturated hydrogen atoms at 1–2.5 chemical shifts, olefinic hydrogen atoms at 3.5–4.5, and aromatic hydrogen atoms at 6.0–8.0. The carbon spectrum of the mixture confirms this, with many saturated hydrocarbon peaks below 100 chemical shifts and many aromatic and unsaturated hydrocarbon peaks at 120–145.
5. Analysis of Clogging Mechanism
5.1. With the Decrease of Temperature, the Viscosity of Crude Oil
After the crude oil well enters the production period, with the passage of time, the formation temperature decreases, and the viscosity of the crude oil increases. The viscosity–temperature relationship equation is as follows:
lnln(Uo + 1) = A − B.ln(t)
As the viscosity of crude oil increases, it will increase the near-well flow resistance, making it easier for the resin and asphaltene components in the crude oil to coalesce and adhere to the surface of sand control tools. The results in Figure 9 were investigated using a microscope visual rheometer (MCR302, Anton Paar, Graz, Steiermark, Austria).
5.2. Good Wettability of Crude Oil to Stainless Steel
When different phases of substances come into contact, assuming that there is no contact surface, there is no free surface energy. On the contrary, due to the interaction between molecules of each phase, free surface energy can be formed between the contact surfaces of the two phases. The larger the interface between the two phases, the greater the free surface energy. The distribution of fluids in the rock surface and the size and direction of pore capillary force in the reservoir will be directly influenced by the interfacial tension in the reservoir. Thus, the fluid flow in the reservoir will be further affected.
According to the second law of thermodynamics, substances always tend to decrease any of their free energy. Therefore, it is usually achieved by reducing the contact area, such as mercury shrinking into a spherical shape on a desktop, adsorbing molecules of adjacent contact substances, and using wetting to reduce the free energy of the system. In the pores of the rock, the microscopic distribution of oil, gas, and water is influenced by wetting. The wetting phenomenon in the reservoir usually occurs in the small capillaries of the rock. Liquid forms a curved shape in the capillary, thus generating a capillary force, which hinders fluid flow. The capillary force always acts on the non-wetting phase side.
During the water injection process in the reservoir, if the reservoir rock is hydrophilic, the oil can be lifted by the water; if the rock is hydrophobic, a layer of oil will be adsorbed around the pores, and the water can only drive the oil in the middle. Therefore, when the surface of the reservoir rock is hydrophilic, the capillary force is the driving force for water flooding; when the surface of the rock is hydrophobic, the capillary force is the resistance to water flooding. In addition, the migration ability (sensitivity) of particles in the reservoir is also affected by wettability. In the reservoir, particles wetted by the fluid are easily migrated with the fluid, while particles that are not soaked are not easily migrated.
Under certain conditions, the hydrophilicity or hydrophobicity of the sand surface of a filter sand tube can be converted, and this process is called the reversal of wettability. For example, quartz sand is mainly composed of silicates and generally shows hydrophilicity. However, if its surface adsorbs active substances, it can be changed to hydrophobicity, and water does not easily drive out oil. Advanced fatty acids are usually surface-active substances in crude oil. Thus, wettability reversal occurs in the sand of the filter sand tube under the action of surface-active substances. The local action and reversal can cause non-uniform wettability. Therefore, different wettability is exhibited in pores of different sizes (Figure 10).
Due to the strong affinity for crude oil, common metal filter sand tubes have a small wetting angle of crude oil on the metal surface, which makes it easy for crude oil to adsorb and aggregate on the surface. Crude oil contains a large amount of colloidal asphaltene, which makes it easier to agglomerate with clay and sandy layers and change the wettability from hydrophilicity to hydrophobicity, leading to a decrease in the relative permeability of the oil phase in the reservoir rock. In addition, organic deposits will also accumulate on the surface of asphaltene pores, causing the blockage of the reservoir pore throats (Figure 11).
5.3. Low Degree Polymerization of Aromatic Hydrocarbon and Unsaturated Hydrocarbon Occurred in Crude Oil
Comparing the infrared and nuclear magnetic resonance spectra of crude oil and blockages, it can be seen that crude oil contains a large number of saturated hydrocarbons and a small amount of unsaturated hydrocarbons and hydrocarbons. Four-zone blockage 1H NMR and 13C NMR test results and nine-zone blockage 1H NMR and 13C NMR test results were shown in Figure 12. 9P13, 10N14, 641X5, 822P5, 827P1 well crude oil 1H NMR and 13C NMR test results were shown in Figure 13. However, there are few unsaturated hydrocarbons in the blockages, and the proportion of aromatic hydrocarbons increases, shown in Figure 12, yellow box, 1H NMR δ = 7.0–8.0. This proves that under high temperatures, low-degree polymerization of unsaturated hydrocarbons occurs on the surface of the filter sand tube(shown in Figure 13, green box, 1H NMR δ = 4.5–5.5), resulting in low polymerization degree long-chain alkanes and some aromatic hydrocarbons, which, in turn, cause blockage deposits. All the details are shown in Supplementary Materials.
6. Conclusions
This article analyzes the main components of the crude oil in the Gudong oil production area of the Shengli oilfield and the main components of the blockage via on-site sampling. By comparing nuclear magnetic resonance and infrared analysis, we found that the blockage is mainly composed of asphaltenes and resins in crude oil. The asphaltenes and resins stick to the formation sand to form an indissoluble soft scale, which leads to the blocking of the filter sand pipe pores.
The laboratory analysis of the composition of the blockage sample reveals that the main component is crude oil, followed by substances such as clay and formation sand. XRD analysis of the clay and formation sand determines that their main components are silicon dioxide and silicate. Through the nuclear magnetic resonance and infrared analysis of the blockage sample, we determined that its main component is petroleum-containing asphaltene, and a mixture of saturated hydrocarbons, unsaturated olefins, and aromatic hydrocarbons is present.
Comparing the nuclear magnetic resonance of the crude oil and the blockage for the first time, we discovered that the unsaturated components in the crude oil polymerize on the pipeline surface, producing low polymers, which cause pipeline blockages. Through pipeline wettability analysis, we inferred that the pipeline blockage is severe, and the infiltration of crude oil on the pipeline leads to pipeline blockages.
Supplementary Materials
The following supporting information can be downloaded at: https://www.mdpi.com/article/10.3390/w15213714/s1. Figure S1: Blockage PXRD powder diffraction pattern; Figure S2: FT-IR spectra of oil pipeline blockage; Figure S3: Oil production pipeline blockage 1H NMR test results; Figure S4: Oil production pipeline blockage 13C NMR test results; Figure S5: 4-zone blockage 1H NMR test results; Figure S6: 4-zone blockage 13C NMR test results; Figure S7: 9 zone blockage 1H NMR test results; Figure S8: 9 zone blockage 13C NMR test results; Figure S9: 9P13 well crude oil 1H NMR test results; Figure S10: 9P13 well crude oil 13C NMR test results; Figure S11: 10N14 well crude oil 1H NMR test results; Figure S12: 10N14 well crude oil 13C NMR test results; Figure S13: 641X5 well crude oil 1H NMR test results; Figure S14: 641X5 well crude oil 13C NMR test results; Figure S15: 822P5 well crude oil 1H NMR test results; Figure S16: 822P5 well crude oil 13C NMR test results; Figure S17: 827P1 well crude oil 1H NMR test results; Figure S18: 827P1 well crude oil 13C NMR test results.
Author Contributions
Investigation, Q.L. and H.C.; Methodology, H.S. and J.Y.; Project administration, Y.G.; Supervision, B.Y. and X.H.; Writing—original draft, W.Z. All authors have read and agreed to the published version of the manuscript.
Funding
We are grateful to the National Innovation and Entrepreneurship Training Program for College Students (CXCY2023105, S202210447044, 202210447015) for the financial support of this research.
Data Availability Statement
The data used to support the findings of this study are available from the corresponding author upon request.
Conflicts of Interest
The authors declare no conflict of interest.
References
- Liu, J.; Ji, M.; Qin, J. Catalytic Performance of Fe-Rich Sludge in Pyrolysis of Waste Oil Scum as Volatiles and Magnetic Char. Water 2023, 15, 2637. [Google Scholar]
- Ikporo, B.; Sylvester, O. Effect of sand invasion on oil well production: A case study of Garon field in the Niger Delta. Int. J. Eng. Sci. 2015, 4, 64–72. [Google Scholar]
- Naseer, M.T.; Khalid, R.H.; Naseem, S. Static Reservoir Simulations and Seismic Attributes Application to Image the Miocene Deep-Water Reservoirs in Southeast Asia. Water 2023, 15, 2543. [Google Scholar]
- Sanni, S.E.; Adefila, S.S.; Anozie, A.N. Prediction of sand kinematic pressure and fluid-particle interaction coefficient as means of preventing sand-induced corrosion in crude oil pipelines. Ain Shams Eng. J. 2019, 10, 55–62. [Google Scholar]
- Ding, B.; Dong, M. Optimization of plugging high mobility zones in oil sands by injection of oil-in-water emulsion: Experimental and modeling study. Fuel 2019, 257, 116024. [Google Scholar]
- Hua, Z.; Lin, M.; Dong, Z. Study of deep profile control and oil displacement technologies with nanoscale polymer microspheres. J. Colloid Interface Sci. 2014, 424, 67–74. [Google Scholar]
- Zhang, Z.; Cao, G.; Zuo, J. Rheological properties and plugging behavior of active crude oil. Pet. Sci. Technol. 2020, 38, 131–145. [Google Scholar]
- Gao, X.; Huang, Q.; Zhang, X. Estimating wax plug transportation force in crude oil pipeline pigging. Energy Fuels 2020, 34, 3110–3120. [Google Scholar]
- Yang, B.; Ma, S.; Cui, R. Simultaneous removal of NOx and SO2 with H2O2 catalyzed by alkali/magnetism-modified fly ash: High efficiency, low cost and catalytic mechanism. Chem. Eng. J. 2019, 359, 233–243. [Google Scholar]
- Huang, X.; Gu, X.; Zhang, H. Decavanadate-based clusters as bifunctional catalysts for efficient treatment of carbon dioxide and simulant sulfur mustard. J. CO2 Util. 2021, 45, 101419. [Google Scholar]
- Yang, B.; Ma, S.; Cui, R. Novel low-cost simultaneous removal of NO and SO2 with ·OH from decomposition of H2O2 catalyzed by alkali-magnetic modified fly ash. Ind. Eng. Chem. Res. 2019, 58, 5339–5347. [Google Scholar]
- Huang, X.; Gu, X.; Qi, Y. Decavanadate-based Transition Metal Hybrids as Bifunctional Catalysts for Sulfide Oxidation and C—C Bond Construction. Chin. J. Chem. 2021, 39, 2495–2503. [Google Scholar]
- Sanni, S.E.; Adefila, S.S.; Anozie, A.N. Mechanisms for Controlling Sand-Induced Corrosion in Horizontal Pipe Flow of Sand, Crude Oil and Water. Open Pet. Eng. J. 2017, 10, 220–238. [Google Scholar]
- Dong, W.; Zhang, D.; Wang, K. Investigation on degradation mechanism of polymer blockages in unconsolidated sandstone reservoirs. e-Polymers 2020, 20, 55–60. [Google Scholar]
- Wang, F.; Yang, H.; Jiang, H. Formation mechanism and location distribution of blockage during polymer flooding. J. Pet. Sci. Eng. 2020, 194, 107503. [Google Scholar]
- Nikoo, A.H.; Ghaedi, M.; Malayeri, M.R. Analysis of wellbore clogging by asphaltene deposition using interaction energies. Fuel 2023, 352, 129111. [Google Scholar]
- Dong, C.; Jia, B.; Liu, C. Blocking mechanism and blocking laws experiments of sand retention media in mechanical screens. J. China Univ. Pet. Ed. Nat. Sci. 2011, 35, 82–88. [Google Scholar]
- Ma, C.; Feng, Y.; Deng, J. Experimental investigation of the plugging mechanisms of non-consolidated prepacked gravel screens. Int. J. Hydrogen Energy 2021, 46, 34638–34651. [Google Scholar]
- Ma, C.; Deng, J.; Dong, X. A new laboratory protocol to study the plugging and sand control performance of sand control screens. J. Pet. Sci. Eng. 2020, 184, 106548. [Google Scholar]
- Liu, D.; Liu, H.; Li, L. Corrosion of water injection system in Shengli Oil Field. Anti-Corros. Methods Mater. 2013, 60, 185–193. [Google Scholar]
- Li, C.-F.; Li, Y.; Li, X.-M.; Cao, Y.-B.; Song, Y.-T. The application of microbial enhanced oil recovery technology in Shengli Oilfield. Pet. Sci. Technol. 2015, 33, 556–560. [Google Scholar] [CrossRef]
- Yu, Y.; Zhang, W.; Chen, G. Preparation of petroleum-degrading bacterial agent and its application in remediation of contaminated soil in Shengli Oil Field, China. Environ. Sci. Pollut. Res. 2014, 21, 7929–7937. [Google Scholar] [CrossRef] [PubMed]
- Liu, J.; Song, X.; Sun, R. A Petroleum pollution and the microbial community structure in the soil of Shengli Oilfield. Yingyong Shengtai Xuebao 2014, 25, 850–856. [Google Scholar] [PubMed]
- Wu, X.; Li, S.; Yan, F. The Application of Cluster Analysis Method in Reservoir Evaluation of Qingdong 5 Block in Shengli Oilfield. Adv. Geosci. 2017, 7, 135–141. [Google Scholar] [CrossRef]
Figure 1.
Crude oil samples from the crude oil zone.

Figure 2.
Crude oil samples to be tested in different oil areas.
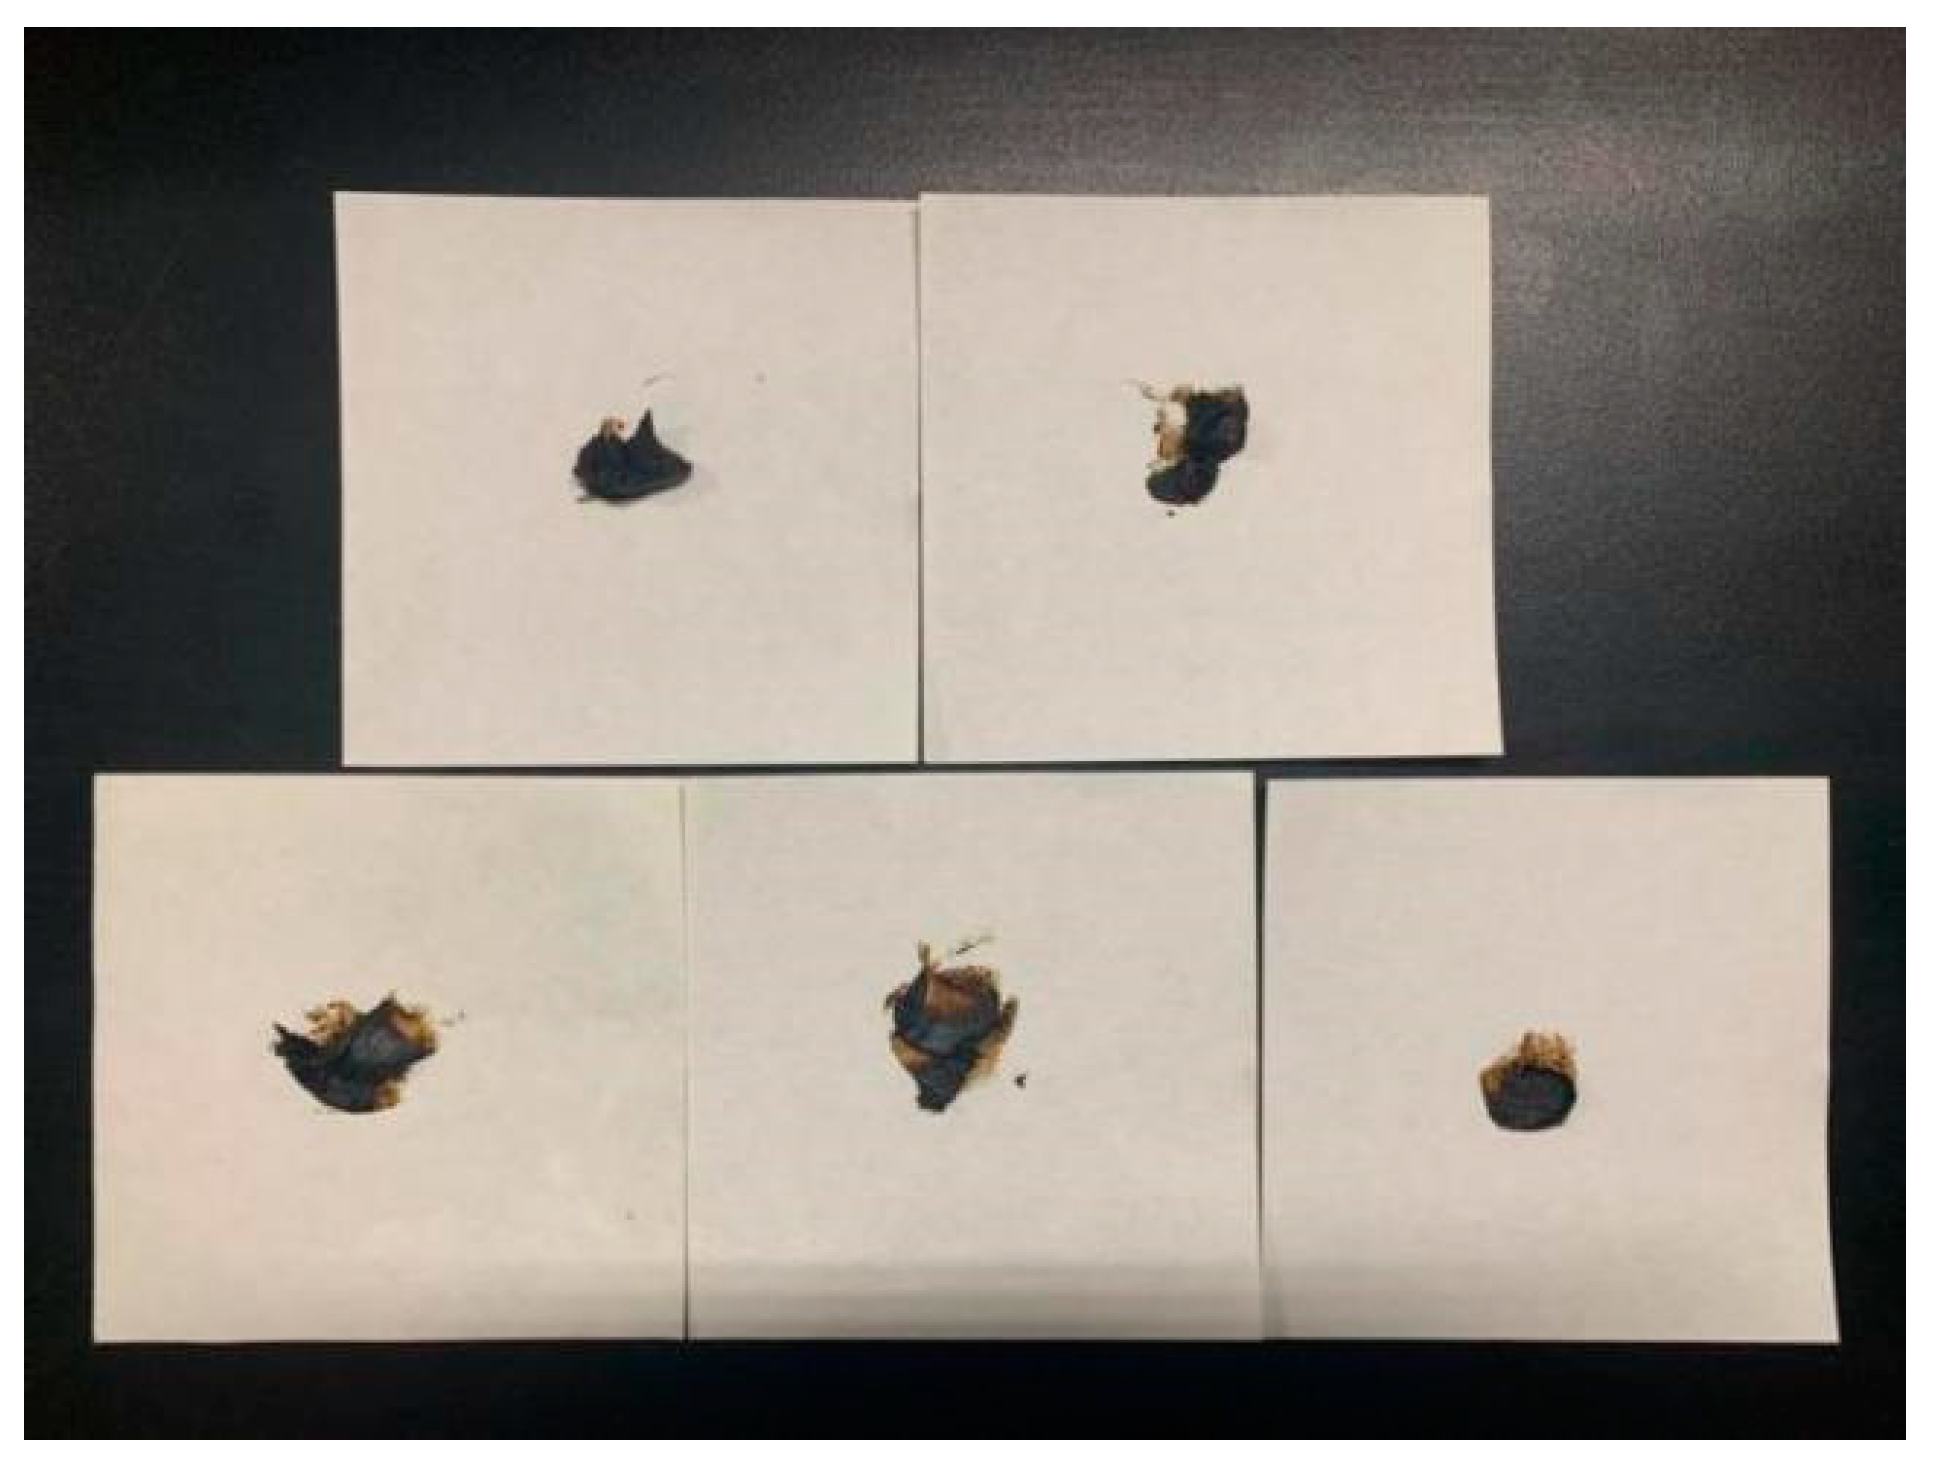
Figure 3.
Oil production pipeline blockage.

Figure 4.
Sand filter pipe blockage.
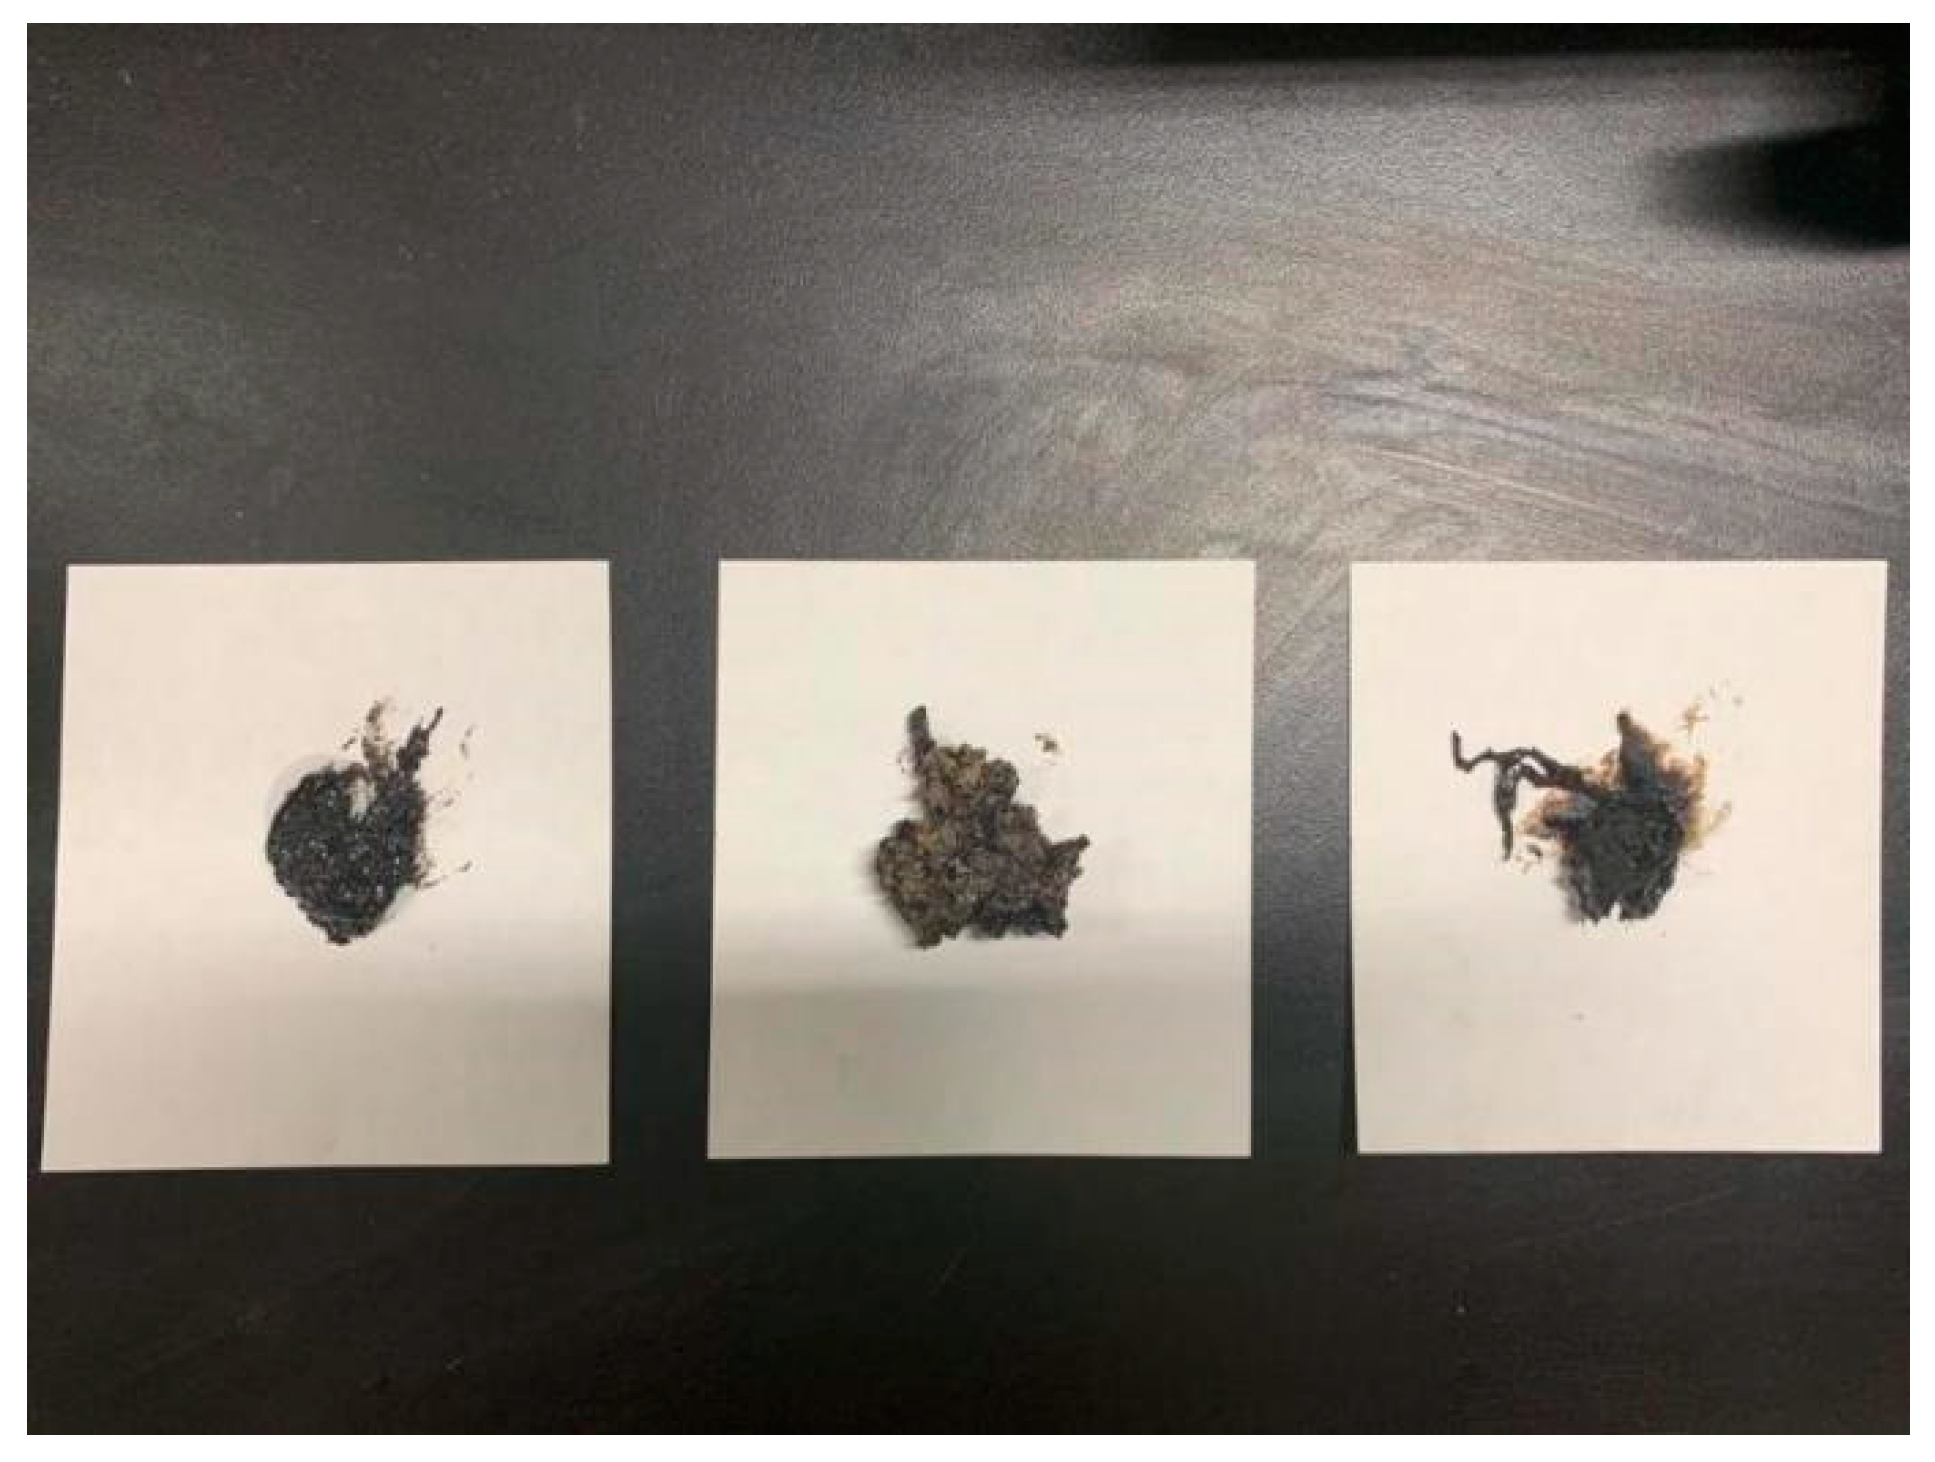
Figure 5.
Blockage XRD powder diffraction pattern.

Figure 6.
Infrared test of oil pipeline blockage.
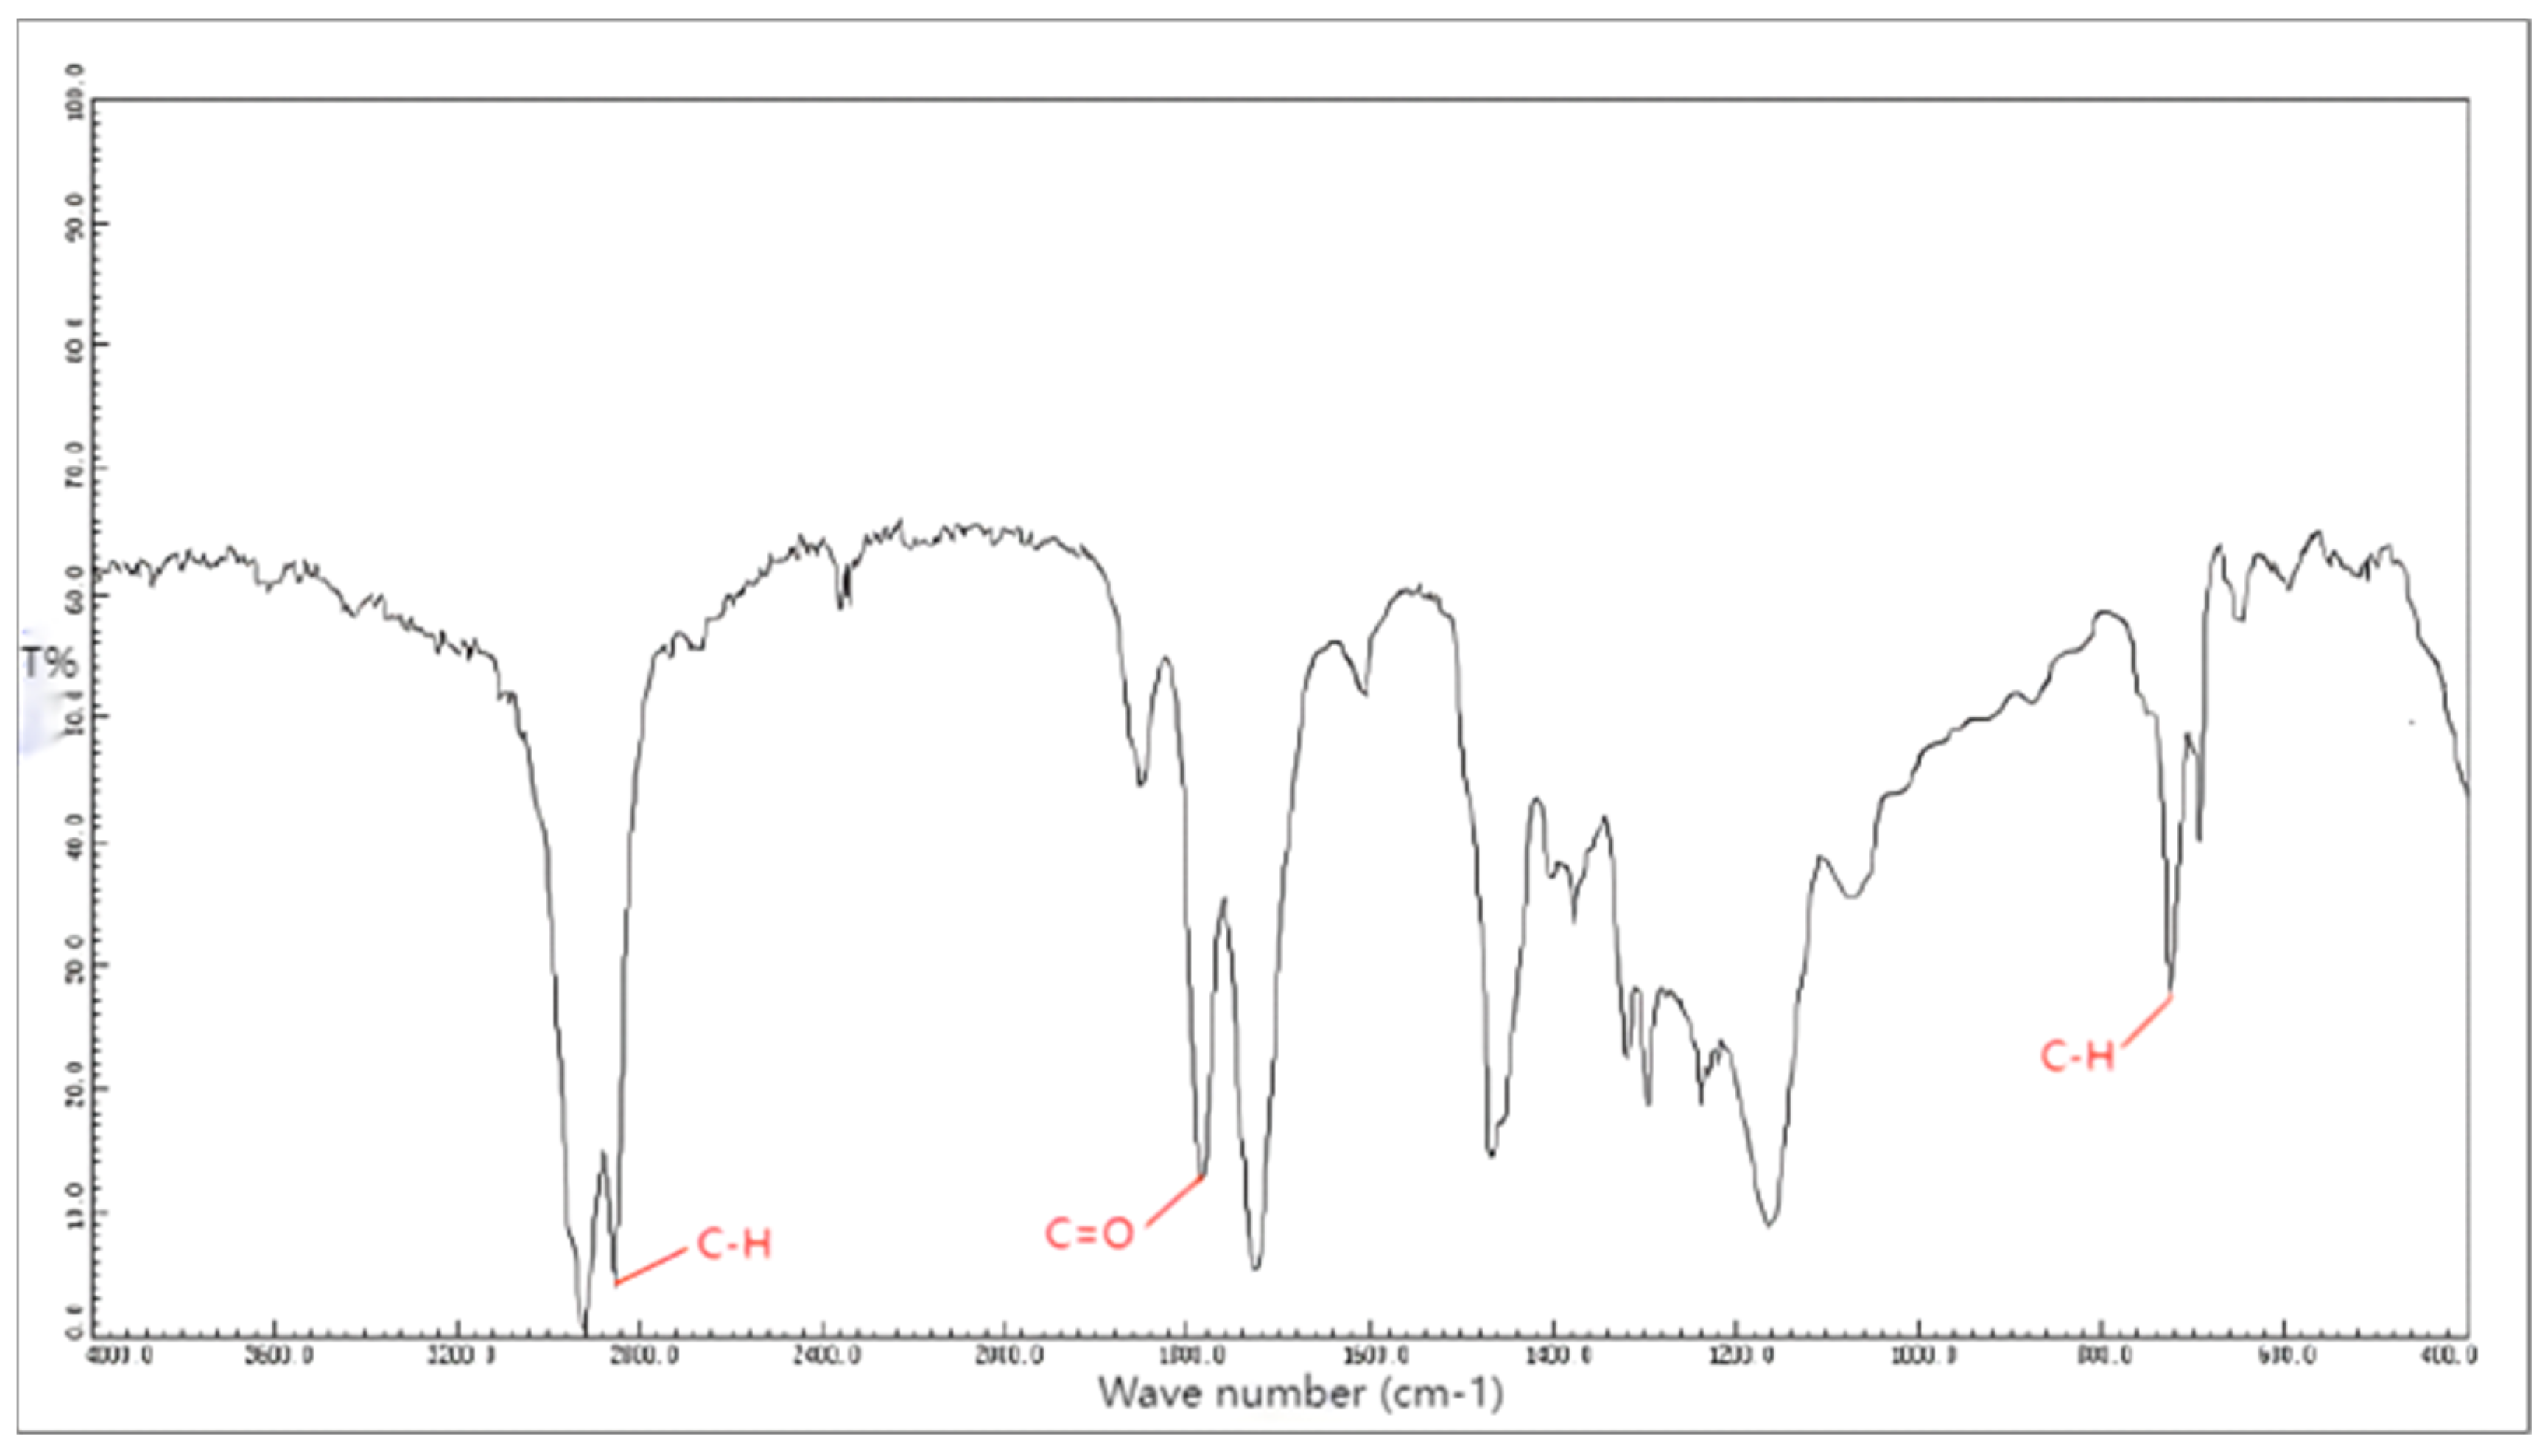
Figure 7.
Oil production pipeline blockage 1H NMR test results.
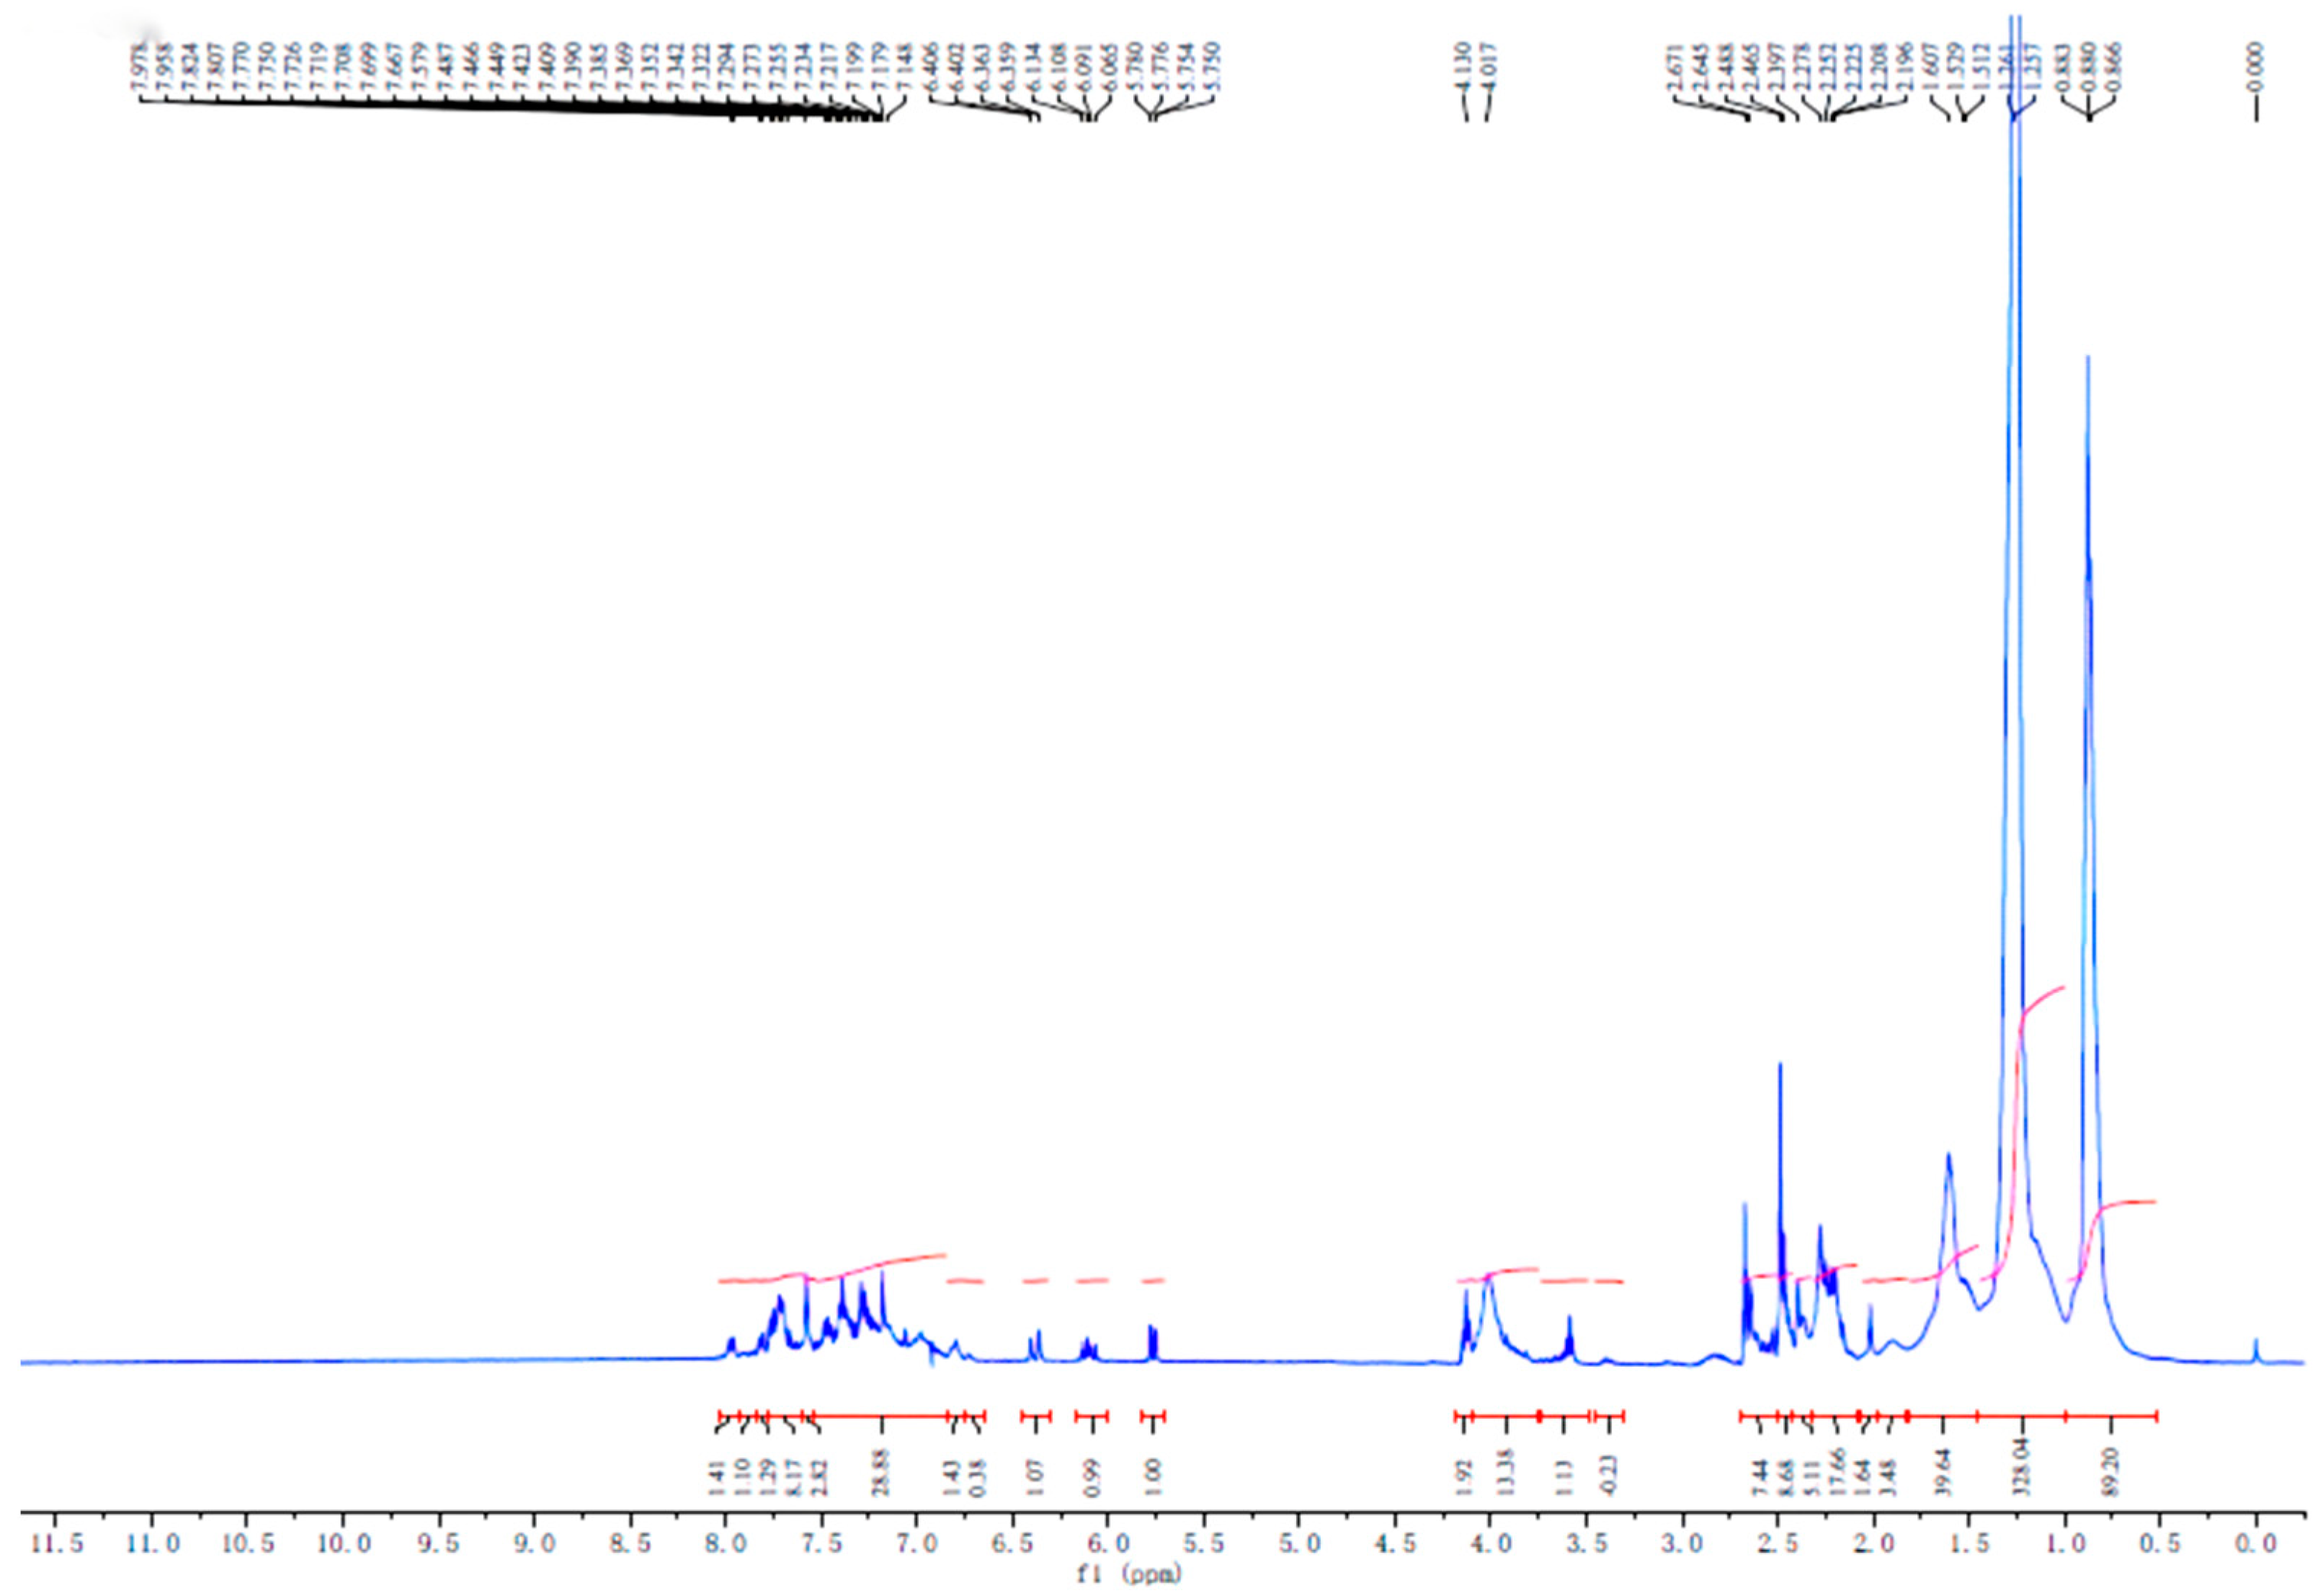
Figure 8.
13C NMR test results of oil production pipeline blockage.

Figure 9.
Crude oil viscosity curve with temperature.
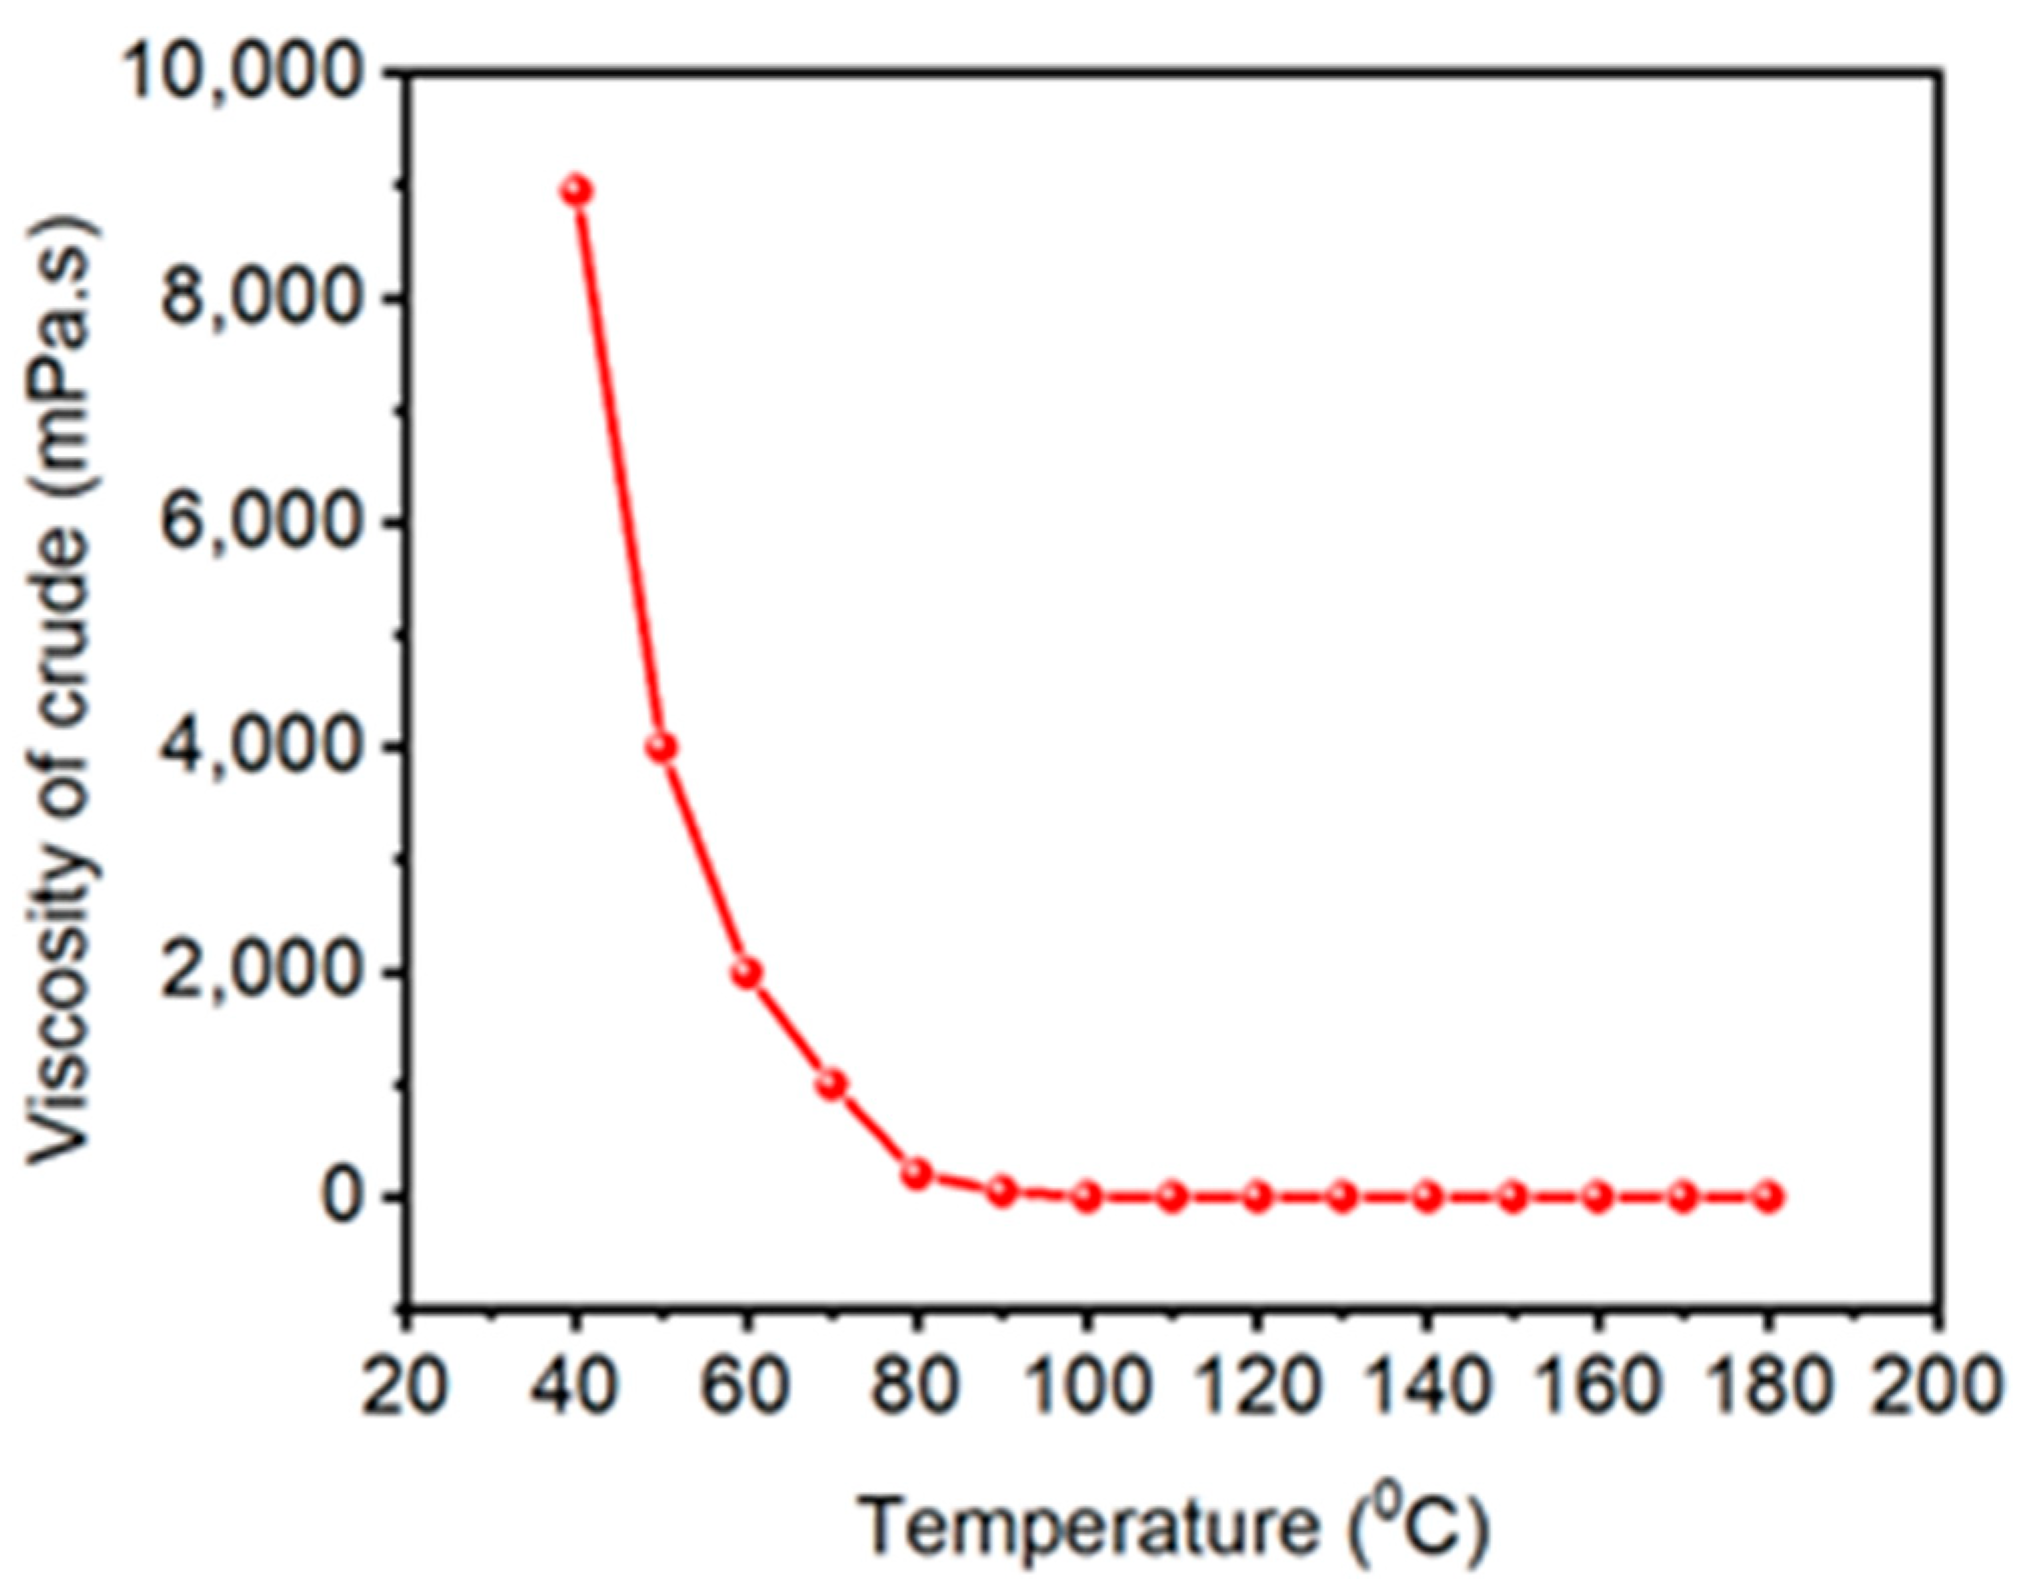
Figure 10.
Contact wetting of substances with different properties.

Figure 11.
Crude oil agglomerates and adsorbs stainless steel wire winding screen tubes.
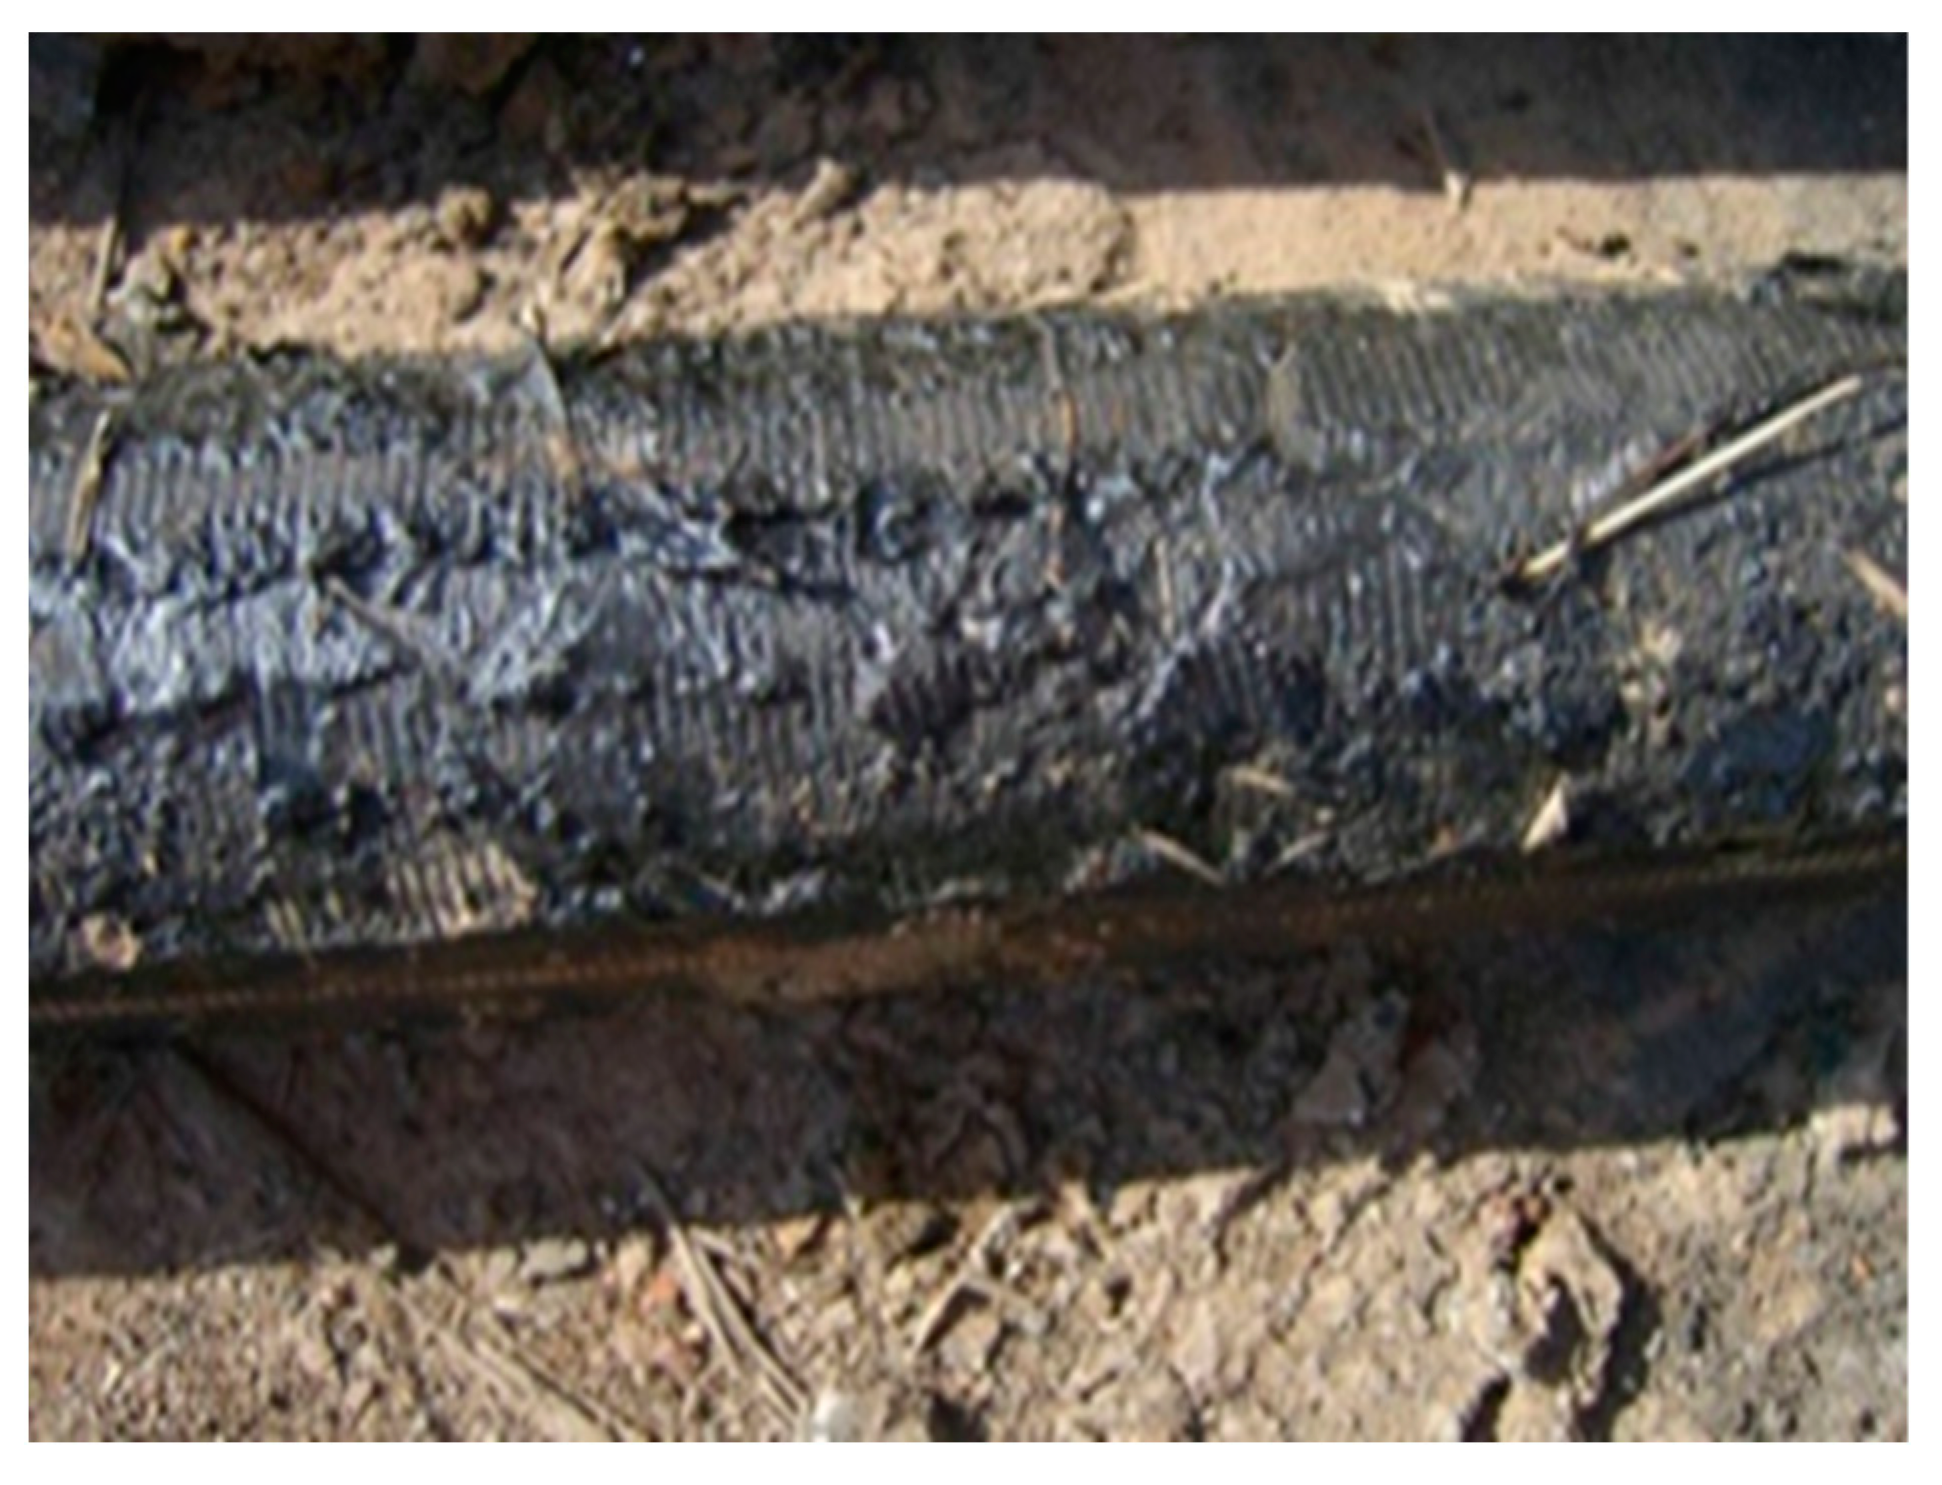
Figure 12.
(a,b) Four-zone blockage 1H NMR and 13C NMR test results; (c,d) nine-zone blockage 1H NMR and 13C NMR test results.
Figure 12.
(a,b) Four-zone blockage 1H NMR and 13C NMR test results; (c,d) nine-zone blockage 1H NMR and 13C NMR test results.

Figure 13.
(a–j) 9P13, 10N14, 641X5, 822P5, 827P1 well crude oil 1H NMR and 13C NMR test results.


Table 1.
Analysis of crude oil composition of different wells in Gudong Oil Production Plant.
| Well Number | Aromatic Components% | Saturated Component% | Gum% | Asphaltene% | Gum + Asphaltene% |
|---|---|---|---|---|---|
| 641-X15 | 32.1 | 31.5 | 28.9 | 7.5 | 36.4 |
| 822-P5 | 28.9 | 29.4 | 33.5 | 8.2 | 41.7 |
| 827-P1 | 31.4 | 28.9 | 32.9 | 6.8 | 39.7 |
| 9-P13 | 26.5 | 27.3 | 38.3 | 7.9 | 46.2 |
| 10-N14 | 33.6 | 32.7 | 25.9 | 7.8 | 33.7 |
Disclaimer/Publisher’s Note: The statements, opinions and data contained in all publications are solely those of the individual author(s) and contributor(s) and not of MDPI and/or the editor(s). MDPI and/or the editor(s) disclaim responsibility for any injury to people or property resulting from any ideas, methods, instructions or products referred to in the content. |
© 2023 by the authors. Licensee MDPI, Basel, Switzerland. This article is an open access article distributed under the terms and conditions of the Creative Commons Attribution (CC BY) license (https://creativecommons.org/licenses/by/4.0/).
Share and Cite
MDPI and ACS Style
Zhang, W.; Liu, Q.; Chen, H.; Sheng, H.; Yan, J.; Gu, Y.; Huang, X.; Yang, B. Study on Plugging Material and Plugging Mechanism of Crude Oil Sand Water Filter Pipe. Water 2023, 15, 3714. https://doi.org/10.3390/w15213714
AMA Style
Zhang W, Liu Q, Chen H, Sheng H, Yan J, Gu Y, Huang X, Yang B. Study on Plugging Material and Plugging Mechanism of Crude Oil Sand Water Filter Pipe. Water. 2023; 15(21):3714. https://doi.org/10.3390/w15213714
Chicago/Turabian StyleZhang, Wenhui, Qingfeng Liu, Hengyu Chen, Huibin Sheng, Jingen Yan, Yongtao Gu, Xianqiang Huang, and Bingchuan Yang. 2023. "Study on Plugging Material and Plugging Mechanism of Crude Oil Sand Water Filter Pipe" Water 15, no. 21: 3714. https://doi.org/10.3390/w15213714
Note that from the first issue of 2016, this journal uses article numbers instead of page numbers. See further details here.