
Assessing the Suitability of the Flood Defense Policy of Republic of Korea for Risk Reduction in Local Rivers
by
 , ,
, ,
Kichul Jung
1,
Heejin An
2,
Sewon Hwang
1,
Seung Beom Seo
3,
Hyemin Park
3,
Chan Park
4 and
Jonghyun Yoo
5,* 1
Division for Integrated Water Management, Korea Environment Institute, Sejong 30147, Republic of Korea
2
Department of Civil, Environmental and Plant Engineering, Konkuk University, Seoul 05029, Republic of Korea
3
International School of Urban Science, University of Seoul, Seoul 02504, Republic of Korea
4
Department of Landscape Architecture, University of Seoul, Seoul 02504, Republic of Korea
5
Department of Urban Planning and Design, University of Seoul, Seoul 02504, Republic of Korea
*
Author to whom correspondence should be addressed.
Water 2023, 15(22), 3908; https://doi.org/10.3390/w15223908
Submission received: 26 September 2023
/
Revised: 3 November 2023
/
Accepted: 7 November 2023
/
Published: 9 November 2023
(This article belongs to the Special Issue The Impact of Climate Change on Watershed Hydrology: Precipitation, Flood, and Drought)
Abstract
:This study examines whether the fluvial flood defense system of Korea is appropriate for risk reduction. Using spatial socioeconomic data and remote sensing, we estimated the potential economic damage that can be caused by the flooding of local streams and rivers along the Nakdong River (the longest river in Korea). For the analysis, a river risk map including return periods (50, 80, 100, and 200 years) and spatial inventories (residential, agricultural, industrial assets, and human lives) was employed to determine flood-prone areas and assess the damage within the inundation areas. A quantitative flood analysis was conducted using an object-based method to estimate the expected annual damage. We then compared the estimated damage for each tributary within the designed return periods and found no correlation. Numerous tributaries with low-defense targets were considered high-risk, while those with high-defense targets were assessed as low-risk. The dataset used in this study covered four damage categories. Among them, flood damage to residential assets appeared to have the highest value, whereas flood damage to industrial assets had the lowest value. The results demonstrate that the Korean government needs to tailor its flood defense policy based on quantitative risk assessments to effectively manage flood risks, especially given the increasing risk of climate change.
1. Introduction
Globally, there has been a significant increase in the number of heavy rainfall events, leading to substantial flood damage [1,2]. With climate change anticipated to amplify the frequency and intensity of such extreme rainfall events in the coming decades, potential damage to both human lives and the economy has become a growing concern [3,4,5]. This trend is not limited to any particular region. For instance, Korea has experienced a rising number of floods over the past decade. Specifically, from 2011 to 2020, excessive rainfall-induced floods resulted in the deaths of 182 individuals and approximating 3 billion USD in damages [6].
Historically, flood defense policies have predominantly focused on hazard reduction, primarily by diminishing the likelihood of flooding events [7]. Nevertheless, this approach has proven inadequate in substantially mitigating flood risks and the resulting damage [8,9]. Recognizing this, several countries, including Germany [10], the UK [11], and the EU [12], have initiated a shift towards risk management. In the coming decades, this defensive strategy could be further enhanced by emerging methods, such as machine learning and artificial intelligence, which offer improved identification of flood-prone areas [13,14,15,16]. Additionally, recent research has provided insights into how climate change influences flood risks both locally [17,18,19] and globally [20,21], thus contributing to the formulation of more informed defense strategies. However, the flood defenses in the Republic of Korea are still based on the classification of rivers rather than assessing real risks, making it challenging to adapt to changing climate conditions [22,23].
This study quantitatively examines this policy issue. First, we assessed the flood risk associated with the local rivers in the Republic of Korea and explored the nature of these risks. We employed an object-based methodology [24] that leveraged diverse spatial and economic datasets [25,26,27,28,29,30,31,32,33] to enable a detailed risk assessment for individual objects. Such an approach, based on geographic information systems (GISs), promises a more harmonized alignment between actual and calculated damage metrics while factoring in the unique spatial attributes of each asset. As a result, it offers a more precise representation of the potential damage. We then compared these risks with the current defense levels for each local river in the Republic of Korea.
Understanding the flood risks in river basins is vital for developing flood defense policies. When assessing these risks, it is essential to determine the spatial dimensions while considering the local environmental, economic, and social contexts within river basins [34,35,36]. By incorporating economic and social valuations, sophisticated decision-making procedures can be developed for flood disaster prevention. This can be achieved through a cost–benefit analysis combined with a flood risk assessment [37]. Policies for flood risk defense based on quantitative risk analysis can serve as effective and efficient tools for flood disaster management [38]. As climate change has led to increasingly unpredictable rainfall patterns, the need for smart and proactive flood defense measures has become more pressing. Considering the time required to modify policies, proactive planning is essential.
2. Dataset
2.1. Study Area
The Nakdong River Basin is located at latitudes of ~35.05° to 37.22° and longitudes of ~127.48° to 129.18°, and it includes the Nakdong, Hyeongsan, Taehwa, and Hoeya∙Suyeong Rivers, along with the east and south coasts of the Nakdong River. The main stream lengths of the Nakdong, Hyeongsan, Taehwa, and Hoeya∙Suyeong Rivers are 7225.38, 270.84, 308.21, and 1779.96 km, and land use of the Nakdong River Basin mostly presents dry paddy fields, rivers, embankments, and rice fields, respectively. In 2019, the population densities of the six sub-basins were 279.8, 311.3, 1322.9, 3362.8, 225.8, and 651.4 people/km2, respectively [39,40]. In this study, 798 local streams and rivers in the Nakdong River zone of the Republic of Korea were analyzed to estimate the flood damage. According to the Korean Annual Disaster Report [41], the cost of flood damage to the Nakdong River from 2011 to 2020 was approximately 1.3 billion USD, accounting for 41% of the total flood damage cost in the Republic of Korea. This significant proportion can be attributed to the occurrence of severe typhoons in this zone, which resulted in significant damage to both general assets and populations due to extreme rainfall. Furthermore, more flood damage occurred in the downstream regions of the Nakdong River, specifically in areas like Namgang Dam, Mirayng-si, and Nakdong River estuary bank, as compared to the upstream regions.
One significant factor contributing to the substantial flood damage in this area is its high population density and concentration of economic assets. This region is home to approximately 13 million people, constituting a quarter of the Republic of Korea’s population. Specifically, the Hoeya∙Suyeong and Taehwa River areas, situated near major cities, have high population densities of 3362.8 and 1322.9 people/km2, respectively. Economic assets are also heavily concentrated in this region, with 34 and 24% of the retail stores and financial institutions of the Republic of Korea being located in this area. Moreover, this area contains the largest farmland in the Republic of Korea and utilizes a substantial portion of its water resources for agriculture. The combination of a dense population and high concentration of economic assets suggests the potential for extensive damage during floods.
Precipitation data from 22 meteorological observatory sites in the Nakdong River zone were analyzed to identify the precipitation trends. We used the Mann–Kendall (MK) test [42,43] for detecting monotonic trends in precipitation variations at these sites. The MK test can provide a statistical assessment when there is a monotonic upward or downward trend in the variations over time. The analysis of precipitation characteristics and variations showed increasing trends in annual precipitation and maximum daily precipitation from 1976 to 2020. The simultaneous variations in precipitation parameters at the 22 meteorological observatories are shown in Table 1. Figure 1 shows the local streams and rivers of the Nakdong River in the Republic of Korea.
2.2. Flood Risk Maps
To calculate flood damage in the local streams and rivers of the Nakdong River, a flood risk map provided by the Ministry of Environment was used to determine the flood-prone areas (https://floodmap.go.kr; accessed on 1 April 2022) [25]. This map describes a nonstructural flood prevention approach intended to overcome the limitations of the Korean flood defense policies that focus on structural flood prevention measures. A flood risk map is a special-purpose map that supports the development of structural and nonstructural measures by establishing a flood prevention plan.
Generally, a map predicts the depth and extent of the inundation caused by flood management failures. It comprises a flood risk map related to river flooding and an inland flooding risk map that reflects the risk of urban inundation resulting from excessive rainfall exceeding the capacity of the drainage system. A flood risk map is a valuable resource for preparing against flood damage, implementing flood damage defense, and formulating relevant flood management strategies. This can also determine the extent of the flood effects at various frequencies. Overall, this nonstructural flood-prevention technique denotes an activity of reducing damage by anticipating a significantly lower range and flood damage.
The spatial range of the flood risk map for river flooding consisted of the target river region, its branches, and the floodplain areas influenced by simulated flooding. The inland flooding risk map presents drainage areas that may experience urban flooding damage due to increased external water levels, the occurrence of extreme rainfall, and the failure of a pump station if the amount of rainfall exceeds the designed drain system. The simulation conditions for the floods occurring in the target area were set to create virtual inundation situations. Based on the simulation analysis, flooding scenarios can be classified as local river inundation caused by river flooding, national river inundation caused by river flooding, or urban inundation caused by drain system failure. National river inundation includes three return periods of 100, 200, and 500 years, and the local river inundation includes four return periods of 50, 80, 100, and 200 years. Urban inundation has three return periods of 30, 50, and 100 years. In this study, we focused on estimating flood damage in flooded areas using inundation simulations, particularly in the context of local river inundation, considering the data availability. Figure 2 illustrates the process of establishing a flood risk map based on local and national river inundations.
2.3. Spatial Inventory
We examined the impact of flood damage on five asset categories, namely residential buildings, agricultural assets (including both structures and crop yields), industrial assets, human impact, and vehicles. We collected the asset value information for each category from various sources [26,27,28,29,30,31,32,33]. Figure 3 presents these five categories along with the data sources used to calculate the damage to each asset.
We calculated the values of human lives and vehicles in each area. Based on the literature, we estimated the loss of human life to be 310 thousand USD [44]. The value of vehicles varied depending on the type and age; however, we assumed the average price of a used car for each vehicle type. For instance, we used an average of 7 and 4.7–8.6 thousand USD for personal and commercial vehicles, respectively [44]. The total value of human lives or vehicles was calculated by multiplying the population or number of vehicles, respectively, by their respective values.
To improve the accuracy of our predictions, we created spatial data for each asset category using a 100 m × 100 m grid system. The Nakdong River in the study region contains approximately 4.6 million such grids. Each grid contains data on all five asset types. Information on residential buildings and agricultural assets was supplied at an individual property level. For example, the building registry and property appraisal database of the Ministry of Land, Transport, and Maritime Affairs (MOLIT) [27,28] includes geophysical data for all houses in the research region, such as location, size, height, and price. Similarly, for all agricultural assets, a remote sensing-based farm map provided by the Ministry of Agriculture, Food, and Rural Affairs (MAFRA) [26] included spatial information on the location, size, and crop types of all farmlands. Therefore, we allocated these data to the corresponding grids to construct a gridded asset inventory.
In contrast, data for population and vehicle counts were obtained at a broader administrative level, such as the county or town level [29,30]. Thus, we reallocated these district-level data to our high-resolution 100 m × 100 m grid system. The total ground area of residential buildings served as a weighting factor when allocating the data [27]. This procedure is based on our assumption that damage to human lives and vehicles primarily occurs in residential areas, in line with the statistical records from Korea.
All asset values are based on 2019 prices. When the original 2019 data were unavailable, we adjusted the prices to 2019 levels using the CPI of Korea [45].
3. Methodology
3.1. Development of Flood Risk Measurement Methodology in Republic of Korea
Several methodologies have been explored to estimate the cost of flood damage on the social and economic development of the Republic of Korea. Initially, in 1993, a simple method was applied to estimate the flood damage. It focused on agricultural assets and involved multiplying them with coefficients obtained based on the cost of damage to the crops, which constituted a significant proportion of the flood damage [46]. However, this approach had limitations in providing accurate estimates for more extensive calculations because of the unavailability of data and techniques. In the improved version, an advanced method was developed using a regression technique based on the size of the flooded area to estimate the flood damage [47]. This approach was examined by determining the relationship between the amount of rainfall and the size of the flooded region in several categories, including major cities, small- and medium-sized cities, garden cities, rural regions, and mountainous regions. In 2004, a multi-dimensional method for practical tasks employing a geographic information system (GIS) was developed to explore various types of geographical statistics and data related to asset size [48]. To determine the cost of flood damage, the ratio of the flooded region to the residential region was multiplied by the flooding-damaged assets in the examined district. We used an object-based approach that measured the flood risk for each object and estimated the flood risk based on the asset data. By setting the conditions of the study area based on high-resolution data and using a damage function, this approach resolves the issues of the multi-dimensional method [24]. This approach can reduce the difference between the actual and calculated damage by considering the spatial features of each asset. Therefore, utilizing an object-based method to analyze flood damage increases the accuracy and reliability of the estimation.
3.2. Range and Depth of Inundation
This study calculated the expected annual damage as the cost of flood damage using a flood risk map of local river inundation. Data of the floods that occurred in the 798 local streams and rivers within the Nakdong River area for four return periods (50, 80, 100, and 200 years) were used to obtain the expected annual damage. We estimated the expected annual damage according to the high-resolution unit of space gained by GIS (100 m × 100 m) instead of the unit of an administrative district. Using these spatial data, an object-based method was employed to increase the reliability and accuracy of the expected annual damage.
In the inundation regions, the damage in each area was calculated based on five types of damaged items, namely residential assets, agricultural assets, industrial assets, vehicles, and human life. The expected annual damage was estimated using an established database. To estimate the cost of damage to life, we assumed that the cost of human life loss such that the cost was proportional to the flooded region. Flood damage in local rivers and streams during the four return periods was used to interpolate the flood damage for periods not provided in the flood risk map by minimizing bias. Subsequently, it determined the expected annual damage by multiplying the sum of the asset-based flood damage costs and the probability of annual occurrence. More details on estimating the flood damage to assets and expected annual damage are provided in the following sections.
3.3. Damage Estimation
Flood damage is essentially a product of asset value and percentage of damage.
The percentages of damage are listed in Table 2. We employed the most appropriate depth-damage function for each asset group, as determined from the literature [44,49].
In particular, assessing human impact, which encompasses the loss of life and injuries, is a crucial but challenging task [3,50]. Following the relevant literature [51], we evaluated this risk by multiplying the likelihood of mortality or injury by the value of statistical life. This likelihood varies based on age (below 5 years or above 65 years vs. between 5 and 65 years) and inundation depth. We sourced the most appropriate average value of statistical life for the Republic of Korea (290 thousand USD) from the local literature [44]. In addition to the life-threatening impacts, we accounted for the costs incurred by temporary loss of livelihood, which can be calculated as follows:
Impact due to temporary loss of livelihoods = likelihood × average days of
loss × average daily income
loss × average daily income
Based on the literature, we assumed that the probability of livelihood loss per flood event, average duration of loss, and average daily income were 2.5%, 10 days, and 70 USD, respectively [44].
The total flood damage for the flooding scenario f was the sum of the damage across all five categories.
3.4. Expected Annual Damage Estimation
Theoretically, the expected annual damage (EAD) for each grid (r) can be calculated by considering the expected damage across the flood scenarios or return periods. However, given the limited number of available flood scenarios, the estimates can be significantly biased. For example, the most frequent flood scenario in our analysis is the 50-year event. This implies that we may not have fully captured the variations in the flood damage that occurred more frequently than every 50 years, thus poorly capturing the impact of floods that are observed every 1–50 years.
To address this issue, we interpolated and extrapolated the damage for the four flood scenarios considered. We first assumed that highly frequent floods with return periods of less than five years did not cause any damage, i.e., . Following the literature [49], we assumed that the damage of frequent floods adheres to a log function, where and are coefficients.
The EAD for floods with return periods of 5–50 years is represented as follows:
The annual likelihood was the inverse of the return period. Given our assumption we can compute and based on the damage estimated for the 50-year return flood, .
For closely spaced likelihoods, such as for floods occurring over a 50-year period, the choice of the function form becomes less significant. For the purpose of calculation, we used a linear function when interpolating the flood damage associated with rare flood events. If the two flood scenarios have return periods of and , the EAD between their damage can be estimated as follows:
Ultimately, the total EAD across all return periods can be calculated as the sum of the partial EAD calculations.
4. Results and Discussion
4.1. Analysis of Flood Damage
Figure 4 shows a comparison of the flood risk map (left) [25] with the estimated EAD (right) for the study region. Darker shades represent higher EAD or heightened flood risks. Our assessment was based on a flood risk map that measured the anticipated depth of flooding in the affected areas. The resulting damage map, which estimated the potential impact, differed significantly. For example, regions with minimal inundation but significant assets may incur more severe damage than regions with extensive inundation but limited assets. Consequently, the primary distinction between the two maps arises from the assets exposed to flood risks.
Figure 5 shows that the probability density function of flooding damage exhibits a long tail. For each 100 m × 100 m grid, the median damage was 34 USD, but the mean damage significantly increased to 1000 USD. This contrast indicates that while most risk-prone areas usually incur minor damage, significant flood damage is concentrated in a limited number of regions. Specifically, 41% of the grids identified as at-risk on the flood risk map had EADs lower than 10 USD. Furthermore, only 20% of the grids exceeded the average. This disparity emphasizes that flood damage is not uniformly distributed, implying that national flood defenses should focus on high-risk areas.
As illustrated in Figure 6, agricultural and automobile damage, at 37 and 35%, respectively, accounted for the largest proportion of flood damage. Residential building damage accounted for 35% of the total damage. Given the prominence of agriculture in the study area, agricultural assets pose a significant risk of flooding. Similarly, floods in economically developed cities can significantly harm vehicles and infrastructure. This finding suggests the need for national flood-defense policies that prioritize these categories. Notably, human impacts and industrial damage remained at the lower end owing to adaptive flood-response strategies.
The vulnerability of assets to damage varies by region as shown in Table 3. For example, the highest EAD of the Haeban Stream can be ascribed to automobiles, agriculture, and residential buildings. This aligns with the stream routes through both urban and agricultural landscapes. Damage in the Buk Stream and Jucheon River areas, with the next highest EADs, is also related to vehicles, agriculture, and residential buildings. Conversely, the EAD of the Dabang Stream area is primarily related to residential buildings and vehicles, owing to its urban passage. In contrast, the EAD in the Dong Stream prioritizes agricultural assets as it courses through farmlands. These variations emphasize that flood defense strategies should be tailored to the surrounding conditions of each river.
4.2. Relationship between the Flood Defense Level and Flood Damage Cost
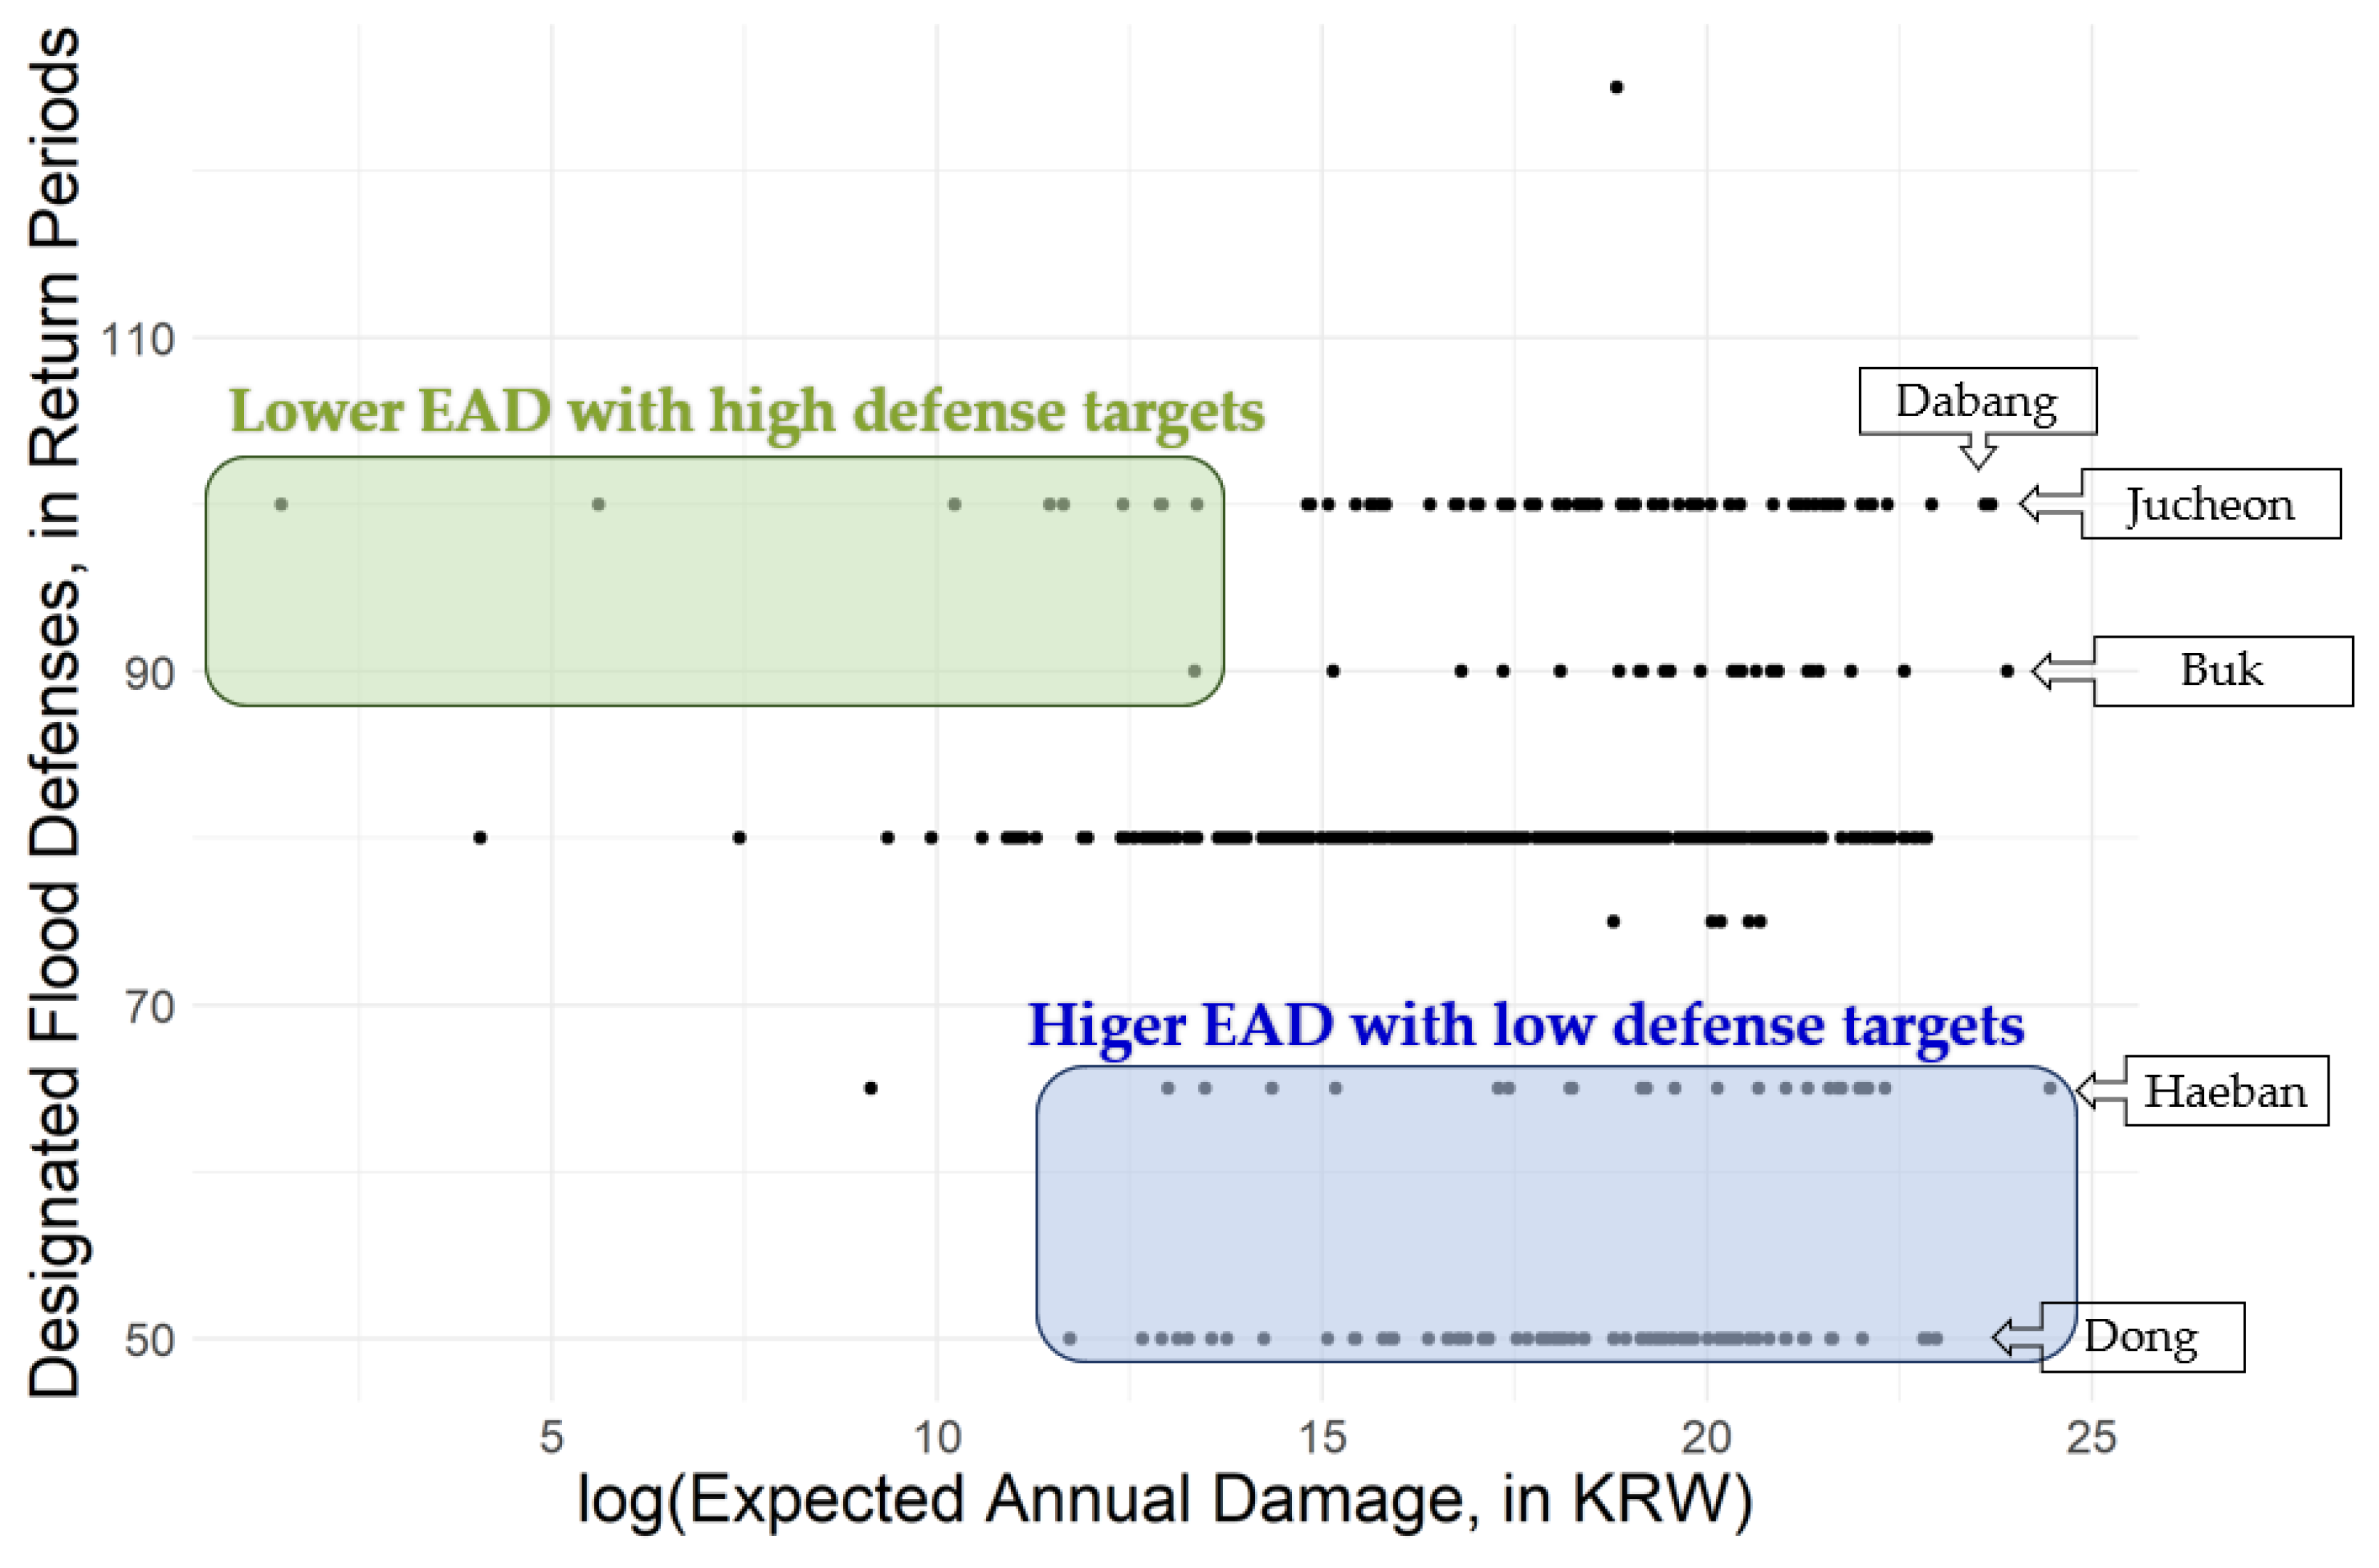
Based on the estimated EAD and flood prevention levels, we determined an appropriate flood defense system. Figure 7 demonstrates that despite having high EADs, the designated flood defenses for these rivers were designed for return periods of 30–100 years. This implies that the national flood defense strategy of Korea was not established based on damage potential. Figure 7 shows the relationship between the flood defense return period [52] and the estimated EAD for all rivers in the study area. If defense targets are set based on the EAD, we can expect an upward trend; the higher the EAD, the more stringent the defense target. However, the scatterplot did not exhibit a consistent trend. In some cases, areas with high EADs have low defense targets and vice versa. This indicates that national flood defense strategies are not based on the evaluation of the EAD.
4.3. Enhancement of Policies, Plans, and Measures on Flood Defense Criteria
In this study, we determined that the probability distribution function for the expected damage appears to be an asymmetric distribution function with a long tail. This is because a large number of regions are expected to experience low levels of damage, and a small number of regions are expected to encounter high levels of damage. Furthermore, we identified that flood prevention level and the cost of flood damage are independent and that the levels of streams and rivers, which feature large-scale damage, have been established at significantly low defense levels. However, the flood defense levels of streams and rivers, which show low levels of damage, have been established at high prevention levels. The results indicate that the scale of the expected flood damage in the flood-prone regions of the Nakdong River zone tends to have a significantly uneven distribution. Therefore, the flood prevention level for large-scale flood damage should be increased, whereas that for small-scale damage should be decreased to efficiently use the limited flood defense budget of the Korean government. These results seem to be similar to the results of several analyses that identified the adjustment of the flood defense level based on the levee effect and quantitative risk evaluation [53,54,55]. In their research, the design criteria and policies for flood management need to be modified to reduce flood damages by enhancing the levee systems.
This study found that the current flood prevention level in the Republic of Korea does not appear to be proportional to the expected flood damage calculated for the streams and rivers in the Nakdong River, verifying that they are likely to cause large-scale flood damage. Existing flood prevention strategies based on river grades had been established without reflecting the quantitative flood damage. Hence, more unique flood prevention strategies that enhance flood defense criteria by focusing on vulnerable points need to be considered. The flood defense plan in the basic river plan of the Republic of Korea presents insufficient content for determining flood defense goals and considering the economic and social significance, vulnerability to flooding, and climate change. Table 4 shows the need to revise the return period of the flood defense structures in the river basin plan of the Republic of Korea. The design flood should be estimated by considering its economic and social importance based on a quantitative flood analysis to adopt an optimal flood prevention plan that reflects the occurrence of floods exceeding the designed scale. Based on the quantitative results, the government can develop a flood prevention plan under the basic river plan of the country by considering floods due to climate change, which can exceed the flood defense capability. In addition, national laws, such as the River Act and the Investigation, Planning, and Management of Water Resources Act, are needed to improve the flood prevention criteria reflecting climate impact and adaptation measures to protect vulnerable regions from floods. The development of the Acts and plans for the benefit of the flood defense level were also presented with studies of risk analysis and uncertainty in flood damages and flood risk assessment in different countries, including the US and the Netherlands [56,57].
5. Conclusions
A quantitative flood analysis was conducted to estimate the damage caused by river flooding based on the local rivers and streams in the Nakdong River zone of the Republic of Korea. In this investigation, we focused on four damaged items, namely residential assets, agricultural assets, industrial assets, and loss of life in flooded regions, for the return periods of 50, 80, 100, and 200 years. Using the obtained asset database, the EAD in the flooded area was computed by multiplying the entire cost by the sum of the flood damage in the four asset categories and the probability of annual recurrence. In the quantitative flood study, the object-based method and GIS were applied based on the spatial data within 100 m × 100 m grids to improve the reliability and accuracy of the high-resolution flood damage estimations.
The five assets—residential buildings, agricultural assets, industrial assets, human lives, and vehicles—defined as spatial inventories were examined for flood damage in the flooding areas identified by the flood risk maps, containing local rivers and streams. Flood damage to agricultural and vehicle assets appears to have the largest value, accounting for 37 and 35% of total flood damage, respectively, among the five damaged assets. However, the flood damage of industrial assets has the lowest value, with a ratio of 1% of the five damage components. These results might be because we limited the study to the local streams and rivers and had difficulty in acquiring the industrial asset data used to estimate the flood damage. These results could have changed if national rivers and urban inundation were included in the analysis. Among the tributaries of the Nakdong River, the five with the highest EAD are the Haeban (30.6 million USD), Daban (17.6 million USD), Buk (14.4 million USD), Jucheon (13.2 million USD), and Sangnam Rivers (7.1 million USD).
The EAD calculated using quantitative flood risk analysis can be used to propose distinct flood defense levels based on social and economic conditions. The calculated EAD for the local streams and rivers was also analyzed to identify the appropriate application of the flood defense levels. Although these regions are expected to experience large-scale flood damage, the flood prevention level appears to be relatively low, indicating a need for improvement. Using the determined values, the scale of the flood prevention plan can be selected by identifying and differentiating the defense levels. In this study, we focused on local rivers to determine the flood defense plans by examining the relationship between flood damage costs and flood defense within the return periods. The flood defense structures for the local rivers and streams are essentially the river banks, as analyzed when creating the flood risk map. Other facilities to reduce flood damage need to be investigated in the future when the flood damage costs for the risk of urban inundation are estimated. When we determine the return period for the flood prevention structures in an area that is expected to face financially and socially significant damage, the EAD can be applied to reinforce the flood defense based on vulnerability analyses for potential flood damage. Further research needs to be performed to evaluate the flood risk by including the national and local rivers in the Nakdong River region. In the future, the priority of prospective flood hazards caused by climate change needs to be determined using several types of climate change and social and economic development scenarios to assess the economic feasibility of varying the preventive levels. Also, the flood risk maps of the local rivers in this river basin cover a significant proportion compared to other nations’ river basins, such as the Han, Seomjin∙Yeongsan, and Geum River Basins. In this study, we focused on the Nakdong River Basin among these four river basins. The flood prevention systems, based on quantitative analyses, can effectively improve the implementation of flood defense measures and reduce flood damage by enhancing the flood prevention criteria in the Republic of Korea.
Finally, we conclude by highlighting the limitations of this study. Our quantitative assessment of flood risk (i.e., EAD) was conducted across five categories based on high-resolution 100 m × 100 m grid sets. However, other important damage categories, including the damage to public and service sectors, lifelines, and infrastructure, need to be considered. These categories were not included in our assessment because of the lack of comprehensive asset data and damage functions. Nevertheless, considering the potentially significant damage these categories can cause, their assessment is imperative for future research [7,58,59]. Additionally, our study does not account for the indirect economic damage that can ripple through economic systems and affect other areas [60]. Future research should incorporate input–output and computable general equilibrium models to estimate such impacts [61,62].
The EAD should be interpreted with caution because of the range of uncertainties present in the datasets, such as the flood risk maps and gridded asset data. Uncertainties also exist in our methodologies, including the damage functions and interpolation techniques. Additionally, we did not account for the damage to public facilities, utility systems, or indirect flood damage. Finally, while we observed that the current flood defense targets might not align with the EAD, we cannot specify the precise targets that should be adopted for each river. Future research should focus on estimating more accurate EADs using advanced methodologies that can guide the quantitative determination of flood targets.
Author Contributions
Conceptualization, K.J. and J.Y.; methodology, K.J., J.Y., H.A. and S.H.; validation, S.B.S., H.P. and C.P.; investigation, S.H. and J.Y.; data curation, K.J. and H.A.; writing—original draft preparation, K.J. and J.Y.; writing—review and editing, K.J., J.Y., S.B.S., H.P. and C.P.; visualization, H.A. and S.H.; supervision, K.J.; funding acquisition, K.J., J.Y., S.B.S., H.P. and C.P. All authors have read and agreed to the published version of the manuscript.
Funding
This study was supported by the Basic Study and Interdisciplinary R&D Foundation Fund of the University of Seoul (grant number 2021). This work was also supported by the National Research Foundation of Korea (NRF) grant funded by the Korean Government (MSIT) (RS-2023-00272933).
Data Availability Statement
No new data were created or analyzed in this study. Data sharing is not applicable to this article.
Acknowledgments
The authors gratefully acknowledge the editor and anonymous reviewers for their valuable comments on this manuscript. The authors also appreciate the financial support from the University of Seoul (the 2021 Basic Study and Interdisciplinary R&D Foundation Fund) and the National Research Foundation of Korea (NRF) grant funded by the Korean government (MSIT) (RS-2023-00272933).
Conflicts of Interest
The authors declare no conflict of interest.
References
- Swain, D.L.; Wing, O.E.; Bates, P.D.; Done, J.M.; Johnson, K.A.; Cameron, D.R. Increased flood exposure due to climate change and population growth in the United States. Earth’s Future 2020, 8, e2020EF001778. [Google Scholar] [CrossRef]
- Davenport, F.V.; Burke, M.; Diffenbaugh, N.S. Contribution of historical precipitation change to US flood damages. Proc. Natl. Acad. Sci. USA 2021, 118, e2017524118. [Google Scholar] [CrossRef] [PubMed]
- Dottori, F.; Szewczyk, W.; Ciscar, J.C.; Zhao, F.; Alfieri, L.; Hirabayashi, Y.; Bianchi, A.; Mongelli, I.; Frieler, K.; Betts, R.A.; et al. Increased human and economic losses from river flooding with anthropogenic warming. Nat. Clim. Chang. 2018, 8, 781–786. [Google Scholar] [CrossRef]
- Merz, B.; Blöschl, G.; Vorogushyn, S.; Dottori, F.; Aerts, J.C.; Bates, P.; Bertola, M.; Kemter, M.; Kreibich, H.; Lall, U.; et al. Causes, impacts and patterns of disastrous river floods. Nat. Rev. Earth Environ. 2021, 2, 592–609. [Google Scholar] [CrossRef]
- Wasko, C.; Nathan, R.; Stein, L.; O’Shea, D. Evidence of shorter more extreme rainfalls and increased flood variability under climate change. J. Hydrol. 2021, 603, 126994. [Google Scholar] [CrossRef]
- Ministry of the Interior and Safety. Disaster Annual Report 2020. 2021. Available online: www.safekorea.go.kr (accessed on 15 April 2022).
- Merz, B.; Kreibich, H.; Schwarze, R.; Thieken, A. Review article “Assessment of economic flood damage”. Nat. Hazards Earth Syst. Sci. 2010, 10, 1697–1724. [Google Scholar] [CrossRef]
- Tobin, G.A. The levee love affair: A stormy relationship? J. Am. Water Resour. Assoc. 1995, 31, 359–367. [Google Scholar] [CrossRef]
- Vis, M.; Klijn, F.; De Bruijn, K.M.; Van Buuren, M. Resilience strategies for flood risk management in the Netherlands. Int. J. River Basin Manag. 2003, 1, 33–40. [Google Scholar] [CrossRef]
- DKKV. Lessons Learned: Hochwasservorsorge in Deutschland. Lernen aus der Katastrophe 2002 im Elbegebiet; Schriftenreihe des DKKV: Bonn, Germany, 2003; 29p. (In German) [Google Scholar]
- Evans, E.; Hall, J.; Penning-Rowsell, E.; Sayers, P.; Thorne, C.; Watkinson, A. Future flood risk management in the UK. In Proceedings of the Institution of Civil Engineers-Water Management; Thomas Telford Ltd.: London, UK, 2006; Volume 159, pp. 53–61. [Google Scholar]
- European Commission. A New EU Floods Directive 2007/60/EC. 2007. Available online: http://ec.europa.eu/environment/water/flood_risk/index.htm (accessed on 1 May 2022).
- Ali, S.A.; Parvin, F.; Pham, Q.B.; Vojtek, M.; Vojteková, J.; Costache, R.; Linh, N.T.T.; Nguyen, H.Q.; Ahmad, A.; Ghorbani, M.A. GIS-based comparative assessment of flood susceptibility mapping using hybrid multi-criteria decision-making approach, naïve Bayes tree, bivariate statistics and logistic regression: A case of Topľa basin, Slovakia. Ecol. Indic. 2020, 117, 106620. [Google Scholar] [CrossRef]
- Ahmadlou, M.; Al-Fugara, A.K.; Al-Shabeeb, A.R.; Arora, A.; Al-Adamat, R.; Pham, Q.B.; Al-Ansari, N.; Linh, N.T.T.; Sajedi, H. Flood susceptibility mapping and assessment using a novel deep learning model combining multilayer perceptron and autoencoder neural networks. J. Flood Risk Manag. 2021, 14, e12683. [Google Scholar] [CrossRef]
- Islam, A.R.M.T.; Talukdar, S.; Mahato, S.; Kundu, S.; Eibek, K.U.; Pham, Q.B.; Kuriqi, A.; Linh, N.T.T. Flood susceptibility modelling using advanced ensemble machine learning models. Geosci. Front. 2021, 12, 101075. [Google Scholar] [CrossRef]
- Pham, B.T.; Luu, C.; Van Phong, T.; Trinh, P.T.; Shirzadi, A.; Renoud, S.; Asadi, S.; Van Le, H.; von Meding, J.; Clague, J.J. Can deep learning algorithms outperform benchmark machine learning algorithms in flood susceptibility modeling? J. Hydrol. 2021, 592, 125615. [Google Scholar] [CrossRef]
- Kim, Y.; Newman, G. Climate change preparedness: Comparing future urban growth and flood risk in Amsterdam and Houston. Sustainability 2019, 11, 1048. [Google Scholar] [CrossRef] [PubMed]
- Toosi, A.S.; Doulabian, S.; Tousi, E.G.; Calbimonte, G.H.; Alaghmand, S. Large-scale flood hazard assessment under climate change: A case study. Ecol. Eng. 2020, 147, 105765. [Google Scholar] [CrossRef]
- Ekmekcioğlu, Ö.; Koc, K.; Özger, M. Towards flood risk mapping based on multi-tiered decision making in a densely urbanized metropolitan city of Istanbul. Sustain. Cities Soc. 2022, 80, 103759. [Google Scholar] [CrossRef]
- Alfieri, L.; Bisselink, B.; Dottori, F.; Naumann, G.; de Roo, A.; Salamon, P.; Wyser, K.; Feyen, L. Global projections of river flood risk in a warmer world. Earth’s Future 2017, 5, 171–182. [Google Scholar] [CrossRef]
- Tellman, B.; Sullivan, J.A.; Kuhn, C.; Kettner, A.J.; Doyle, C.S.; Brakenridge, G.R.; Erickson, T.A.; Slayback, D.A. Satellite imaging reveals increased proportion of population exposed to floods. Nature 2021, 596, 80–86. [Google Scholar] [CrossRef]
- Korea Research Institute for Human Settlements. Determining the Flood Defense Level Based on the Quantitative Risk Assessment. 2021. Available online: https://library.krihs.re.kr/ (accessed on 1 May 2022).
- Korea Environment Institute. Analysis on Establishment of Strategies for Flood Risk Evaluation and Flood Defense Criteria against Climate Change (I). 2022. Available online: https://repository.kei.re.kr/handle/2017.oak/23922 (accessed on 1 May 2022).
- Yugyung Na, J.C. A study on the flood damage estimation using object-based analysis. J. Korean Geogr. Soc. 2019, 54, 637–649. [Google Scholar]
- Ministry of Environment. Flood Risk Map. Available online: https://floodmap.go.kr (accessed on 15 April 2022).
- Ministry for Food Agriculture Forestry and Fisheries. Farm Map. Available online: https://agis.epis.or.kr (accessed on 15 April 2022).
- Ministry of Land Infrastructure and Transport. Building Registry. Available online: https://open.eais.go.kr (accessed on 15 April 2022).
- Ministry of Land Infrastructure and Transport. Property Appraisal Database. Available online: http://www.nsdi.go.kr (accessed on 5 August 2022).
- Ministry of Land Infrastructure and Transport. Vehicle Registration Database. Available online: https://stat.molit.go.kr/ (accessed on 1 August 2022).
- Ministry of the Interior and Safety. Population Census. Available online: https://jumin.mois.go.kr/ (accessed on 1 August 2022).
- Statistics Korea. Household Inventory Survey. Available online: https://kosis.kr/statisticsList/statisticsListIndex.do?vwcd=MT_ZTITLE&menuId=M_01_01#K1_20.2 (accessed on 1 August 2022).
- Statistics Korea. Industrial Asset Valuation. Available online: https://kosis.kr/statisticsList/statisticsListIndex.do?vwcd=MT_ZTITLE&menuId=M_01_01#J2_17.2 (accessed on 20 May 2022).
- Statistics Korea. Production Cost Statistics. Available online: https://kosis.kr/statHtml/statHtml.do?orgId=101&tblId=DT_1C81&vw_cd=MT_ZTITLE&list_id=Q_7&scrId=&seqNo=&lang_mode=ko&obj_var_id=&itm_id=&conn_path=MT_ZTITLE&path=%252FstatisticsList%252FstatisticsListIndex.do (accessed on 20 May 2022).
- Hall, J.W.; Meadowcroft, I.C.; Sayers, P.B.; Bramley, M.E. Integrated flood risk management in England and Wales. Nat. Hazards Rev. 2003, 4, 126–135. [Google Scholar] [CrossRef]
- Jonkman, S.N.; Bočkarjova, M.; Kok, M.; Bernardini, P. Integrated hydrodynamic and economic modelling of flood damage in the Netherlands. Ecol. Econ. 2008, 66, 77–90. [Google Scholar] [CrossRef]
- Ward, P. On the use of tradable development rights for reducing flood risk. Land Use Policy 2013, 31, 576–583. [Google Scholar] [CrossRef]
- Foudi, S.; Osés-Eraso, N.; Tamayo, I. Integrated spatial flood risk assessment: The case of Zaragoza. Land Use Policy 2015, 42, 278–292. [Google Scholar] [CrossRef]
- Aerts, J.C.; Botzen, W.J.; Clarke, K.C.; Cutter, S.L.; Hall, J.W.; Merz, B.; Michel-Kerjan, E.; Mysiak, J.; Surminski, S.; Kunreuther, H. Integrating human behaviour dynamics into flood disaster risk assessment. Nat. Clim. Chang. 2018, 8, 193–199. [Google Scholar] [CrossRef]
- Nakdong River Basin Water Framework Committee. Water Framework Comprehensive Planning in Nakdong River Basin (2021~2030). 2022. Available online: www.water.go.kr (accessed on 1 May 2022).
- Park, S.K.; Kim, J.; Lee, K.J.; Jo, M.H. Analysis of land use change within four major river areas using high-resolution air-photographs: The case of the Nakdong river basin. J. Korean Assoc. Geogr. Inf. Stud. 2013, 16, 171–188. [Google Scholar] [CrossRef]
- Korea Meteorological Administration. Climate Change 2014—Synthesis Report—Summary for Policymaker (2014). 2015. Available online: https://www.me.go.kr/home/web/policy_data/read.do?menuId=10262&seq=6456 (accessed on 1 May 2022).
- Mann, H.B. Nonparametric tests against trend. Econom. J. Econom. Soc. 1945, 13, 245–259. [Google Scholar] [CrossRef]
- Kendall, M.G. Rank Correlation Methods; Griffin: London, UK, 1975. [Google Scholar]
- Korea Development Institute. Study on the Application Criteria of Multidimensional Methods for Calculating Flood Damage Mitigation Benefits. 2019. Available online: https://www.kdi.re.kr/research/reportView?&pub_no=16445 (accessed on 1 May 2022).
- Bank of Korea. Consumer Price Index. Available online: https://ecos.bok.or.kr/ (accessed on 15 April 2022).
- Ministry of Construction Transportation. River Facilities Criteria; Republic of Korea, Ministry of Construction Transportation: Sejong, Republic of Korea, 1993.
- Ministry of Construction Transportation. The Improvement Method for Economic of Water Control Plan; Ministry of Construction Transportation: Sejong, Republic of Korea, 2001.
- Ministry of Construction Transportation. Study on the Economic Analysis in Flood Control Projects; Ministry of Construction Transportation: Sejong, Republic of Korea, 2004.
- Korea Development Institute. 2017 Preliminary Cost-Benefit Analysis Report on the National River Environment Improvement Project for the Seonakdong River Basin. 2017. Available online: https://www.kdi.re.kr/research/reportView?&pub_no=15292 (accessed on 1 May 2022).
- Jonkman, S.N. Global perspectives on loss of human life caused by floods. Nat. Hazards 2005, 34, 151–175. [Google Scholar] [CrossRef]
- Jonkman, S.N.; Vrijling, J.K.; Vrouwenvelder, A.C.W.M. Methods for the estimation of loss of life due to floods: A literature review and a proposal for a new method. Nat. Hazards 2008, 46, 353–389. [Google Scholar] [CrossRef]
- Ministry of Environment. River Directory. 2021. Available online: https://www.me.go.kr/home/web/policy_data/read.do?menuId=10266&seq=7972 (accessed on 15 April 2022).
- U.S. Army Corps of Engineers. USACE levee safety program and tolerable risk guidelines—A discussion paper for the exploration of tolerable risk guidelines for levee system workshop. In Proceedings of the Workshop “Exploration of Tolerable Risk Guidelines for the USACE Levee Safety Program”; U.S. Army Corps of Engineers: Washington, DC, USA, 2010; pp. 53–58. [Google Scholar]
- Pielke, R.A. Nine fallacies of floods. Clim. Chang. 1999, 42, 413–438. [Google Scholar] [CrossRef]
- Hutton, N.S.; Tobin, G.A.; Montz, B.E. The levee effect revisited: Processes and policies enabling development in Yuba County, California. J. Flood Risk Manag. 2017, 12, e12469. [Google Scholar] [CrossRef]
- Committee on Risk-Based Analysis for Flood Damage Reduction. Risk Analysis and Uncertainty in Flood Damage Reduction Studies; National Academy Press: Washington, DC, USA, 2000. [Google Scholar]
- Jonkman, S.N. Loss of Life Estimation in Flood Risk Assessment, Theory and Applications. Ph.D. Thesis, Delft University of Technology, Delft, The Netherlands, 2007. [Google Scholar]
- Penning-Rowsell, E.; Johnson, C.; Tunstall, S.; Tapsell, S.; Morris, J.; Chatterton, J.; Green, C. The Benefits of Flood and Coastal Risk Management: A Handbook of Assessment Techniques; Middlesex University Press: The Netherlands, 2005; ISBN 1904750516. Available online: file:///C:/Users/MDPI/Downloads/FloodRiskManagementHandbookTables.pdf (accessed on 1 May 2022).
- Unterberger, C.; Hudson, P.; Botzen, W.W.; Schroeer, K.; Steininger, K.W. Future public sector flood risk and risk sharing arrangements: An assessment for Austria. Ecol. Econ. 2019, 156, 153–163. [Google Scholar] [CrossRef]
- Hallegatte, S. An adaptive regional input-output model and its application to the assessment of the economic cost of Katrina. Risk Anal. Int. J. 2008, 28, 779–799. [Google Scholar] [CrossRef] [PubMed]
- Rose, A. Economic principles, issues, and research priorities in hazard loss estimation. In Modeling Spatial and Economic Impacts of Disasters; Springer: Berlin/Heidelberg, Germany, 2004; pp. 13–36. [Google Scholar]
- Sieg, T.; Schinko, T.; Vogel, K.; Mechler, R.; Merz, B.; Kreibich, H. Integrated assessment of short-term direct and indirect economic flood impacts including uncertainty quantification. PLoS ONE 2019, 14, e0212932. [Google Scholar] [CrossRef] [PubMed]
Figure 1.
Study area based on local streams and rivers of Nakdong River in Republic of Korea.

Figure 2.
Procedure of making flood risk map.
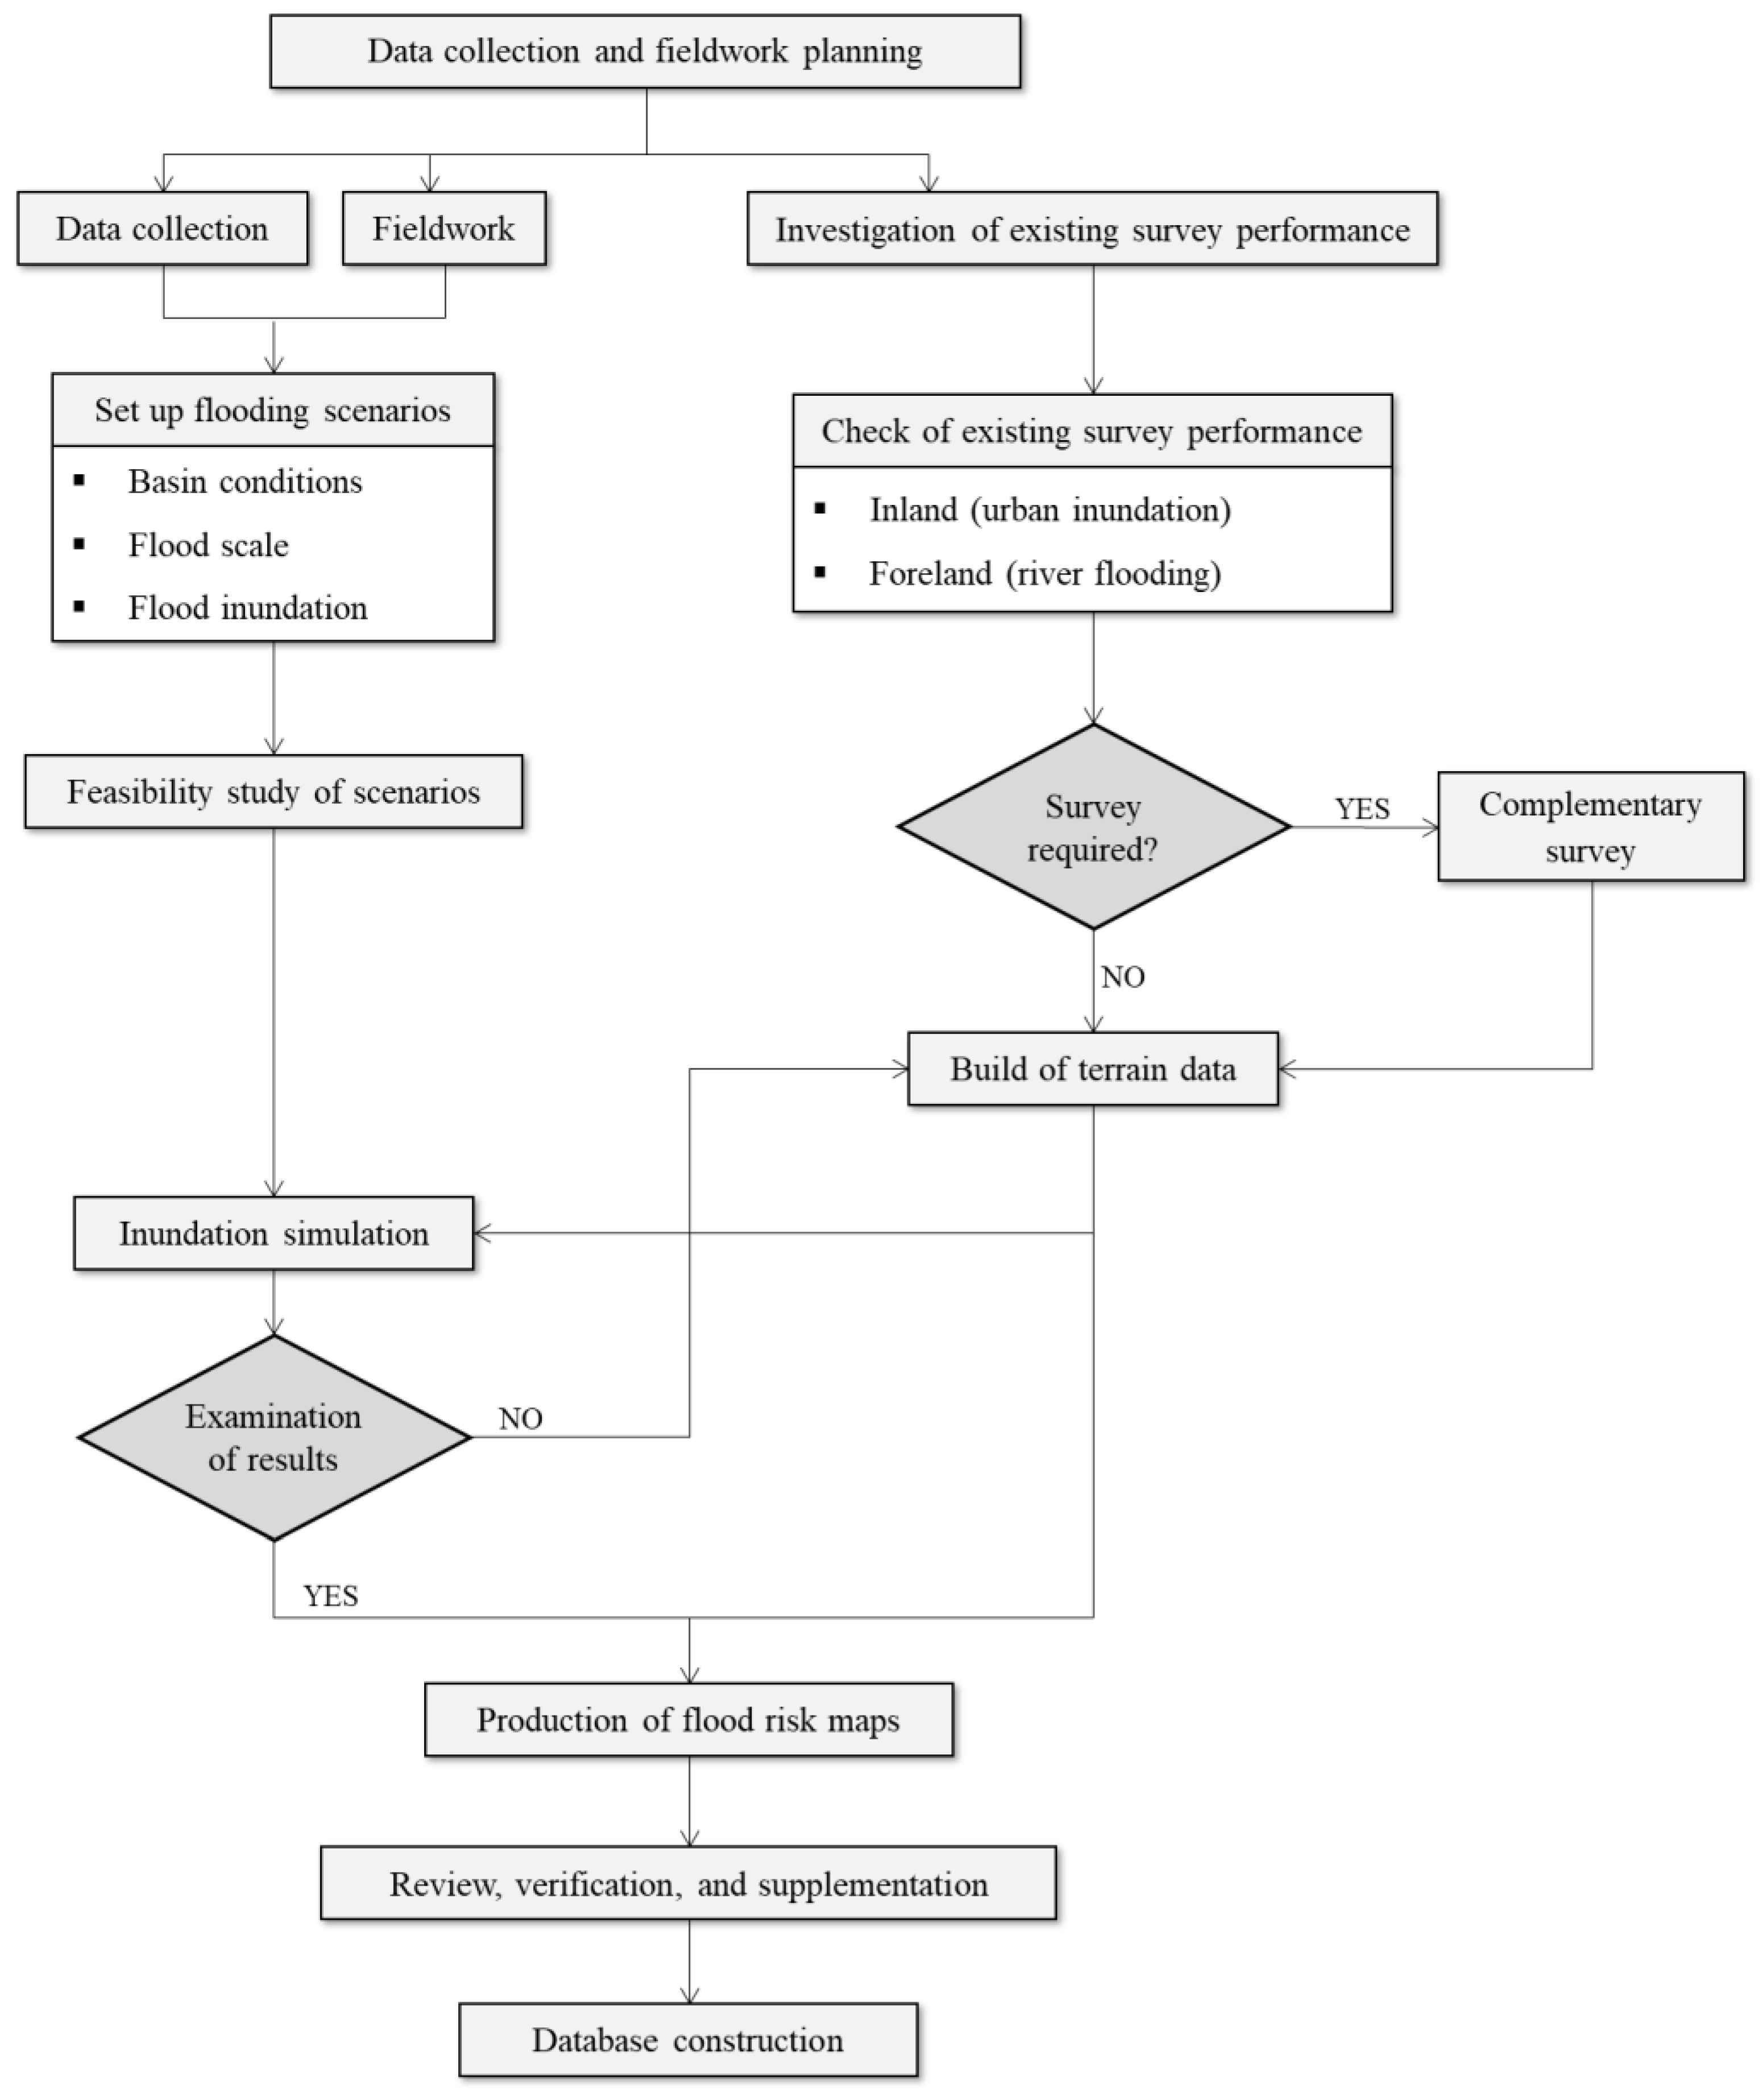
Figure 3.
Damage categories and corresponding data sources.
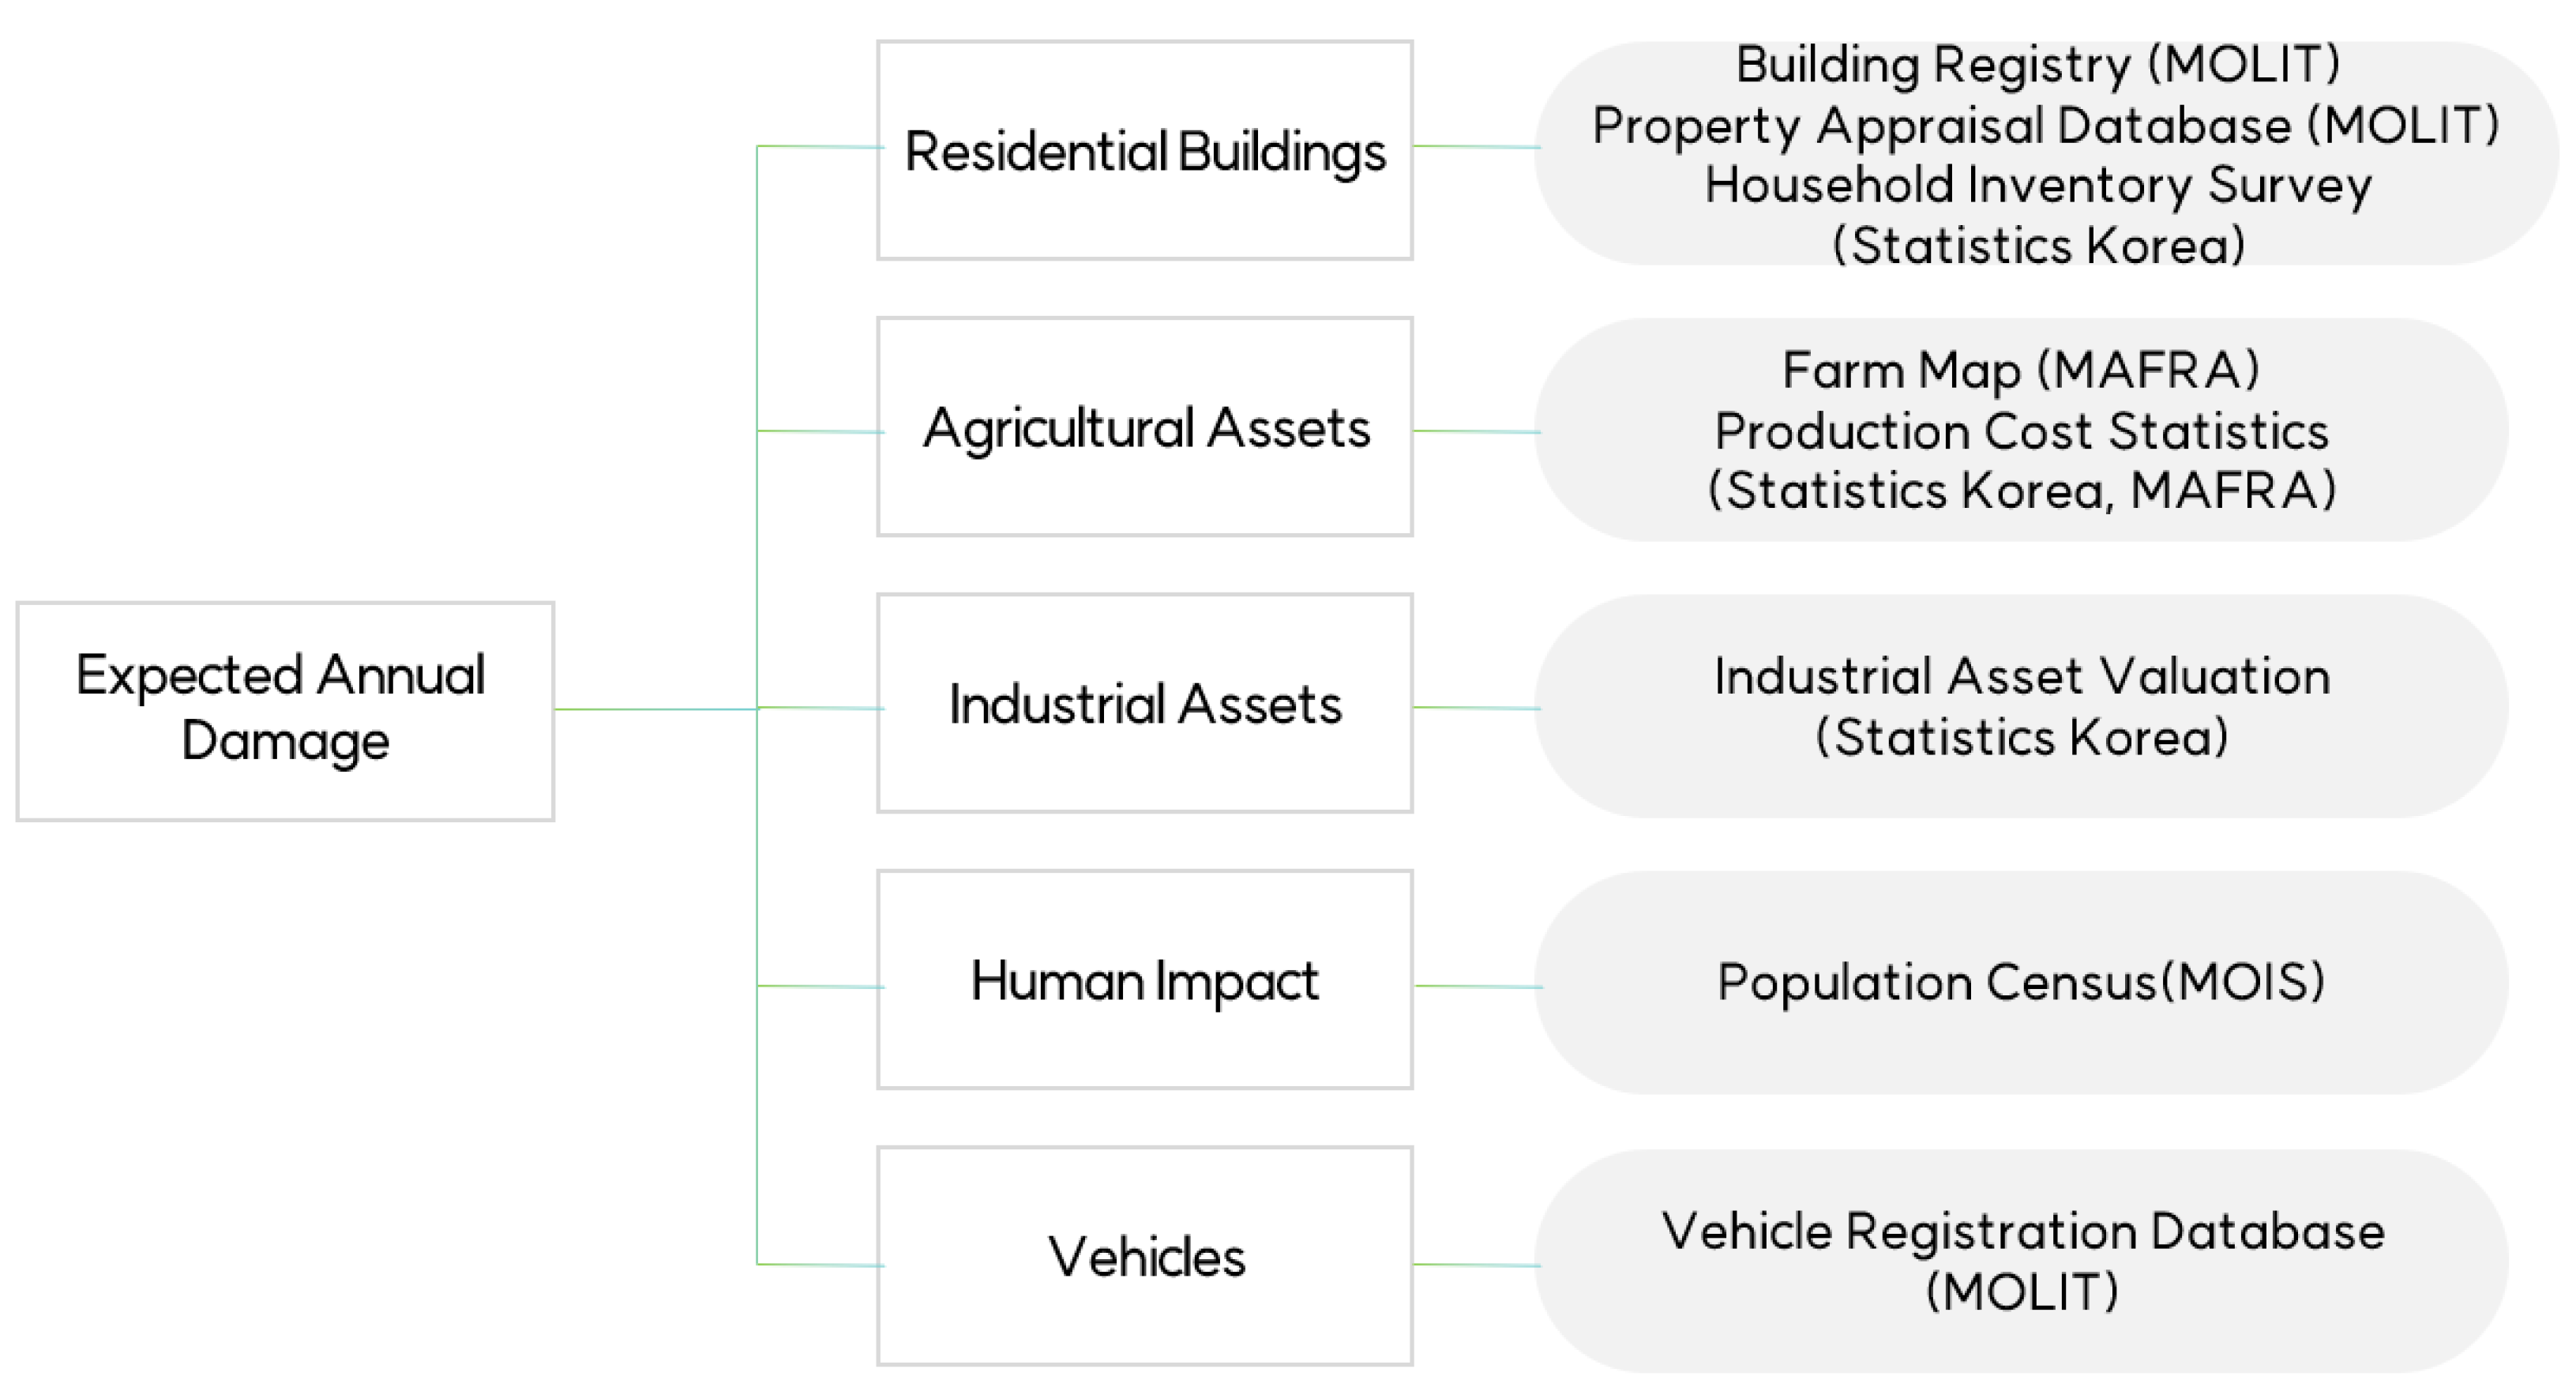
Figure 4.
Comparison of the flood risk map and the EAD map across the study region: (a) the flood risk map; (b) the estimated EAD map. The flood risk map shows areas susceptible to inundation from floods with a 200-year return period, with the anticipated depth of flooding represented by varying colors. The EAD Map depicts the expected extent of damage within each 100 m × 100 m grid, quantified in USD.

Figure 5.
Probability density function of flood damage. The density for damages exceeding 70 USD has been truncated due to its extended tail.
Figure 5.
Probability density function of flood damage. The density for damages exceeding 70 USD has been truncated due to its extended tail.
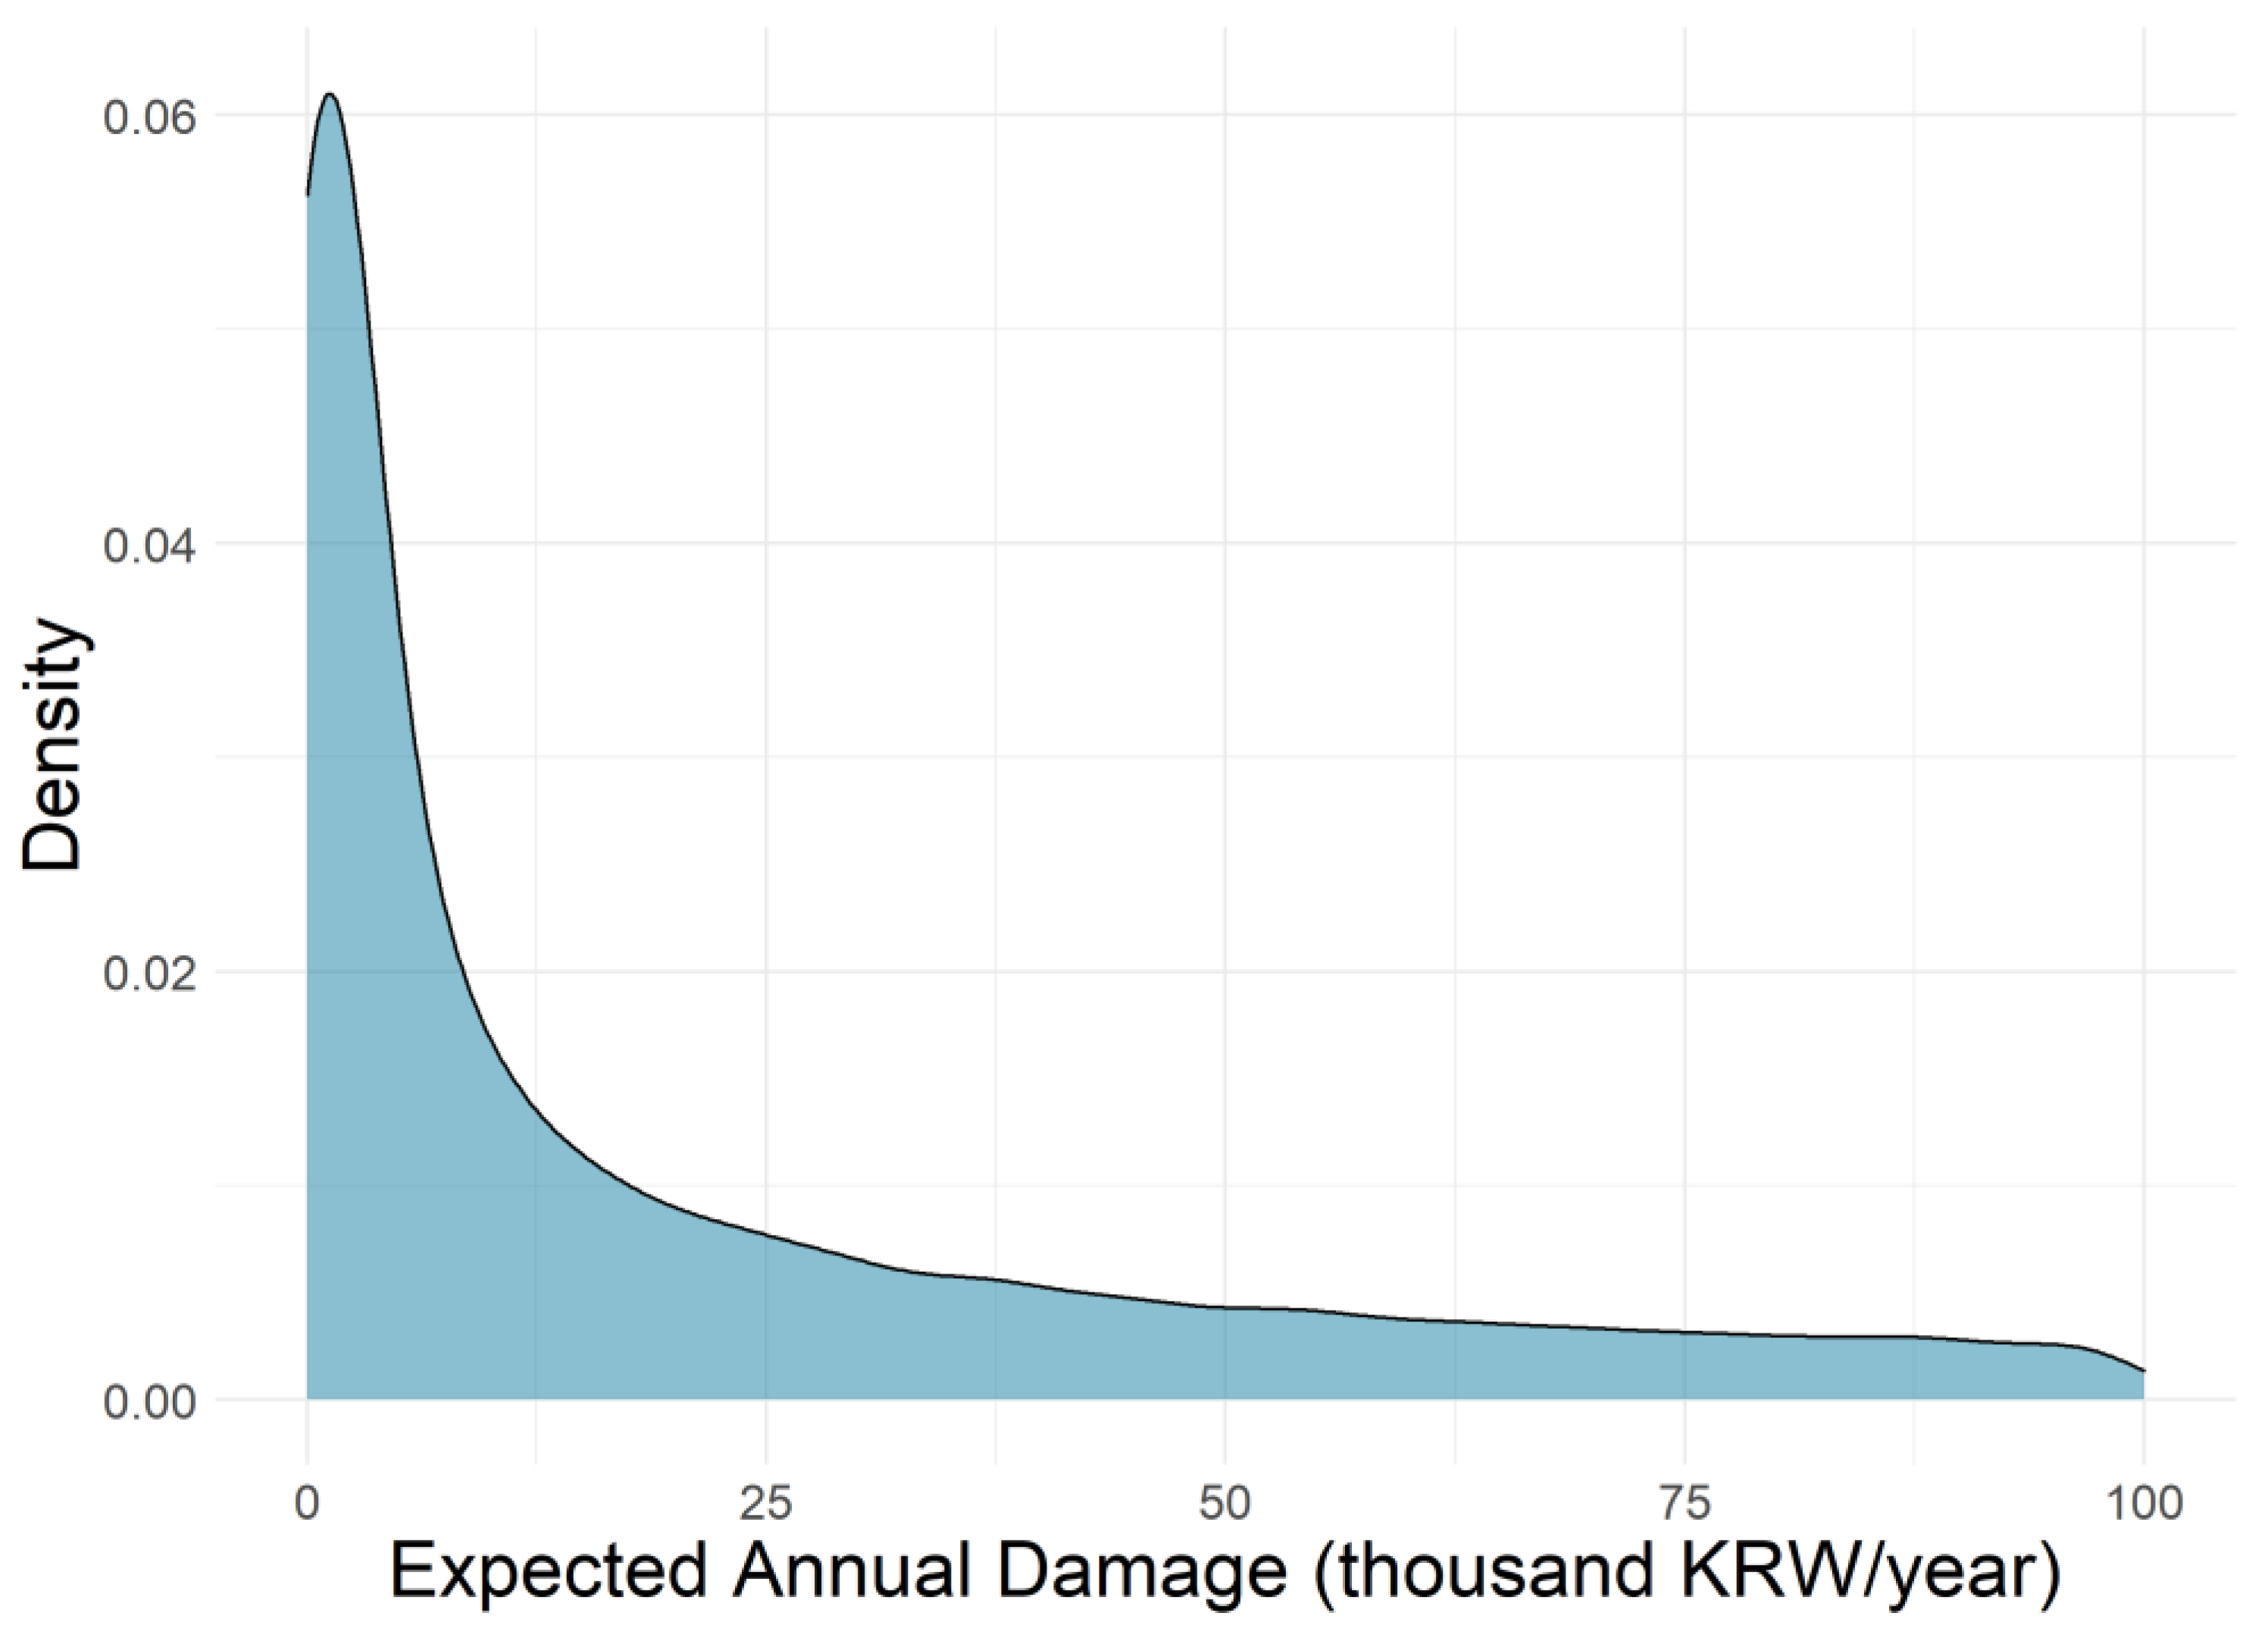
Figure 6.
Ratio of damage across five asset categories.
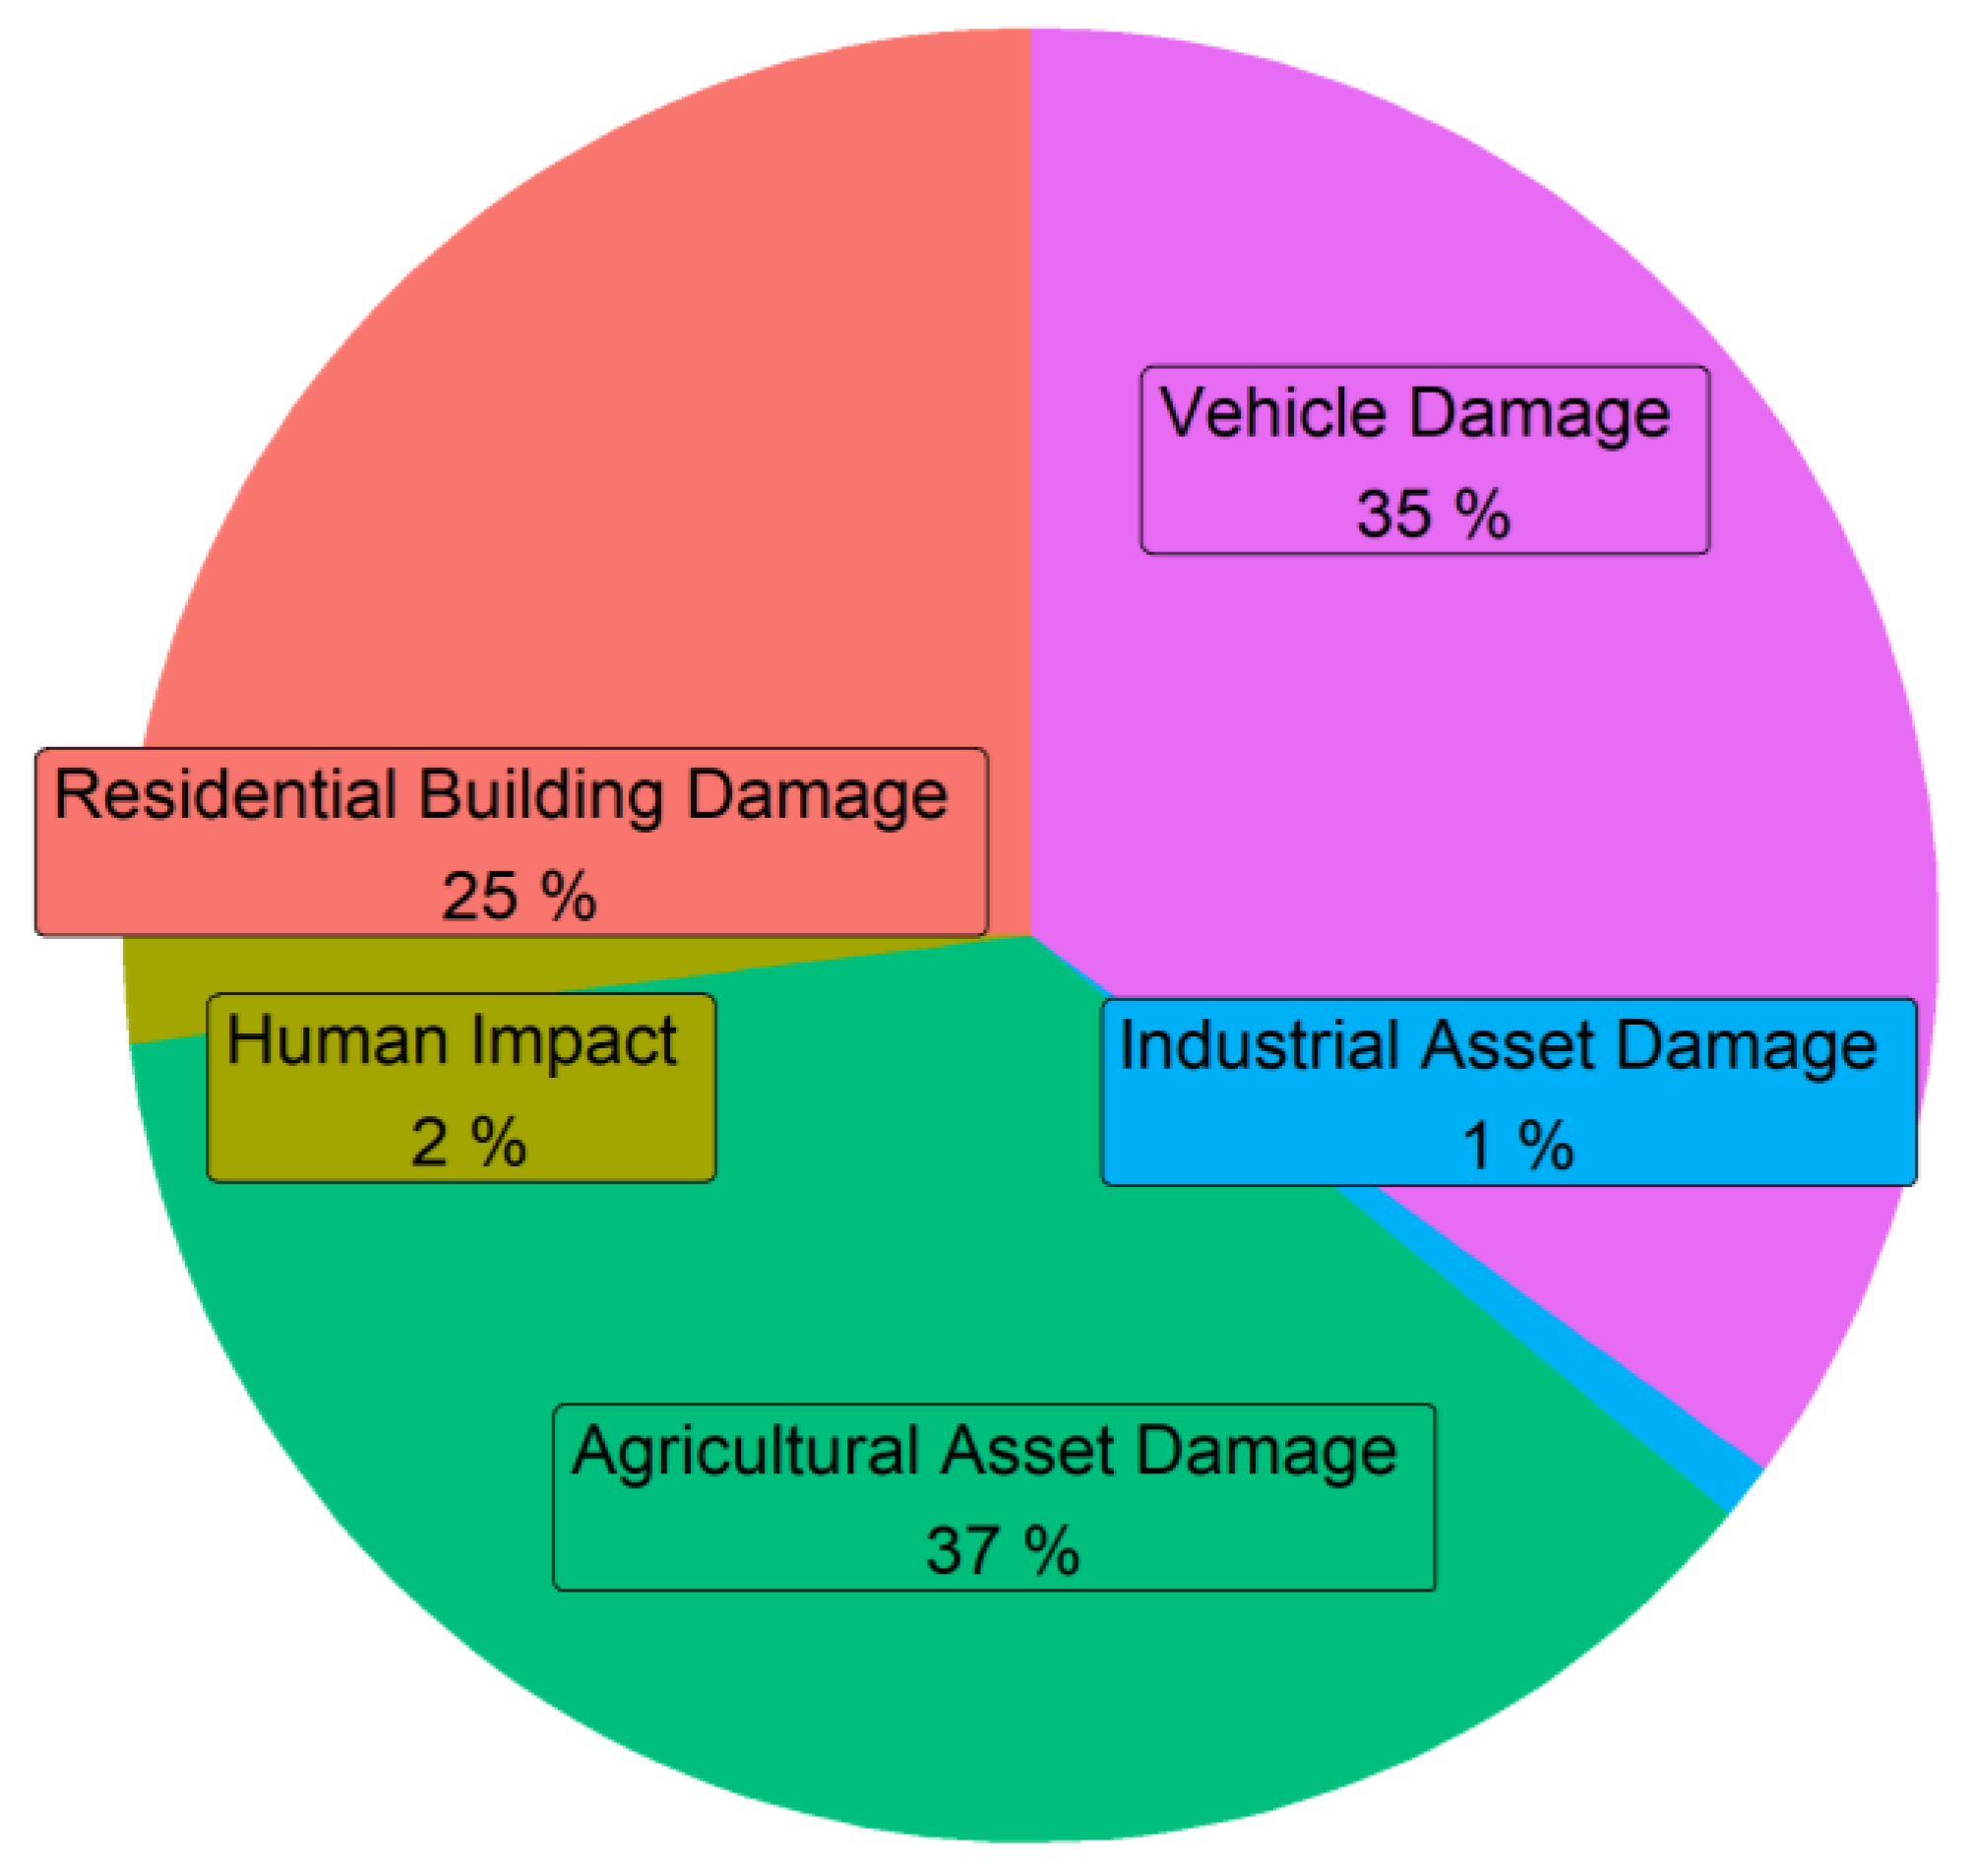
Figure 7.
Relationship between EAD and national flood defense level. Each point denotes a river or stream, encompassing all 596 rivers and streams in the study region. The flood defense return period is calculated as the average of both upstream and downstream values. EAD is expressed in logarithmic form for better visibility.

Table 1.
Change of the characteristic for precipitation in 22 meteorological observatory sites in the Nakdong River from 1976 to 2020 years.
Table 1.
Change of the characteristic for precipitation in 22 meteorological observatory sites in the Nakdong River from 1976 to 2020 years.
| Meteorological Observatory Number | Meteorological Observatory | Latitude | Longitude | Average Annual Precipitation | Maximum Daily Precipitation per Year | ||||
|---|---|---|---|---|---|---|---|---|---|
| Average (mm) | Increase Rate (mm/year) | Increasing Trend | Average (mm) | Increase Rate (mm/year) | Increasing Trend | ||||
| 294 | Geoje | 34.888 | 128.605 | 1860.5 | 8.1 | △ * | 184 | 0.5 | △ |
| 295 | Namhae | 34.817 | 127.926 | 1848.5 | 8.3 | △ * | 190.4 | 0.3 | △ |
| 289 | Sancheong | 35.413 | 127.879 | 1537.9 | 3.9 | △ | 172.4 | 0.8 | △ |
| 159 | Busan | 35.105 | 129.032 | 1528.2 | 5.6 | △ | 153.9 | 0.4 | △ |
| 155 | Changwon | 35.17 | 128.573 | 1509.3 | 1.2 | △ | 150.1 | 0.3 | △ |
| 192 | Jinju | 35.164 | 128.04 | 1507.5 | 1.8 | △ * | 150.6 | −0.3 | ▼ |
| 162 | Tongyeong | 34.845 | 128.436 | 1477.7 | 8.0 | △ | 138.9 | 0.0 | - |
| 285 | Hapcheon | 35.565 | 128.17 | 1288.4 | 3.5 | △ | 135.4 | 1.1 | △ |
| 284 | Geochang | 35.667 | 127.909 | 1280.9 | 1.6 | △ | 123.6 | 0.3 | △ |
| 272 | Yeongju | 36.872 | 128.517 | 1276.5 | 3.5 | △ | 121.2 | 0.0 | - |
| 152 | Ulsan | 35.56 | 129.32 | 1271.7 | 0.6 | △ | 136.9 | 0.1 | △ |
| 273 | Mungyeong | 36.627 | 128.149 | 1257.2 | 3.8 | △ | 108.4 | 0.4 | △ |
| 288 | Miryang | 35.491 | 128.744 | 1227.3 | −1.1 | ▼ | 125.4 | −0.7 | ▼ |
| 271 | Bonghwa | 36.944 | 128.915 | 1178.9 | −6.1 | ▼ | 126.4 | −0.8 | ▼ |
| 138 | Pohang | 36.033 | 129.38 | 1151.9 | 3.3 | △ | 126.4 | 0.9 | △ |
| 130 | Uljin | 36.992 | 129.413 | 1139.9 | 5.0 | △ | 118.2 | 1.7 | △ ** |
| 277 | Yeongdeok | 36.533 | 129.409 | 1078.8 | 3.7 | △ | 112.4 | 0.9 | △ |
| 279 | Gumi | 36.131 | 128.321 | 1070.2 | 5.4 | △ | 104.1 | 0.9 | △ |
| 143 | Daegu | 35.885 | 128.619 | 1059.8 | 2.1 | △ | 109.3 | 0.5 | △ |
| 281 | Yeongcheon | 35.977 | 128.951 | 1045.9 | 2.7 | △ | 107.3 | 0.0 | - |
| 136 | Andong | 36.573 | 128.707 | 1018.0 | 3.4 | △ | 95.8 | 0.4 | △ |
| 278 | Uiseong | 36.356 | 128.689 | 995.8 | 0.4 | △ | 94.5 | −0.1 | ▼ |
Notes: - no trend, △ upward trend, ▼ downward trend, * 95% confidence level, and ** 99% confidence level.
Table 2.
Depth-damage function expressed as a percentage of asset value for each asset group.
| Asset Groups | Below 0.5 m | 0.5 m~1.0 m | 1.0 m~2.0 m | 2.0 m~5.0 m | above 5.0 m | |
|---|---|---|---|---|---|---|
| Residential Buildings | Building Structure | 0 | 9.1 | 24.5 | 53.8 | 66.8 |
| Building Contents | 6.6 | 15.3 | 60.8 | 98.8 | 100 | |
| Agricultural Assets | Paddy | 27.0 | 27.0 | 100 | 100 | 100 |
| Farm | 51.0 | 51.0 | 100 | 100 | 100 | |
| Farm Building | 31.0 | 31.0 | 100 | 100 | 100 | |
| Industrial Assets | Fixed Assets | 23.2 | 45.3 | 78.9 | 98.9 | 100 |
| Stock Assets | 12.8 | 26.7 | 58.6 | 96.6 | 100 | |
| Human Impact | Vulnerable Population | 0.03 | 0.03 | 0.09 | 0.09 | 0.09 |
| General Population | 0.01 | 0.01 | 0.04 | 0.04 | 0.04 | |
| Vehicles | Personal Vehicles | 3.9 | 53.5 | 97.2 | 100 | 100 |
| Commercial Vehicles | 1.3 | 34.8 | 91.4 | 100 | 100 | |
| Motorcycles | 3.9 | 53.5 | 97.2 | 100 | 100 | |
Note: Damage is expressed as a percentage (%) of each asset value.
Table 3.
EAD by asset categories across the five most affected streams/rivers (in million USD, annually).
Table 3.
EAD by asset categories across the five most affected streams/rivers (in million USD, annually).
| Streams | Residential Building Damage | Agricultural Asset Damage | Industrial Asset Damage | Human Impact | Vehicle Damage | EAD | Flood Defense Return Period (Upstream) | Flood Defense Return Period (Downstream) |
|---|---|---|---|---|---|---|---|---|
| Haeban | 7.1 | 10.7 | 0.4 | 0.6 | 11.8 | 30.6 | 30 | 100 |
| Buk | 7.5 | 4.4 | 0.1 | 0.3 | 5.2 | 17.6 | 80 | 100 |
| Jucheon | 4.9 | 2.9 | 0.1 | 0.3 | 6.2 | 14.4 | 100 | 100 |
| Dabang | 7.0 | 0.0 | 0.0 | 0.3 | 5.9 | 13.2 | NA | 100 |
| Dong | 0.4 | 5.7 | 0.1 | 0.1 | 0.7 | 7.1 | 50 | 50 |
Note: Damage is expressed in million USD, and the flood defense return period is expressed in years.
Table 4.
Improvement of return period of flood defense structures in rivers by considering flood vulnerability in the basin river plan of Republic of Korea.
Table 4.
Improvement of return period of flood defense structures in rivers by considering flood vulnerability in the basin river plan of Republic of Korea.
| River—Grade | Scale of the Flood Defense Plan (Return Period) | Flood Vulnerability | Remarks |
|---|---|---|---|
| Populated areas, Asset-dense areas, Industrial complexes, Major national facilities, etc. (Flood defense grade A) | 200~500 years or more | Very High or High | Determination of design frequency considering climate change and quantitative flood analysis (if necessary, up to 500 years or more) |
| Commercial facilities, Industrial facilities, Public facilities, etc. (Flood defense grade B) | 100~200 years | High | - |
| Agricultural land, etc. (Flood defense grade C) | 50~80 years | Medium | - |
| Wetlands, Bare areas, etc. (Flood defense grade D) | less than 50 years | Low | Establishment of adaptation measures instead of defense in consideration of climate change and quantitative flood analysis |
| National rivers, Local rivers | 100~200 years, 50~200 years | - | Setting the frequency of differentiated design considering the amount of flood damage |
Disclaimer/Publisher’s Note: The statements, opinions and data contained in all publications are solely those of the individual author(s) and contributor(s) and not of MDPI and/or the editor(s). MDPI and/or the editor(s) disclaim responsibility for any injury to people or property resulting from any ideas, methods, instructions or products referred to in the content. |
© 2023 by the authors. Licensee MDPI, Basel, Switzerland. This article is an open access article distributed under the terms and conditions of the Creative Commons Attribution (CC BY) license (https://creativecommons.org/licenses/by/4.0/).
Share and Cite
MDPI and ACS Style
Jung, K.; An, H.; Hwang, S.; Seo, S.B.; Park, H.; Park, C.; Yoo, J. Assessing the Suitability of the Flood Defense Policy of Republic of Korea for Risk Reduction in Local Rivers. Water 2023, 15, 3908. https://doi.org/10.3390/w15223908
AMA Style
Jung K, An H, Hwang S, Seo SB, Park H, Park C, Yoo J. Assessing the Suitability of the Flood Defense Policy of Republic of Korea for Risk Reduction in Local Rivers. Water. 2023; 15(22):3908. https://doi.org/10.3390/w15223908
Chicago/Turabian StyleJung, Kichul, Heejin An, Sewon Hwang, Seung Beom Seo, Hyemin Park, Chan Park, and Jonghyun Yoo. 2023. "Assessing the Suitability of the Flood Defense Policy of Republic of Korea for Risk Reduction in Local Rivers" Water 15, no. 22: 3908. https://doi.org/10.3390/w15223908
Note that from the first issue of 2016, this journal uses article numbers instead of page numbers. See further details here.