
Comprehensive Performance Assessment for Sponge City Construction: A Case Study

1
State Key Laboratory of Simulation and Regulation of Water Cycle in River Basin, China Institute of Water Resources and Hydropower Research, Beijing 100038, China
2
Research Center on Flood and Drought Disaster Prevention and Reduction, Ministry of Water Resources, Beijing 100038, China
3
Key Laboratory of Water Safety for Beijing-Tianjin-Hebei Region, Ministry of Water Resources, Beijing 100038, China
*
Authors to whom correspondence should be addressed.
Water 2023, 15(23), 4039; https://doi.org/10.3390/w15234039
Submission received: 26 September 2023
/
Revised: 10 November 2023
/
Accepted: 17 November 2023
/
Published: 21 November 2023
(This article belongs to the Special Issue Assessment of Urban Pluvial Flood Risk and Utilization of Rainwater & Flood Resources, 2nd Edition)
Abstract
:Sponge City Construction (SCC) can effectively solve urban areas’ water problems. Green infrastructure (GI), the core of SCC, exhibits a multifaceted capacity to deliver many co-benefits, while grey infrastructure primarily serves the single function of controlling rainfall runoff. However, existing assessment indicator systems fail to either consider or evaluate comprehensive impacts. In this work, a comprehensive indicator system has been established to assess the co-benefits of five different GI measures. The system includes twelve indicators from four aspects, i.e., disaster reduction, economic, environmental, and social benefits. This newly established assessment system is applied to Jinan as a case study. Six out of twelve indicators are evaluated using the self-developed Flood Risk Analysis Software and empirical equations. The results show that the inundation reduction ratios are 11.02%, 9.32%, and 8.02% under the 24-h design rainfall with a 5-year, 10-year, and 20-year return period, respectively. In addition, the corresponding direct flood loss reduction rates are 13.86%, 4.28%, and 4.09%. That is, as the rainfall return periods increase, the disaster reduction benefits become less pronounced. On the contrary, other benefits, e.g., groundwater recharge volumes, are more obvious. The corresponding groundwater recharge volumes are 2.23 million m3, 2.86 million m3, and 2.87 million m3, respectively. The proposed indicator system can be adopted to assess the performances of the different GI combinations, which provides effective support and reference to decision-makers in SCC at the planning and design stages.
1. Introduction
In the past few decades, China’s urbanization has experienced rapid growth, with the urbanization rate increasing from 17.9% in 1978 to 65.22% by the end of 2022 [1]. This swift urbanization has led to the conversion of natural forests and agricultural lands into impermeable surfaces and road networks [2], resulting in a significant reduction in surface roughness, an elevated surface runoff coefficient, and an increase in runoff velocity. Consequently, rainfall runoff quickly converges toward drainage facilities, such as drainage pipelines and ditches, reducing the concentration time and advancing the peak time [2,3]. Moreover, urbanization has altered the connectivity of surface water systems, leading to a substantial decline in the region’s original storage capacity. However, due to the swift discharge of rainfall runoff into rivers, peak flow rates increase, and river water levels rise rapidly [4]. This situation not only poses significant challenges for flood control measures, such as embankments, but also hampers the functioning of drainage systems, contributing to instances of urban pluvial flooding [5]. Additionally, climate change exacerbates the complexity and uncertainty of urban pluvial flood problems [6,7]. With climate change, heavy rainfall events become more frequent and intense [8]. Consequently, even minor changes in rainfall intensity and duration may result in severe pluvial flooding, placing additional strain on urban flood management systems [9,10].
In response to the water challenges faced by urban areas, the Chinese government launched the Sponge City Construction (SCC) initiative in 2013. The core principles of SCC revolve around natural accumulation, infiltration, and purification. These principles are implemented through the use of low-impact development (LID) or green infrastructure (GI), which effectively address water-related problems by incorporating measures such as infiltration, detention, storage, purification, utilization, and drainage [11,12]. GI represents a cost-effective and resilient approach that offers multifaceted benefits beyond traditional grey infrastructure [13]. These benefits include the reduction of rainfall runoffs [14,15,16,17], the improvement of runoff quality [17,18,19], and the mitigation of the urban heat island effect [20], among others.
Currently, much of the research focuses on analyzing the benefits of a single or combined GI in controlling rainfall runoff, including flow peak reduction, runoff reduction, and flow peak delay [20,21], as well as on improving water quality through monitoring, numerical simulations, and other methods [22]. Some studies also consider construction and maintenance costs as economic benefits [20]. However, most research does not consider the benefit of the decreased economic loss. Furthermore, most research tends to overlook the contributions of GIs to enhancing recreational spaces, water culture, and public awareness. This oversight, to some extent, limits the public’s deep understanding of the social and ecological benefits of GIs, consequently constraining their widespread application and support [23]. In general, there is relatively limited research on the comprehensive benefits of GIs [20]. Certain developed nations and researchers have developed well-established comprehensive benefit evaluation frameworks tailored to their specific contexts. Notable examples include the Triple Bottom Line (TBL) approach in the United States and the “Assessment Standard for Sponge City Construction Effect” issued by MHURD (Ministry of Housing and Urban–Rural Development) in China [24]. However, many of these evaluation methods heavily rely on monitoring data, making them less directly applicable during the planning and design stages of Sponge City projects. Therefore, to further advance SCC, garner widespread public support, and attract social capital for the development of sponge cities, there is a pressing need to establish a comprehensive evaluation index system for SCC that takes into account its multifaceted benefits [25,26,27,28].
This study proposes an innovative evaluation index system tailored for diverse GIs, aiming to provide an effective assessment of their overall performance. First of all, we design the evaluation index system by aligning it with the core functionalities and control objectives of five distinct types of GI. This system takes into consideration four critical aspects: disaster reduction and economic, social, and environmental benefits. Subsequently, we apply this evaluation index system to the Xinglong SCC pilot area located in Jinan City and conduct an extensive analysis of the multifaceted benefits arising from the implementation of these GI measures. Specifically, we employ our in-house developed Flood Risk Analysis Software (FRAS) to evaluate the disaster reduction benefits. For the assessment of environmental and social benefits, we combine empirical equations and qualitative analysis.
2. Materials and Methods
2.1. Establishment of an Assessment Index System
2.1.1. Evaluation Index System
There exists a diverse array of GI types, each characterized by distinct structures, functions, and control objectives, leading to varied benefits. In this research, five specific GI types are identified based on their structures, primary functions, and control objectives, namely green roofs, bioretention systems, permeable pavements, rainwater harvesting systems, and bioswales. An essential advantage of GI measures over single-function grey infrastructure is their capacity to generate a multifaceted impact, encompassing economic, social, and environmental benefits [26]. Beyond the main functions of urban flood management and water quality improvements, GI also provides aesthetic and recreational values, as well as water culture and biodiversity values [22].
This study delves into the identification and selection of 12 evaluation indicators (Figure 1), specifically focusing on disaster reduction benefits (indicators 1–4), economic benefits (indicators 5–6), environmental benefits (indicators 7–9), and social benefits (indicators 10–12). It is crucial to recognize that the performance indicators for different GIs may differ, as depicted in Figure 1.
Disaster reduction benefits directly assess the effectiveness of individual and combined GIs in controlling rainfall runoff and the resulting reductions in socio-economic losses. GI’s control of flood management is one of its most recognized functions [22]. Existing studies often employ evaluation indicators such as total runoff control rate, peak runoff reduction rate, and delay in peak occurrence [20,29]. Considering the objectives of SCC, which aims to prevent both puddling during light rains and pluvial flooding during heavy rains, this study selects four indicators, i.e., inundation area reduction rate, the reduction proportion of the affected population, the affected GDP reduction rate, and the disaster-related direct economic loss reduction rate.
Economic benefits highlight the increased availability of rainwater resources. Additionally, as GIs have the ability to purify rainfall runoffs, they can partially reduce the volume of runoff requiring treatment [26]. While some studies incorporate construction, operation, and maintenance costs of GIs as economic indicators [20], this paper omits these costs from consideration. Consequently, two indicators of economic benefits are identified based on an analysis of the GI’s functions.
Environmental benefits are associated with GI’s ability to improve the quality of storm-water runoff, thereby reducing non-point source pollution [30]. The construction of GIs, which increases surface permeability, can also lead to increased groundwater recharge [31]. Furthermore, GI contributes to mitigating the urban heat island effect [27]. As a result, this research identifies three indicators relating to environmental benefits.
Social benefits encompass the positive impacts of GIs on enhancing the aesthetic appeal of the environment, creating spaces for water-related activities, leisure, and entertainment, and fostering a harmonious relationship between humanity and nature [32]. As the public is seldom aware of the cause of urban pluvial flooding and pollution [22], GIs can play a crucial role in raising the public’s awareness of storm-water management [33]. Thus, three indicators of social benefits are selected in this study.
2.1.2. Definition and Evaluation Methods of the Indicators
Table 1 presents a compilation of evaluation indicators along with their definitions and assessment methods. The selection of assessment methods depends on the specific purpose, such as proposal comparison and selection during the planning and design phase, performance evaluation, or scientific research. Additionally, the availability of data also plays a significant role in determining the appropriate evaluation approach. Various methods can be utilized, including model simulation, monitoring data analysis, (empirical) formula calculation, expert scoring, and qualitative description.
Field observation stands as the most direct approach to gathering actual data, providing a substantial amount of monitoring information and serving as valuable data for model calibration and validation. However, conducting field observations on a large scale, such as within river basins, is challenging [15]. On the other hand, numerical simulation is a highly effective method during the design and optimization stages, allowing for the simulation of water quantity and quality control effects of GIs at different spatial scales. In recent years, an increasing amount of research has been conducted through numerical simulation. The widely used models include SWMM, MUSIC, HEC-HMS, MOUSE, SUSTAIN, and others.
In cases where a long series of monitoring data are available before and after the implementation of GIs, the construction performance can be assessed based on these monitoring data. Conversely, in areas lacking such data or where construction/renovation projects are still in the planning and design phase, model simulation, empirical (formula) calculation, or qualitative description are recommended as suitable evaluation approaches.
2.2. Case Study
2.2.1. Study Area
The Xinglong pilot area, located in the central downtown of Jinan, Shandong Province, is selected as the study area. It covers an area of about 39 km2, including 16.7 km2 of mountains and 22.2 km2 of development and construction areas. The topography is generally high in the east and south with mountains and hills, low in the north and west, and has piedmont slopes in the middle (Figure 2). Due to the special topography characteristics and the frequency of extreme rainfall events, the study area is vulnerable to floods, especially during short-duration torrential rains in the summer. In addition, the surface water quality is poor. The sewage treatment capacity is inadequate. Hence, the overflow wells in the old urban area are likely to cause sewage overflow during flood season. Additionally, water resources are unevenly distributed on a temporal and spatial scale, with low per capita water availability and low exploitation rates. The connectivity between natural waters has been undermined. The increase in the area of impermeable surfaces has impeded rainwater infiltration, resulting in a decrease in groundwater recharge. At the same time, the urban water supply has increased, giving rise to an increase in groundwater withdrawal. The two together contribute to a lower water table, which in turn affects spring spouting in the city [31]. As Jinan is dubbed the City of Springs, it is of great significance to promote spring preservation. Finally, due to low awareness of urban drainage facility protection among citizens, domestic waste is flooded into the municipal pipe network, which is likely to block the pipe network [34].
Hence, the city of Jinan hopes to promote spring preservation through Sponge City Construction while addressing urban flooding and water conservation.
2.2.2. Distribution of GIs
According to the aforementioned water problems, we set five types of GIs in the study area, including green roofs (0.26 km2), sunken greenbelts (0.31 km2), retained greenbelts (1.32 km2), infiltration greenbelts (0.46 km2), and permeable pavements (0.18 km2). Among them, the sunken greenbelt, the infiltration greenbelt, and the retained greenbelt are considered bioretention systems. The main features of the adopted GIs are listed in Table 2. Several design parameters of GIs are sensitive according to our research. However, this study sets the deployment of GIs according to the Implementation Plan of the Sponge City Construction Pilot Project in Jinan, Shandong Province (2015–2017), as shown in Figure 2.
2.2.3. Selection of Assessment Indicators
Given the above-mentioned problems, the study area is prone to flooding, water quality deterioration, groundwater overdraft, and other problems. Hence, we select six indicators, as shown in Figure 3. The indicators of inundation area reduction rate and disaster-related direct economic loss reduction rate are selected to evaluate the disaster reduction benefits. The inundation area reduction rate directly reflects the effectiveness of combined measures in controlling the inundation area, while the direct economic loss reduction rate not only reflects the effectiveness of various facilities in controlling flooding at different depths but also indicates the benefits in property loss reduction after the construction of GIs. In addition, indicators such as SS load reduction rate, increasing groundwater recharge, enhancing environmental aesthetics, and strengthening public education are selected to evaluate the comprehensive benefits.
2.2.4. Model Development for Evaluating Disaster Reduction Benefit
FRAS, independently developed by the research team, is adopted for flood hazard simulation and flood loss assessment. Four rainfall runoff generation calculation methods are embedded in the FRAS (Figure 4). In this study, the Soil Conservation Service Curve Number (SCS-CN) method is adopted to simulate rainfall runoff generation [4]. Additionally, because the study area is relatively large and the pipe network is relatively complete, the equivalent pipe network model is adopted to simulate underground drainage. The pipe network in the model is generalized according to inter-grid connections containing drainage pipes, including I-shaped, L-shaped, T-shaped, cross-shaped, and star-shaped connections.
The flood depth–loss rate relationship method is used to calculate the disaster-related direct economic losses according to the following equation [36]:
where Wij is the value of the ith property under jth water depth in a flooding area, and is the flood loss rate of the ith property under jth water depth.
The values of major assets (Table 3) in the study area are determined according to Jinan’s Statistical Yearbook 2014 [37]. To be specific, residents’ household property is converted into the ownership of durable consumer goods per 100 households in the Shizhong District and the Lixia District of Jinan with the current market price method. The value of other industrial and commercial assets is obtained directly from the statistical yearbooks of the administrative districts involved [37]. The construction cost of roads is counted as the repair cost with reference to China’s budget quotas for relevant highway and railway projects.
The determination of the flood loss rate relationship is related to the degree of inundation, category of property, season and scope of inundation, rescue time, and rescue measures in the affected area. Usually, a certain number of typical areas of a certain size in the affected area are selected for investigation, and then, based on such field investigation, the correlation between the loss rate and factors such as inundation depth, time, and flow rate is established. The flood loss rate relationship for different categories of assets is determined according to the characteristics of the study area with reference to the compilation results of a flood risk map in Jinan.
2.2.5. Empirical Formulas for Evaluating Environmental Benefits
We calculate groundwater recharge through the simple water balance relationship among precipitation, surface runoff, groundwater recharge, and evaporation, by using the surface runoff method [38], which is represented in Equation (2):
where I is the volume of surface water infiltration, m3; P is precipitation, m3; R is the runoff volume, m3, which is the sum of discharges and the amount of accumulated water in this paper according to the simulation results of the flood simulation model; and E is evaporation volume, which is assumed to be zero during the individual rainfall event in this paper [18].
The study analyzed the possible increase in groundwater recharge after the implementation of GIs by calculating the groundwater recharge before and after such installation.
Equation (3) for urban non-point source pollution load, as proposed by Schueler [39], is used to estimate the possible runoff pollution load before and after the installation of GIs in the study area. The reduction in non-point source pollution load after the installation of GIs is obtained through a comparison between the pollution load before and after such implementation:
where Lt is the runoff discharge pollution load during the calculation period (t), kg; CF is a correction factor for rainfall events. Statistically, CF is expressed as the fraction of the rainfall events within a year that result in surface runoff. However, if statistical information is unavailable, we have to independently analyze each individual rainfall event. In this scenario, CF is set to 1 if a rainfall event produces surface runoff and 0 otherwise. Throughout this paper, we treat each rainfall event independently, and thus CF is either 1 or 0. is the average runoff coefficient of the study area, which is the ratio of runoff to precipitation in a study area and is calculated according to the numerical simulation results in each scenario; A is the rainwater harvesting area of runoff, km2, which is calculated across the study area in this paper; P is the precipitation during the calculation period (t), mm; and C is the weighted average concentration of pollutants in rainfall runoff, mg/L. In the United States, the value of C can be obtained from local urban storm data, whereas in China, most cities have no data on pollutant concentrations of storm runoff. Since pollutants in the rainfall process vary greatly with factors such as rainfall characteristics and land use in study areas, resulting in vast differences in the pollutant concentration of rainfall runoff from the same rainfall event in different areas or from different rainfall events in the same area, the event mean concentration (EMC) of multiple rainfall events is often used as the pollutant concentration of rainfall runoff, i.e., the flow-weighted average of instantaneous pollutant concentrations throughout a rainfall runoff process, which can be calculated using Equation (4):
where Cj is the pollutant concentration measured at the jth period, g/m3; Vj is the runoff volume at the jth period, m3; and n is the number of time segments.
Then, Equation (3) can be rewritten as Equation (5):
SS load reduction is one of the important indicators to assess the effectiveness of GIs in improving rainfall runoff quality, but in practice, it is hard to assign values to SS concentrations and the removal effectiveness of GIs. This is because the runoff pollution varies greatly with land use, and the materials or structural design of different GIs have a significant impact on the control of rainfall runoff water quality. Therefore, a large number of results suggest a marked difference in the effectiveness of different types of GI and even of the same type of GI in controlling SS.
Due to the lack of a long series of monitoring data before and after the implementation of GIs in the study area, the monitoring data from a similar area (the monitoring data of Beijing) are used as the concentration of SS in rainfall runoff in the study area, with values listed in Table 4. The EMC value of SS is the area-weighted average, 243.4 mg/L, according to the data on different land uses in Table 4.
The removal efficiency of SS load in rainfall runoff for different GIs is sourced from long-term monitoring data in the Green Values software developed by the United States Environmental Protection Agency (USEPA), as shown in Table 5.
According to Table 5, the integrated reduction rate of SS in rainfall runoff is assumed to be 65% for all the combined GIs implemented in the study area.
2.2.6. Scenario Settings
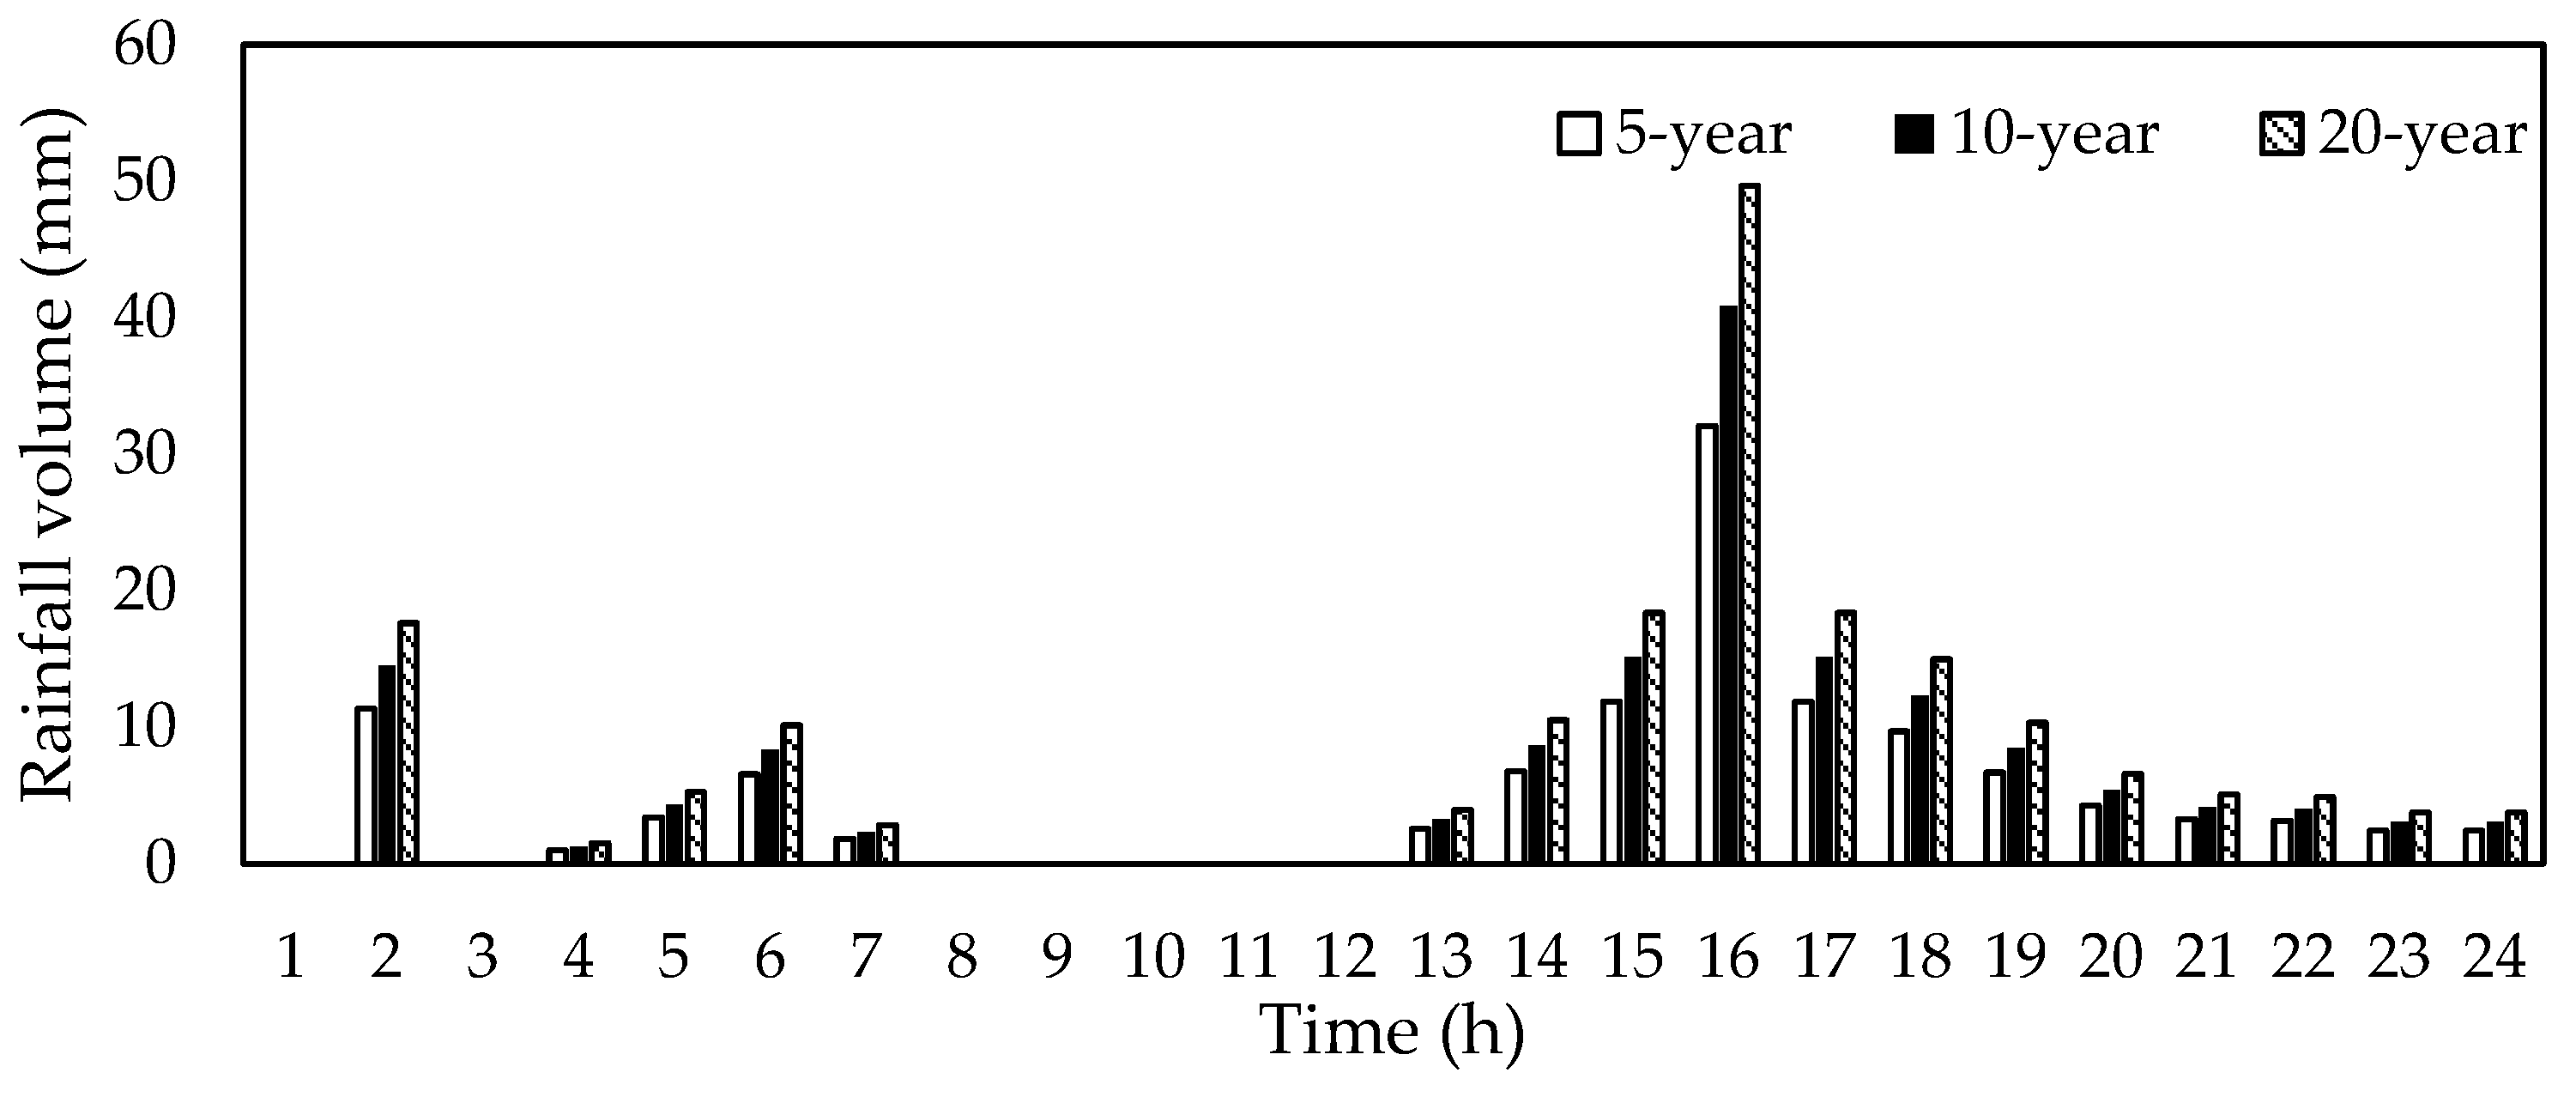
We set 24-h design rainfall scenarios with 5-year return period rainfall (hereinafter referred to as 5-year), 10-year return period rainfall (hereinafter referred to as 10-year), and 20-year return period rainfall (hereinafter referred to as 20-year) for the study area, which is seen in Figure 5, to simulate the indicators before and after the installation of combined facilities. Then, we analyze the disaster reduction benefits and comprehensive benefits. The design rainfall is provided by the Jinan Hydrology Bureau.
3. Results and Discussion
3.1. Disaster Reduction Benefits
Table 6 lists the evaluation results of the disaster reduction benefits of GI measures in the study area. The results show that, in the case of a 5-year rainfall event, the reduction rate for the inundation area is the largest, which decreases as the rainfall magnitude grows. Correspondingly, the reduction rate for disaster-related direct economic loss is 13.86%, which quickly falls to 4.28% under 10-year events and 4.09% under 20-year events. In other words, combined GIs bring certain disaster reduction benefits. The disaster reduction benefits are the most significant under 5-year events. As the rainfall magnitude increases, the disaster reduction benefits gradually shrink, and the disaster-related direct economic loss reduction rate decreases significantly.
The simulation results are consistent with the conclusions of other related studies [40,41]. GIs abroad are usually designed as auxiliaries for grey infrastructure such as storm sewers, which reduce the surface runoff that goes into a sewer system and postpone the peak runoff time by storing and retaining rainfall runoff where it appears. GIs of a fixed size and structure have the maximum rainfall runoff reduction, which means the rainfall runoff reduction rate of GIs decreases as rainfall increases [13,15]. For example, Carpenter and Kaluvakolanu [40] divided the 21 rainfall events observed during their research into three magnitudes, light (<12.7 mm), moderate (12.7–25.4 mm), and heavy (>25.4 mm), and found that the average runoff coefficients of green roof surfaces were 0.044, 0.131, and 0.591, respectively. Yin et al. [41] divided the observed rainfall events into three categories, i.e., light rain (<10 mm), moderate rain (10–25 mm), and heavy rain (>25 mm), and they found that the average control rates of rainfall runoff were 98.1%, 73.8%, and 52.9%, respectively.
Jinan is topographically high in the south and low in the north, and rainfall runoff converges downstream in its urban area, making the area prone to pluvial flooding. Climate change has led to an increase in the frequency of extreme rainfall events, especially in short-duration torrential rains in the summer. Urbanization has resulted in an increase in surface impermeability and a sharp decrease in the size of permeable areas such as green spaces and wetlands, impairing the retention and storage capacity. The drainage facilities there are subject to low standards, which merely require the facilities to meet the requirements of preventing floods that occur once every 2–3 years. The construction of GIs can help increase the total capacity of the study area.
3.2. Integrated Performance Assessments
Compared with grey infrastructure, GIs deliver a combination of social, environmental, and other benefits, enhancing urban resilience, rather than producing significant disaster reduction benefits [22]. Table 7 lists the integrated performance assessment results of GIs implemented in the study area. The results show that under the 24-h design rainfall scenarios with 5-year, 10-year, and 20-year return periods, the reduction rates of SS load are 68.552%, 67.942%, and 67.314%, respectively. On one hand, GI reduces the concentration of pollutants that go into sewer systems by absorbing pollutants through its soil layer or settling them. On the other hand, some GI has vegetation on the surface layer, which can partly purify (through vegetation purification, sediment settlement, etc.) the water flowing through by slowing runoff.
The groundwater recharge is increased by 2.23, 2.86, and 2.87 million m3 under three scenarios. The groundwater recharge volumes in the study area increase as the rainfall magnitude grows. Jinan has a special demand for enhancing infiltration and preserving springs compared to other cities. Traditional urbanization increases the surface impermeability rate, while permeable pavements and infiltration greenbelts can significantly increase the surface water infiltration rate, thus contributing to groundwater recharge [31]. The results suggest that combined GIs can partly enhance infiltration and promote spring preservation in Jinan. As the city has set the strategic goal of “restoring and maintaining perennial springs”, SCC has a positive effect on groundwater recharge.
In addition, GIs can enhance environmental aesthetics, expand recreational spaces, and improve public awareness of urban flooding. At present, public engagement in China’s SCC is mainly in the form of promotion and publicity [28]. The public’s awareness of different GIs is relatively low [22] regarding the value of GIs. Allowing community residents to participate in the supervision and management of community-based GIs and even in the decision-making process can fully mobilize their enthusiasm and sense of responsibility [40] and provide them with an insightful understanding of the operation and functionality of GIs, ultimately contributing to the sustainable development of sponge cities in China [22].
4. Conclusions
The SCC is indispensable to the sustainable development of Sponge Cities throughout China. In this study, we have established a comprehensive benefit evaluation system tailored to five distinct GIs. The primary objective is to enable comprehensive and effective performance assessments, thereby offering valuable support for decision-making in GI deployment. Through a thorough analysis along four crucial dimensions, i.e., disaster reduction, economic, environmental, and social benefits, we have identified and integrated 12 key indicators into our holistic evaluation system. Applying this index system to Jinan has yielded insights into the pivotal role of SCC in mitigating urban pluvial floods, particularly in the context of small-scale rainfall events. Notably, the efficacy of GIs demonstrates a strong correlation with rainfall volume, and the influence of changing rainfall return periods is manifest. Specifically, these changes significantly affect factors such as inundation area, direct economic loss, SS load, and the corresponding reduction ratios. As rainfall return periods increase, reductions in inundation area and SS load become less pronounced, while groundwater recharge increases.
Our future research directions will primarily focus on four aspects. First, we aim to validate the rationality of the evaluation system by applying it to different areas. Recognizing the lack of data regarding pollutant concentration in rainfall runoff in our study area, we drew from data in a similar city. The next phase will involve conducting field observations of green roofs, sunken green spaces, and various GIs in the study area to acquire more observed data. Second, we will establish an integrated framework for cost-effective SCC, taking into account the costs of GIs. Furthermore, it is essential to acknowledge that our current analysis excludes the influence of evaporation due to our focus on the performance of GIs in individual rainfall events. Our forthcoming research will address this gap by examining GIs’ performance over the long term and incorporating the influence of evaporation. Lastly, our study scope currently excludes consideration of air quality improvement and other potential environmental benefits. We are committed to studying these aspects in the future, expanding our understanding of the multifaceted benefits provided by SCC.
Author Contributions
Conceptualization, Q.Y.; methodology, Q.Y. and J.W.; formal analysis, Q.Y. and J.W.; data curation, Q.Y. and S.W.; investigation, Q.Y. and S.W.; writing—original draft preparation, Q.Y.; writing—review, N.L. All authors have read and agreed to the published version of the manuscript.
Funding
This research was funded by the National Key Research and Development Program of China [No. 2022YFC3006400, No. 2022YFC3006403], the National Natural Science Foundation of China [No. 51909273, No. U2240203], and the Talent Innovation Team for the Strategic Research on Flood and Drought Disaster Prevention of the Ministry of Water Resources [No. WH0145B042021]. The support provided by the IWHR Talented International Expert Program and MWR Talented Youth Expert Funding are also acknowledged.
Data Availability Statement
The data presented in this study area are available on request from the corresponding author.
Acknowledgments
The authors appreciate the editors and anonymous reviewers for their great efforts on the manuscript.
Conflicts of Interest
The authors declare no conflict of interest.
References
- National Bureau of Statistics. The Economic and Social Development Bulletin of the People’s Republic of China in 2019; National Bureau of Statistics: Beijing, China, 2020. (In Chinese)
- Kong, F.; Ban, Y.; Yin, H.; James, P.; Dronova, I. Modeling stormwater management at the city district level in response to changes in land use and low impact development. Environ. Model. Softw. 2017, 95, 132–142. [Google Scholar] [CrossRef]
- Xu, Z.; Cheng, T. Basic Theory for Urban Water Management and Sponge City-Review on Urban Hydrology. J. Hydraul. Eng. 2019, 50, 53–61. (In Chinese) [Google Scholar]
- Li, N.; Meng, Y.; Wang, J.; Yu, Q.; Zhang, N. Effects of Low Impact Development Measures on Inundation Reduction: Taking Jinan Pilot Area as Example. J. Hydraul. Eng. 2018, 49, 1489–1502. (In Chinese) [Google Scholar]
- Cheng, X.T.; Liu, C.J.; Li, C.Z.; Yu, Q.; Li, N. Evolution Characteristics of Flood Risk Under Changing Environment and Strategy of Urban Resilience Improvement. J. Hydraul. Eng. 2022, 53, 757–768, 778. (In Chinese) [Google Scholar]
- Kreibich, H.; Van Loon, A.F.; Schröter, K.; Ward, P.J.; Mazzoleni, M.; Sairam, N.; Abeshu, G.W.; Agafonova, S.; AghaKouchak, A.; Aksoy, H.; et al. The Challenge of Unprecedented Floods and Droughts in Risk Management. Nature 2022, 608, 80–86. [Google Scholar] [CrossRef]
- Ekwueme, B.N. Machine Learning Based Prediction of Urban Flood Susceptibility from Selected Rivers in a Tropical Catchment Area. Civ. Eng. J. 2022, 8, 1857–1878. [Google Scholar] [CrossRef]
- IPCC. Summary for Policymakers. In Climate Change 2021: The Physical Science Basis; IPCC: Geneva, Switzerland, 2021. [Google Scholar]
- Zahmatkesh, Z.; Burian, S.J.; Karamouz, M.; Tavakol-Davani, H.; Goharian, E. Low Impact Development Practices to Mitigate Climate Change Effects on Urban Stormwater Runoff: Case Study of New York City. J. Irrig. Drain Eng. 2015, 141, 04014043. [Google Scholar] [CrossRef]
- Wang, M.; Zhang, D.Q.; Su, J.; Dong, J.W.; Tan, S.K. Assessing Hydrological Effects and Performance of Low Impact Development Practices Based on Future Scenarios Modeling. J. Clean. Prod. 2018, 179, 12–23. [Google Scholar] [CrossRef]
- Qiu, B.X. The Content, Method, and Forecast of Sponge City (LID). Constr. Sci. Technol. 2015, 11–18. (In Chinese) [Google Scholar] [CrossRef]
- Xie, M.; Cheng, Y.; Dong, Z. Study on Multi-Objective Optimization of Sponge Facilities Combination at Urban Block Level: A Residential Complex Case Study in Nanjing, China. Water 2022, 14, 3292. [Google Scholar] [CrossRef]
- Dietz, M.E. Low Impact Development Practices: A Review of Current Research and Recommendations for Future Directions. Water Air Soil Pollut. 2007, 186, 351–363. [Google Scholar] [CrossRef]
- Chui, T.F.M.; Liu, X.; Zhan, W. Assessing Cost-Effectiveness of Specific LID Practice Designs in Response to Large Storm Events. J. Hydrol. 2016, 533, 353–364. [Google Scholar] [CrossRef]
- Ahiablame, L.M.; Engel, B.A.; Chaubey, I. Effectiveness of Low Impact Development Practices: Literature Review and Suggestions for Future Research. Water Air Soil Pollut. 2012, 223, 4253–4273. [Google Scholar] [CrossRef]
- Shah, M.A.; Xu, J.; Carisi, F.; De Paola, F.; Di Sabatino, S.; Domeneghetti, A.; Gerundo, C.; Gonzalez-Ollauri, A.; Nadim, F.; Petruccelli, N.; et al. Quantifying the effects of nature-based solutions in reducing risks from hydrometeorological hazards: Examples from Europe. Int. J. Disaster Risk Reduct. 2023, 93, 103771. [Google Scholar] [CrossRef]
- Pignalosa, A.; Silvestri, N.; Pugliese, F.; Corniello, A.; Gerundo, C.; Del Seppia, N.; Lucchesi, M.; Coscini, N.; De Paola, F.; Giugni, M. Long-Term Simulations of Nature-Based Solution Effects on Runoff and Soil Losses in a Flat Agricultural Area within the Catchment of Lake Massaciuccoli (Central Italy). Agric. Water Manag. 2022, 273, 107870. [Google Scholar] [CrossRef]
- Li, J.; Davis, A.P. A Unified Look at Phosphorus Treatment Using Bioretention. Water Res. 2016, 90, 141–155. [Google Scholar] [CrossRef]
- Besir, A.B.; Cuce, E. Green Roofs and Facades: A Comprehensive Review. Renew. Sustain. Energy Rev. 2018, 82, 915–939. [Google Scholar] [CrossRef]
- Li, Q.; Wang, F.; Yu, Y.; Huang, Z.; Li, M.; Guan, Y. Comprehensive Performance Evaluation of LID Practices for the Sponge City Construction: A Case Study in Guangxi, China. J. Environ. Manag. 2019, 231, 10–20. [Google Scholar] [CrossRef]
- Caroppi, G.; Pugliese, F.; Gerundo, C.; De Paola, F.; Stanganelli, M.; Urciuoli, G.; Nadim, F.; Oen, A.; Andrés, P.; Giugni, M. A comprehensive framework tool for performance assessment of NBS for hydro meteorological risk management. J. Environ. Plann. Manag. 2023, 1–27. [Google Scholar] [CrossRef]
- Bixler, T.S.; Houle, J.; Ballestero, T.; Mo, W. A Dynamic Life Cycle Assessment of Green Infrastructures. Sci. Total Environ. 2019, 692, 1146–1154. [Google Scholar] [CrossRef]
- Venkataramanan, V.; Lopez, D.; McCuskey, D.J.; Kiefus, D.; McDonald, R.I.; Miller, W.M.; Packman, A.I.; Young, S.L. Knowledge, Attitudes, Intentions, and Behavior Related to Green Infrastructure for Flood Management: A Systematic Literature Review. Sci. Total Environ. 2020, 720, 137606. [Google Scholar] [CrossRef]
- MOHURD. Technical Guide of Sponge City Construction; Ministry of Housing and Urban-Rural Development of the People’s Republic of China: Beijing, China, 2014. (In Chinese)
- Jia, H.F.; Yao, H.R.; Tang, Y.; Yu, S. LID-BMPs Planning for Urban Runoff Control and Case Study. Adv. Water Sci. 2014, 25, 260–267. (In Chinese) [Google Scholar] [CrossRef]
- Danielle, G. The Value of Green Infrastructure: A Guide to Recognizing Its Economic, Environmental and Social Benefits. Proc. Water Environ. Fed. 2011, 2011, 924–928. [Google Scholar]
- He, B.J.; Zhu, J.; Zhao, D.X.; Gou, Z.H.; Qi, J.D.; Wang, J. Co-Benefits Approach: Opportunities for Implementing Sponge City and Urban Heat Island Mitigation. Land Use Policy 2019, 86, 147–157. [Google Scholar] [CrossRef]
- Yu, Q.; Li, N. Discussions and Suggestions on Supporting Mechanisms and Safeguard Measures of Sponge City Construction in China. Water Resour. Hydropower Eng. 2020, 51, 30–36. (In Chinese) [Google Scholar]
- Qin, H.; Li, Z.; Fu, G. The Effects of Low Impact Development on Urban Flooding Under Different Rainfall Characteristics. J. Environ. Manag. 2013, 129, 577–585. [Google Scholar] [CrossRef]
- LeFevre, G.H.; Paus, K.H.; Natarajan, P.; Gulliver, J.S.; Novak, P.J.; Hozalski, R.M. Review of Dissolved Pollutants in Urban Storm Water and Their Removal and Fate in Bioretention Cells. J. Environ. Manag. 2015, 141, 04014050. [Google Scholar] [CrossRef]
- Song, J.Y.; Wang, J.L.; Zhao, M.Y.; Gong, Y.W.; Li, J.Q. Evaluation of Sponge City for the Spring Protection via Improving Groundwater Recharge Capacity: A Case Study of Sponge City Development in Jinan. Water Resour. Hydropower Eng. 2019, 50, 20–26. (In Chinese) [Google Scholar]
- Benedict, M.; McMahon, E.; Fund, T.C.; Bergen, L. Green Infrastructure: Linking Landscapes and Communities. Nat. Areas J. 2017, 22, 282–283. [Google Scholar]
- Keeley, M.; Koburger, A.; Dolowitz, D.P.; Medearis, D.; Nickel, D.; Shuster, W. Perspectives on the Use of Green Infrastructure for Stormwater Management in Cleveland and Milwaukee. Environ. Manag. 2013, 51, 1093–1108. [Google Scholar] [CrossRef]
- Li, K. The Study of Jinan City Urban Drainage Management System; Shandong University: Jinan, China, 2016. (In Chinese) [Google Scholar]
- EPA. Storm Water Management Model User’s Manual Version 5.2; EPA: Washington, DC, USA, 2022.
- Yu, Q.; Wang, Y.; Li, N. Extreme Flood Disasters: Comprehensive Impact and Assessment. Water 2022, 14, 1211. [Google Scholar] [CrossRef]
- Jinan Bureau of Statistics. Jinan’s Statistical Yearbook 2014; Jinan Bureau of Statistics: Jinan, China, 2015. (In Chinese)
- Kang, H.Z.; Chen, L.; Guo, Q.Z.; Lian, J.J.; Hou, J. An Overview of Quantification of Groundwater Recharge in Sponge City Construction. Earth Sci. Front. 2019, 26, 58–65. (In Chinese) [Google Scholar]
- Schueler, T.R. Controlling Urban Runoff: A Practical Manual for Planning and Designing Urban BMP’s; Metropolitan Information Center, Metropolitan Washington Council of Governments: Washington, DC, USA, 1987. [Google Scholar]
- Carpenter, D.D.; Kaluvakolanu, P. Effect of Roof Surface Type on Storm-Water Runoff from Full-Scale Roofs in a Temperate Climate. J. Irrig. Drain Eng. 2010, 137, 161–169. [Google Scholar] [CrossRef]
- Yin, D.K.; Chen, Z.X.; Li, Q.A.; Jia, H.F.; Liu, Z.Q.; Shen, L.; Ahmad, S. Influence of Rainfall Characteristics on Runoff Control of a Sponge Reconstructed Community in a Rainy City. J. Tsinghua Univ. Sci. Technol. 2021, 61, 50–56. (In Chinese) [Google Scholar]
Figure 1.
Comprehensive performance assessment indicators (a solid circle indicates that the GI possesses the benefit; an empty circle indicates that the GI lacks the corresponding benefit; and another icon signifies that this GI may have a corresponding benefit).
Figure 1.
Comprehensive performance assessment indicators (a solid circle indicates that the GI possesses the benefit; an empty circle indicates that the GI lacks the corresponding benefit; and another icon signifies that this GI may have a corresponding benefit).

Figure 2.
Location of the study area and the distribution of different types of GIs. The reference coordinate system is WGS84.
Figure 2.
Location of the study area and the distribution of different types of GIs. The reference coordinate system is WGS84.

Figure 3.
The selected indicator and corresponding assessment methods.

Figure 4.
System architecture diagram of FRAS.
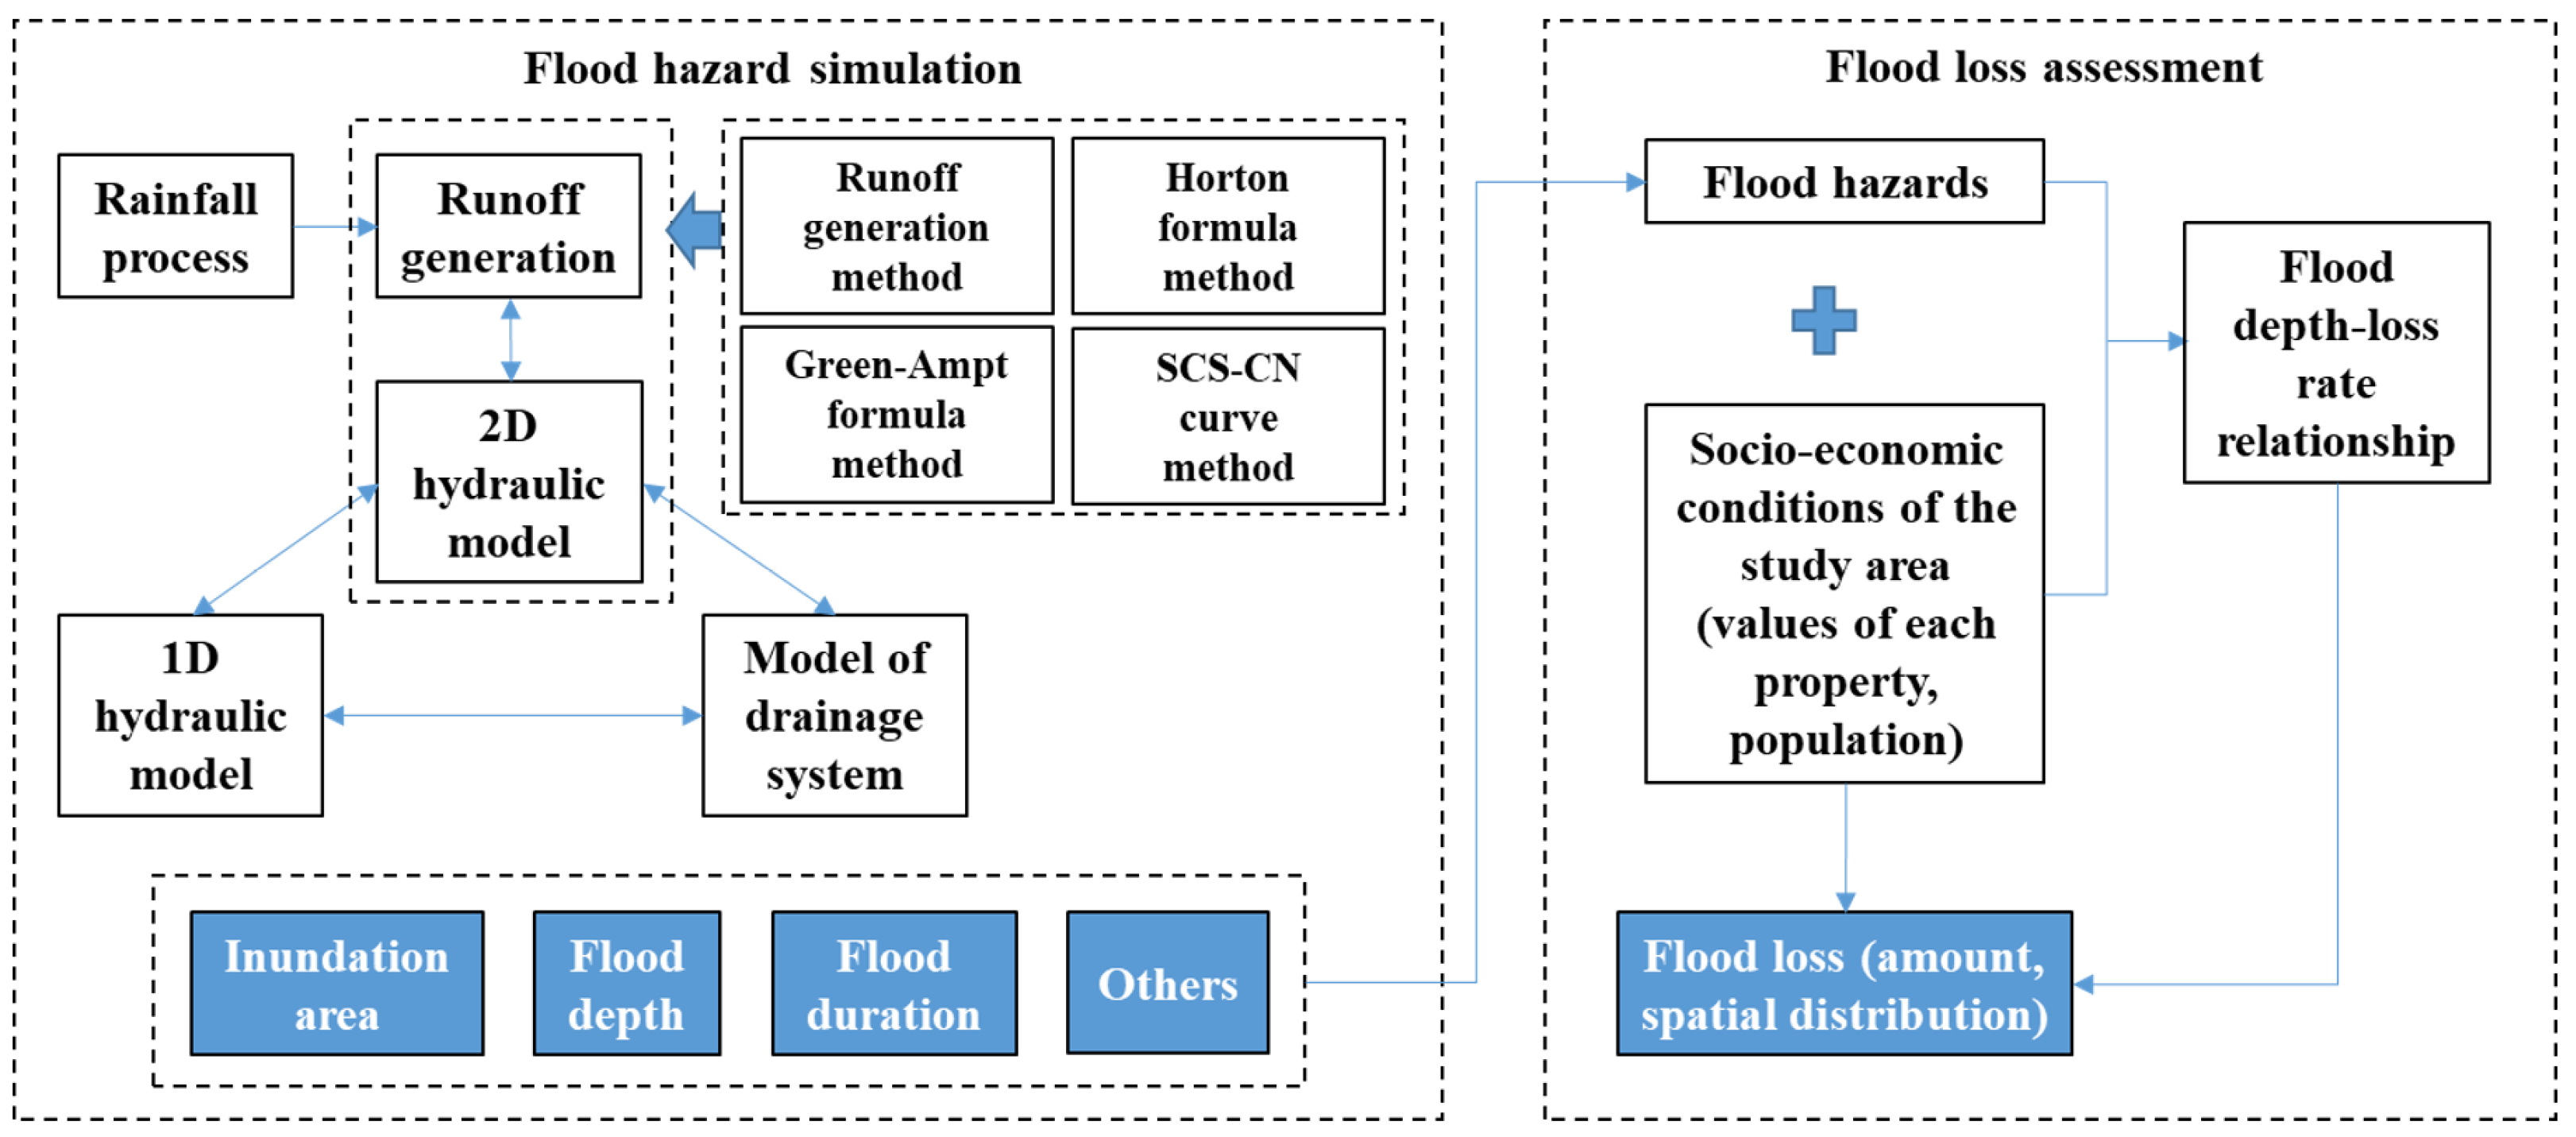
Figure 5.
The 24-h design rainfall process under three different rainfall frequency scenarios.

Table 1.
Comprehensive performance evaluation index system.
| First-Level Indicator | Second-Level Indicator | Definition | Unit | Assessment Method |
|---|---|---|---|---|
| Indicators of disaster reduction benefits | Inundation area reduction rate | The proportion of reduction of the inundation area after the implementation of GI measures | % | Numerical simulation |
| The proportion of reduction of the affected population | The proportion of reduction of the affected population after the implementation of GI measures | % | Model calculation | |
| The proportion of reduction of affected GDP | The proportion of reduction of impacted GDP losses after the implementation of GI measures | % | Model calculation | |
| Disaster-related direct economic loss reduction rate | The proportion of reduction of disaster-related direct economic losses after the implementation of GI measures | % | Model calculation | |
| Indicators of economic benefits | Increased rainwater resources available | Increasing the rainwater resources available by harvesting rainwater at the source after the implementation of GI measures | m3 | Numerical simulation/empirical formulas |
| Reduction of the amount of water that needs to be treated | Reducing the amount of water that needs to be treated at sewage treatment plants by purifying water at the source after the implementation of GI measures | m3 | Numerical simulation/empirical formulas | |
| Indicators of environmental benefits | Reducing non-point source pollution load | Reducing non-point pollution load, such as SS, by decreasing rainfall runoff and improving runoff water quality after the implementation of GI measures | % | Numerical simulation/statistics/empirical formulas/qualitative description |
| Increasing groundwater recharge | The increase in groundwater recharge through infiltration at the source after the implementation of GI measures | m3 | Based on monitoring data/numerical simulation/empirical formulas/qualitative description | |
| Alleviating the urban heat island effect | The alleviation of the urban heat island effect after the implementation of GI measures | °C | Based on monitoring data/qualitative description/expert scoring | |
| Indicators of social benefits | Enhancing environmental aesthetics | The improvement in the living and working environment nearby and the quality of life after the implementation of GI measures containing plants | — | Qualitative description /expert scoring |
| Increasing recreational spaces | The increase in the area of recreational spaces for nearby residents after the implementation of GI measures | — | Qualitative description /expert scoring | |
| Strengthening public education | The enhancement of public education about water culture and urban development after the implementation of GI measures | — | Qualitative description /expert scoring |
Table 2.
The main features of the adopted GIs [35].
Table 2.
The main features of the adopted GIs [35].
| GI | Applicable Area | Layer |
|---|---|---|
| Green roofs | Eligible flat-roofed buildings and sloped-roofed buildings with a slope of ≤15° | Surface layer Soil layer Drainage Mat |
| Bioretention systems | Green space surrounding buildings, roads, and parking lots, green belts of urban roads, and other urban green spaces | Surface layer Soil layer Storage layer Underdrain |
| Permeable pavements | Plazas Parking lots Sidewalks Roads with low traffic volumes and loads | Surface layer Pavement layer Storage layer Underdrain (optional) |
Table 3.
Values of major value parameters.
| Indicator | Unit | Value |
|---|---|---|
| The cost price of residential buildings | CNY/m2 | 2000–3000 |
| Per capita household property value | 10,000 CNY/person | 2.0–3.0 |
| National highway repair cost | 10,000 CNY/km | 800 |
| Provincial highway construction cost | 10,000 CNY/km | 500 |
| County highway construction cost | 10,000 CNY/km | 200 |
| Township highway construction cost | 10,000 CNY/km | 100 |
Table 4.
Average annual concentrations (EMCs) of SS in a rainfall event in a similar area (mg/L).
| Category | Streets | Urban Greenbelts | Roofs | Other Land Uses |
|---|---|---|---|---|
| EMCs | 297.37 | 320.68 | 28.64 | 183.68 |
Table 5.
Statistics on the removal efficiency of SS in rainfall runoff of different GI measures in the United States (%).
Table 5.
Statistics on the removal efficiency of SS in rainfall runoff of different GI measures in the United States (%).
| Category | Lawns | Rain Gardens | Filter Belts | Drainage Pipes | Bioswales | Retention Ponds |
|---|---|---|---|---|---|---|
| C | 0 | 75 | 65 | 0 | 65 | 60 |
Table 6.
The disaster reduction benefits of GI measures in the study area.
| Scenario | Inundation Area/km2 | Inundation Area Reduction Rate/% | Disaster-Related Direct Economic Losses/10,000 CNY | Disaster-Related Direct Economic Loss Reduction Rate/% | ||
|---|---|---|---|---|---|---|
| With GIs | Without GIs | With GIs | Without GIs | |||
| 5-year | 1.782 | 2.003 | 11.02 | 3321.29 | 3855.62 | 13.86 |
| 10-year | 2.720 | 3.000 | 9.32 | 5104.40 | 5332.42 | 4.28 |
| 20-year | 3.613 | 3.927 | 8.02 | 6663.57 | 6947.87 | 4.09 |
Table 7.
Comprehensive benefits of GIs in the study area.
| Indicator | 5-Year | 10-Year | 20-Year |
|---|---|---|---|
| Inundation reduction ratio/% | 11.02 | 9.32 | 8.02 |
| Disaster-related direct economic loss reduction rate/% | 13.86 | 4.28 | 4.09 |
| SS load reduction rate/% | 68.552 | 67.942 | 67.314 |
| Increasing groundwater recharge/10,000 m3 | 223.49 | 286.38 | 287.28 |
| Enhancing environmental aesthetics | The sidewalk planters on roads such as Erhuannan Road and Jida Road have been transformed into ecological planters, rain gardens, and sunken greenbelts. In addition, the sidewalks have been upgraded with permeable pavements. The reconstructed green roads have enhanced environmental aesthetics, while providing more environmentally friendly pedestrian areas for nearby residents and improving their quality of life. | ||
| Strengthening public education | Seven residential communities in the study area have been upgraded/equipped with about 0.3 km2 of sunken greenbelts, 0.04 km2 of stormwater regulation and storage facilities, 0.26 km2 of green roofs, and 0.18 km2 of permeable pavements, all of which require heavy investment of manpower and material resources in the operation and maintenance phases. Allowing community residents to participate in the supervision and management of community-based GI facilities and sometimes in the decision-making process can fully mobilize their enthusiasm and sense of responsibility, provide them with an insightful understanding of the operation and functionality of GI facilities, and enhance public awareness of water culture and stormwater management. | ||
Disclaimer/Publisher’s Note: The statements, opinions and data contained in all publications are solely those of the individual author(s) and contributor(s) and not of MDPI and/or the editor(s). MDPI and/or the editor(s) disclaim responsibility for any injury to people or property resulting from any ideas, methods, instructions or products referred to in the content. |
© 2023 by the authors. Licensee MDPI, Basel, Switzerland. This article is an open access article distributed under the terms and conditions of the Creative Commons Attribution (CC BY) license (https://creativecommons.org/licenses/by/4.0/).
Share and Cite
MDPI and ACS Style
Yu, Q.; Li, N.; Wang, J.; Wang, S. Comprehensive Performance Assessment for Sponge City Construction: A Case Study. Water 2023, 15, 4039. https://doi.org/10.3390/w15234039
AMA Style
Yu Q, Li N, Wang J, Wang S. Comprehensive Performance Assessment for Sponge City Construction: A Case Study. Water. 2023; 15(23):4039. https://doi.org/10.3390/w15234039
Chicago/Turabian StyleYu, Qian, Na Li, Jing Wang, and Shan Wang. 2023. "Comprehensive Performance Assessment for Sponge City Construction: A Case Study" Water 15, no. 23: 4039. https://doi.org/10.3390/w15234039
Note that from the first issue of 2016, this journal uses article numbers instead of page numbers. See further details here.