
Sedimentary Characteristics and Internal Architecture of a Sandy Braided River: Insights from a Numerical Model

1
School of Geoscience, Yangtze University, Wuhan 434100, China
2
Sinopec North China Petroleum Bureau, Zhengzhou 450006, China
*
Author to whom correspondence should be addressed.
Water 2023, 15(23), 4119; https://doi.org/10.3390/w15234119
Submission received: 22 October 2023
/
Revised: 14 November 2023
/
Accepted: 21 November 2023
/
Published: 28 November 2023
Abstract
:Sandy braided river deposits are widely observed in ancient stratigraphic records and modern sedimentary basins. Frequent channel migration shapes intricate internal architecture, while research on its influence on fine sedimentary architecture remains limited. This study utilizes DELFT3D to simulate and analyze the sedimentary processes and architecture of the channel bar in a sandy braided river. The results show that: (1) The channel bar consists of downstream accretion (DA), lateral accretion (LA), and aggradational accretion (AA). (2) Channel bars can be divided into three types: unit bars, compound bars, and complex compound bars. Unit bars are lobate-shaped and consist of multiple accretions, including DA in the core, AA layered above, and LA deposited on the sides. Compound bars result from the migration and amalgamation of multiple unit bars, characterized by a greater number of accretions. Compound bars can further be classified as DA-dominated or LA-dominated, depending on the dominant accretion type. Complex compound bars form from the merging of multiple unit bars and compound bars. In this paper, insights from a braided river on its sedimentary processes and evolution may help to improve river management and water resources research. The in-depth understanding of sedimentary architecture on channel bars can be utilized for detailed subsurface oil and gas reservoir characterization.
1. Introduction
Sandy braided rivers are commonly observed in ancient stratigraphic records and modern sedimentary basins, with the capability to form substantial underground reservoirs of oil and gas. Recent research on sandy braided rivers has primarily concentrated on two fundamental aspects: the sedimentary evolution and morphodynamics of channels (or branches) and bars [1,2]. To understand the bifurcation and morphological evolution of channels, researchers have employed diverse methodologies, including modern sedimentation studies and numerical modeling [3,4,5,6]. Meanwhile, the study of bars is primarily based on the braided river facies model developed using the South Saskatchewan River as a reference [7]. This model identifies at least two main types of channel bars: unit bars and compound bars, which are distinguished based on their geometric morphology. Smith [8] characterizes unit bars as stable bars that maintain their form during migration without merging or overlapping with other bars. As the evolution of braided rivers progresses, the amalgamation of multiple unit bars results in the formation of compound bars [1,9,10].
The formation and evolution of bars in braided rivers are influenced by three primary sedimentary processes: lateral accretion, downstream accretion, and aggradational accretion. These sedimentary types give rise to three distinct dynamics of bar formation: downstream migration, lateral migration, and bar elongation [11,12,13,14,15,16,17]. According to Mail’s research, the initial sediment deposited by the bar undergoes downstream migration, leading to the formation of downstream accretion (DA). This downstream accretion is a key component commonly observed in braided rivers. Similar features have also been documented in the sedimentary records of modern braided rivers, illustrated by the formation of the South Saskatchewan River [10,18,19]. As unit bars begin to compound, lateral migration occurs, which corresponds to lateral accretions [17]. This phenomenon can be observed in various braided rivers, including the Ganges River in India and the South Saskatchewan River.
The morphology of channel bars is significantly influenced by multiple factors, including vegetation, slopes, water flow, and sediment transport. These factors play a crucial role in determining the degree of bar migration over time. The complex bar migration leads to the development of intricate internal architecture and sedimentary processes within sandy braided channel bars. It is worth noting that the internal architecture of river bars exhibits a diverse range of accretion types and intricate spatial patterns. These characteristics directly result from the cyclic processes of sedimentation and erosion occurring within the bars. Understanding this internal architecture is of utmost importance in the study of subsurface reservoirs, as it profoundly influences the dynamics of oil and water flow, ultimately affecting the accumulation of residual oil [20,21]. Therefore, accurate identification and classification of the various accretion types within channel bars, along with an assessment of their spatial patterns, are essential for characterizing and mapping the architecture of subsurface reservoirs.
A typical sandy braided river can be found in the Ordos Basin’s Lower Shihezi Formation. Previous studies have examined its sedimentary architecture based on outcrop data. However, limitations in outcrop conditions and a lack of systematic data collection make it difficult to acquire a comprehensive understanding of the three-dimensional architecture. Additionally, modern braided river environments exhibit transient deposition, allowing for the observation of planar patterns only. Conducting long-term investigations to study the evolutionary processes of these rivers is prohibitively expensive in terms of time and resources. Consequently, the simultaneous acquisition of three-dimensional architecture information remains challenging. This paper addresses these limitations through the implementation of a numerical simulation of a sandy braided river. The simulation employed boundary conditions inferred from subsurface reservoir data. By using sequential morphology data and sediment grain size data extracted from the simulation data, a comprehensive investigation of the channel bar architecture was conducted.
2. Data and Methods
2.1. Principles of Sedimentary Numerical Simulation
Delft3D4.01 is a 3D simulation software developed by the Delft University of Technology that follows the principles of conservation of matter and conservation of fluid momentum to simulate sediment transport, deposition, and other geomorphological evolution in a grid in real time. The software has been widely used in studies of river, estuarine, and coastal systems and has been validated in a large number of cases, including flume experiments [22]. In recent years, it has been applied to study the sedimentary evolution of braided rivers.
The key calculations in sedimentation simulation include flow field calculation, sediment transport, and sedimentation calculation, which are calculated as follows:
(1) Flow field calculations (N-S equations, Equations (1)–(3)).
where x is the downstream coordinate, m; y is the transverse flow direction coordinate, m; z is the vertical coordinate, m; Zw is the water level, m; u is the x-direction flow velocity, m/s; v is the y-direction flow velocity, m/s; w is the z-direction flow velocity, m/s; h is the water depth, m; C is the Chezy roughness, m1/2/s; g is the gravitational acceleration, m/s2; Vh is the horizontal eddy viscosity coefficient, m2/s; Vv is the vertical eddy viscosity coefficient, m2/s. s; and Vv is the vertical eddy viscosity coefficient, m2/s.
(2) Suspended sediment transport and deposition calculation:
where c(l) is the concentration of sediment component (l), kg/m3; u, v, and w are, respectively, x, y, and z directional flow velocities, m/s; Ꜫs,x (l), Ꜫs,y(l), and Ꜫs,z(l) is the eddy diffusivity of the sediment component (l); ws(l) is the hindered sediment component (l); and is the sedimentation velocity of the hindered sediment component (l), m/s.
(3) Calculation of non-cohesive material deposition and erosion:
where c(l) is the concentration of sediment component (l), kg/m3; ca(l) is the reference density of sediment component (l), kg/m3; a is the Van Rijn reference height, m; h is the water depth; z is the height from the bottom bedforms, m; and A(l) is the Rouse number.
2.2. Parameter Setting and Boundary Conditions
The development of a braided river relies on two key conditions: a movable riverbed and a sufficiently wide braided plain [23]. To meet these criteria, the simulation area selected is a rectangular region with dimensions of 3.2 km in width and 80 km in length (Figure 1). This size allows for the necessary space to observe the dynamic evolution of a sandy braided river. In the simulation, the initial slope of the sedimentary bottom bed was set at 9.3 × 10⁻⁵ (refer to Table 1). The majority of the model settings were adopted from [24] as a reference. Considering the length and width of single accretions measured from outcrops, the computational domain is discretized into grid cells of 50 m × 20 m, which ensures that each accretion occupies at least 4–5 grid cells. Additionally, the consideration of anisotropy in sediment transport for sandbar formation prompted the designation of the left and right boundaries as inlet and outlet, respectively. The total flow rate was maintained at a constant level throughout the simulation [17].
To accurately represent the sediment characteristics of the actual reservoir in the subsurface, we sourced data from two different datasets that provided information on sediment grain size and sorting. The first dataset focused on the analysis of outcrop samples from Fugu Tianshengqiao. By examining 18 outcrop samples, we collected particle size information, resulting in a calculated median grain size of 300 μm and identifying medium sandstone as the predominant lithology. The second dataset we utilized was derived from core sampling and analysis of 293 blocks from a sandy braided river within the Lower Shihezi Formation on the northern edge of the Ordos Basin. The results from this dataset yielded a mean value for the median grain size of around 350 μm, with a peak at 320 μm, which closely corresponds to the findings from the outcrop samples. Consequently, using the sediment grain size data, we established four categories: fine sand, medium sand, coarse sand, and very coarse sand. These sandy sediments were represented in proportions of 25%, 50%, 15%, and 10%, respectively, to maintain a median grain size of approximately 300 μm for the supplied sediments.
Changing parameters such as discharge, sediment grain size, and sorting can have an impact on the morphology of a braided river. However, it is important to note that, despite these variations, the evolution of a braided river displays certain consistent characteristics. The chosen parameters for this study have been set based on previous relevant research [2,6,17,24,25]. By aligning with these established parameters (Table 1), we can gain valuable insights into the typical spatial patterns observed in the evolution of braided rivers.
Based on the available data, a series of numerical simulations were conducted by adjusting the discharge. By comparing the size and thickness of the channel bar in the study area, it was determined that the simulated channel bar exhibited the closest resemblance to the subsurface condition when the total flow rate was set at 40,000 m3/s. Using a morphological scaling factor (MORFAC) of 48 [26], the simulation results describe sediment transport and morphological changes in the braided river over 22,065 days, which corresponds to 60 years of sedimentation. Based on modern sediment observations, bars in sandy braided rivers may evolve dramatically within a year; therefore, the simulation time in this paper meets the requirements for reproducing the complete evolution of the bars.
2.3. Methods of Analysis
To reproduce the internal architecture of the simulated braided river, a MATLAB program was written. The reproduction follows four steps: (a) calculate the topography based on sediment thickness and initial topography, (b) define a section within the simulation domain and extract the coordinate and topography along the defined section, (c) calculate the topography of the finally preserved sedimentary bodies formed during each simulation step by accounting for the dynamic erosion and deposition processes, and (d) plot the sedimentary architecture profile. In addition, the sediment grain size data were extracted along the section and plotted below the sedimentary architecture plot. Based on the plotted profile, the type, scale, location, and dip of the architecture elements, including accretions, channel bars, and braided channels, were recognized and measured.
3. Results
3.1. The Growth and Evolution Process of Channel Bar
The simulation demonstrates a gradual evolution of braided rivers, starting from low-amplitude regular braided topography to the development of irregular topography within the initial riverbed. This evolution is characterized by the continuous accumulation of small-scale bars, which eventually combine to form large-scale bars. Simultaneously, the river channels transform from wide and shallow to deep, narrow, and more complex in morphology. Furthermore, based on sedimentary features, the evolution of the braided river can be divided into four distinct stages.
During the initial stage of deposition, migration of the bedform leads to the formation of diamond-shaped sand bars on a flat sandy bed. As these sand bars continue to migrate, they gradually assume a tongue shape, although these are transient features and do not exhibit long-term stability. This period corresponds to the simulation time step of 0–300 (Figure 2a). Subsequently, a large number of tongue-shaped bars transform into unit bars with a lobed planform. Furthermore, lateral connectivity of multiple bars occurs, resulting in the formation of a relatively continuous and fixed river network along both sides of the bar (approximately 20 km in Figure 2b). This corresponds to a simulation time step ranging from 300 to 600.
With the increasing evolution of the sediment process, the unit bars continue to grow and amalgamate, forming compound bars that exhibit predominantly asymmetrical strip-like shapes. At the same time, the scale of these bars increases. As the bar area expands, the braided channels gradually become more connected, resulting in a complex braided river network. This stage corresponds to the simulation time step of 600–900. Subsequently, multiple unit bars and compound bars amalgamate to form a larger bar (at 60 km in Figure 2g,h), and the river channel exhibits increased stability [27]. Notably, the phenomenon of bar dissection reemerges (at 53 km in Figure 2j,k). The time step in this simulation is 900–1330 for that period (Figure 2g–k).
3.2. Accretions Formed during Deposition
There are significant differences in the accretion type, temporal formation ratio, spatial pattern, and particle size of accretions in different sedimentary evolutionary processes.
3.2.1. Downstream Accretion (DA)
Downstream accretion (DA) is the main type of accretion, often occurring in the early stages of sedimentary evolution (Table 2). It is characterized by gradual forward accretion from upstream to downstream, following the direction of water flow, and exhibits a tongue-shaped external morphology. One of the main reasons for the occurrence of DA in the early stage of braided river deposition is the presence of more open and gentle bedforms. In this stage, the sediments are gradually transported downstream by the continuous water flow, leading to a gentle and uniform deposition from upstream to downstream. These quantitative measurements provide valuable insights into the dimensions and characteristics of DA in braided river channels.
3.2.2. Lateral Accretion (LA)
During the middle and late stages of braided river formation, the channel’s asymmetry on both sides of the channel bar resulted in a significant occurrence of lateral accretion (LA). One side of the channel experienced a reduced scouring capacity, especially the secondary channel, leading to erosion on one side and accretion on the other. This process contributed to more frequent events of lateral migration, bifurcation, and channel merging. LA primarily accumulated along the sides of the channel bars (Figure 3e), although some LA deposits were also observed within the bar chute.
3.2.3. Aggradational Accretion (AA)
In the later stages of deposition, when the river or floodwaters overflowed the bar and the flow velocity decreased away from the channel, sandy sediments underwent vertical upward accumulation (Figure 3d), which appeared as a thin, narrow body of sand at the top of the braided river channel. The dimensions of this accretion (AA) were measured using sedimentary simulation data.
The comparison of various profiles demonstrates that as the braided river undergoes evolution, the number of accretions gradually increases, leading to more complex geometries, sizes, stacking patterns, and flow directions. In these profiles, DA is typically found in the center of the bar, while LA occurs on the bar sides. The vertical distribution shows that the DA is located at the bottom of the bar, while the AA is preserved at the top. Upon analyzing the development scale, it is observed that the planar extension of both the AA and DA tends to be larger compared to the LA. However, in terms of vertical thickness, the LA and DA tend to be thicker than the AA. In terms of the depositional period, DA tends to dominate in the early stage, while LA becomes more prevalent during the middle and late stages. It is important to note that some AA may also be present during these stages.
As shown by the D50 grain size profile of the bar channel in Figure 3, it was found that the sediment grain size of different types of accretions within the bar also differed significantly: DA is typically fining downwards throughout a vertical sequence generally (Figure 3c); LA is typically fining upwards (Figure 3d); and AA is influenced by hydrodynamic forces, which may be fining downwards or upwards (Figure 3e). Therefore, from a sedimentological point of view, it is imperative to investigate the distinctive developmental characteristics of the accretions within the braided channel bar and identify the role of anisotropy in controlling the sedimentary architecture of the entire braided river.
3.3. Channel Bar Classification and Architecture
Through an analysis of modern sedimentary data, Rice [28] identified two main types of sand bars: unit bars and compound bars. Unit bars are characterized as the simplest type of sand bar, exhibiting a lobed planform. At the tail of unit bars, eroded sediment accumulates, resulting in a relatively steep slip surface, commonly referred to as a slip face. This slip-face tends to be submerged under average flow conditions, enabling the maintenance of a stable morphology during migration. Furthermore, compound bars emerge as a result of the combination of multiple unit bars. This amalgamation brings about changes in morphology, leading to an increase in the bar’s overall area.
However, for the geological subsurface development of oil and gas, factors such as the structure, scale, and anisotropy within the channel bar become more important. The subsurface reservoir consists of naturally terminated sandy deposits from a braided river system, with the majority of these deposits already reaching a mature state. This study is specifically dedicated to simulating the mature stage of sandy braided river evolution to investigate the characteristics and internal architecture of bar deposition. Within our current classification, our emphasis lies on examining the planar shape and scale of the bar, as well as the type and number of accretions and the spatial pattern within the channel bar (Table 3). Bars are categorized into three primary types: unit bars, compound bars, and complex compound bars. By employing these classifications, we can gain insight into the internal dynamics and spatial pattern of bars during the advanced phase of sandy braided river development.
3.3.1. Unit Bar
The unit bar is in the form of a lobed planform with visible shallow bar-tail limbs (Figure 4c). The analysis of the profile conclusively demonstrates that the accretions were formed through multiple episodes of water flow. Each accretion exhibited a relatively small size, with lengths ranging from 76 to 464 m and an average length of 207 m. The widths of accretions range from 10 to 264 m, with an average of 63 m, resulting in a length-to-width ratio of 3.28. On average, the vertical thickness measured 4.5 m. Among the accretions, a significant component was DA, constituting approximately 47% of all observed accretions. The DA was preserved at the base of the unit bar, gradually ascending from the bar sides towards the core (Figure 4d). Moreover, the dip angle becomes steeper as DA moves from the sides toward the core of the unit bar, ranging from 0.7 to 4.6 degrees.
LA is primarily observed on the lateral sides of the bar. It is distributed with a downcutting effect, with a length ranging from 110 to 264 m and an average length of 181 m. The vertical thickness shows variation from 1.8 to 17.8 m, with an average thickness of 7.3 m. The sediment within LA dips from the upstream to the downstream direction of deposition, indicating the flow of deposition from the shallower side of the water (C in Figure 4b) towards the deeper side (C’ in Figure 4b). The dip angle ranges from 1 to 9.8 degrees, with an average dip angle of 4 degrees. The chute exhibits a morphology that is consistent with a typical centripetal filling pattern, displaying a dip direction from upstream to downstream deposition. Within the chute, the dip angle gradually decreases from 7.7 degrees to 0.3 degrees.
The AAs are found above the core of the unit bar and are deposited in a downstream direction, following the longitudinal source. In the direction perpendicular to the flow, it is deposited from the shallower water (C in Figure 4b) to the deeper water (C’ in Figure 4b). In the unit bar as a whole, the DAs are primarily located within the core, while the AAs cover the core area. LAs, on the other hand, tend to accumulate along the sides of the bar.
In Figure 4a,b, a rainbow color scale ranging from blue to red was utilized to represent the accretions formed at various simulation steps. It is observed that the early-stage accretions are concentrated in the middle and bottom core regions of the unit bar. On the other hand, the top section of the unit bar predominantly consists of accretions formed during the middle stage. Additionally, late-stage accretions are commonly found at the edge of the bar.
3.3.2. Compound Bars
Compound bars are characterized as larger and more complex bars by merging multiple unit bars (Figure 5). This merging process is often accompanied by the bifurcation and confluence of channel rivers, resulting in a more intricate internal architecture. Compound bars consist of various styles of unit bars spliced together, with two main types being the LA-dominated compound bar and the DA-dominated compound bar.
- (1)
- LA-dominated compound bar
The LA-dominated compound bar exhibits an elongated shape without tail limbs. The measured compound bar is formed by the lateral “collision” of three bars, resulting in a structure that is 7500 m long and 1200 m wide, with a length-to-width ratio of 6.3:1. The profile analysis reveals significant variation in scale for each phase due to different water flow events (Figure 6a–f). For the accretions formed by these events, the length ranges from 30 to 758 m, with an average length of 181m, while the width ranges from 5 to 344 m, with an average width of 77 m. The average aspect ratio is 2.35, and the vertical average thickness is 2.87 m.
Within these accretions, the LA accounts for 50% and is predominantly found on bar sides and in the secondary channel at the amalgamation of the unit bar. In Figure 6c, the undercutting in the channel bar is highlighted in yellow as filled LA. The LA within the compound bar has a length distribution mainly between 77 and 211 m, with an average length of 157 m. The width distribution ranges from 16 to 80 m, with an average width of 51 m. The vertical thickness varies from 0.2 to 8 m, with an average thickness of 3.3 m. The deposition direction of the LA is complex, flowing predominantly from the central axis of the bar (point B in Figure 6f) towards the sides. The dip angle of the LA ranges from 0.2° to 9.7°, with an average inclination angle of 3.5°.
DA is preserved at the bottom of the compound bar and deposits in various directions at different locations, whereas the DA of unit bar sediments is not affected by location and deposits along the side to the core. In the head transverse section of the compound bar, the DA is affected by the flow in the LR (left-to-right) direction (Figure 6a). In the middle section, the DA deposition occurs from the bar sides towards the core (point B3 in Figure 6f). In the tail section, the DA deposition is influenced by the flow in the RL (right-to-left) direction (Figure 6b,d). Notably, the direction of the longitudinal source is from upstream to downstream. The AA is located at the top of the compound bar and is deposited in a similar direction to the DA, from upstream to downstream. Therefore, LA-dominated compound bars are characterized by an upward succession from DA to LA, ending with AA vertically, and a repetitive DA to LA succession horizontally.
At the top of the compound bar, specifically in the direction of L3 in Figure 6c, several chutes have developed. These chutes exhibit a noticeable depositional direction and gradually migrate along the direction of the water flow. According to the order of deposition time (green-yellow-orange-orange-red), the inclination angles are 3°, 3.2°, 5.3°, 4.5°, and 3.4°, respectively. Notably, the dip angle of the chutes demonstrates a characteristic of first increasing and then decreasing.
In Figure 6, the accretions formed at each stage of development are delineated using color-coded simulation steps. The bottom of the compound bar tends to have the accretions formed in the early stage, whereas the top predominantly contains the accretions formed during the middle stage. Accretions formed in the later stages are typically preserved in the secondary channel of the compound bar or at the uppermost section of the tail.
- (2)
- DA-dominated compound bar
The DA-dominated compound bar is an irregularly lobed shape with multiple tail limbs [2]. Formed by the aggregation of over three bars downstream, the compound bar measures approximately 5000 m in length and 1300 m in width, yielding an aspect ratio of 3.8 (Figure 7).
The profile indicates that there are many accretion bodies formed by different water flow events. These accretions exhibit considerable variation in scale, with lengths ranging from 30 to 758 m and an average length of 181 m. Similarly, the widths of accretions range from 5 to 344 m, with an average width of 77 m. On average, the length-to-width ratio of the accretions is 2.35, and they exhibit an average vertical thickness of 2.87 m.
The primary body in the compound bar is DA, accounting for 52% of the total accretions. DA is preserved at the bottom (Figure 7a). Transverse source profiles taken from the head and middle of the bar indicate that the flow direction of DA is from the shallow side (A direction in Figure 7a) towards the deeper side (A’ direction in Figure 7a). LAs, on the other hand, are found on the bar sides as well as within the chutes that form within the amalgamation of the unit bars. The LA deposit exhibits a length distribution ranging from 76 to 158 m, with an average length of 143 m. The width of the LA deposit is mainly distributed within the range of 25 to 78 m, with an average width of 68 m. In terms of vertical thickness, the accretions range from 2 to 6.7 m, with an average thickness of 4.5 m. The deposition direction is primarily from upstream to downstream and from the core toward the sides of each unit bar. The dip ranges from 0.7 to 12°, with an average inclination angle of 6.3°.
In general, DA-dominated compound bars are identified by a DA to AA upward succession, while LAs are preserved on the bar sides, particularly the bar tail, based on the spatial pattern of accretion. Compared to LA-dominated compound bars, DA-dominated bars have a relatively smaller scale but greater vertical thickness. Furthermore, the deposition direction in DA-dominated compound bars is more complex.
The color-coded scheme in Figure 7 helps distinguish between the accretion bodies formed at different stages of development. At the base of the compound bar, accretions formed in the early stages are observed, while accretions formed in the middle stages are predominantly found at the top. Accretions formed in the later stages can be identified in the chutes of the compound bar (Figure 7d), as well as at the head and tail of the bar. Additionally, small, filled chutes are observed even at the head of the bar.
3.3.3. Complex Compound Bars
A complex compound bar can be formed through the modification of an existing compound bar, under the condition that the braided channel pattern remains stable as the sandy braided river reaches maturity. This modification involves three main aspects: First, there is further development of a compound bar. Second, localized transformations occur within the compound bar. Third, overflow water emerges above the entire top of the compound bar. These modifications contribute to the development of a more intricate river network system, which subsequently leads to a more complex transformation of the entire top of the bar. In this transformed area, large, contiguous zones with irregular morphology and flow obstructions are observed, while the edges maintain streamlined characteristics.
According to the survey, the complex compound bar is approximately 8000 m in length and 1600 m in width. Its aspect ratio is 5:1, and it has over six stages of accretion. The major component of the bar, accounting for 43% of the total, is DA, which is preserved at the bottom. The source of sedimentation is deposited longitudinally from upstream to downstream, indicating a consistent direction of sediment flow. However, in transverse sources, there are significant variations in sedimentation direction due to the differences in bar positions. In the middle of the compound bar, the water flow is obstructed, resulting in wide and shallow chutes. This obstruction also leads to the absence of sediment supply in this region, leading to the occurrence of sediment deposition from multiple directions. Furthermore, the direction of DA sedimentation at the bar tail is from both sides to the core as a result of the formation of chutes.
The distribution of LA within the complex compound bar is more varied and can be observed in different ways. Vertically, LA can be seen at the bottom of the bar, with a downward cutting effect. Additionally, LA can also be found in the chutes at the top of the bar (Figure 8b). On the horizontal plane, LA may appear on bar sides or fill the chutes located in the middle section of the bar adjacent to DA. Besides, AA is primarily distributed at the top of the entire complex compound bar.
Therefore, complex compound bars are formed by the merging of multiple compound bars and unit bars that are subjected to erosion, cutting, and deposition during this formation, leading to additional accretions. Both the DA to AA style of the unit bar and the DA to LA, ending with the AA style of the compound bars, can be seen in their vertical upward sequence. Horizontally, there is a recurrent succession from DA to LA.
4. Discussion
4.1. Sedimentary Evolution of the Channel Bar
In terms of sedimentary evolution, previous studies have divided braided rivers into different stages. Filip Schuurman [24] divided the bar into three stages based on its formation, compound, and later modification, while Zhang [17] focused on the formation of unit bars before not considering later-stage modification of compound bars, and Li [27] added this section and divided them into five stages.
This study explores the evolutionary process of bars by introducing the temporal formation ratio. The temporal formation ratio of various bars is determined by calculating the area ratio at intervals of 100 steps (Figure 9). Therefore, based on the temporal formation ratio of bars, we can divide the evolution of sandy braided rivers into four stages: (1) the generation of unit bars; (2) a large amount of lateral accretion is formed; (3) the unit bar is amalgamated to form a compound bar; and (4) after the generation of the complex compound bar, there will be modifications.
There seems to be an inconsistent understanding of the second stage in the evolution of braided rivers. Previous research has referred to this stage as channelization. Schuurman [2] contends that channelization represents the increase in water flow on both sides of the bar preceding the lateral migration of the unit bar and the establishment of a stable, continuous river channel. Additionally, he posits that the differential water level within tributaries inside the bar initiates channelization, subsequently leading to bar dissection. According to Li [27], channelization may be the process that occurs after the formation of unit bars and before the stage of the formation of compound bars, which can be regarded as a distinct stage in the evolution of braided rivers. However, based on our observations, channelization not only occurs before the compound bar but may also occur in the middle or late stages of sedimentary evolution, during which the compound bar is transformed into a unit bar (63 km in Figure 2g).
Therefore, it becomes challenging to isolate channelization as a distinct stage. We propose that the sedimentary evolution of braided rivers can be divided into four stages and aim to capture the dynamic and continuous changes that occur throughout the sedimentary evolution of braided rivers.
4.2. Classification of Channel Bar
The study of the sedimentary characteristics of the bar can be divided into multiple classifications. The first classification is based on the combination of outcrop and modern sedimentation. It can be divided into unit bars and compound bars based on changes in bar morphology, sedimentary environment, and hydrodynamic force [2,28,29,30,31,32]. Unit bars are deposited by a low-energy flow, whereas the dominance of compound bars in a braided river occurs with an increase in flow velocity. Compound bars contain two lithofacies associations, representing two fluvial sub-environments. One of which is a 1.5–2.5 m unit bar at the bottom that migrates downstream, while migration sediments develop at the top [19,33]. The other is channel fine sediment with lateral migration developing at the top [34]. The second classification is based on the morphology and sedimentary evolution of the bar, which is divided into three types: unit bars, simple compound bars, and complex compound bars [27].
But for the geological underground development of oil and gas fields, the structure, scale, and heterogeneity of accretions inside the bar in the mature stage of evolution are the focus of research. Therefore, our classification referred to parameters such as morphology and scale, as well as the type, quantity, and spatial pattern relationship of accretions inside the bar (Figure 4). The bar in the mature stage of sandy braided river evolution is divided into unit bars, compound bars, and complex compound bars.
The unit bar shown in Figure 4 differs from the unit bars that form in the early stages of sedimentation [2,27]. While it has a similar geometric form and scale to the unit bars that formed earlier in sedimentation evolution, it is typically located downstream of the braided river and is formed by compound bars that have been transformed by channelization. This suggests that small-scale unit bars may also form as a result of the transformation of compound bars in the later stages of sedimentation evolution. Considering the spatial pattern of accretions, the medium composite bars are divided into two types: DA-dominated compound bars and LA-dominated compound bars, which are often located in the middle and lower sections of braided rivers, consistent with the two river sub-environments described by Weckwerth [34]. Using the temporal formation ratio of DA-dominated and LA-dominated compound bars, a notable discrepancy between the two bars is evident during the evolution stage. LA-dominated compound bars exhibit continuous augmentation in the second and third stages, maintaining relative stability in the later stage (the green line in Figure 9). In contrast, DA-dominated compound bars experience a rapid increase in the second stage, followed by a plateau in the third stage, and a significant decline in the later stages (the purple line in Figure 9). This observation implies the amalgamation of DA-dominated compound bars and unit bars, contributing to the formation of complex compound bars in the later sedimentation stage.
Large, complex compound bars, similar to those mentioned by Li [27], are commonly found in the middle and upper sections of braided rivers that possess stable external channels. In the later stages of sedimentation, these compound bars are traversed by slower water flows, resulting in the filling of channels between multiple compound bars.
4.3. The Location and Scale of the Accretions inside the Bars
Through the internal architecture of various types of bars, three types of accretions were identified: LA, DA, and AA. Hundey [35] suggested that to study bars in braided rivers, it is essential to conduct a thorough analysis of the evolutionary process from a unit bar to a stable braided river model. This article analyzes different sedimentary evolution processes through numerical simulations of braided rivers, accounting for hydrodynamic conditions and types of accretions. It is hypothesized that significant differences exist in the distribution position, formation time, scale, sedimentary direction, and dip angle of different accretions within the bar.
It is concluded that DA is the primary accretion within the bar, predominantly formed during the early stages of sedimentation. And it is typically preserved vertically at the bottom of the bars (Figure 10), while also occurring horizontally at the core of the bars. Smith [8] used outcrop profiles and high-resolution measurements to dissect the internal structural elements of braided rivers. He proposed the development of transverse bars in the middle of the river channel. Building upon this, Miall [36,37,38,39,40,41] suggested that significant downstream accretion mainly occurs at the bottom of the bars, a viewpoint supported by Filip Schuurman [2]. During the initial stage of sedimentation in braided rivers, the central portion of the river is primarily composed of unit bars, aligning harmoniously with our existing understanding.
Filip Schuurman [2], suggested that as unit bars amalgamate into compound bars, AA develops at the top of the bar, with water flowing around the center of the sand bar. The sand body then laterally deposits at the downstream bar tail limbs. Our study has extensively examined the internal structure of various bar axes and found that AA predominantly forms at the top of the axis during the late sedimentary period. Conversely, lateral accretion (LA) is mainly distributed on both sides of the bar, also forming during the same period. The formation time of different accretions varies between the early and late stages, depending on hydrodynamic conditions and the sedimentary evolution process.
A regular pattern has been observed in the sedimentary grain order of the accretions within the bar. DAs have a fining downwards, and LAs have a fining upwards. However, AA may have a fining downward or upward, depending on the influence of hydrodynamic forces during its formation. These variations in grain order contribute to the strong heterogeneity observed within the bar, as the spatial distribution of the accretions differs.
The regular distribution patterns of the accretions also lead to discernible lithofacies patterns in different parts of the bar. Bridge [42] analyzed contemporary sedimentary bar data and concluded that the thickness and vertical facies sequence of different parts of the bar exhibit regular variation. It is worth noting that sandy braided bar deposits primarily consist of a series of reworked bars, internally composed of superimposed dunes, leading to preservation downstream from the bar head to the tail [1,9,19,43,44]. Additionally, Jian Sun [45], believed the coarsening at the heads of bars was detected.
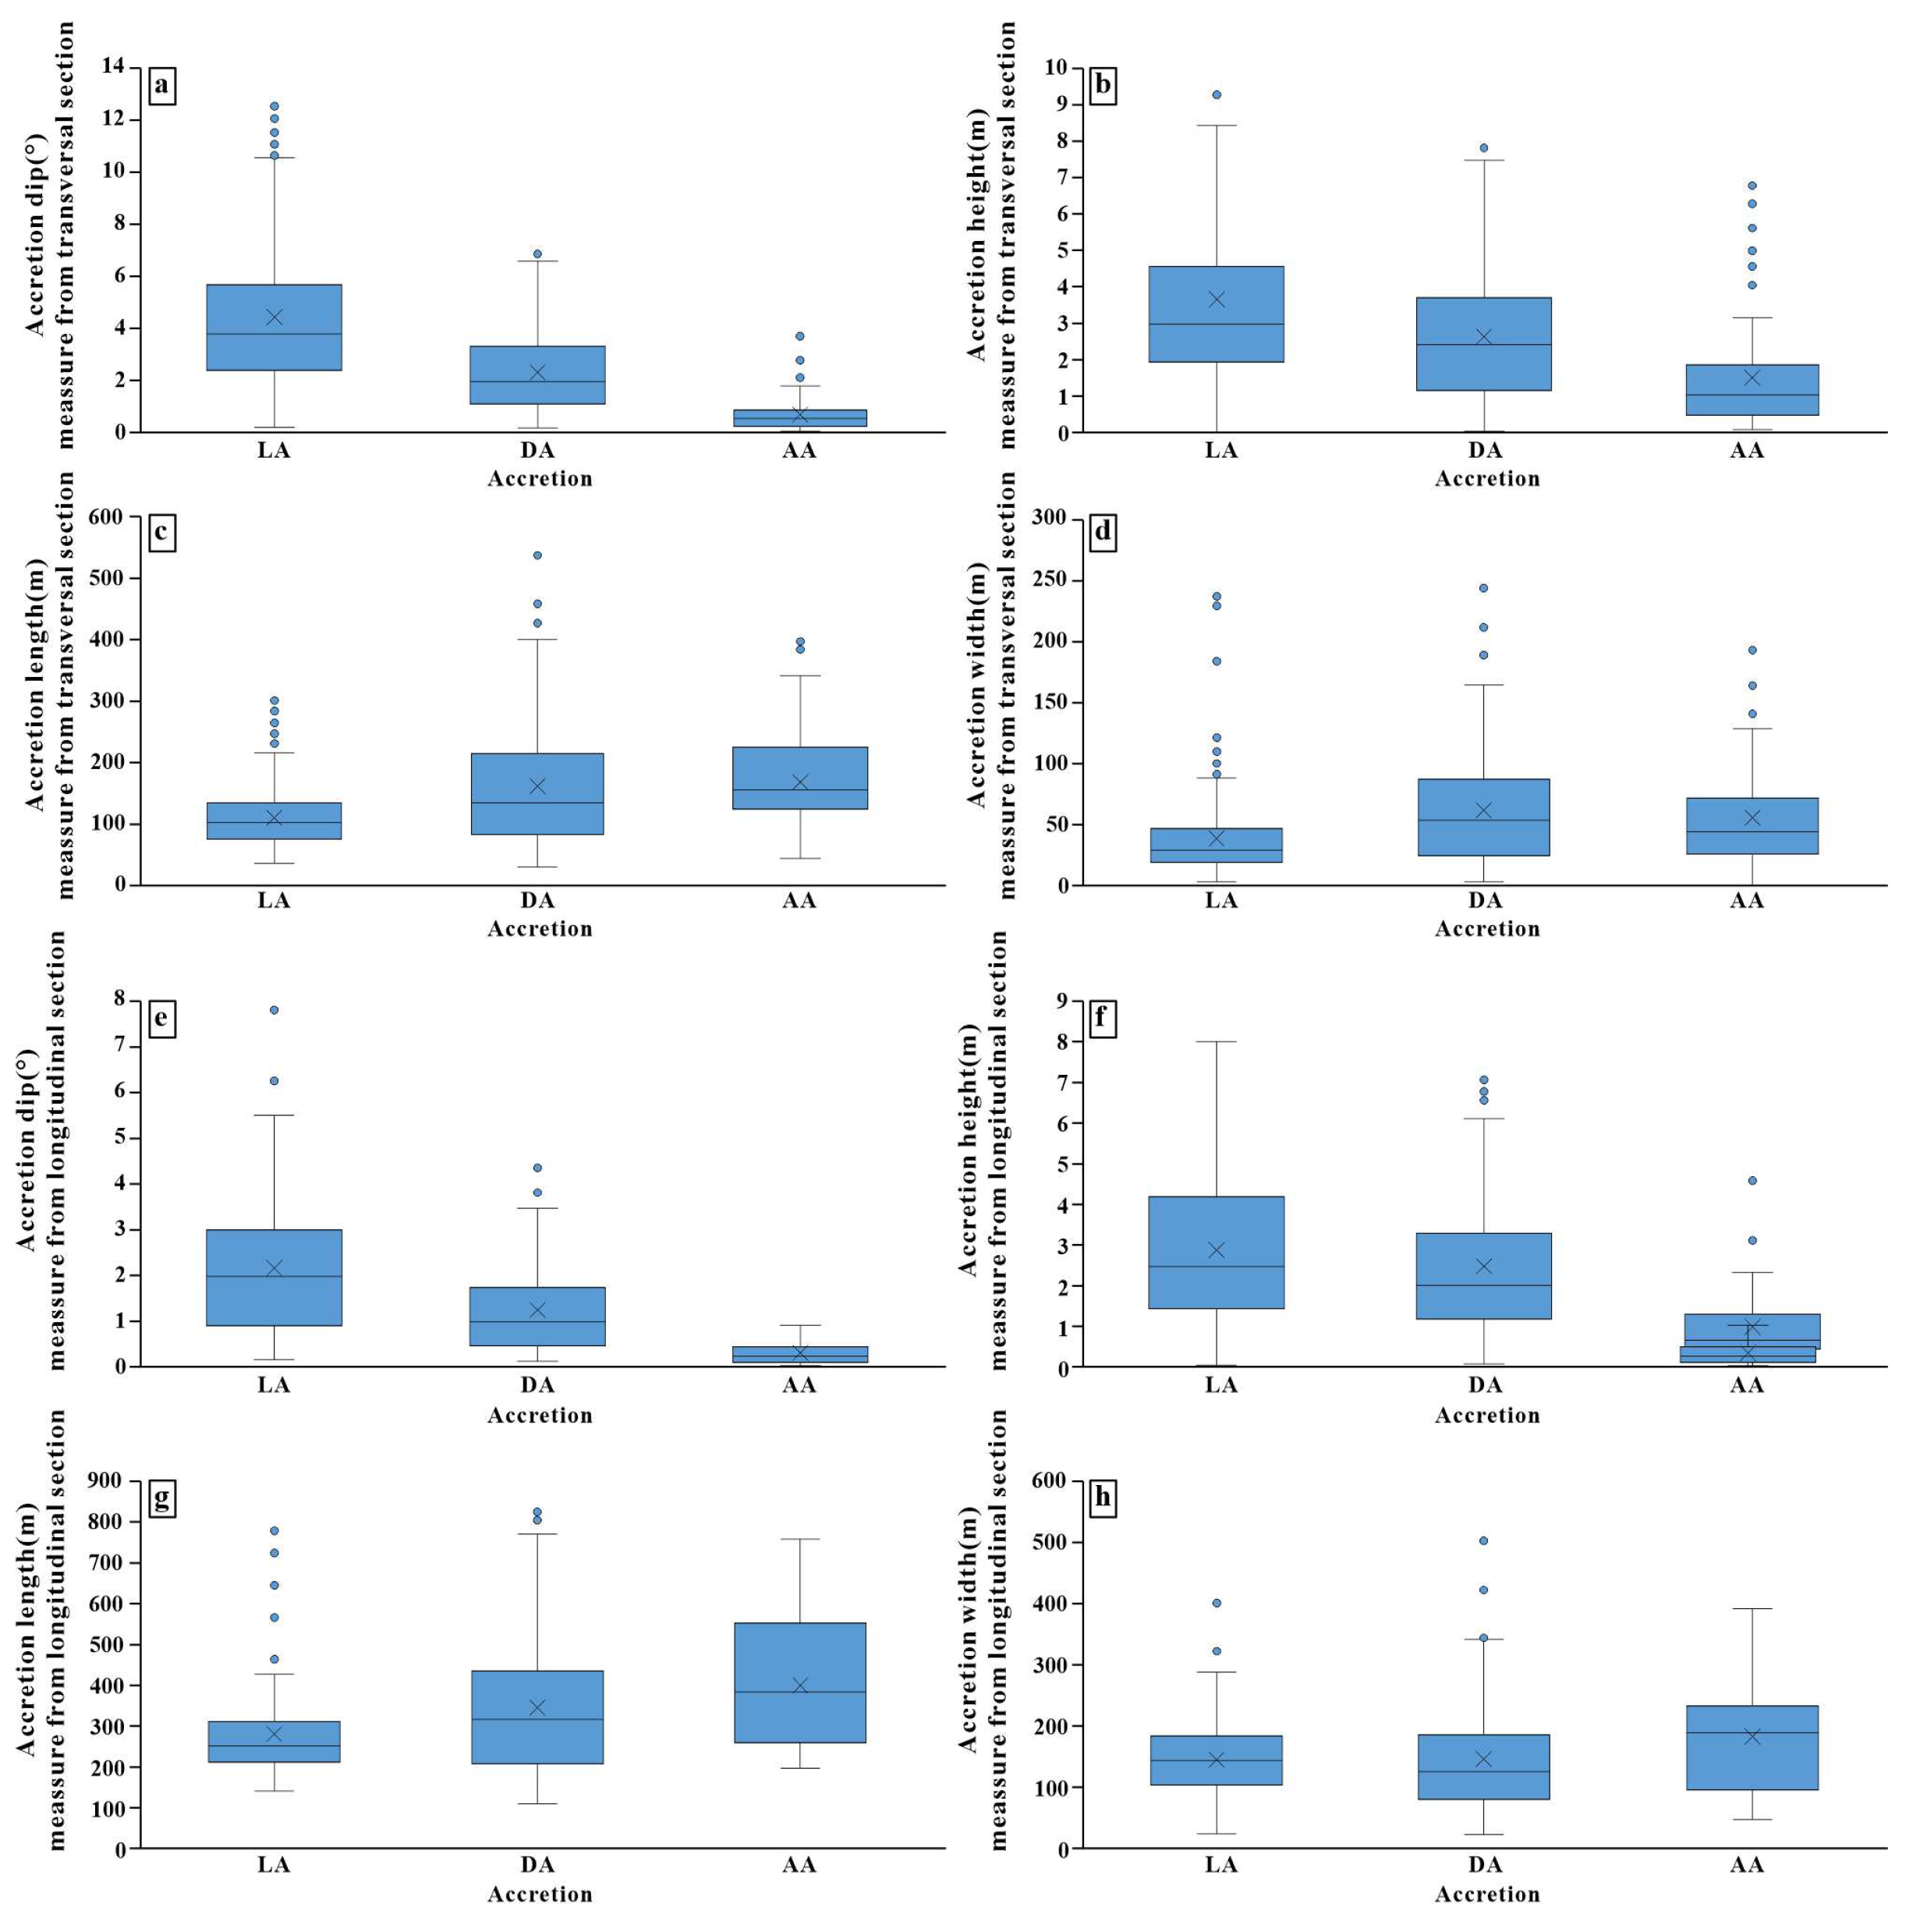
Li, 2015, suggests that lateral accretion (LA) forms during periods of reduced water flow, with an inclination angle of 5° to 15° and a thickness of 0.4–1.5 m. In our study, we conducted a quantitative analysis of the scale and dip angle of accretions. We observed the following patterns: (1) The dip angle distribution range of LA-formed accretions is wider than that of DA-formed bodies. Additionally, LA- and DA-formed bodies have larger dip angles than AAs (Figure 10a). (2) Accretions formed by LA and DA are notably taller compared to those formed by AA (Figure 10b). (3) Both DA and AA have a significantly larger scale than LA, as evidenced by the distribution range of their length and width (Figure 10c,d). Furthermore, the extension range of LA is relatively small, which is characterized by its large thickness and inclination angle. On the other hand, AA has a long extension range, a thin thickness, and a smaller inclination angle (Figure 11).
4.4. The D50 and Permeability of the Bars
Permeability can be derived from empirical relations between permeability and various statistical grain-size parameters, such as the geometric mean, median, and effective diameter [46,47,48]. Generally, there is a positive correlation between particle size and permeability, and the particle size of sediment is easier to obtain. Therefore, estimating the permeability of oil and water from particle size distribution can serve as a reference. By conducting a particle size analysis of the four bars and considering the relationship between particle size and permeability, we believe that without strong cementation, the permeability of these bars also varies. Among them, the unit bar and complex compound bars exhibit the highest permeability, followed by the DA-dominated compound bar, while the LA-dominated compound bar exhibits the lowest permeability.
5. Conclusions
The sedimentary style and quantitative relationship of accretions in large sandy braided rivers are studied by numerical sedimentary simulation. The following conclusions are obtained:
- (1)
- The channel bar consists of downstream accretion (DA), lateral accretion (LA), and aggradational accretion (AA). DA appears earlier in wide and shallow bedforms, while LA becomes one of the primary accretion types on the channel bars as the braided channel network develops. Stabilization of the channel network leads to AA deposition as a fraction of the flow covers the top of the bars. The evolutionary process subsequently increases the complexity of channel bars, resulting in a higher variety and abundance of accretion types.
- (2)
- The internal architecture of channel bars can be categorized into unit bars, simple compound bars, and complex compound bars based on accretions types. Unit bars possess a lobate shape and consist of multiple accretions, with downstream accretions (DA) preserved in the core, aggradational accretions (AA) layered above the core, and lateral accretions (LA) deposited on the sides. Compound bars form through the migration and amalgamation of multiple unit bars, resulting in a greater number of accretions. They can be further classified into two categories based on the dominant accretion type: DA-dominated and LA-dominated. Complex compound bars result from the amalgamation of multiple compound bars and unit bars, undergoing erosion, cutting, and deposition during formation, leading to the development of additional accretions. They exhibit a vertical sequence comprising both the DA to AA style seen in unit bars and the DA to LA to AA style observed in compound bars, while horizontally showing a recurring succession from DA to LA. The sedimentary direction of complex compound bars is influenced by their specific location within the braided river system. Meanwhile, considering the correlation of particle sizes with permeability, we observed that the permeability of the four bars varies in the absence of strong cementation. The unit bars and complex compound bars have the highest permeability, followed by the DA-dominated compound bars, while the LA-dominated compound bars have the lowest permeability.
Author Contributions
Y.G. was the primary author of this article, with all co-authors also contributing to the manuscript. Y.G. and S.L. developed the ideas and concepts of this work. Y.G. undertook the sedimentary numerical simulations of this work. Y.G. drew the manuscript, and S.L. supervised and edited the manuscript. F.H. and T.L. have reviewed and edited the manuscript. They warrant that the article is the author’s original work, has not received prior publication, and is not under consideration for publication elsewhere. All authors have read and agreed to the published version of the manuscript.
Funding
The authors are financially supported by the National Natural Science Foundation of China “Research on Sedimentary Configuration Model and Sedimentary Dynamics Mechanism of Sand Braided River Core Beach Dam” (Project No. 41802123).
Data Availability Statement
The raw data supporting the conclusion of this article will be made available by the authors without undue reservation.
Conflicts of Interest
Authors Ying Guo, Faqi He and Tao Lei were employed by the company Sinopec North China Petroleum Bureau. The remaining authors declare that the research was conducted in the absence of any commercial or financial relationships that could be construed as a potential conflict of interest.
References
- Bridge, J.S. Rivers and Floodplains: Forms, Processes, and Sedimentary Record; Blackwell: Oxford, UK, 2003. [Google Scholar]
- Schuurman, F.; Kleinhans, M.G. Bar Dynamics and Bifurcation Evolution in a Modelled Braided Sand-bed River. Earth Surf. Process. Landf. 2015, 40, 1318–1333. [Google Scholar] [CrossRef]
- Best, J.L.; Ashworth, P.J. Scour in large braided rivers and the recognition of sequence stratigraphic boundaries. Nature 1997, 387, 275–277. [Google Scholar] [CrossRef]
- Kiss, T.; Sipos, G. Braid-Scale Channel Geometry Changes in a Sand-Bedded River: Significance of Low Stages. Geomorphology 2007, 84, 209–221. [Google Scholar] [CrossRef]
- Chalov, R.S.; Zavadskii, A.S.; Ruleva, S.N. Parallel-Branch Braiding of River Channels: Formation Conditions, Morphology, and Dynamics. Water Resour. 2008, 35, 156–164. [Google Scholar] [CrossRef]
- Schuurman, F.; Kleinhans, M.G.; Middelkoop, H. Network Response to Disturbances in Large Sand-Bed Braided Rivers. Earth Surf. Dynam. 2016, 4, 25–45. [Google Scholar] [CrossRef]
- Cant, D.J.; Walker, R.G. Fluvial Processes and Facies Sequences in the Sandy Braided South Saskatchewan River, Canada. Sedimentology 1978, 25, 625–648. [Google Scholar] [CrossRef]
- Smith, S.A. The Sedimentology and Accretionary Styles of an Ancient Gravel-Bed Stream: The Budleigh Salterton Pebble Beds (Lower Triassic), Southwest England. Sediment. Geol. 1990, 67, 199–219. [Google Scholar] [CrossRef]
- Sambrook Smith, G.H.; Best, J.L.; Petts, G.E.; Bristow, C.S. Braided Rivers: Process, Deposits, Ecology and Management; Blackwell International Association of Sedimentologists 36: Oxford, UK, 2006; pp. 11–50. [Google Scholar]
- Ashworth, P.J.; Sambrook Smith, G.H.; Best, J.L.; Bridge, J.S.; Lane, S.N.; Lunt, I.A.; Reesink, A.J.H.; Simpson, C.J.; Thomas, R.E. Evolution and Sedimentology of a Channel Fill in the Sandy Braided South Saskatchewan River and Its Comparison to the Deposits of an Adjacent Compound Bar: Evolution and Sedimentology of a Channel Fill in a Sandy Braided River. Sedimentology 2011, 58, 1860–1883. [Google Scholar] [CrossRef]
- Best, J.L.; Ashworth, P.J.; Bristow, C.S.; Roden, J. Three-Dimensional Sedimentary Architecture of a Large, Mid-Channel Sand Braid Bar, Jamuna River, Bangladesh. J. Sediment. Res. 2003, 73, 516–530. [Google Scholar] [CrossRef]
- Khan, N.I.; Islam, A. Quantification of erosion patterns in the Brahmaputra–Jamuna River using geographical information system and remote sensing techniques. Hydrol. Process. 2003, 17, 959–966. [Google Scholar] [CrossRef]
- Kleinhans, M.G.; Ferguson, R.I.; Lane, S.N.; Hardy, R.J. Splitting Rivers at Their Seams: Bifurcations and Avulsion: BIFURCATIONS AND AVULSION. Earth Surf. Process. Landf. 2013, 38, 47–61. [Google Scholar] [CrossRef]
- Nicholas, A.P. Modelling the Continuum of River Channel Patterns. Earth Surf Process. Landf 2013, 38, 1187–1196. [Google Scholar] [CrossRef]
- Vesipa, R.; Camporeale, C.; Ridolfi, L. Effect of Sampling Time in the Laboratory Investigation of Braided Rivers. Water Resour. Res. 2017, 53, 5184–5197. [Google Scholar] [CrossRef]
- Castelltort, S. Empirical Relationship between River Slope and the Elongation of Bars in Braided Rivers: A Potential Tool for Paleoslope Analysis from Subsurface Data. Mar. Pet. Geol. 2018, 96, 544–550. [Google Scholar] [CrossRef]
- Zhang, K.; Wu, S.; Feng, W.; Zhang, J.; Wen, S. Bar Dynamics in a Sandy Braided River: Insights from Sediment Numerical Simulations. Sediment. Geol. 2020, 396, 105557. [Google Scholar] [CrossRef]
- Cant, D.J.; Walker, R.G. Development of a Braided-Fluvial Facies Model for the Devonian Battery Point Sandstone, Québec. Can. J. Earth Sci. 1976, 13, 102–119. [Google Scholar] [CrossRef]
- Sambrook Smith, G.H.; Ashworth, P.J.; Best, J.L.; Woodward, J.; Simpson, C.J. The Sedimentology and Alluvial Architecture of the Sandy Braided South Saskatchewan River, Canada. Sedimentology 2006, 53, 413–434. [Google Scholar] [CrossRef]
- Munawar, M.J.; Lin, C.; Chunmei, D.; Zhang, X.; Zhao, H.; Xiao, S.; Azeem, T.; Zahid, M.A.; Ma, C. Architecture and Reservoir Quality of Low-Permeable Eocene Lacustrine Turbidite Sandstone from the Dongying Depression, East China. Open Geosci. 2018, 10, 87–112. [Google Scholar] [CrossRef]
- Feng, C.; Bao, Z.; Yang, L.; Si, X.; Xu, G.; Han, X. Reservoir Architecture and Remaining Oil Distribution of Deltaic Front Underwater Distributary Channel. Pet. Explor. Dev. 2014, 41, 358–364. [Google Scholar] [CrossRef]
- Mosselman, E. Hydraulic geometry of straight alluvial channels and the principle of least action. J. Hydraul. Res. 2004, 42, 219–222. [Google Scholar] [CrossRef]
- Kleinhans, M.G.; Van Dijk, W.M.; van de Lageweg, W.I.; Hoyal, D.C.; Markies, H.; van Maarseveen, M.; Roosendaal, C.; van Weesep, W.; van Breemen, D.; Hoendervoogt, R.; et al. Quantifiable Effectiveness of Experimental Scaling of River- and Delta Morphodynamics and Stratigraphy. Earth-Sci. Rev. 2014, 133, 43–61. [Google Scholar] [CrossRef]
- Schuurman, F.; Marra, W.A.; Kleinhans, M.G. Physics-Based Modeling of Large Braided Sand-Bed Rivers: Bar Pattern Formation, Dynamics, and Sensitivity: BRAIDED RIVER MODELING. J. Geophys. Res. Earth Surf. 2013, 118, 2509–2527. [Google Scholar] [CrossRef]
- Schuurman, F.; Ta, W.; Post, S.; Sokolewicz, M.; Busnelli, M.; Kleinhans, M. Response of Braiding Channel Morphodynamics to Peak Discharge Changes in the Upper Yellow River. Earth Surf. Processes. Landf. 2018, 43, 1648–1662. [Google Scholar] [CrossRef]
- Ranasinghe, R.; Swinkels, C.; Luijendijk, A.; Roelvink, D.; Bosboom, J.; Stive, M.; Walstra, D. Morphodynamic upscaling with the MORFAC approach: Dependencies and sensitivities. Coast. Eng. 2011, 58, 806–811. [Google Scholar] [CrossRef]
- Li, W.; Yue, D.; Colombera, L.; Mountney, N.P.; Wu, S. A Novel Method for Estimating Sandbody Compaction in Fluvial Successions. Sediment. Geol. 2020, 404, 105675. [Google Scholar] [CrossRef]
- Rice, S.P.; Church, M.; Wooldridge, C.L.; Hickin, E.J. Morphology and Evolution of Bars in a Wandering Gravel-bed River; Lower Fraser River, British Columbia, Canada. Sedimentology 2009, 56, 709–736. [Google Scholar] [CrossRef]
- Bridge, J.S.; Lunt, I.A. Depositional Models of Braided Rivers. In Braided Rivers; Sambrook Smith, G.H., Best, J.L., Bristow, C.S., Petts, G.E., Eds.; Wiley: Hoboken, NJ, USA, 2006; pp. 11–50. ISBN 978-1-4051-5121-4. [Google Scholar]
- Li, S.; Yu, X.; Chen, B.; Li, S. Quantitative Characterization of Architecture Elements and Their Response To Base-Level Change in A Sandy Braided Fluvial System at A Mountain Front. J. Sediment. Res. 2015, 85, 1258–1274. [Google Scholar] [CrossRef]
- Joeckel, R.M.; Tucker, S.; McMullin, J. Morphosedimentary features from a major flood on a small, lower-sinuosity, single-thread river: The unknown quantity of overbank deposition, historical-change context, and comparisons with a Multichannel River. Sediment. Geol. 2016, 343, 18–37. [Google Scholar] [CrossRef]
- Guo, W.; Dong, C.; Lin, C.; Zhang, T.; Zhao, Z.; Li, J. 3D Sedimentary Architecture of Sandy Braided River, Based on Outcrop, Unmanned Aerial Vehicle and Ground Penetrating Radar Data. Minerals 2022, 12, 739. [Google Scholar] [CrossRef]
- Ashworth, P.J.; Best, J.L.; Roden, J.E.; Bristow, C.S.; Klaassen, G.J. Morphological Evolution and Dynamics of a Large, Sand Braid-Bar, Jamuna River, Bangladesh: Evolution of a Large Sand Braid-Bar. Sedimentology 2000, 47, 533–555. [Google Scholar] [CrossRef]
- Weckwerth, P. Fluvial Responses to the Weichselian Ice Sheet Advances and Retreats: Implications for Understanding River Paleohydrology and Pattern Changes in Central Poland. Int. J. Earth Sci. 2018, 107, 1407–1429. [Google Scholar] [CrossRef]
- Hundey, E.J.; Ashmore, P.E. Length scale of braided river morphology. Water Resour. Res. 2009, 45. [Google Scholar] [CrossRef]
- Miall, A.D. A Review of the Braided-River Depositional Environment. Earth-Sci. Rev. 1977, 13, 1–62. [Google Scholar] [CrossRef]
- Miall, A.D. Architectural-Element Analysis: A new method of facies analysis applied to fluvial deposits. Recognition of Fluvial Depositional Systems and Their Resource Potential. Earth-Sci. Rev. 1985, 22, 261–308. [Google Scholar] [CrossRef]
- Miall, A.D. Miall Reservoir Heterogeneities in Fluvial Sandstones: Lessons from Outcrop Studies. Bulletin 1988, 72, 682–697. [Google Scholar] [CrossRef]
- Miall, A.D. Architecture and Sequence Stratigraphy of Pleistocene Fluvial Systems in the Malay Basin, Based on Seismic Time-Slice Analysis. Bulletin 2002, 86, 1201–1216. [Google Scholar] [CrossRef]
- Miall, A.D.; Jones, B.G. Fluvial Architecture of the Hawkesbury Sandstone (Triassic), Near Sydney, Australia. J. Sediment. Res. 2003, 73, 531–545. [Google Scholar] [CrossRef]
- Miall, A.D. Reconstructing the Architecture and Sequence Stratigraphy of the Preserved Fluvial Record as a Tool for Reservoir Development: A Reality Check. Bulletin 2006, 90, 989–1002. [Google Scholar] [CrossRef]
- Bridge, J.S.; Smith, N.D.; Trent, F.; Gabel, S.L. Sedimentology and morphology of a low-sinuosity river: Calamus River, Nebraska Sand Hills. Sedimentology 1986, 33, 851–870. [Google Scholar] [CrossRef]
- Fielding, C.R.; Alexander, J.; McDonald, R. Sedimentary Facies from Ground-Penetrating Radar Surveys of the Modern, Upper Burdekin River of North Queensland, Australia: Consequences of Extreme Discharge Fluctuations. In Fluvial Sedimentology VI; Smith, N.D., Rogers, J., Eds.; Wiley: Hoboken, NJ, USA, 1999; pp. 347–362. ISBN 978-0-632-05354-4. [Google Scholar]
- Mumpy, A.J.; Jol, H.M.; Kean, M.F.; Isbell, J.L. Architecture and sedimentology of an active braid bar in the Wisconsin River based on 3-D ground penetrating radar. In Stratigraphic Analyses Using GPR; Geological Society of America: Boulder, CO, USA, 2007; Volume 432, pp. 111–131. [Google Scholar] [CrossRef]
- Sun, J.; Lin, B.; Yang, H. Development and Application of a Braided River Model with Non-Uniform Sediment Transport. Adv. Water Resour. 2015, 81, 62–74. [Google Scholar] [CrossRef]
- Vuković, M.T.; Soro, A. Determination of Hydraulic Conductivity of Porous Media from Grain-Size Composition; Water Resources Publications: Littleton, CO, USA, 1992. [Google Scholar]
- Kasenow, M. Determination of Hydraulic Conductivity from Grain Size Analysis; Water Resources Publication: Littleton, CO, USA, 2002. [Google Scholar]
- Song, J.; Chen, X.; Cheng, C.; Wang, D.; Lackey, S.; Xu, Z. Feasibility of Grain-Size Analysis Methods for Determination of Vertical Hydraulic Conductivity of Streambeds. J. Hydrol. 2009, 375, 428–437. [Google Scholar] [CrossRef]
Figure 1.
Grid and initial water depth distribution for braided river numerical simulation.

Figure 2.
(a–k): Time series of maps of riverbed erosion and sedimentation, showing an example of the development and evolution of a braided river from a planar surface.
Figure 2.
(a–k): Time series of maps of riverbed erosion and sedimentation, showing an example of the development and evolution of a braided river from a planar surface.

Figure 3.
The difference in particle size among different types of accretions: (a) the AA’ D50 grain size profile of unit bars (corresponding the position AA’ in the Figure 4a); (b) the CC’ D50 grain size profile of unit bars (corresponding the position CC’ in the Figure 4b); (c) the grain size profile of DA, with fining downwards; (d) the grain size profile of AA’, with both fining downwards and upwards; and (e) the grain size profile of multiple LA phases, with fine grain size at the top, indicating fining upwards.

Figure 4.
The internal architecture of the unit bar: (a) the AA’ in c corresponding to the longitudinal source section, (b) the CC’ in c corresponding to the transverse source section, (c) the plan of the unit bar, and (d) the flow direction pattern diagram when DA is formed in the unit bar, the arrow represents the direction of water flow, blue color represents the river channel, and yellow color represents the unit bar.

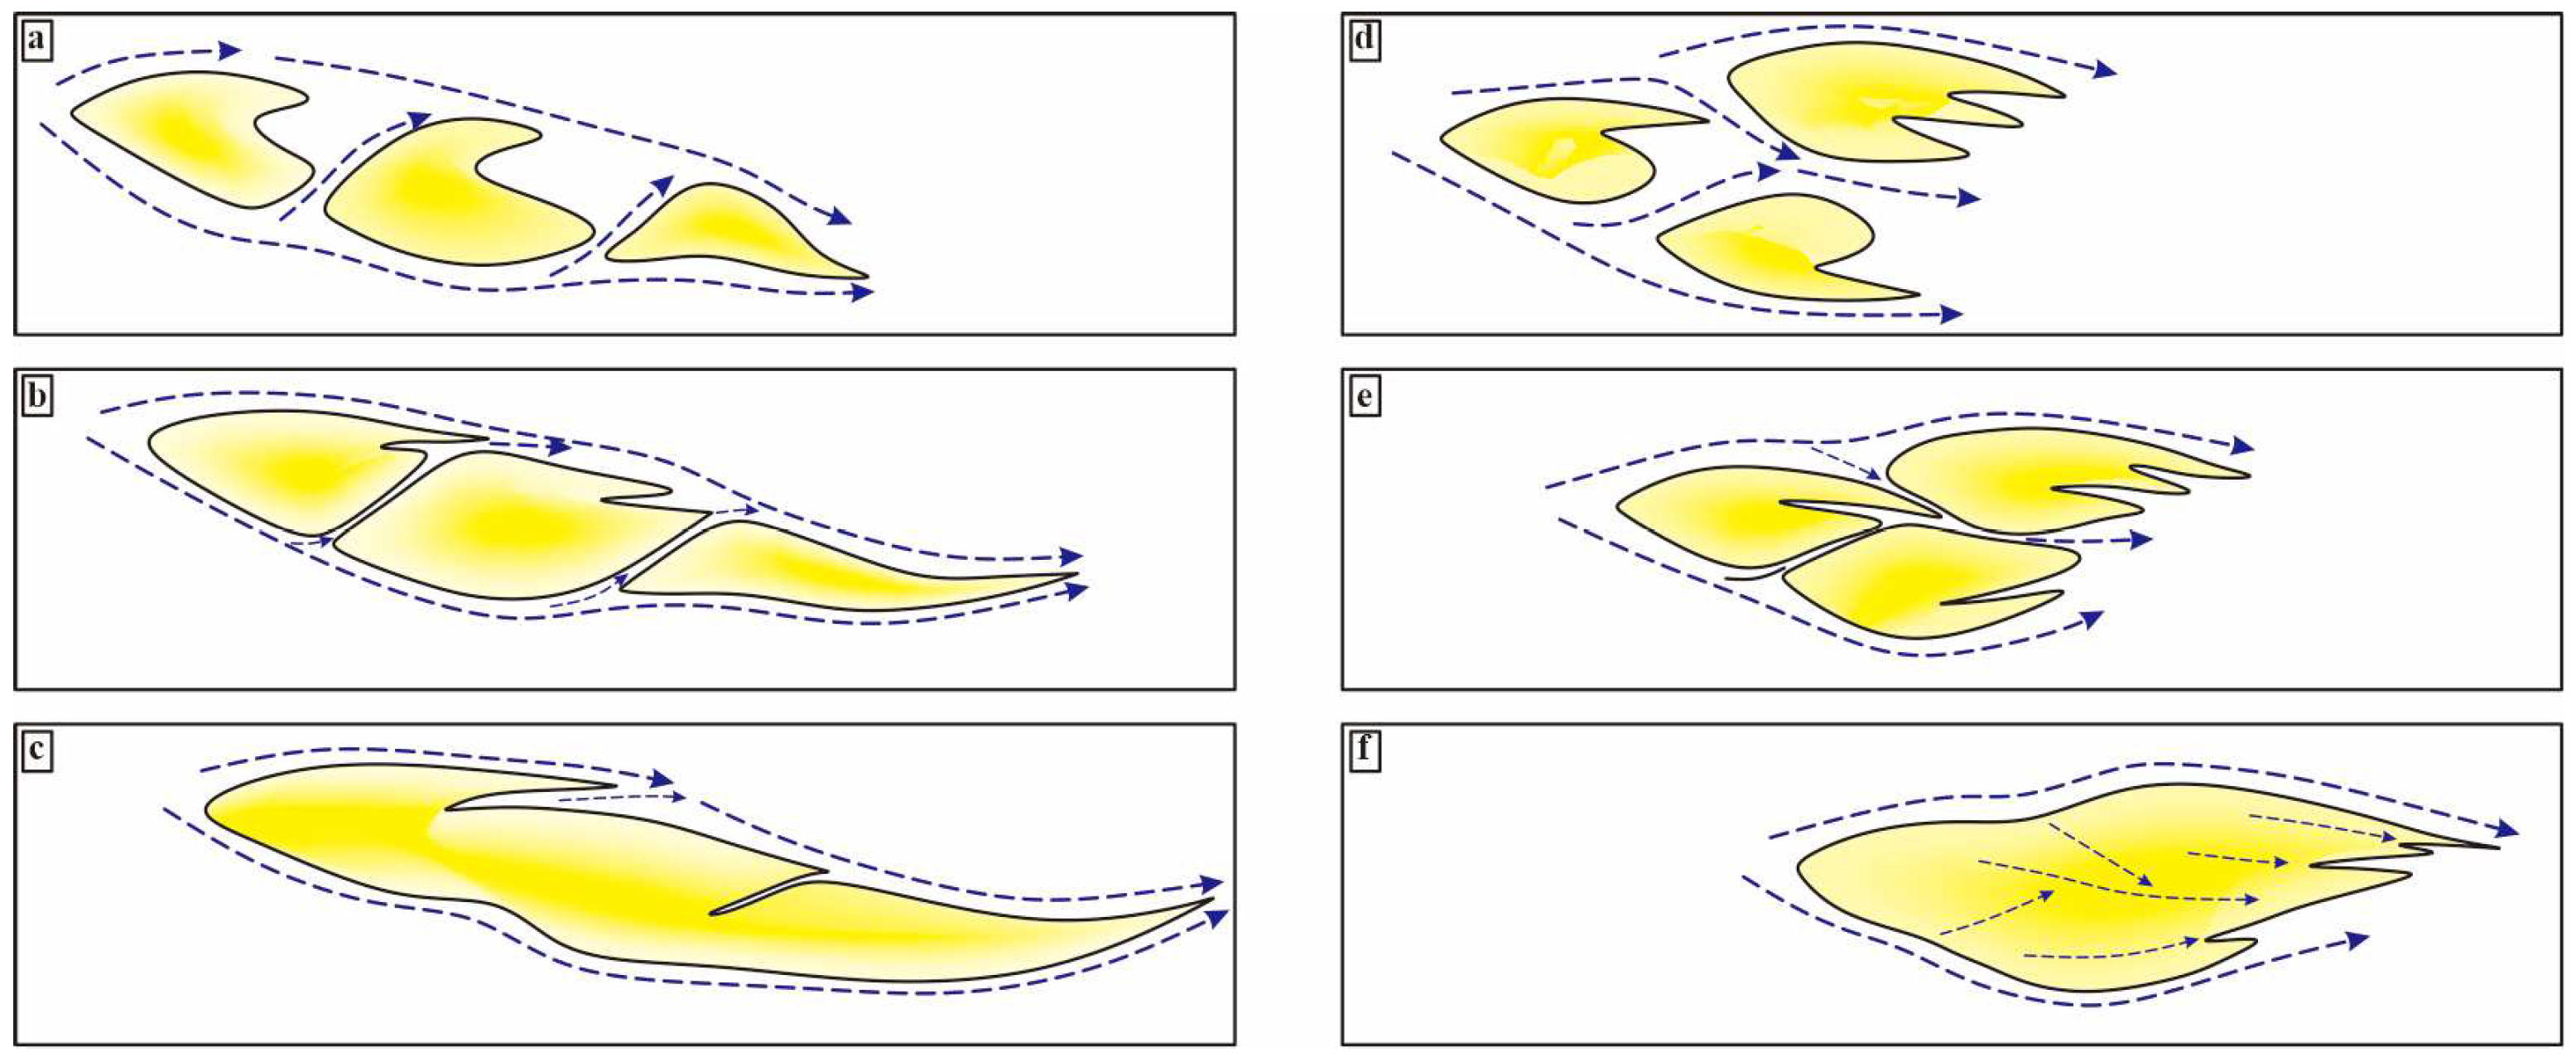
Figure 5.
Process of unit bar growth and amalgamation to form a compound bar: the arrow represents the direction of water flow, (a) three unit bars, (b) unit bar turn to lateral amalgamate and the channel narrowing, (c) the channel closed and unit bars composite to be a LA-dominated compound bar, (d) three unit bars, (e) unit bar turn to downstream amalgamate and the channel narrowing, and (f) the channel closed and unit bars composite to be a DA-dominated compound bar.

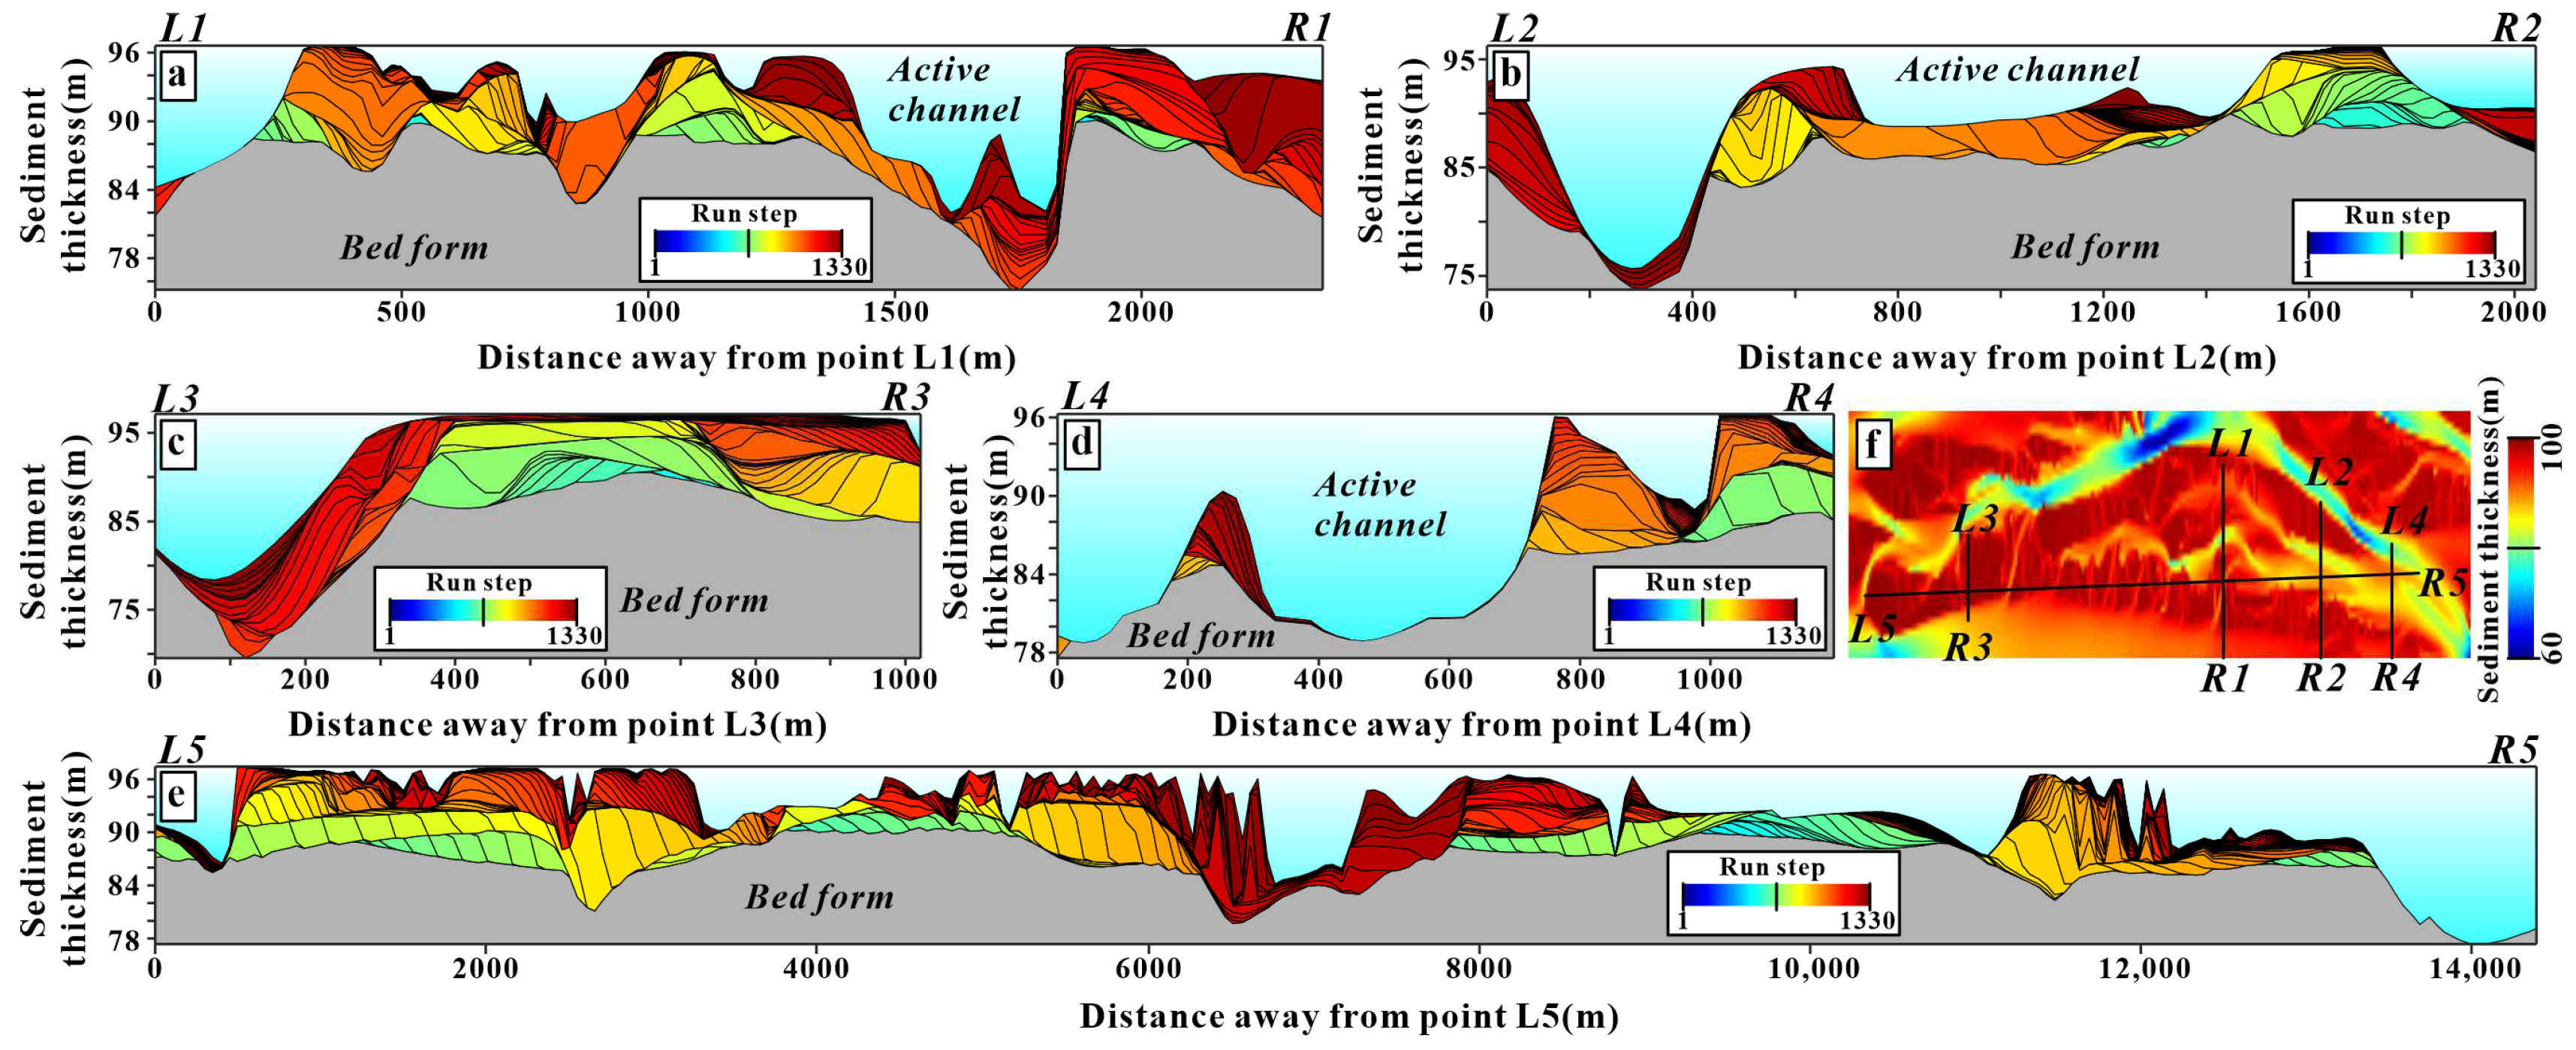
Figure 6.
The internal architecture of the LA-dominated compound bar: (a) the head transverse section of the compound bar corresponds to L1R1 in (f), (b) the tail transverse section of the compound bar corresponds to L2R2 in (f), (c) the middle transverse section of the compound bar corresponds to L3R3 in (f), (d) the other tail transverse section of the compound bar corresponds to L4R4 in (f), (e) the longitudinal source profile of the compound bar corresponds to L5R5 in (f), and (f) the plane view of the compound bar.

Figure 7.
The internal architecture of a DA-dominated compound bar: (a) the head transverse section of the compound bar corresponds to AA’ in (e), (b) the middle transverse section of the compound bar corresponds to BB’ in (e), (c) the tail transverse section of the compound bar corresponds to CC’ in (e), (d) the longitudinal source profile of the compound bar corresponds to DD’ in (e), and (e) the plan view of the compound bar.

Figure 8.
The internal architecture of a complex compound bar: (a) the middle transverse section of the compound bar corresponds to L1R1 in (f), (b) the tail transverse section of the compound bar corresponds to L2R2 in (f), (c) the head transverse section of the compound bar corresponds to L3R3 in (f), (d) another tail transverse section of the compound bar corresponds to L4R4 in (f), (e) the longitudinal source section of the compound bar corresponds to L5R5 in (f), and (f) the plan view of the complex compound bar.

Figure 9.
The temporal formation ratio of different bars.

Figure 10.
Statistical information on the inclination and scale of different accretions in the direction of longitudinal and transverse sources: (a) the dip range of different accretions in transverse sources, (b) the height of different accretions in transverse sources, (c) the length of different accretions in transverse sources, (d) the width of different accretions in transverse sources, (e) the dip range of different accretions in longitudinal sources, (f) the height of different accretions in longitudinal sources, (g) the length of different accretions in longitudinal sources, and (h) the width of different accretions in longitudinal sources.

Figure 11.
Vertical distribution of different accretions.


Table 1.
The main parameters of the Delft3D simulation.
| Parameters | Value | |||
|---|---|---|---|---|
| D50 (μm) | 300 | |||
| Muddy sediment concentration (kg/m3) | 10 | |||
| Sandy sediment concentration (kg/m3) | 2.5 | |||
| Sediment component | Fine sand | Medium sand | Coarse sand | Very coarse sand |
| D50 of sediment components (um) | 150 | 300 | 750 | 1500 |
| Fraction of components (quality proportion, %) | 25 | 50 | 15 | 10 |
| concentration of components (kg/m3) | 1.25 | 2.5 | 0.75 | 0.5 |
| Density of sandy sediment (g/cm3) | 2.65 | |||
| Bed slope (°) | 9.3 × 10⁻⁵ | |||
| Simulation domain width (km) | 3.2 | |||
| Discharge (m3/s) | 40,000 | |||
| The scale of the grid cell | 50 m × 20 m | |||
| Grid cell amount | 1600 × 160 | |||
| The scale of the simulation domain | 80,000 m × 3200 m | |||
| Morphological scale factor | 48 | |||
| Roughness (Chezy) (m1/2/s) * | 45 | |||
| Horizontal eddy viscosity (m2/s) * | 1000 | |||
| Horizontal eddy diffusivity (m2/s) * | 0.001 | |||
| Adjacent erosion factor | 0.25 | |||
| Simulation time step (min) | 0.2 | |||
| Simulation data restoration time interval (min) | 15 | |||
* Empirical parameters, sourced from [24].
Table 2.
Classification of accretions.
| Accretion Type | Source Profile | Length Range/Average (m) | Width Range/Average (m) | Thickness Range/Average (m) | Dip Range/Average (°) | Deposition Time | Relative Location in the Channel Bar | Relative Vertical Location in the Channel Bar | Spatial Pattern |
|---|---|---|---|---|---|---|---|---|---|
| DA | Transverse | 80–158 /132 | 23–68 /52 | 1.5–3.7 /2.6 | 1.4–3.9° /2.8 | Early stage | Middle bar | Lower part | Downstream accumulation |
| Longitudinal | 214–434 /345 | 102–191 /157 | 1.5–3.7 /2.6 | 0.5–2.0° /1.4 | |||||
| LA | Transverse | 76–145 /121 | 18–57 /42 | 1.7–5.1 /3.7 | 2.0–5.8° /4.3 | Middle to late stage | Bar side | Medium to upper part | Lateral accumulation |
| Longitudinal | 212–322 /288 | 99–185 /144 | 1.6–4.3 /3.1 | 0.8–3.0° /2.2 | |||||
| AA | Transverse | 127–231 /189 | 27–90 /64 | 0.6–2.2 /1.9 | 0.3–1.0° /0.9 | Late stage | Middle bar | Upper part | Vertical accumulation |
| Longitudinal | 210–453 /345 | 80–210 /150 | 0.5–1.6 /1.2 | 0.2–0.9° /0.6 |
Table 3.
Classification standards for the channel bar.
| Classification | Main Types | Proportion | Number of Accretions | Planar Morphologic | Aspect Ratio | Average Vertical Thickness | Mean of D50 (um) | Variance of D50 | Spatial Pattern | Inclination Direction | Number of Chutes | Distribution Location |
|---|---|---|---|---|---|---|---|---|---|---|---|---|
| Unit bars | DA | 47 | Small | A lobed planform with shallow bar-tail limbs | <1:3 | 4.5 | 321 | 14,806 | DAs are preserved in the core of the unit bar, AAs are covered above the core, and LAs are accumulated on the bar sides. | From both sides towards the center axis | 1~2 | Early and middle stages are located in the middle of the bar, and late stages are located on both sides or at the top |
| Compound bars | LA | 50 | Medium | Irregularly long shape | 6.3 | 2.65 | 267 | 14,425 | DA-dominated compound bars are a DA to AA upward succession, and LA is formed on the bar sides, especially the bar tail. While LA-dominated compound bars are an upward succession transformed from DA to LA, ending with AA vertically, and repetitive DA to LA succession horizontally. | The head and tail were from the deeper side towards the shallower side, and the center was from both sides towards the central axis | Multiple | Early bodies are located at the bottom, and the middle body is located at the top. The later bodies are located at the head and tail of the bar |
| DA | 52 | Medium | An irregularly lobed shape with multiple tail limbs | 3.8 | 2.86 | 317 | 18,477 | |||||
| Complex compound bars | DA | 43 | Large | An irregular shape with multiple tail limbs | 5 | 2.36 | 322 | 21,376 | DA to LA, ending with AA or DA to AA upward succession vertically, and repetitive DA to LA horizontally. | Complex directions | Multiple | The early bodies are located at the bottom, and the mid- to late bodies are located at the top of the bar or in chutes |
Disclaimer/Publisher’s Note: The statements, opinions and data contained in all publications are solely those of the individual author(s) and contributor(s) and not of MDPI and/or the editor(s). MDPI and/or the editor(s) disclaim responsibility for any injury to people or property resulting from any ideas, methods, instructions or products referred to in the content. |
© 2023 by the authors. Licensee MDPI, Basel, Switzerland. This article is an open access article distributed under the terms and conditions of the Creative Commons Attribution (CC BY) license (https://creativecommons.org/licenses/by/4.0/).
Share and Cite
MDPI and ACS Style
Guo, Y.; Li, S.; He, F.; Lei, T. Sedimentary Characteristics and Internal Architecture of a Sandy Braided River: Insights from a Numerical Model. Water 2023, 15, 4119. https://doi.org/10.3390/w15234119
AMA Style
Guo Y, Li S, He F, Lei T. Sedimentary Characteristics and Internal Architecture of a Sandy Braided River: Insights from a Numerical Model. Water. 2023; 15(23):4119. https://doi.org/10.3390/w15234119
Chicago/Turabian StyleGuo, Ying, Shaohua Li, Faqi He, and Tao Lei. 2023. "Sedimentary Characteristics and Internal Architecture of a Sandy Braided River: Insights from a Numerical Model" Water 15, no. 23: 4119. https://doi.org/10.3390/w15234119
Note that from the first issue of 2016, this journal uses article numbers instead of page numbers. See further details here.