
Clogging Behaviors in PVD and Their Evaluation Criteria for Dredged Mud Slurry
by
 , ,
, ,
Shufeng Bao
1,2,
Lingfeng Guo
3,*,
Zhiliang Dong
4,5,
Ruibo Zhou
6,
Shuangxi Zhou
1,2 and
Jian Chen
7,* 1
School of Civil & Engineering Management, Guangzhou Maritime University, Guangzhou 510725, China
2
Guangdong Provincial Key Laboratory of Green Construction and Intelligent Operation & Maintenance for Offshore Infrastructure, Guangzhou 510725, China
3
School of Civil Engineering & Transportation, South China University of Technology, Guangzhou 510641, China
4
CCCC Fourth Harbor Engineering Institute Co., Ltd., Guangzhou 510230, China
5
CCCC Key Lab of Environmental Protection & Safety in Foundation Engineering of Transportation, Guangzhou 510230, China
6
CCCC FHEC Harbor Engineering Design Co., Ltd., Guangzhou 510220, China
7
Guangzhou Institute of Railway Technology, Guangzhou 510430, China
*
Authors to whom correspondence should be addressed.
Water 2023, 15(24), 4206; https://doi.org/10.3390/w15244206
Submission received: 11 November 2023
/
Revised: 2 December 2023
/
Accepted: 4 December 2023
/
Published: 5 December 2023
(This article belongs to the Special Issue Coast Sediment Dynamics: Historical Development, Current Situation and Perspectives)
Abstract
:During the consolidation period of vacuum preloading drainage of dredged mud slurry, the clogging behaviors of the filter drainage structural layers and the core boards of prefabricated vertical drains (PVD) determine the drainage capacities of PVD. However, currently, there is a lack of comprehensive research on the evaluation criteria for these two clogging behaviors. Therefore, based on typical dredged mud slurry, typical geomembranes, and raw material core boards with different bending forms, relevant macro and micro-scale experimental studies have been carried out in this study. The research results show that (1) with the application of the gradient ratio test method, the clogging behaviors of filter membranes of PVD under graded vacuum preloading can be effectively simulated. Also, in the design of graded vacuum preloading, characteristics of equivalent pore sizes and pore structures should be emphasized to investigate the suitability of filtration and drainage performance of PVD filter membranes. (2) The compressive yield strength of core board grooves is a key factor influencing the reduction rate of flow capacity. The reduction rate of flow capacity and well resistance increment can be used as comprehensive indicators reflecting the clogging behaviors of core boards, while the bending angles and bending rates of core boards can be used as specific technical indicators. (3) The proposed clogging evaluation criteria for PVD are as follows: a filter membrane gradient ratio (GR) > 4.0, a core board bending rate >60% and a core board bending angle < 45°, or a reduction rate of flow capacity of bending drainage board > 90% or well-resistance increment > 9. Also, these criteria can be incorporated into the control indicators for drainage performance of PVD used in such types of foundations.
1. Introduction
Due to mild climate environments and convenient water transportation conditions, most world-famous cities have emerged in the coastal areas. Currently, many countries are still extensively promoting land reclamation in coastal areas to address land scarcity issues. Fast consolidation of dredged mud slurry with ideal bearing capacity is the prerequisite for the construction of coastal cities [1,2]. Meanwhile, with the continuous progression of industrialization and urbanization, the amount of dredged mud slurry caused by sanitation and water treatment is ever-increasing [3,4]. Therefore, rapid treatment of dredged mud slurry has become a common challenge faced by coastal and inland cities during their development. Due to its low unit cost and high construction efficiency, vacuum preloading technology is widely used in the treatment of dredged mud slurry [5,6,7,8,9,10]. Through vacuum preloading, negative pressure is applied to create a pressure gradient between the prefabricated vertical drains (PVD) and their surrounding dredged mud slurry, thus continuously extracting pore water from the dredged mud slurry and accelerating its consolidation. However, the dredged mud slurry has a complex composition with high contents of organic matter and fine clay particles. Under the influences of vacuum pressure and seepage force, it is easy for these small particles to accumulate in the prefabricated vertical drains (PVD), thus leading to the clogging behavior of PVD and affecting soil drainage and consolidation [4,11,12].
Scholars have conducted various extensive studies to investigate the clogging mechanism of PVD used in vacuum preloading sediment foundations. After studying a large number of cases of vacuum preloading improved soft soil foundations, Bao and Lou et al. [11] pointed out that severe clogging surrounding PVDs is caused by high contents of clay particles in soft soils, large fineness of PVD filters and fast vacuum loading rates. Through their gradient ratio tests of two different filter membranes of PVD, Le and Xu et al. [13] concluded that variations in hydraulic gradients have a significant influence on the clogging of filter membranes and that the clogging of PVD filter membranes is related to the processing techniques and pore sizes of these filter membranes, as well as soil properties. In their studies, Lei and Lu et al. [14] found that mud layer clogging starts between the stages of fast drainage and stable drainage and completes at the initial stage of slow drainage. With the consideration that fine particles will aggregate in the curved parts of PVDs, further reducing the cross-sectional areas of drainage channels, and that different types of PVD deformation (S-shaped and Z-shaped deformation) have different influences on the clogging of PVD, Cai and Qiao et al. [15] proposed that PVD deformation could exacerbate clogging of PVDs. Through experiments, Deng and Liu et al. [1] discovered that after continuous vacuum preloading, the average diameter of colloidal particles in tail water decreased from 1000 nm to 100 nm and then stabilized at around 100 nm. Therefore, they concluded that PVD clogging can be explained by the filling of colloidal particles in pore water into the soil column pores. Xu and He et al. [16] proposed that at the early stage of traditional vacuum preloading, clogging areas surrounding PVD will form and that these clogging areas are caused by the overall movement of soil masses toward PVD under high vacuum pressure gradients rather than the migration of fine particles. Moreover, micro-structural analysis of soil masses in clogging areas shows that clay particles in these soil masses tend to be vertically oriented, and with the reorientation of clay particles, the soil horizontal permeability coefficient is reduced, resulting in the anisotropic permeability of soil masses in the clogging areas. Lu and Sun [10] found that with the draining out of pore water, especially during the late stage of soil consolidation, fine soil particles could accumulate on the filter membranes of PVD, thus leading to clogging and reducing the drainage capacities of drainage systems. Wang and Wu et al. [12] discovered that upon the initiation of vacuum preloading, homogeneous soil masses would become heterogeneous. Also, when vacuum preloading started, the permeability of soils near the drainage boundary decreased by 50–100 times, resulting in severe clogging effects and a reduction of about 90% in the drainage rate of surrounding soil mass. Furthermore, within 24–48 h after vacuum preloading, the heterogeneity and clogging effects of soils peaked. Xu and Wu et al. [4] proposed that the complex composition and high organic matter content of sludge could lead to significantly increased content of small particles during the treatment of sludge with chemicals. Therefore, during the process of vacuum preloading, small particles could easily accumulate in PVD, thus resulting in clogging and affecting water drainage and soil consolidation. Some scholars [17,18,19] argued that the resistance exerted on soil particles by the vacuum pressure gradient is 5–10 times higher than the gravity. As a result, the permeability of vacuum-consolidated soil columns is lower than the permeability of gravity-consolidated soil masses, and the low permeability of these dense soil columns severely inhibits the drainage of surrounding slurry, with a so-called clogging problem emerging.
In order to address the clogging problem of PVD during the vacuum preloading process, scholars have put forward various solutions. Deng and Hong et al. [20] introduced a ventilated vacuum method with the aim of tackling the large pressure gradient to suppress the clogging effect. Wang and Ma et al. [21] believe that the clogging of PVD is a progressive process. Therefore, they put forward a method combining electroosmosis with vacuum preloading. That is, with the application of a vacuum system in the whole process of soil consolidation, when the rate of soil consolidation under vacuum preloading slows down, the electroosmosis system is activated to improve the dredged sea mud for tideland reclamation. Wang and Ni et al. [22] proposed a method combining vacuum preloading with lime treatment. In this method, a certain proportion of slaked lime is added to the dredged fill slurry before vacuum preloading. With the addition of slaked lime, cation exchanges and flocculation of fine soil particles will be induced on the clay surfaces. With this method, the risk of clogging around PVD can be significantly reduced, and the permeability of soils can be increased, thus improving the efficiency of soil consolidation. Lei and Lu et al. [14] proposed a multi-stage vacuum preloading method to modify the clogging process of PVDs in the treatment of ground foundations, with the aim of reducing their negative impacts on water drainage. Feng and Lei et al. [2] applied a method of temperature increase to reduce the clogging of PVD, thus improving the permeability and shear strength of soil masses. Some other scholars have proposed to use air compressors in the consolidation of newly dredged soil masses to address the problem of soil clogging [4,10,23,24,25].
However, only a few scholars have noticed that during the process of vacuum preloading consolidation, the clogging of the PVD mainly depends on the clogging of the filter structure layer (composed of the geo-filter membrane and the particle structure layer gradually gathered around it) and the plastic core plate [15,26]. Therefore, to investigate the clogging behaviors of PVD deeply, it is necessary to comprehensively study the phenomena of inherent severe clogging of filtering drainage structural layers in the dredged mud slurry and severe bending of core boards. Enlightened by this, relevant macro and micro-scale experiments have been carried out in this study based on typical dredged mud slurry, typical geomembranes, and raw-material core boards with different bending forms to profoundly investigate the clogging behaviors of filtering drainage structural layers and raw-material plastic core boards. With the establishment of clogging evaluation criteria for dredged mud slurry, this study aims to provide scientific support for the design of graded vacuum preloading and the improvement of related consolidation theories for such foundations.
2. Research Scheme for the Experiment on Clogging Behaviors of PVD
2.1. Experimental Objectives
- (1)
- Based on typical dredged mud slurry, indoor gradient ratio tests are to be carried out on four typical geomembranes to simulate the filtration and drainage behaviors of PVD filtering membranes under graded vacuum preloading to investigate the clogging behaviors of filtration and drainage structures.
- (2)
- Indoor water flow tests are to be carried out on raw-material PVD with five different bending forms to investigate the clogging behaviors of these raw-material core boards with corresponding forms.
2.2. Experimental Materials
- (1)
- Typical dredged mud slurry: Its initial physical characteristics are listed in Table 1. From the table, it can be seen that these sediment samples have a clay-particle (d < 0.005 mm) content of 40.7%, with a moisture content of 380%, which far exceeds the liquid limit and is more than five times higher than that limit. Also, these samples present such typical characteristics as high moisture content, high clay content, and high compressibility [11].
- (2)
- Typical geomembrane: To select geomembrane samples for the indoor clogging tests, equivalent pore size O95 is viewed as a primary consideration, and porosity ng is viewed as a secondary consideration [27]. Therefore, with careful consideration of the suitable range of equivalent pore sizes of the inverted filter layers in the dredged mud slurry identified by the author [26], the following geomembrane samples were selected in this study:
- ①
- Upper limit value of powder particle group with 2–3 times O95 (0.15–0.21 mm)—Large-aperture woven nylon mesh (referred to as DBN);
- ②
- Upper limit value of powder particle group with 1–2 times O95 (0.075–0.15 mm)—Medium-aperture woven nylon mesh (referred to as ZBN);
- ③
- Upper limit value of powder particle group less than O95 (<0.075 mm)—Small-aperture ordinary hot-rolled nonwoven fabric (referred to as XCW);
- ④
- Upper limit value of powder particle group less than O95 (<0.075 mm)—Small-aperture new anti-blocking hot-rolled nonwoven fabric (referred to as XFW).
- (3)
- Typical raw-material PVD: Four typical samples were used in this test, including:
- ①
- Conventional separation type (referred to as CF, with XCW filter membrane);
- ②
- Conventional integral type (referred to as CZ, with XCW filter membrane);
- ③
- Anti-blocking separation type (referred to as FF, with XFW filter membrane);
- ④
- Anti-blocking integral type (referred to as FZ, with XFW filter membrane).

Table 1.
Basic physical indicators of typical dredged mud slurry.
| Physical Properties | Boundary Moisture Content | Particle Composition | ||||||||
|---|---|---|---|---|---|---|---|---|---|---|
| Particle specific gravity Gs | Moisture content | Liquid limit WL | Plastic limit WP | Plastic index IP | Gravel >2.00 mm | Coarse sand 2.00~0.50 mm | Medium sand 0.50~0.25 mm | Fine sand 0.25~0.075 mm | Powder particle 0.075~ 0.005 mm | Clay particle <0.005 |
| -- | % | % | % | -- | % | % | % | % | % | % |
| 2.712 | 380 | 50.8 | 24.4 | 26.4 | 0.00 | 0.00 | 1.45 | 20.75 | 37.10 | 40.70 |
The microscopic test results for filter membranes are shown in Figure 1, with their pore characteristics, permeability performance, and physical mechanical properties listed in Table 2.
All of these samples used raw-material core boards with a parallel cruciform cross-section. Also, the cross-sectional flow areas of these four samples were 316.10 mm², 334.88 mm², 316.99 mm², and 313.16 mm², respectively. According to ASTM D6917-16(2022) [27], a compression buckling test was performed on the core boards used in this study, with the measured compressive yield strength of all of these core boards higher than 350 kPa (with no collapse phenomenon occurring among them under a test load of 600 kPa), thus satisfying the requirements of compressive yield strength for SPB-B0 type and SPB-C type core boards. The results of the compression buckling test are shown in Figure 2. Since the buckling strains corresponding to the peak load of each sample were respectively 10.0% (CZ), 8.5% (FF), 8.5% (FC), and 17.4% (CF), their compressive yield performance (peak buckling stress divided by the corresponding buckling strain) can be ranked as follows: CF < CZ < FF ≈ FZ.
2.3. Test Devices
- (1)
- Clogging test device for geosynthetic materials: Tianjin Metis TSY-12 model, used for testing the permeability coefficients and permeability ratios of the soil-filter membrane system and its interface under certain flow conditions.
- (2)
- Automatic mercury porosimeter: Conta, U.S., model PoreMaster33GT, used for the macroscopic analysis of clogging degrees of geomembranes.
- (3)
- High-resolution field emission scanning electron microscope: Zeiss, Germany, model Merlin, used for microscopic analysis of clogging characteristics and degrees of geomembranes.
- (4)
- Water flow test device for PVD: Tianjin Metis, model TSY-13, used for testing longitudinal water flow rates of PVD.
2.4. Experimental Research Scheme
2.4.1. Experimental Research Scheme for Clogging Behavior of Soil-Filter Membrane System
According to the Bernoulli D equation, the total hydraulic head h of a unit weight of water in a flowing stream can be expressed as follows:
where, z represents the elevation head, represents the pressure head, and represents the velocity head.
Because the permeability resistance in soils is high, and generally, the seepage velocity v is small, the velocity head formed is normally small. Therefore, Equation (1) can be simplified to the following Equation.
From Equation (2), it can be seen that at a certain depth position in the ground foundation, when negative vacuum pressure propagates radically from the vertical drainage board to its surrounding soil masses (), there will occur a difference in pressure head , which can be expressed as follows:
where is the excess pore water pressure caused by the negative vacuum pressure.
This water pressure results in radial seepage of water in soil pores. When the water in soil pores seeps radially towards the vertical drainage boards, there will be a loss of hydraulic head i (hydraulic gradient), which can be expressed as follows:
where d represents the radial distance between a soil unit at a certain depth position in the ground foundation and the vertical drainage board.
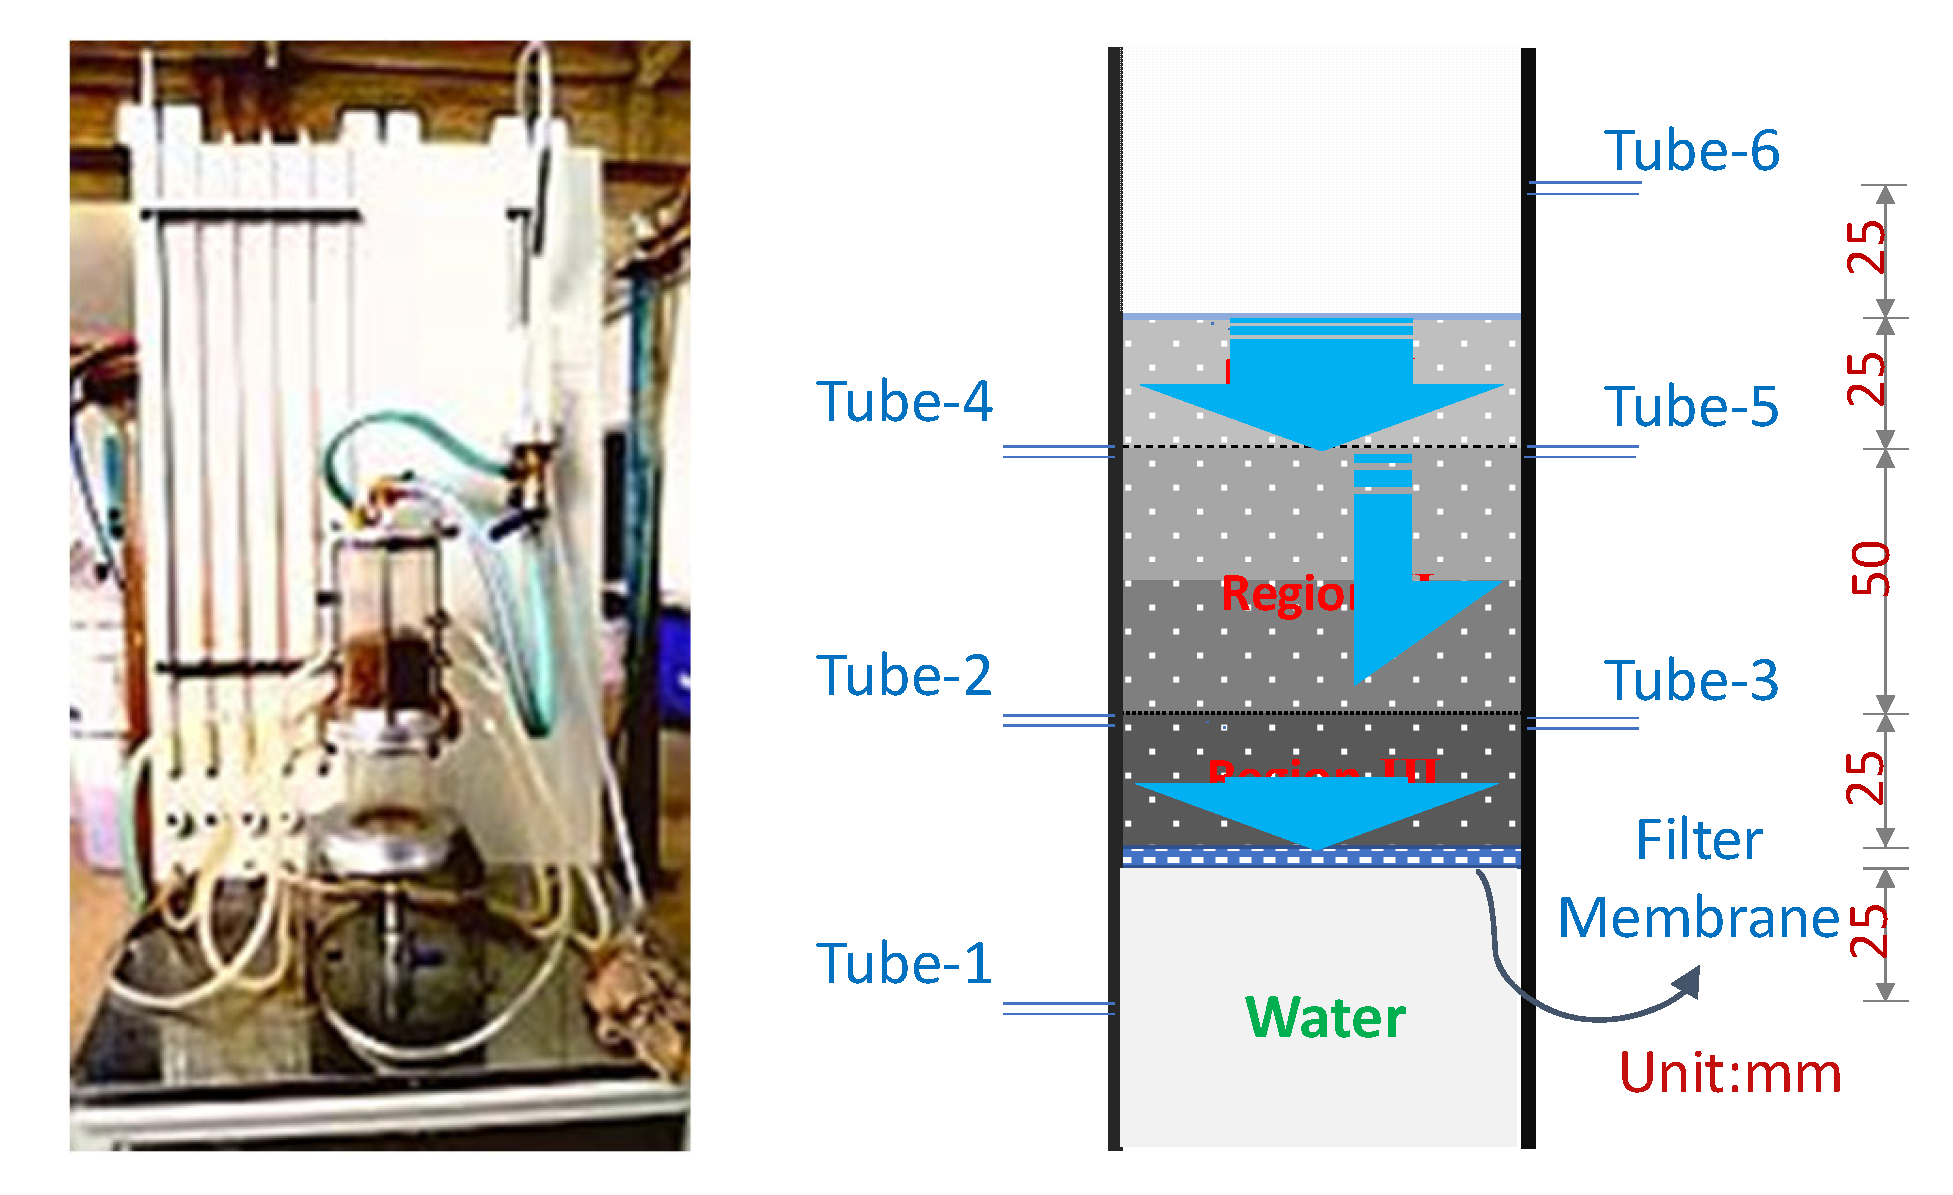
Therefore, a gradient ratio method can be used to investigate the clogging behaviors of four typical geomembranes (XCW, XFW, ZBN, and DBN) used in typical dredged mud slurry, with the filtration and drainage performance of PVD filter membranes under graded vacuum preloading to be simulated. Figure 3 shows the experimental device for the gradient ratio test. This experiment strictly follows the operational steps outlined in the standard [28], with the following key procedures:
- ①
- Loading of soil sample: A sample of dredged mud slurry was air-dried and then ground into loose soils, which were poured into the test cylinder shown in Figure 3 through a funnel and then leveled. During the sample loading process, the inlet of the pressure measuring tube should not be blocked, and the height of the soil sample should be kept at 100 mm.
- ②
- Soil sample saturation: Water is introduced through the drainage outlet pipe, allowing it to slowly enter from the bottom of the sample. The inlet water head should be controlled at lower than 25 mm. Water injection through the inlet pipe is not allowed until the water level is raised to a certain height above the top surface of the soil sample. Then, the entire container should be filled with water.
To simulate graded vacuum loading, four different hydraulic gradient conditions, namely, i = 1.0, i = 2.5, i =5.0, and i = 7.5, were applied in this experiment consecutively to perform the filtration and drainage test continuously until all relevant indicators stabilized. The specific operating method for each hydraulic gradient can be found in the aforementioned specifications.
After the experiment, a mercury intrusion test was conducted on some geomembranes to investigate their pore structure characteristics. Also, an environmental scanning electron microscope was used to perform a microscopic test on some geomembranes to visually assess their clogging characteristics and degrees.
Figure 3.
Gradient ratio test device and soil-membrane system.
2.4.2. Experimental Scheme for Research on Clogging Behaviors of Raw-Material Drainage Boards with Different Bending Patterns
Figure 4 shows the field investigation results for a real vacuum preloading treatment project for a typical soft soil foundation. Also, the results of vacuum preloading consolidation of dredged mud slurry are shown in Figure 4d. From Figure 4d, it can be seen that the drainage board has undergone serious bending deformation, which leads to severe buckling deformation of its core plate grooves. Consequently, the water flow area at the bending section of the drainage board drastically decreased, thus ultimately weakening the consolidation effect of the ground foundation to a maximum extent.
In order to investigate the clogging behaviors of core boards of PVD with different bending patterns, Figure 4 was imported into the graphic processing software, with characteristic parameters (such as bending angles and bending ratios) obtained, which are presented in Figure 5 and Table 3. Then, based on those four bending patterns presented in Figure 5, longitudinal water flow tests were carried out on those four sample types of typical raw-material PVD (CF, CZ, FF, and FZ). Throughout the entire experimental process, a constant lateral pressure of 350 kPa was maintained in the pressure chamber, with the hydraulic gradient maintained at i = 0.5 [27,29]. Those four distinct bending patterns, as illustrated, could be realized through a customized iron frame model, as shown in Figure 6.
3. Test Results and Analysis of Clogging Behaviors in PVD
3.1. Analysis of Clogging Behavior of Soil-Filter Membrane System
Figure 7 shows the time–variation curves of water head losses in region I, region II, and region III + filter membrane in the soil-filter membrane system shown in Figure 4.
Among the soft soil samples of dredged mud slurry, there is a significant aggregation effect of fine soil particles towards geomembranes under the action of hydraulic permeability, with the visual manifestation that there will be greater water head losses in regions closer to the areas of geomembranes, which can be specifically expressed as follows:
Water head losses in the Region I, Region II, and Region III+filter membrane will increase with the hydraulic gradient i correspondingly.
Under the same hydraulic gradient i, water head loss will increase along the direction from Region I to Region II, and then to Region III+filter membrane.
These findings indirectly explained the gradual aggregation of fine soil particles in the dredged mud slurry towards the surrounding areas of the drainage board under the action of radial negative vacuum pressure, which leads to the clogging behaviors of filter membranes of the drainage board.
The water loss degree in the region III+filter membrane can directly reflect the clogging degree of each filtration and drainage structure layer (composed of the filter membrane and the particle structure layer gradually accumulating around it). As shown in the figures, under a hydraulic gradient i of 7.5, the water head loss in each filtration and drainage structural layer will stabilize at:
- ①
- Region III+filter membrane XCW = 53.5 cm
- ②
- Region III+filter membrane XFW = 44.9 cm
- ③
- Region III+filter membrane ZBN = 47.8 cm
- ④
- Region III+filter membrane DBN = 37.25 cm
Therefore, filtration and drainage structure layers can be listed in decreasing order as follows according to their clogging degrees: Region III+filter membrane XCW > Region III+filter membrane ZBN > Region III+filter membrane XFW > Region III+filter membrane DBN.
The clogging degree in the region III+filter membrane (that is, filtration and drainage structure layer) can indirectly reflect the filtration and drainage performance of geomembranes and its important influencing indicators. According to Table 2, filter membranes can be listed in increasing order as follows in terms of their equivalent O95 pore sizes: XCW < XFW < ZBN < DBN, and the size relationships among their permeability coefficients kg can be expressed as follows: XCW ≈ 1/3XFW ≈ 1/4ZBN ≈ 1/5DBN. From the results of the above analysis of clogging conditions, it can be known that equivalent pore sizes of filter membranes are an important indicator affecting their permeability performance and clogging behaviors. However, there were no significant differences in the equivalent pore size O95 and porosity ng between filter membranes XFW and XCW. Nevertheless, the permeability coefficient of the former was approximately three times the coefficient of the latter, with a significantly low clogging level of the former. Therefore, a mercury intrusion test was conducted on parallel samples of filter membranes XFW and XCW, with the test results shown in Figure 8. Also, a further analysis of their pore structure characteristics was performed.
From Figure 8, it can be seen that the differences in the mercury intrusion–extrusion curves between filter membranes XFW and XCW are primarily reflected in the fact that the intrusion and extrusion curves of the former are distinctly separated, while those of the latter basically overlap. This indicates that there are dead pores (non-penetrating pores) or uneven pores with varying sizes in the XCW filter membrane, while fibers in the XFW filter membrane shown in Figure 1 are arranged in a more regular and organized way. Therefore, a regular and organized pore structure can effectively reduce the clogging degree of the filter membrane, and the regularity of the filter membrane’s pore structure is another important indicator influencing its permeability performance and clogging behavior.
Based on the above analysis, in the design of graded vacuum preloading of dredged mud slurry, it is important to study the suitability of filtration and drainage performance of PVD filter membranes based on their equivalent pore sizes and pore structure characteristics.
3.2. Analysis of Clogging Behaviors of Raw-Material Drainage Boards with Different Bending Patterns
The detailed results of the water flow test of raw-material drainage boards with different bending patterns are listed in Table 4, and their detailed water-flow reduction rates under corresponding bending features are listed in Table 5.
The buckling strength of core board grooves is a key factor influencing the water-flow reduction rates of PVD, and the water-flow reduction rates of PVD can be used as a comprehensive indicator reflecting the clogging behaviors of core boards. This was primarily manifested in the following order of test samples in terms of the buckling strength of their core board grooves: CF < CZ < FF ≈ FZ. Under a bending rate of 22.5%, the water-flow reduction rate of sample CF reached around 30%, with relatively significant clogging behavior of its core board. However, under a bending rate of 60%, the water-flow reduction rates of samples CZ, FF, and FZ did not exceed 15%, with relatively insignificant clogging degrees of their core boards.
Due to the high sensitivity of dredged mud slurry during the drainage consolidation process, the influences of well resistance should be taken into account in the design of the average radial stress consolidation degree of such ground foundation. The inverse relationship between the well resistance G of the vertical drainage body and its longitudinal water flow qw can be expressed as follows [30]:
where qh is the amount of water infiltrating into the plastic drainage board in the ground foundation per unit time under unit hydraulic gradient (unit: cm3/s); Fs is the safety coefficient; dw is the equivalent conversion diameter of the plastic drainage board (unit: cm); and L is the setting depth of the plastic drainage board (unit: cm).
Therefore, the increasing degree of well resistance of the drainage board can be used as another comprehensive indicator reflecting its core board’s clogging behavior. Based on Table 4, detailed increases in well resistance of test samples with corresponding bending features were obtained and are listed in Table 6. From Table 6, it can be seen that under a bending rate of 22.5%, the well resistance of sample CF increased by about 40%, with relatively significant clogging behavior of its core board. However, under a bending rate of 60%, increases in the well resistance of samples CZ, FF, and FZ did not exceed 15%, with relatively insignificant clogging degrees of their core boards.
The bending angle and bending rate of the core board can be used as two specific technical indicators for judging its clogging behavior. With increases in the core board’s bending angle and bending rate, the corresponding water-flow reduction rate and increasing range of well resistance of the drainage board will increase, with an increasingly serious clogging degree of the core board. As shown in Figure 4d, there were at least five bending angles below 44° in the drainage board in the ground foundation, with an average bending rate of about 60%. According to Table 5, it can be calculated that the reduction rate of longitudinal water flow of the raw-material drainage board CF can reach 91%, with its corresponding water flow reaching a value of 13.6 cm³/s. Therefore, even the longitudinal water flow requirement for type A boards (≥15 cm³/s) [27], as specified in Table A.0.1 in the regulation [27], can not be satisfied.
4. Evaluation Criteria for Clogging Behaviors of PVD
4.1. Evaluation Criterion for Behaviors of PVD Filter Membranes
With low tensile strength, filter membranes of PVD are easy to embed in the core board grooves of PVD, thus affecting the drainage performance of PVD. From Table 2, it can be seen that only the regular hot-rolled nonwoven fabric XCW and the new anti-blocking hot-rolled nonwoven fabric XFW can satisfy the requirement [29]. Therefore, both the woven nylon mesh DBN and the woven nylon mesh ZBN are not suitable to be used as materials for filter membranes of PVD deeply inserted into soil masses of the ground foundation.
Based on Figure 7a,b, the following formula can be used to calculate the time-varying curves of gradient ratios GR of filter membranes XCW and XFW under different hydraulic gradients, as shown in Figure 9.
where Ha-b, La-b, and δ are respectively the water head difference between tube-a and tube-b (as depicted in Figure 3), the seepage path length between tube-a and tube-b, and the thickness of the geotextile sample.
From Figure 9, it can be seen that the gradient ratios for two tested filter membranes, XCW and XFW, used in the typical dredged mud slurry eventually stabilized at 7.93 and 3.39, respectively. This finding verified the above-mentioned analysis results of the clogging behavior of the soil-filter membrane system. That is, compared with the filtration and drainage structure layer of “Region III+filter membrane XCW”, the filtration and drainage structure layer of “Region III+filter membrane XFW” presented a significantly low degree of clogging.
The anti-blocking effects of the new anti-blocking filter membrane XFW have been successfully verified in a couple of vacuum preloading treatment projects for typical dredged mud slurry [31]. Therefore, the condition of GR > 4.0 can be used as the criterion for evaluating the clogging of PVD filter membranes used in process for dredged mud slurry.
The above analysis regarding the GR demonstrated that the filter membrane XFW is the most suitable filter membrane for the PVD when the dredging mud is reinforced by vacuum preloading; the relevant technical indicators are detailed in Table 2.
4.2. Evaluation Criteria for Core-Board Clogging of PVD
During the vacuum preloading drainage consolidation process for dredged mud slurry, severe bending deformations in various places along the depth direction of the drainage board will occur, as shown in Figure 4d. This leads to severe clogging in the grooves of the core board and a drastic reduction in the longitudinal water flow performance of the drainage board. However, in current relevant regulations [14,15,16,18] and engineering practices, whether the core-board longitudinal water flow rates of PVD without bending can satisfy the requirements of regulations is used as the control criterion for core-board drainage performance of PVD, which is not entirely scientific.
The above-mentioned analysis results based on Table 5 and Table 6 show that the condition of core board bending rate > 60% or core board bending angle < 45° can be used as the criterion for evaluating the clogging of core boards of PVD used in the processing of dredged mud slurry. Or alternatively, through further calculation, the condition of water-flow reduction rate of the bending drainage board > 90% or the increasing range of its well resistance > 9 can be used as an evaluation criterion, with the corresponding relationship between the well resistance G of the vertical drainage body and its longitudinal water flow modified as follows:
where represents the water-flow reduction rate of the drainage board, with its value to be identified with reference to the test methods illustrated in Figure 5 and Figure 6 in this paper. This approach can provide support for the study of relevant consolidation theories.
In summary, it is proposed to apply the following criteria in evaluating the clogging of PVD used in the processing of dredged mud slurry.
- ①
- Clogging evaluation criterion for filter membranes of PVD: Gradient ratio GR > 4.0.
- ②
- Clogging evaluation criterion 1 for core boards of PVD: Core board bending rate > 60% and bending angle < 45°.
- ③
- Clogging evaluation criterion 2 for core boards of PVD: Water flow reduction rate of bending drainage board > 90% or increased range of its well resistance > 9.
Also, these criteria are incorporated into the control indicators of drainage board performance.
5. Summary
For dredged mud slurry, the following conclusions have been drawn in this study.
- (1)
- The gradient ratio method can be used to effectively simulate the clogging behaviors of PVD filter membranes under graded vacuum preloading. Also, in the design of graded vacuum preloading, it is important to study the suitability of filtration and drainage performance of PVD filter membranes based on their equivalent pore sizes and pore structure characteristics.
- (2)
- The buckling strength of core board grooves is a key factor influencing the water-flow reduction rates of core boards. Meanwhile, the water-flow reduction rates and increasing ranges of well resistance of core boards can be used as comprehensive indicators reflecting their clogging behaviors. Furthermore, the bending angles and bending rates of core boards can be used as specific technical indicators for judging their clogging behaviors.
- (3)
- It is proposed to apply the following criteria to evaluate the clogging behaviors of PVD.
- ①
- Clogging evaluation criterion for filter membranes of PVD: Gradient ratio GR > 4.0.
- ②
- Clogging evaluation criterion 1 for core boards of PVD: Core board bending rate > 60% and bending angle < 45°.
- ③
- Clogging evaluation criterion 2 for core boards of PVD: Water flow reduction rate of bending drainage board > 90%; or increased range of its well resistance > 9.
These criteria are incorporated into the control indicators of PVD performance.
The research results in this paper can provide reference to the fields concerning ore, coal, building materials, chemical raw materials, industrial waste, domestic waste, and other fields related to filtration and separation. Also, as an effective supplement to the research results in this paper, future studies using DEM or other particle-based methods will be carried out to reveal the clogging behavior of PVD during the vacuum preloading consolidation in multiple dimensions.
Author Contributions
Conceptualization, S.B.; methodology, S.B.; formal analysis, S.Z.; investigation, S.B. and J.C.; resources, Z.D. and R.Z.; data curation, R.Z.; writing—original draft preparation, S.B.; writing—review and editing, S.B. and L.G.; visualization, S.B. and L.G.; funding acquisition, S.B. and L.G. All authors have read and agreed to the published version of the manuscript.
Funding
This research was funded by the National Natural Science Foundation of China (Grant No. 12302502), Guangdong University Innovation Team Project (Grant No. 2022KCXTD024), Guangdong Province key construction discipline research ability enhancement project (Grant No. 2022ZDJS091), and Guangdong Basic and Applied Basic Research Foundation (Grant No. 2022A1515110804 and No. 2023A1515012630).
Data Availability Statement
Data are contained within the article.
Conflicts of Interest
Author Zhiliang Dong was employed by the company CCCC Fourth Harbor Engineering Institute Co., Ltd. and Author Ruibo Zhou was employed by the company CCCC FHEC Harbor Engineering Design Co., Ltd. The remaining authors declare that the research was conducted in the absence of any commercial or financial relationships that could be construed as a potential conflict of interest.
References
- Deng, Y.; Liu, L.; Cui, Y.-J.; Feng, Q.; Chen, X.; He, N. Colloid effect on clogging mechanism of hydraulic reclamation mud improved by vacuum preloading. Can. Geotech. J. 2019, 56, 611–620. [Google Scholar] [CrossRef]
- Feng, S.; Lei, H.; Wang, L.; Hao, Q. The reinforcement analysis of soft ground treated by thermal consolidation vacuum preloading. Transp. Geotech. 2021, 31, 100672. [Google Scholar] [CrossRef]
- Zhang, X.; Lu, Y.; Yao, J.; Wu, Y.; Tran, Q.C.; Vu, Q.V. Insight into conditioning landfill sludge with ferric chloride and a Fenton reagent: Effects on the consolidation properties and advanced dewatering. Chemosphere 2020, 252, 126528. [Google Scholar] [CrossRef] [PubMed]
- Xu, Y.; Wu, Y.; Zhang, X.; Chen, G.; Zhang, Y.; Ji, J. Anti-clogging mechanism of freeze-thaw combined with step vacuum preloading in treating landfill sludge. Environ. Res. 2023, 218, 115059. [Google Scholar] [CrossRef]
- Kjellman, W. Consolidation of clay soil by means of atmospheric pressure. In Proceedings of the Soil Stabilization Conference, Boston, MA, USA, 18–20 June 1952. [Google Scholar]
- Shen, S.-L.; Chai, J.-C.; Hong, Z.-S.; Cai, F.-X. Analysis of field performance of embankments on soft clay deposit with and without PVD-improvement. Geotext. Geomembr. 2005, 23, 463–485. [Google Scholar] [CrossRef]
- Saowapakpiboon, J.; Bergado, D.; Youwai, S.; Chai, J.; Wanthong, P.; Voottipruex, P. Measured and predicted performance of prefabricated vertical drains (PVDs) with and without vacuum preloading. Geotext. Geomembr. 2010, 28, 1–11. [Google Scholar] [CrossRef]
- Krishnapriya, P.; Sandeep, M.; Antony, J. Efficiency of Vacuum Preloading on Consolidation Behaviour of Cochin Marine Clay. Procedia Technol. 2016, 24, 256–262. [Google Scholar] [CrossRef]
- López-Acosta, N.; Espinosa-Santiago, A.; Pineda-Núñez, V.; Ossa, A.; Mendoza, M.; Ovando-Shelley, E.; Botero, E. Performance of a test embankment on very soft clayey soil improved with drain-to-drain vacuum preloading technology. Geotext. Geomembr. 2019, 47, 618–631. [Google Scholar] [CrossRef]
- Lu, M.; Sun, J. Analytical model for consolidation of soft ground improved by PVDs with air-boosted system. Comput. Geotech. 2022, 151, 104968. [Google Scholar] [CrossRef]
- Bao, S.; Lou, Y.; Dong, Z.; Mo, H.; Chen, P.; Zhou, R. Causes and countermeasures for vacuum consolidation failure of newly-dredged mud foundation. Chin. J. Geotech. Eng. 2014, 36, 1350–1359. (In Chinese) [Google Scholar]
- Wang, P.; Wu, J.; Ge, X.; Chen, F.; Yang, X. Non-uniform Consolidation of Soil and Influence of Corresponding Clogging Effect During Vacuum Preloading. Int. J. Geosynth. Ground Eng. 2022, 8, 58. [Google Scholar] [CrossRef]
- Le, C.; Xu, C.; Wu, X.F.; Jin, Y.W. Experimental research on clogging characteristic of two types of PVD filters. Rock Soil Mech. 2014, 35, 2529–2533. (In Chinese) [Google Scholar]
- Lei, H.; Lu, H.; Liu, J.; Zheng, G. Experimental study of the clogging of dredger fills under vacuum preloading. Int. J. Geomech. 2017, 17, 04017117. [Google Scholar] [CrossRef]
- Cai, Y.; Qiao, H.; Wang, J.; Geng, X.; Wang, P.; Cai, Y. Experimental tests on effect of deformed prefabricated vertical drains in dredged soil on consolidation via vacuum preloading. Eng. Geol. 2017, 222, 10–19. [Google Scholar] [CrossRef]
- Xu, B.H.; He, N.; Jiang, Y.B.; Zhou, Y.Z.; Zhan, X.J. Experimental Study of the Clogging of Dredger Fills under Vacuum Preloading. Geotext. Geomembr. 2020, 48, 614–624. [Google Scholar] [CrossRef]
- Shi, L.; Wang, Q.-Q.; Xu, S.-L.; Pan, X.-D.; Sun, H.-L.; Cai, Y.-Q. Numerical study on clogging of prefabricated vertical drain in slurry under vacuum loading. Granul. Matter 2018, 20, 1–14. [Google Scholar] [CrossRef]
- Shi, L.; Yin, X.; Ye, X.; He, Z.; Sun, H.; Cai, Y. Radial Filtration Model of Clogging Column for Prefabricated Vertical Drain Treatment of Slurry. J. Geotech. Geoenvironmental Eng. 2023, 149, 04022118. [Google Scholar] [CrossRef]
- Yang, P.; Tang, Y.-Q.; Wang, J.-X.; Yang, Y.; An, X. Test on consolidation of dredger fill by cube grid of plastic drain board preinstalled. Eng. Geol. 2012, 127, 81–85. [Google Scholar] [CrossRef]
- Deng, D.; Hong, Z.; Liu, C.; Ding, J.; Hong, P. Large-scale model tests on dewater of dredged clay by use of ventilating vacuum method. Yantu Gongcheng Xuebao Chin. J. Geotech. Eng. 2009, 31, 250–253. (In Chinese) [Google Scholar]
- Wang, J.; Ma, J.; Liu, F.; Mi, W.; Cai, Y.; Fu, H.; Wang, P. Experimental study on the improvement of marine clay slurry by electroosmosis-vacuum preloading. Geotext. Geomembr. 2016, 44, 615–622. [Google Scholar] [CrossRef]
- Wang, J.; Ni, J.; Cai, Y.; Fu, H.; Wang, P. Combination of vacuum preloading and lime treatment for improvement of dredged fill. Eng. Geol. 2017, 227, 149–158. [Google Scholar] [CrossRef]
- Hu, X.; Zhang, W.; Fu, H.; Wang, J.; Ni, J. Clogging effect of prefabricated horizontal drains in dredged soil by air booster vacuum consolidation. Geotext. Geomembr. 2021, 49, 1529–1538. [Google Scholar] [CrossRef]
- Peng, W.; Gu, B.; Yang, H.; Yang, X.; Yu, Z. Analysis method for consolidation of soil under vacuum preloading assisted by air booster. Mar. Georesources Geotechnol. 2022, 40, 1397–1401. [Google Scholar] [CrossRef]
- Wang, J.; Fu, H.; Zhang, W.; Ni, J.; Li, X.; Cai, Y. Effect of pressurization frequency and duration on the consolidation of a dredged soil using air booster vacuum preloading combined with prefabricated horizontal drains. Geotext. Geomembr. 2023, 51, 209–218. [Google Scholar] [CrossRef]
- Bao, S.; Dong, Z.; Mo, H.; Wang, D. Laboratory research on new improvement technology of newly hydraulic reclamation mud with high clay content II. Zhejiang da xue xue bao. Gong Xue Ban 2015, 36, 61–67. (In Chinese) [Google Scholar]
- ASTM D6917-16; Standard Guide for Selection of Test Methods for Prefabricated Vertical Drains (PVD). ASTM: West Conshohocken, PA, USA, 2022.
- ASTM D5101-12; Standard Test Method for Measuring the Filtration Compatibility of Soil-Geotextile Systems. ASTM: West Conshohocken, PA, USA, 2023.
- ASTM D6918-09; Standard Test Method for Testing Vertical Strip Drains in the Crimped Condition. ASTM: West Conshohocken, PA, USA, 2022.
- Fannin, R.J.; Vaid, Y.P.; Shi, Y. A critical evaluation of the gradient ratio test. Geotech. Test. J. 1994, 17, 35–42. [Google Scholar]
- Cai, Y.Q. Consolidation mechanism of vacuum preloading for dredged slurry and anti-clogging method for drains. Chin. J. Geotech. Eng. 2021, 43, 201–225. (In Chinese) [Google Scholar]
Figure 1.
Microscopic test results for four types of typical geomembranes (under a magnification of 100). (a) DBN; (b) ZBN; (c) XCW; (d) XFW.
Figure 1.
Microscopic test results for four types of typical geomembranes (under a magnification of 100). (a) DBN; (b) ZBN; (c) XCW; (d) XFW.
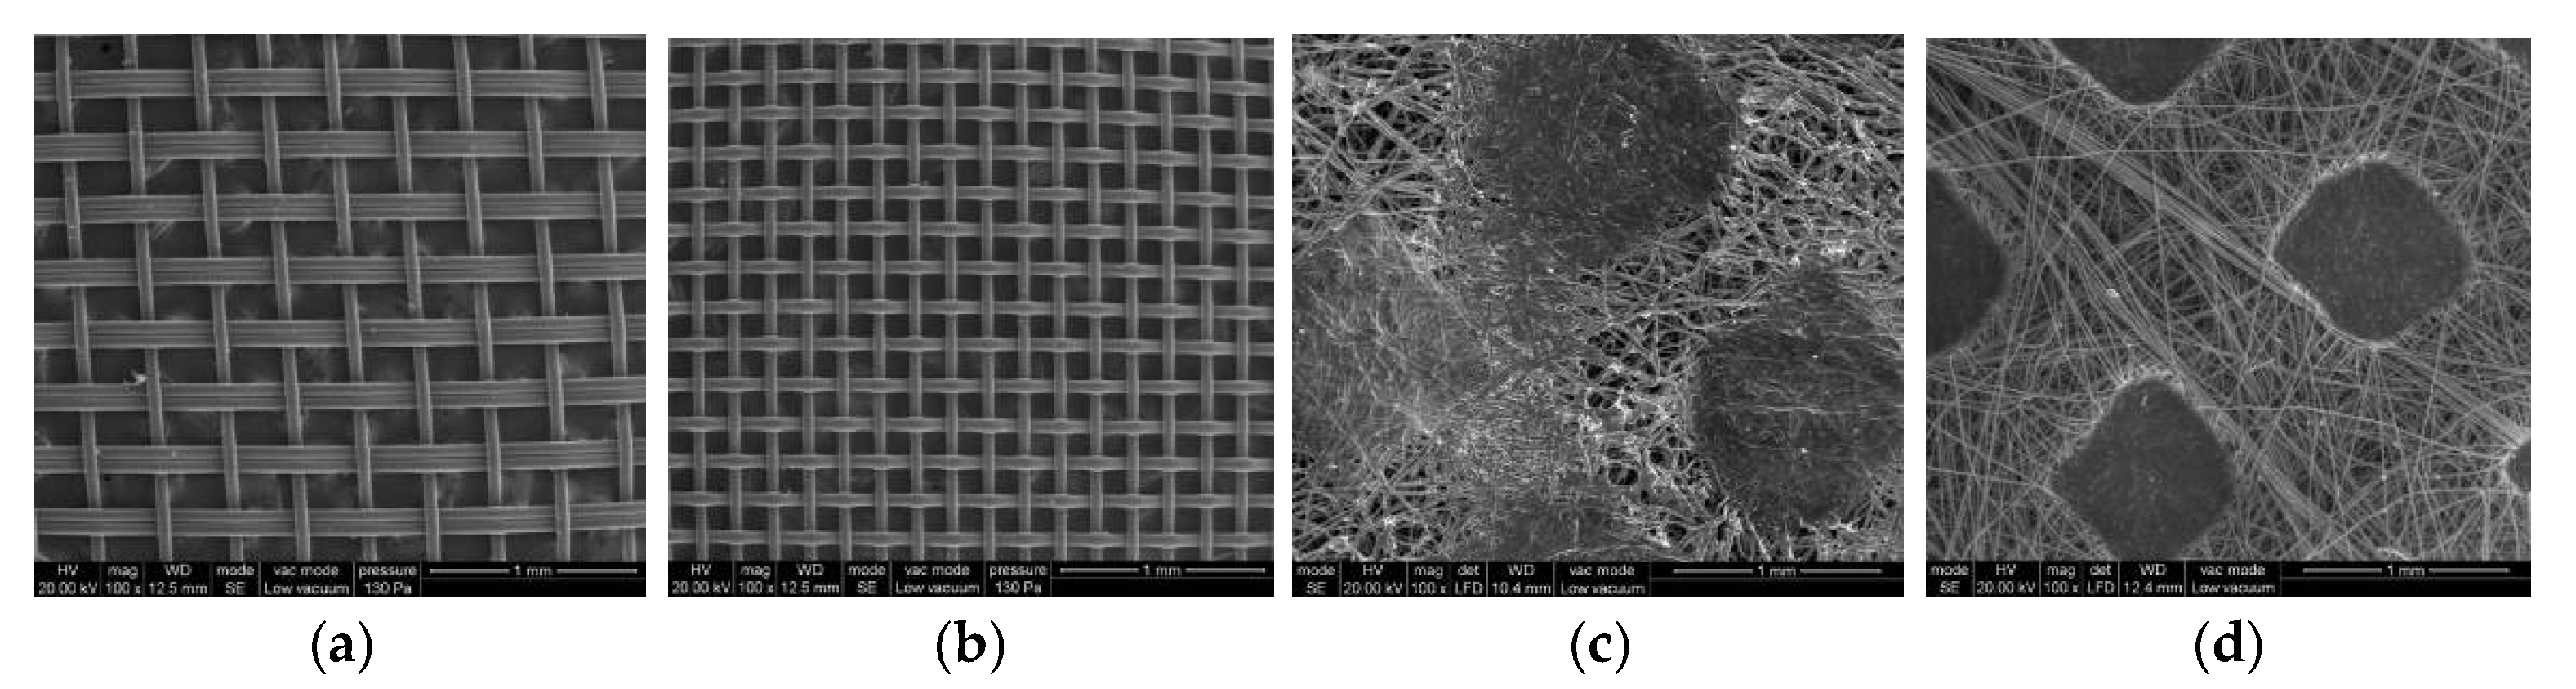
Figure 2.
Test results for buckling strain of four core boards.
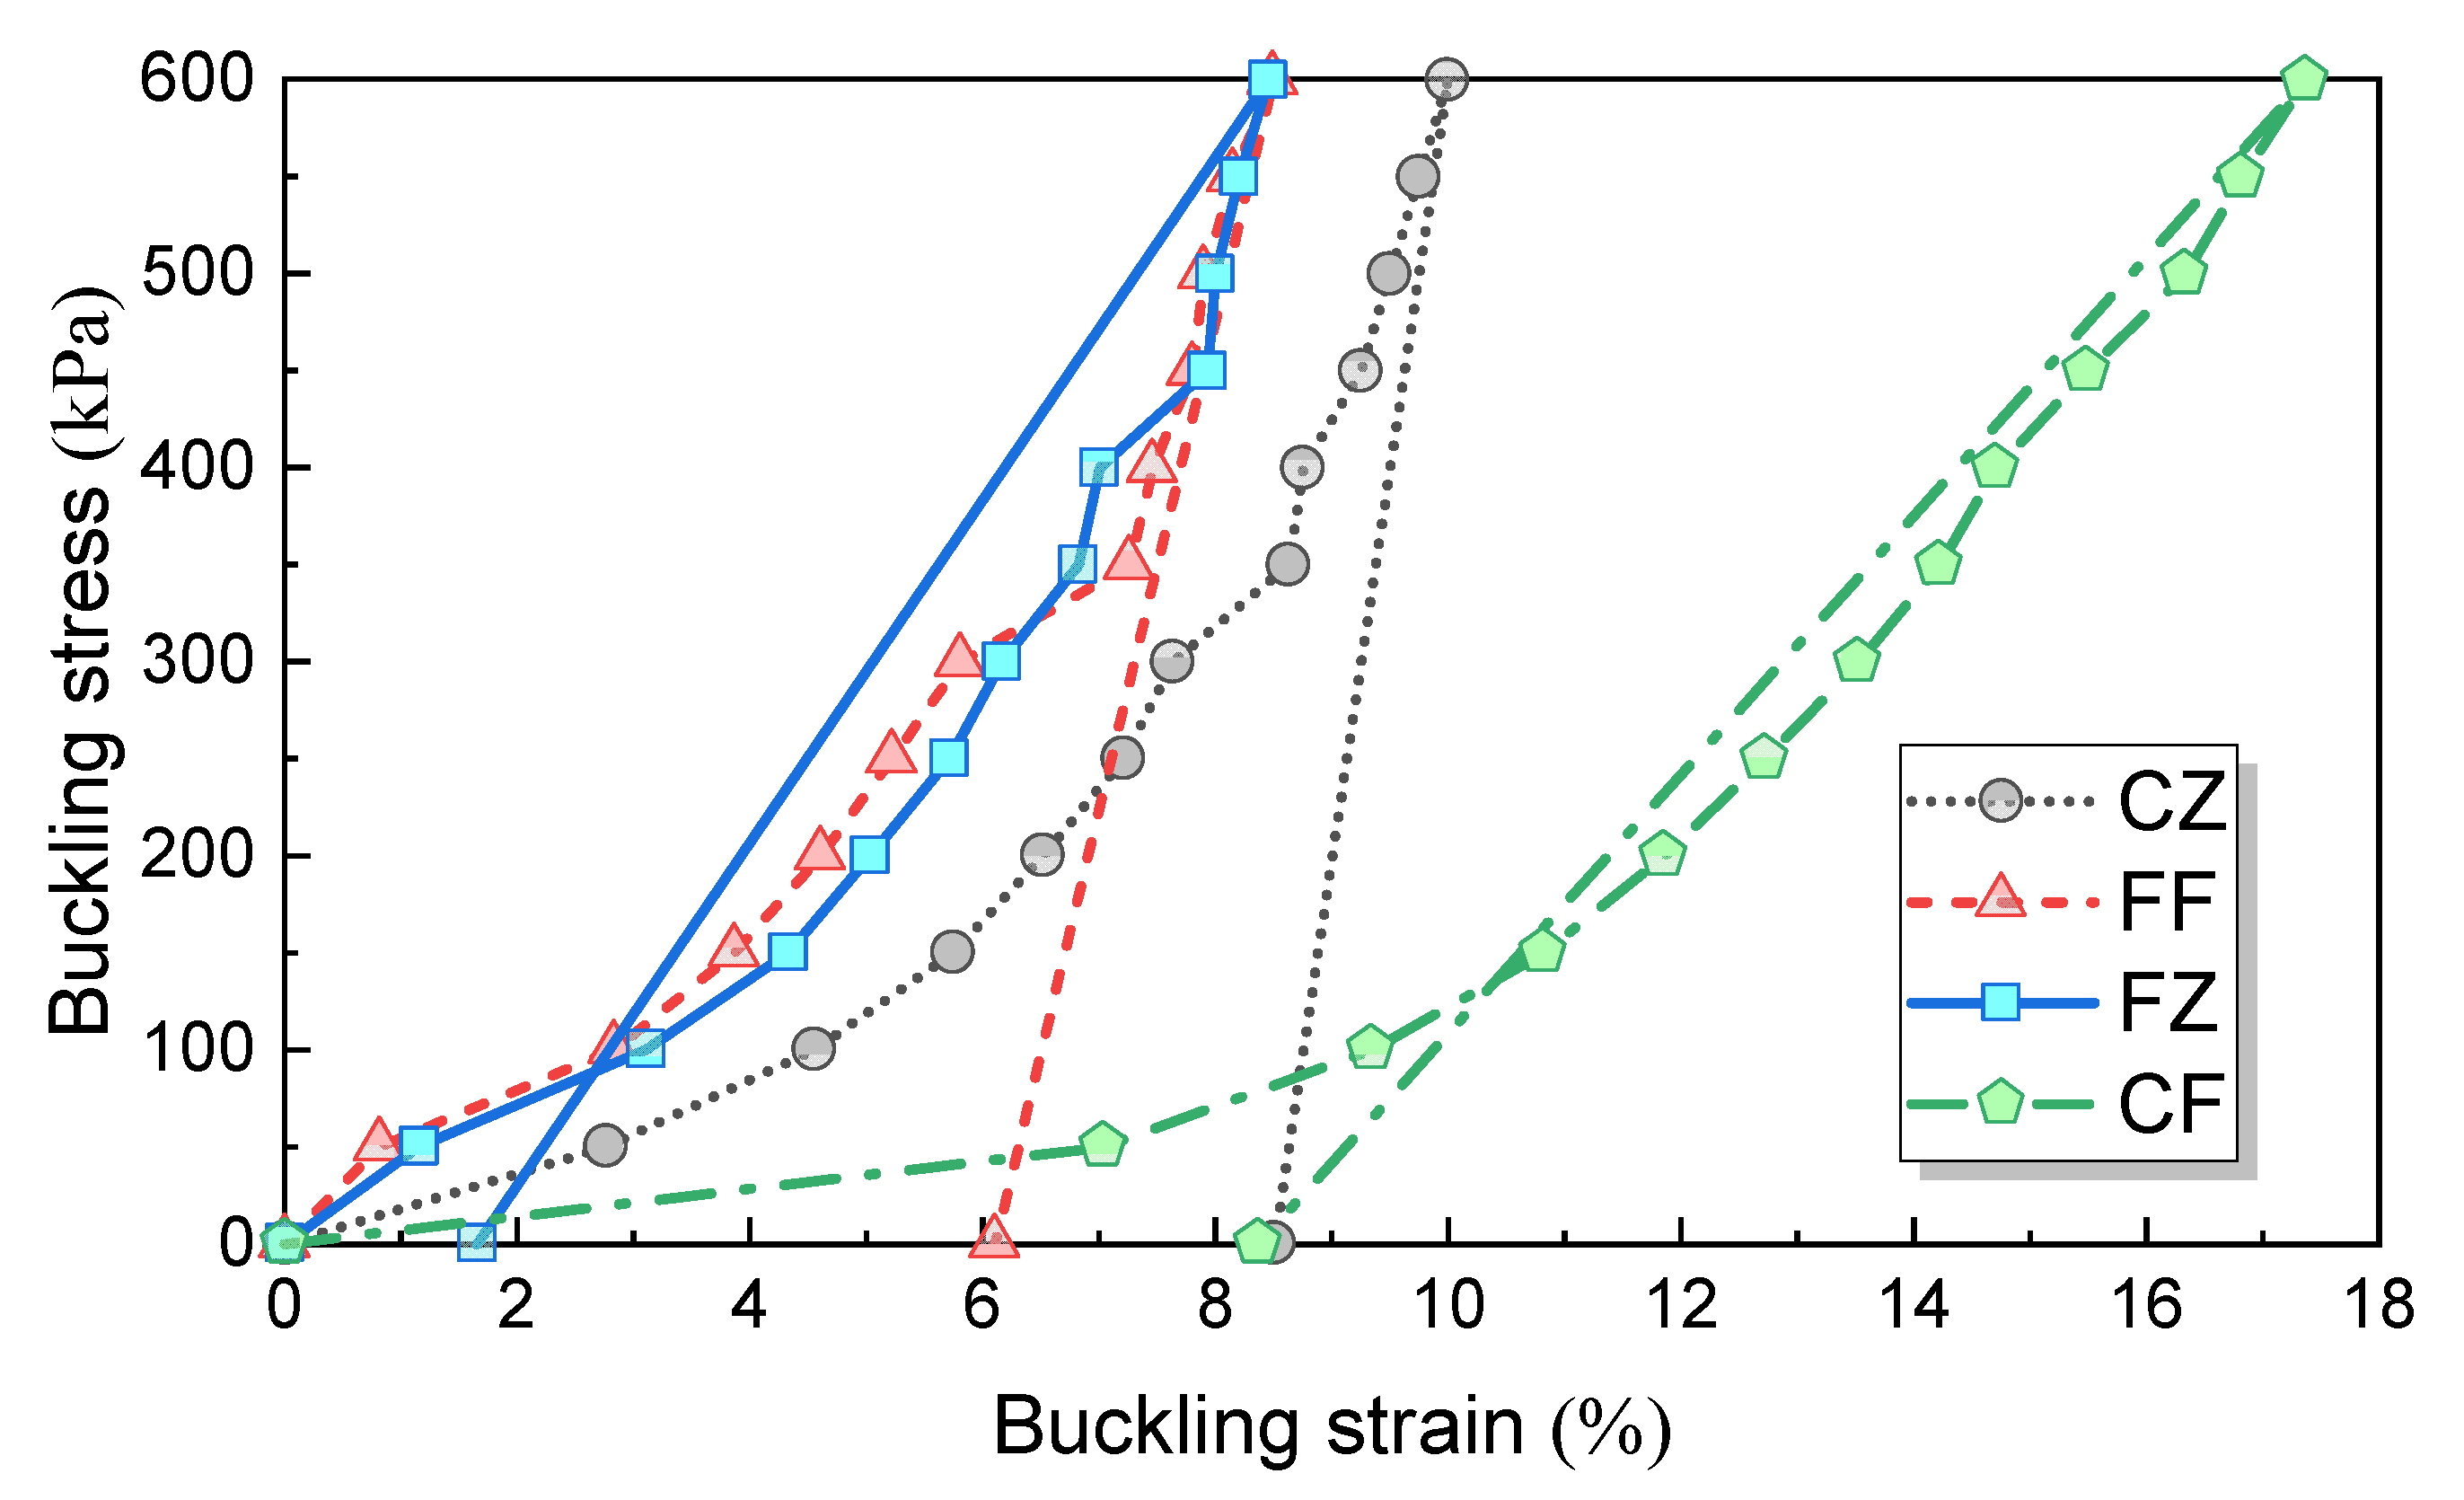
Figure 4.
Different bending patterns of drainage board during vacuum preloading in a typical project. (a) One bend; (b) two bends or three bends; (c) three bends or multiple bends; (d) multiple bends or inverted folding.
Figure 4.
Different bending patterns of drainage board during vacuum preloading in a typical project. (a) One bend; (b) two bends or three bends; (c) three bends or multiple bends; (d) multiple bends or inverted folding.
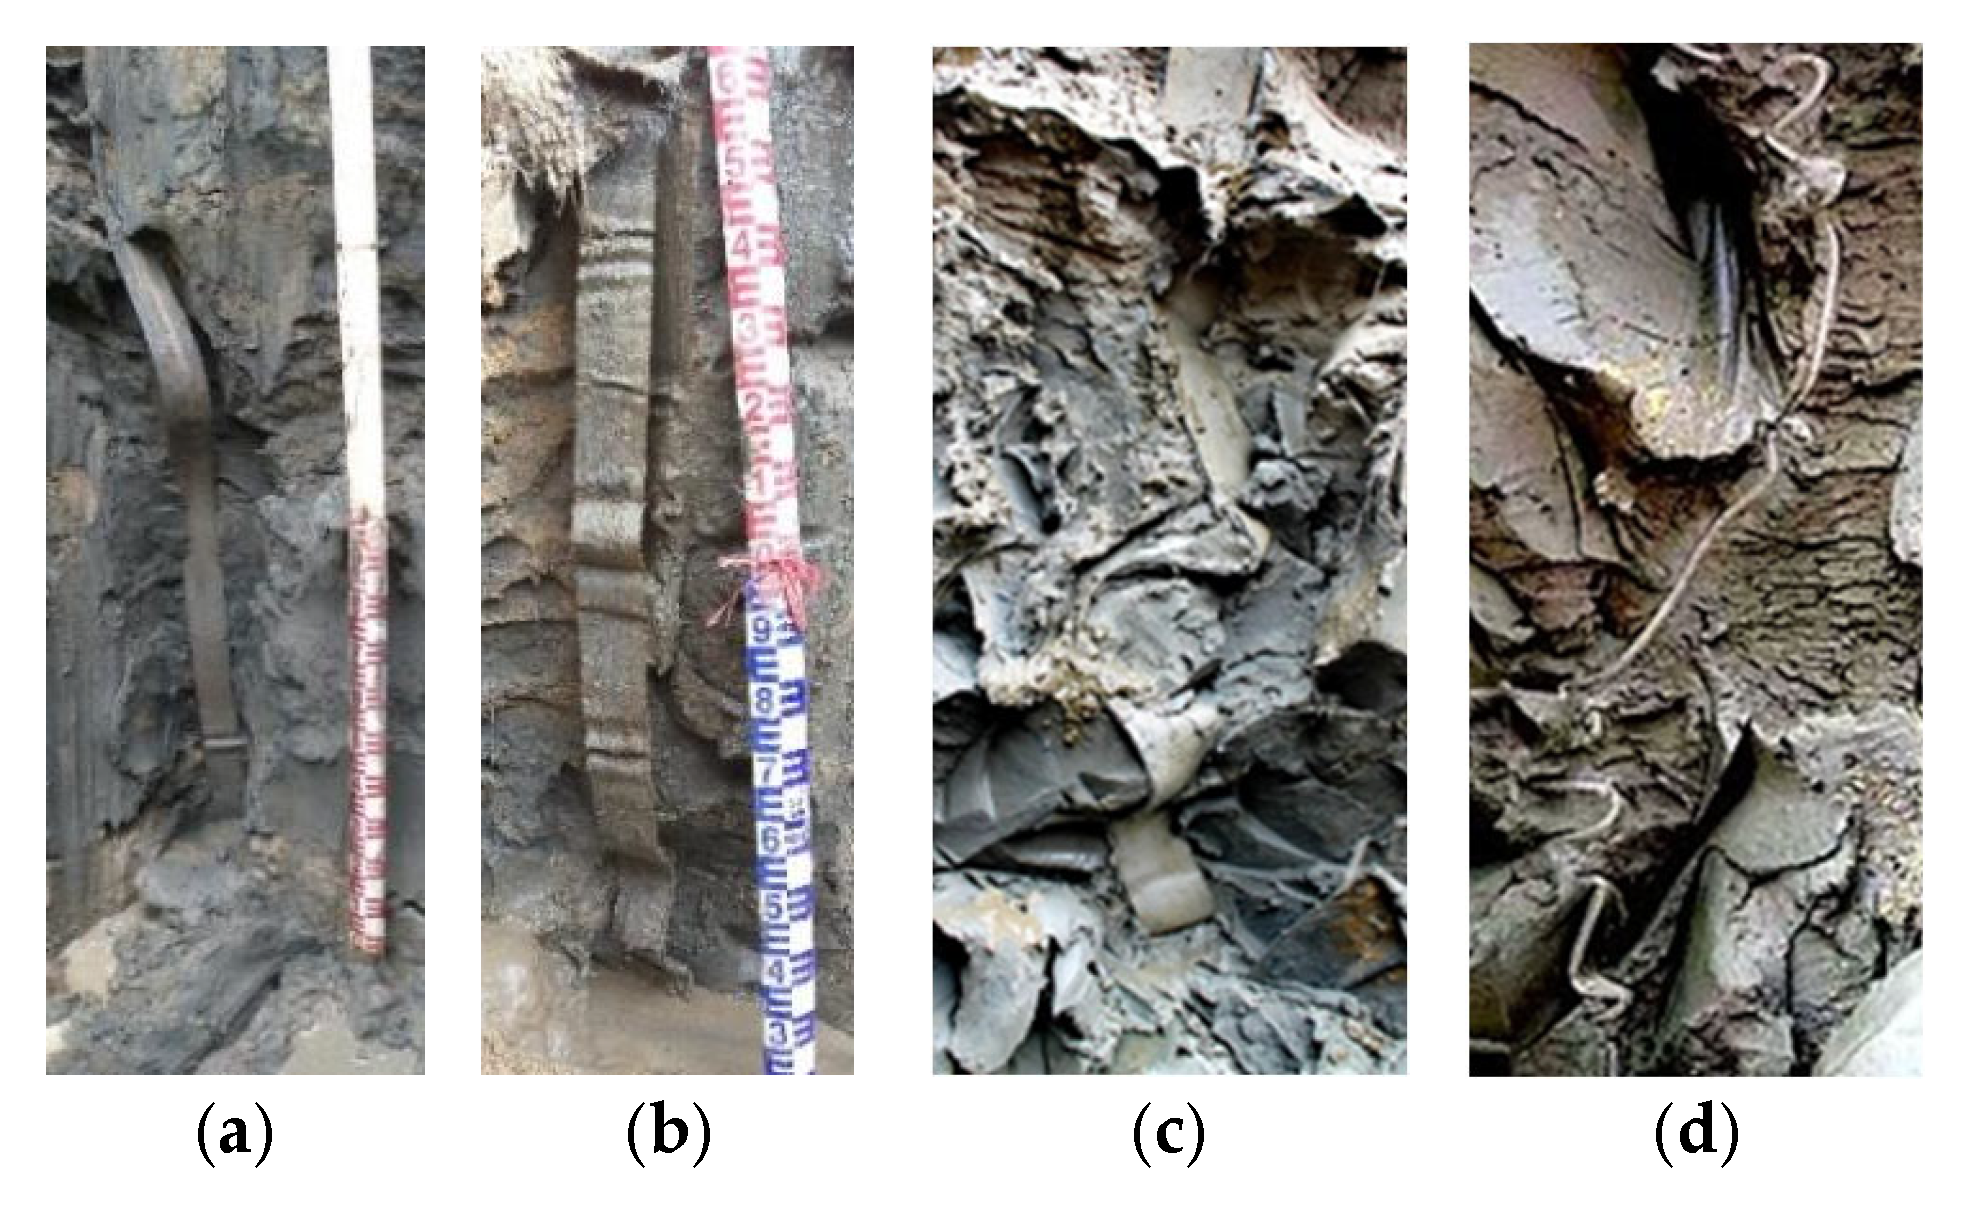
Figure 5.
Typical bending patterns.
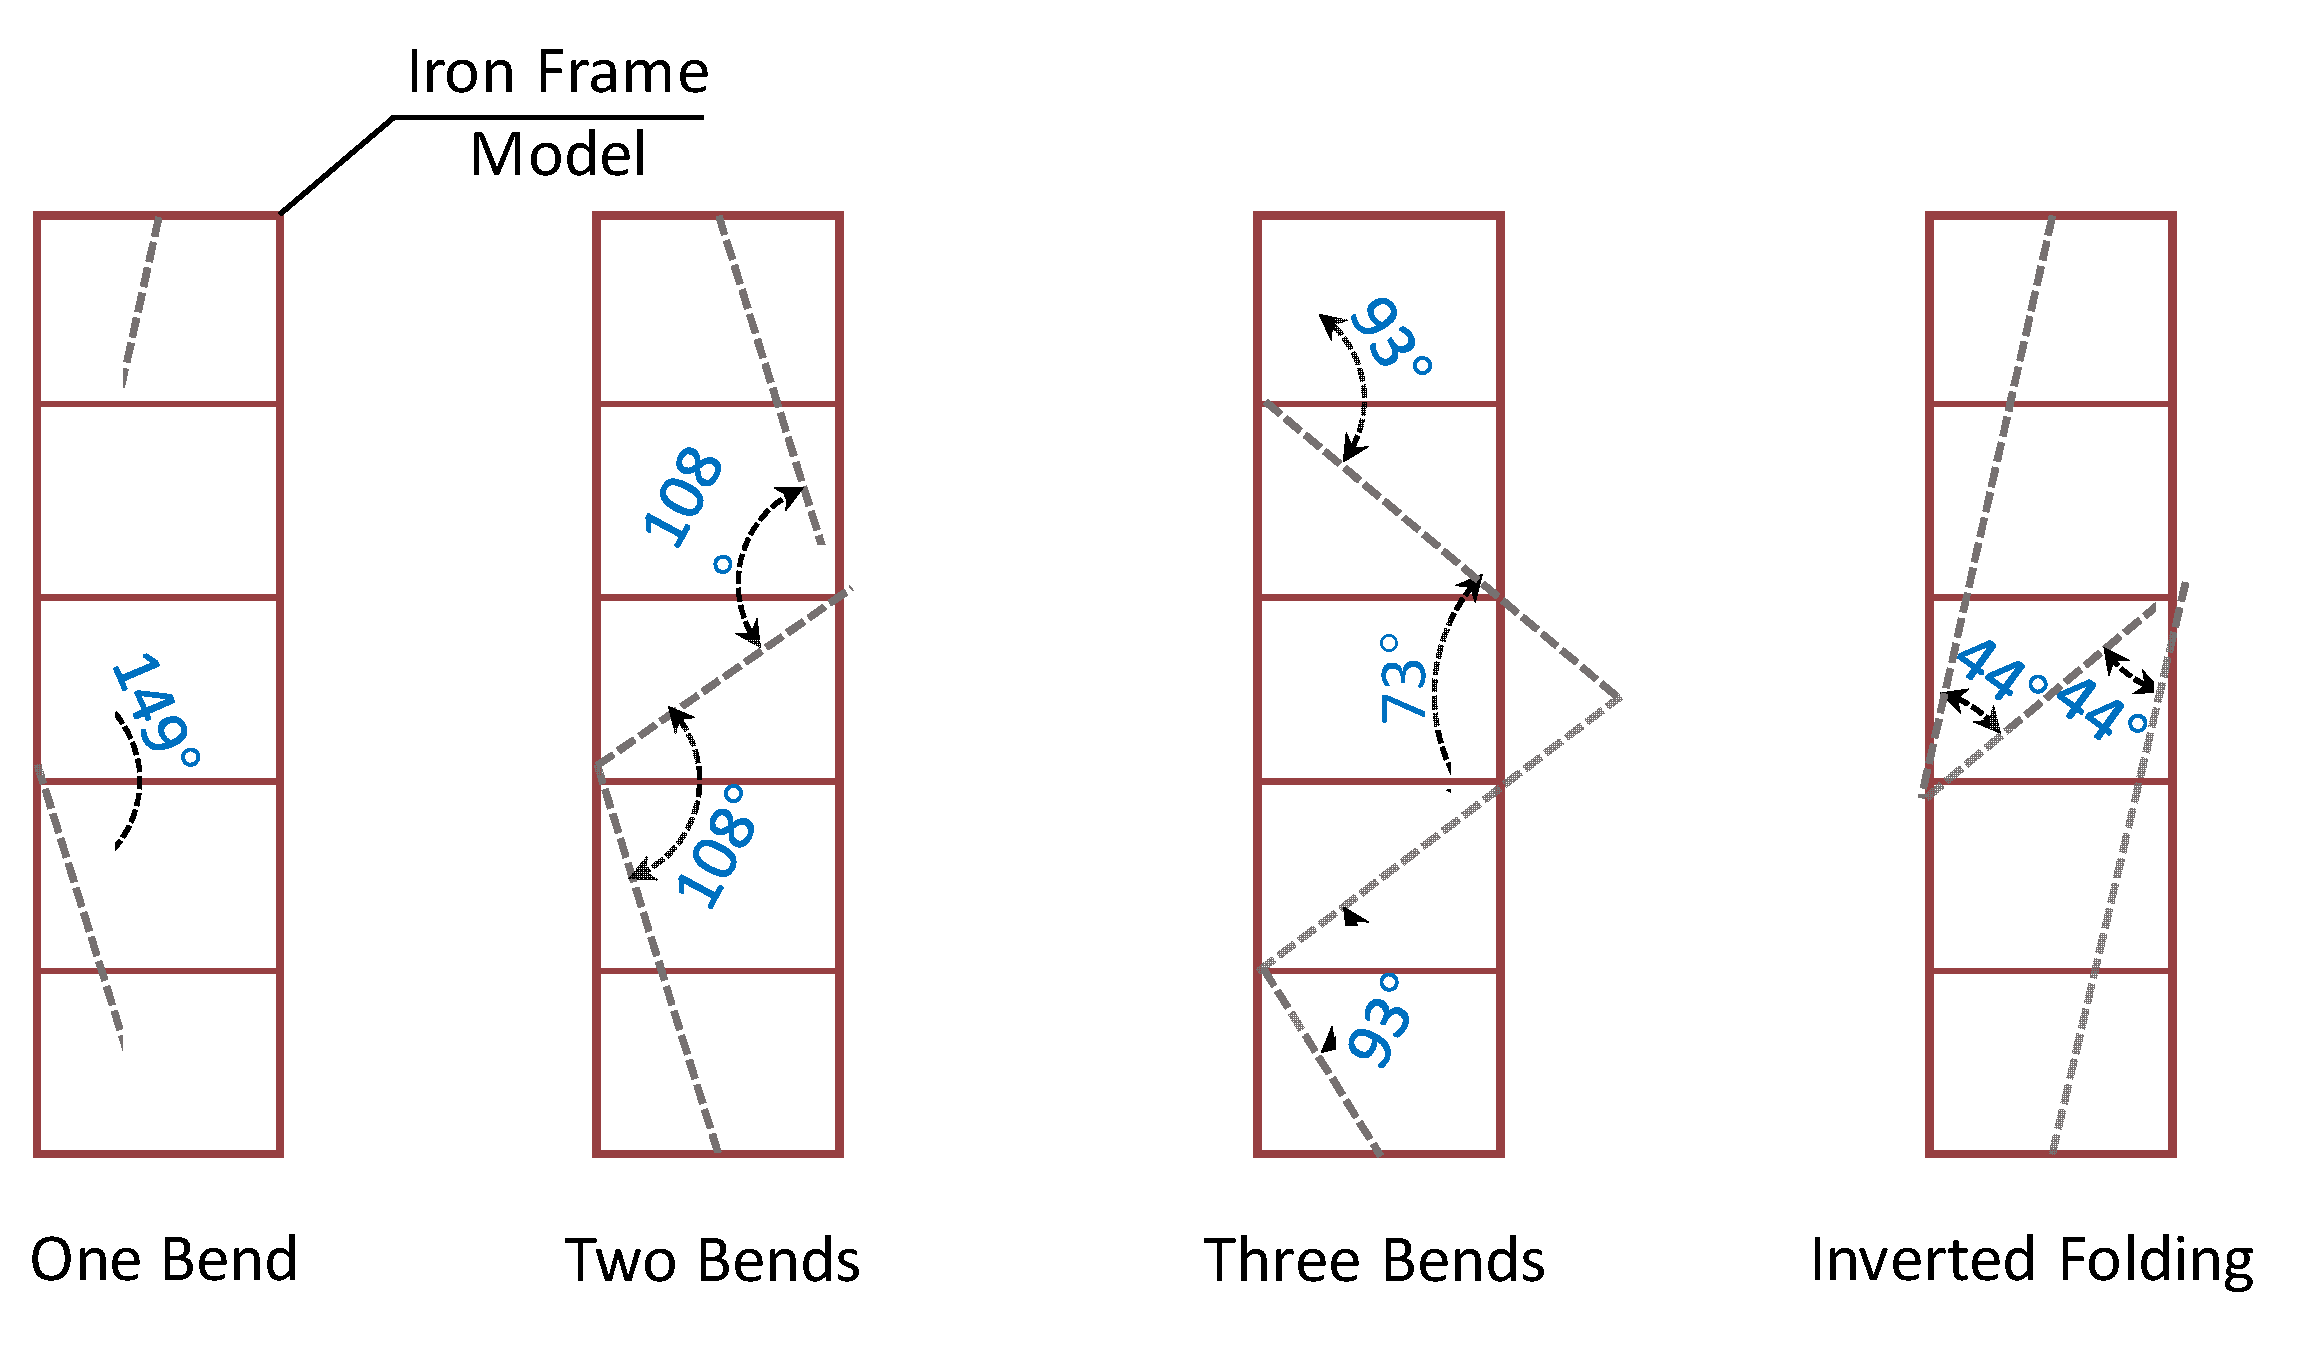
Figure 6.
Water flow test model with typical bending patterns.
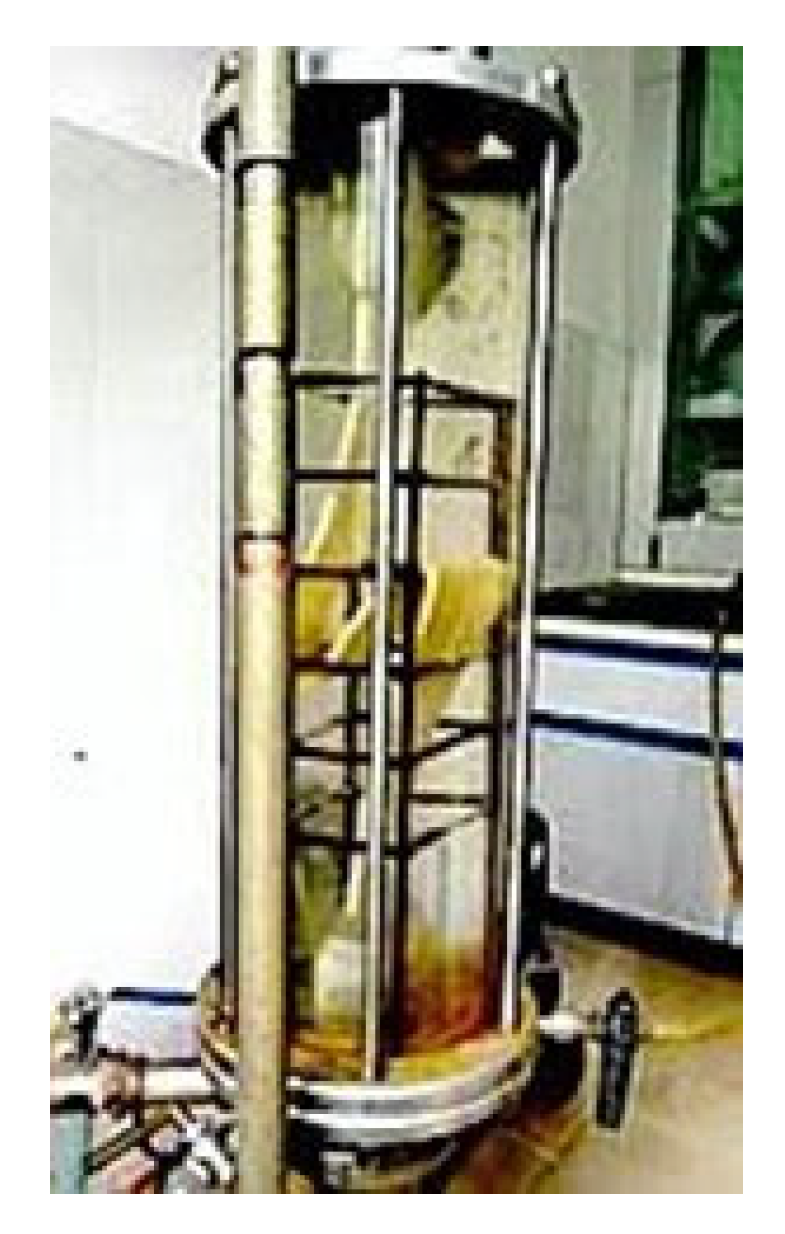
Figure 7.
Variation condition of water head loss in each region of the soil-filter membrane system. (a) XCW; (b) XFW; (c) ZBN; (d) DBN.
Figure 7.
Variation condition of water head loss in each region of the soil-filter membrane system. (a) XCW; (b) XFW; (c) ZBN; (d) DBN.
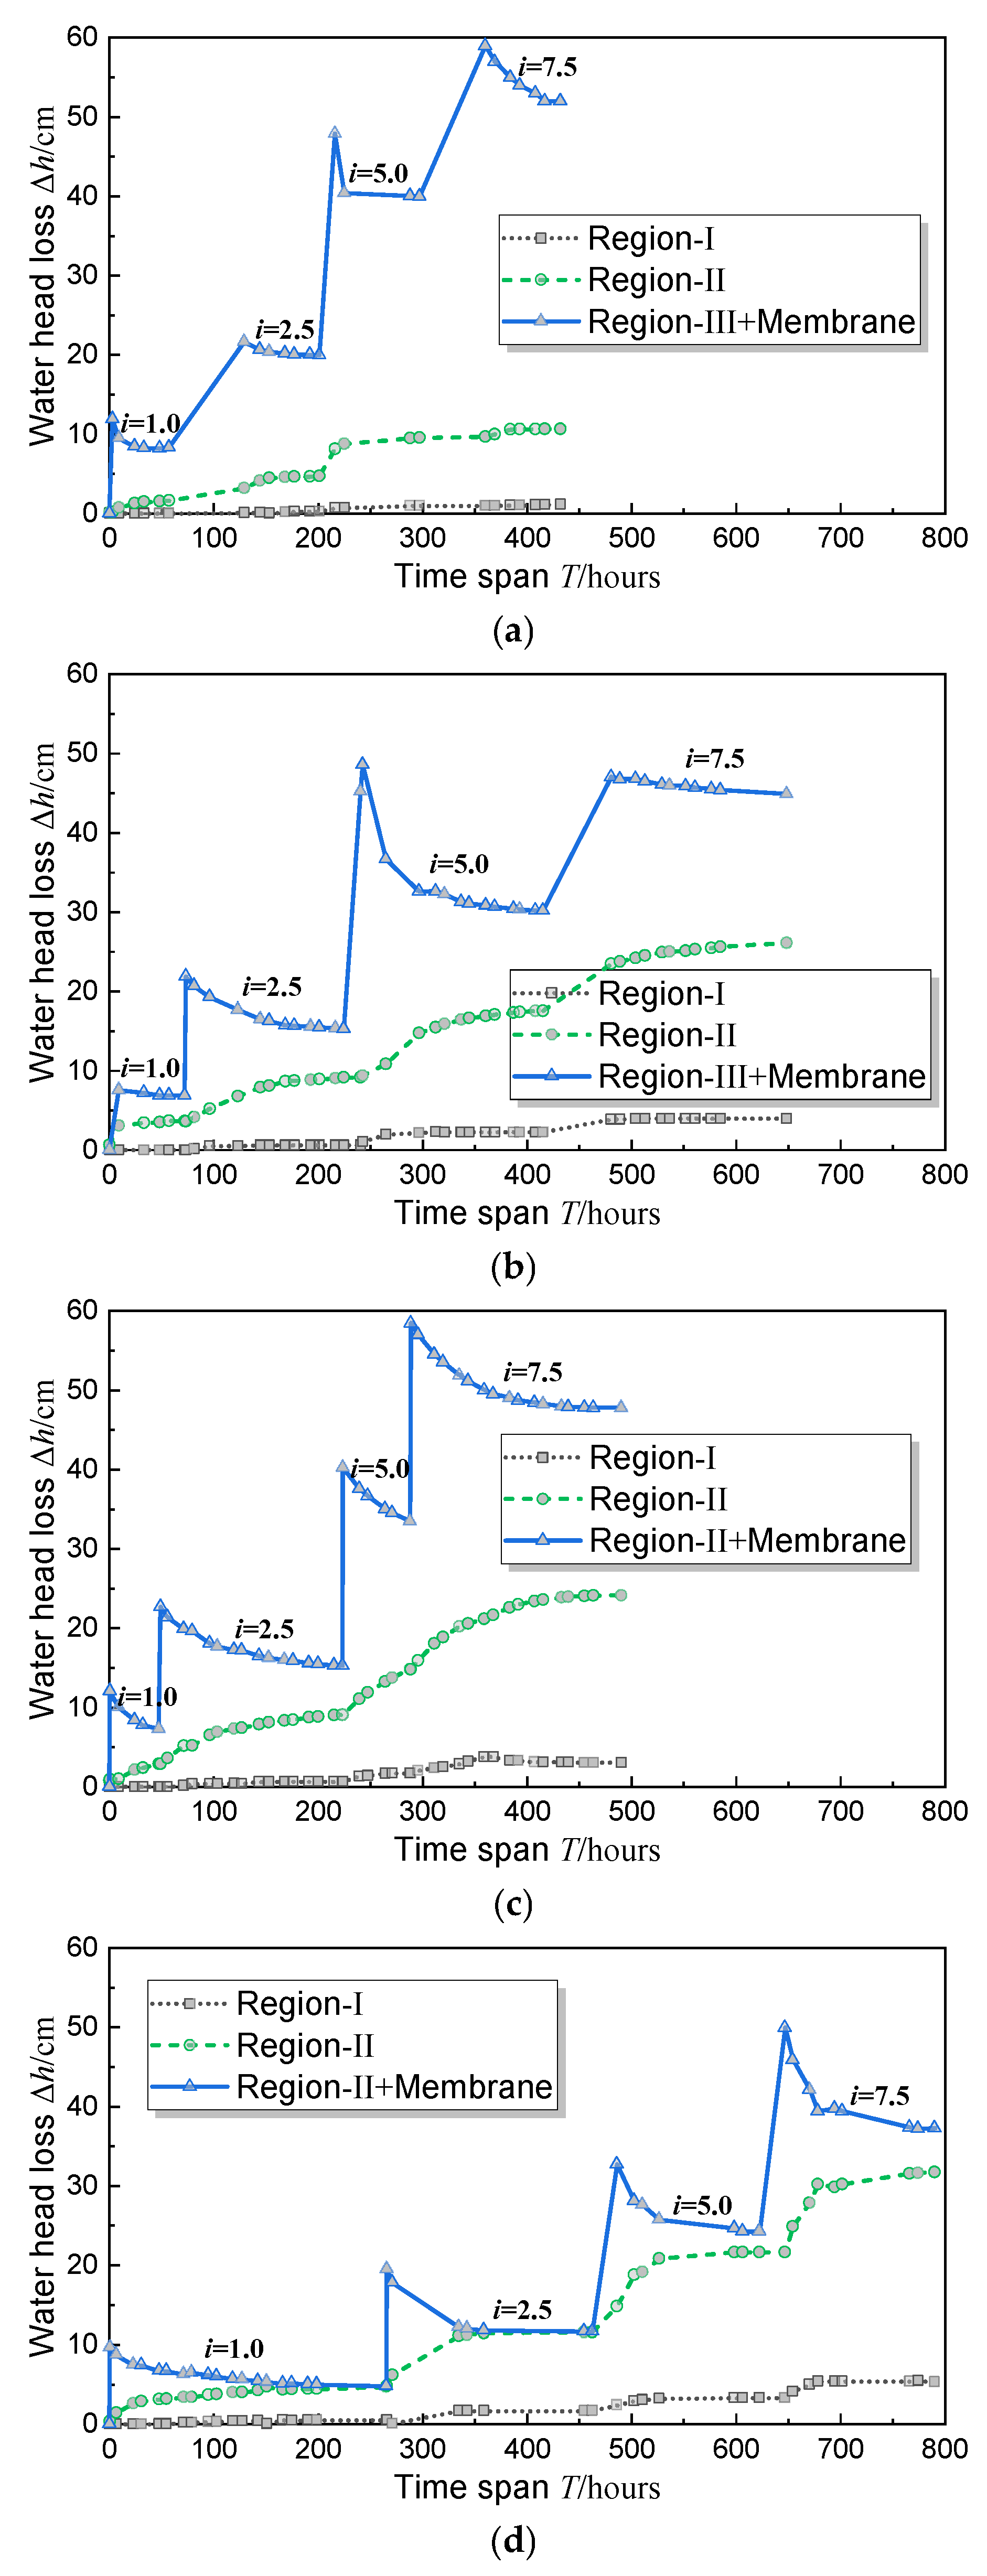
Figure 8.
Mercury intrusion and extrusion curves of typical filter membranes. (a) XCW; (b) XFW.

Figure 9.
Time-varying curves of GR for tested filter membranes. (a) XCW; (b) XFW.
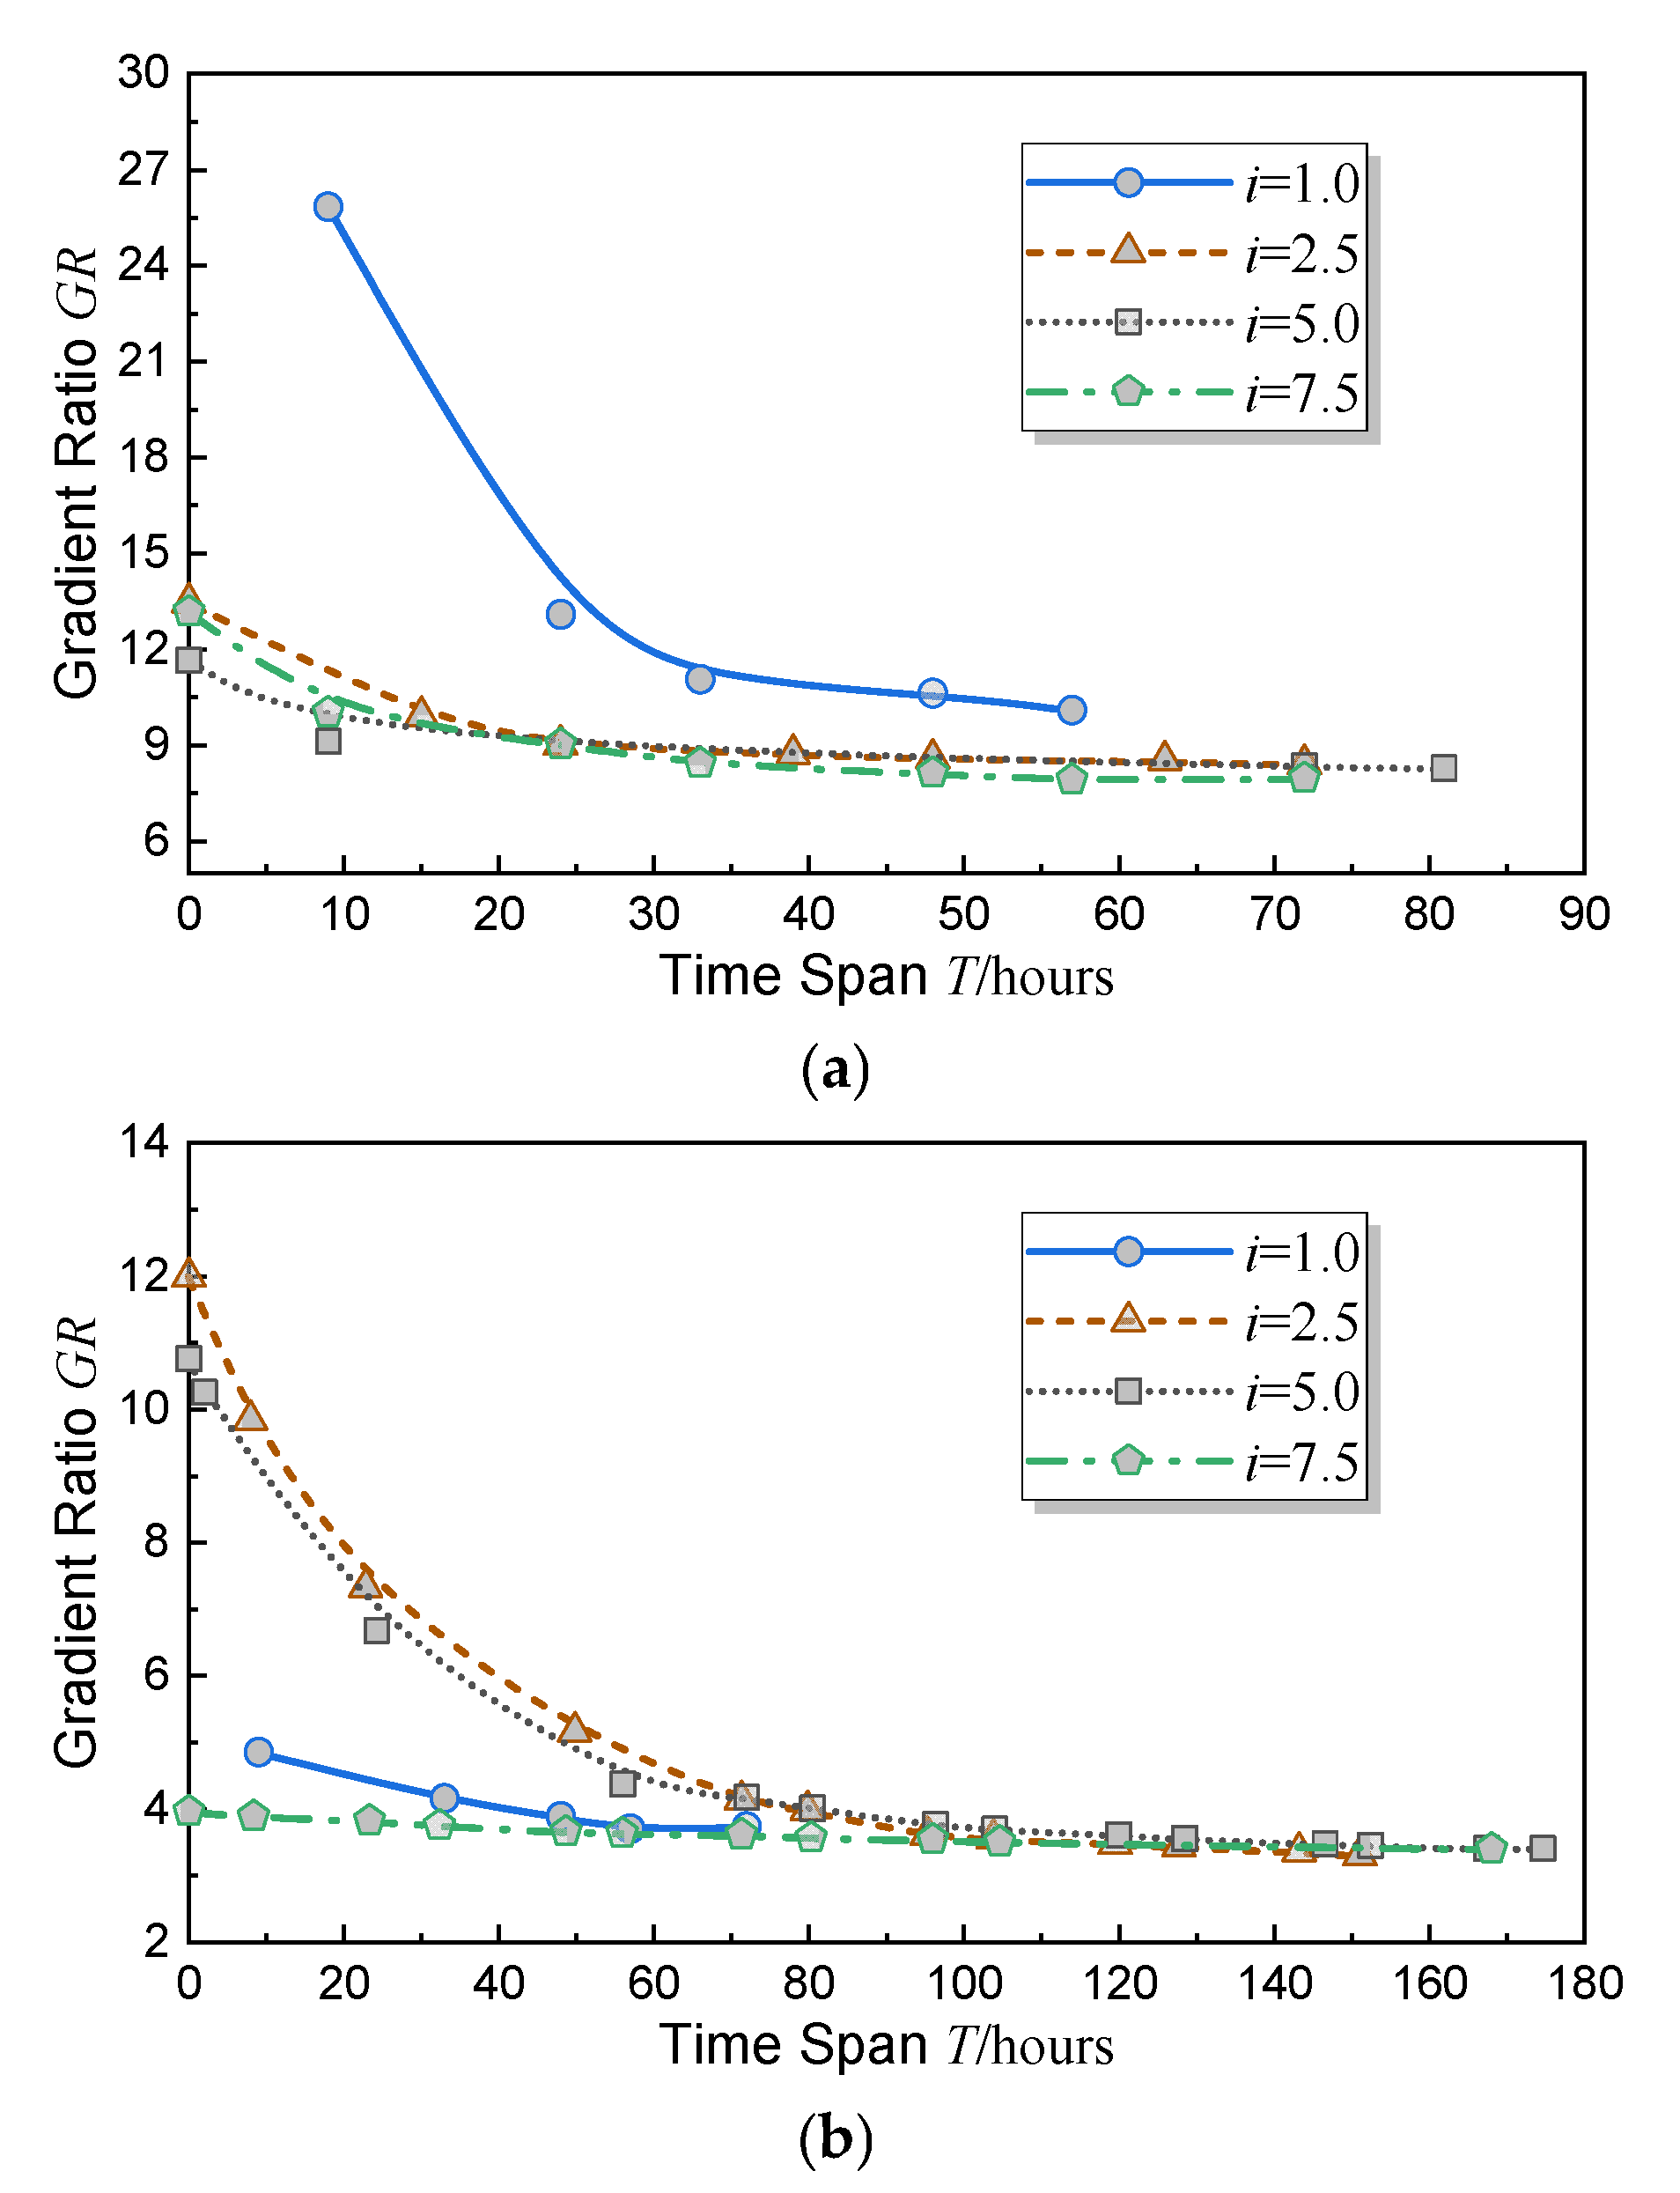
Table 2.
Pore characteristics and permeability performance of typical geomembranes.
| Sample Number | Fiber Diameter df//μm | Fiber Layer Number m | Equivalent Pore Size O95/mm | Porosity ng/% | Permeability Coefficient kg/cm/s | ||
|---|---|---|---|---|---|---|---|
| DBN | 63 (Vertical)/ 127 (Horizontal) | 1 | 0.18 × 0.25 (Rectangle) | 79.0 | 0.0455 | ||
| ZBN | 54 (Vertical)/ 61 (Horizontal) | 1 | 0.12 × 0.12 (Rectangle) | 68.9 | 0.0359 | ||
| XCW | 14.2 | 12 | 0.047 (Equivalent round) | 76.3 | 0.0089 | ||
| XFW | 11.5 | 14 | 0.049 (Equivalent round) | 79.8 | 0.0250 | ||
| Mechanical properties of typical geomembranes | |||||||
| Sample Number | Test Condition | Constant Strain Load (10%) N | Tensile Strength (10%) N/cm | Constant Strain Load (15%) N | Tensile Strength (15%) N/cm | Maximum Force N | Elongation at Break/% |
| XCW | Dry | 151.75 | 25.29 | 170.25 | 28.38 | 176.50 | 16.50 |
| Wet | 94.64 | 15.77 | 95.51 | 15.92 | 102.38 | 14.09 | |
| XFW | Dry | 166.50 | 27.75 | 189.59 | 31.60 | 275.46 | 35.47 |
| Wet | 125.43 | 20.90 | 142.28 | 23.71 | 181.19 | 31.74 | |
| DBN | Wet | 80.56 | 13.43 | 137.94 | 22.99 | 408.57 | 45.06 |
| ZBN | Wet | 51.23 | 8.54 | 86.24 | 14.37 | 311.53 | 41.62 |
Table 3.
Quantitative index of each typical bending pattern.
| Quantitative Index | Vertical | One Bend | Two Bends | Three Bends | Inverted Folding |
|---|---|---|---|---|---|
| Bending angle 1/° | 180 | 149 | 108 | 93 | 44 |
| Bending angle 2/° | 180 | - | 108 | 73 | 44 |
| Bending angle 3/° | 180 | - | - | 93 | - |
| Effective length/cm | 40 | 42 | 49 | 52 | 64 |
| Bending ratio/% | 0 | 5 | 22.5 | 30 | 60 |
Note: Bending ratio = (drainage board effective length − 40)/40.
Table 4.
Water-flow test results for test samples with different bending patterns (cm³/s).
| Test Sample | Bending Pattern | ||||
|---|---|---|---|---|---|
| Vertical | One Bend | Two Bends | Three Bends | Inverted Folding | |
| CF | 151.40 | 151.17 | 110.11 | 100.85 | 96.29 |
| CZ | 247.52 | 246.91 | 246.00 | 245.37 | 221.07 |
| FF | 221.98 | 221.84 | 221.47 | 218.86 | 202.96 |
| FZ | 234.47 | 232.97 | 232.14 | 231.32 | 215.38 |
Table 5.
Water-flow reduction rates of test samples with different bending rates.
| Test Sample | Bending Rate | ||||
|---|---|---|---|---|---|
| 0% | 5% | 22.5% | 30% | 60% | |
| CF | 0.00% | 0.15% | 27.27% | 33.39% | 36.40% |
| CZ | 0.00% | 0.25% | 0.61% | 0.87% | 10.69% |
| FF | 0.00% | 0.06% | 0.23% | 1.41% | 8.57% |
| FZ | 0.00% | 0.64% | 0.99% | 1.34% | 8.14% |
| Water-flow reduction rates of test samples under different bending angles | |||||
| 180° | 149° | 108° | 86.3° | 44° | |
| CF | 0.00% | 0.15% | 13.64% | 11.13% | 18.20% |
| CZ | 0.00% | 0.25% | 0.31% | 0.29% | 5.34% |
| FF | 0.00% | 0.06% | 0.11% | 0.47% | 4.28% |
| FZ | 0.00% | 0.64% | 0.50% | 0.45% | 4.07% |
Note: In order to conduct a targeted analysis, averages of the three bending angles and their corresponding water-flow reduction rates under the three-bend condition were applied in the test.
Table 6.
Increases in well resistance of test samples with different bending rates.
| Test Sample | Bending Rate | ||||
|---|---|---|---|---|---|
| 0% | 5% | 22.5% | 30% | 60% | |
| CF | 0.00% | 0.15% | 37.50% | 50.12% | 57.23% |
| CZ | 0.00% | 0.25% | 0.62% | 0.88% | 11.96% |
| FF | 0.00% | 0.06% | 0.23% | 1.43% | 9.37% |
| FZ | 0.00% | 0.64% | 1.00% | 1.36% | 8.86% |
| Increases in well resistance of test samples with different bending angles | |||||
| Test Sample | Bending Angle/° | ||||
| 180° | 149° | 108° | 86.3° | 44° | |
| CF | 0.00% | 0.15% | 18.75% | 16.71% | 28.62% |
| CZ | 0.00% | 0.25% | 0.31% | 0.29% | 5.98% |
| FF | 0.00% | 0.06% | 0.11% | 0.48% | 4.68% |
| FZ | 0.00% | 0.64% | 0.50% | 0.45% | 4.43% |
Disclaimer/Publisher’s Note: The statements, opinions and data contained in all publications are solely those of the individual author(s) and contributor(s) and not of MDPI and/or the editor(s). MDPI and/or the editor(s) disclaim responsibility for any injury to people or property resulting from any ideas, methods, instructions or products referred to in the content. |
© 2023 by the authors. Licensee MDPI, Basel, Switzerland. This article is an open access article distributed under the terms and conditions of the Creative Commons Attribution (CC BY) license (https://creativecommons.org/licenses/by/4.0/).
Share and Cite
MDPI and ACS Style
Bao, S.; Guo, L.; Dong, Z.; Zhou, R.; Zhou, S.; Chen, J. Clogging Behaviors in PVD and Their Evaluation Criteria for Dredged Mud Slurry. Water 2023, 15, 4206. https://doi.org/10.3390/w15244206
AMA Style
Bao S, Guo L, Dong Z, Zhou R, Zhou S, Chen J. Clogging Behaviors in PVD and Their Evaluation Criteria for Dredged Mud Slurry. Water. 2023; 15(24):4206. https://doi.org/10.3390/w15244206
Chicago/Turabian StyleBao, Shufeng, Lingfeng Guo, Zhiliang Dong, Ruibo Zhou, Shuangxi Zhou, and Jian Chen. 2023. "Clogging Behaviors in PVD and Their Evaluation Criteria for Dredged Mud Slurry" Water 15, no. 24: 4206. https://doi.org/10.3390/w15244206
Note that from the first issue of 2016, this journal uses article numbers instead of page numbers. See further details here.