
The Impact of Underground Structures on Urban Flood Models
by
 , , , and
Martina Hauser
1,*,
Stefan Reinstaller
2,
Martin Oberascher
1 ,
,
Dirk Muschalla
2 and
Manfred Kleidorfer
1 1
Unit of Environmental Engineering, Department of Infrastructure, University of Innsbruck, Technikerstrasse 13, 6020 Innsbruck, Austria
2
Institute of Urban Water Management and Landscape Water Engineering, Graz University of Technology, Stremayrgasse 10/1, 8010 Graz, Austria
*
Author to whom correspondence should be addressed.
Water 2024, 16(1), 170; https://doi.org/10.3390/w16010170
Submission received: 5 December 2023
/
Revised: 28 December 2023
/
Accepted: 29 December 2023
/
Published: 1 January 2024
(This article belongs to the Special Issue Water Supplies, Sewerage and Stormwater Networks: New Challenges and Advances in Modelling and Management)
Abstract
:Owing to climate change, heavy rainfall events have increased in recent years, often resulting in urban flooding. Urban flood models usually consider buildings to be closed obstacles, which is not the case in reality. To address this research gap, an existing 1D/2D model was extended with underground structures. The underground structures were located using site visits, Google Earth, and information provided by the city administration. Control strategies were used to represent partially open doors or tilted windows. The model was simulated with three measured rainfall events in three different scenarios. Scenarios with underground structures resulted in small storage volumes in the structures and a slightly less flooded area on the surface. The assumptions made were analysed using sensitivity analysis. Varying the number and location of underground structures resulted in small variations in the stored volume and surface flood volume. The sensitivity analysis also showed that the thresholds for height and velocity had a large impact, whereas the opening percentage did not influence the number of buildings affected. The conclusion of the study is that the inclusion of underground structures has little effect on the predicted flooded areas but can be useful in quantifying the water depth in potentially vulnerable buildings.
1. Introduction
The number of extreme events has increased in recent years [1,2,3,4]. This is also demonstrated by several heavy rainfall events in Austria (e.g., Innsbruck 2016 [5], Graz 2018 [6], and Kufstein 2021 [7]). Such storm events have been observed not only in Austria but also in other European countries (e.g., Italy 2022, Russia 2022, Portugal 2022, Turkey 2022, Spain 2022, and England (UK) 2022 [8]). Owing to its high relevance, there has been much research on this topic [9,10]. Future flood risk will be exacerbated by, among other things, climate change and increasing urbanisation [2,4,11,12]. Because surface flows are known to have a major influence on the flood risk of individual properties [13], urban flood modelling is becoming increasingly important for flood risk assessment. Integrated 1D/2D models are often used to identify potential flood areas [14] and couple 2D overland flow and 1D sewer flow [15]. The question of whether the sewer system should be included [16,17], simplified, or discarded [18,19] in urban flood models is still under discussion. However, the current trend is to include sewer networks [20,21,22], especially in urban catchments, as the main cause of urban flooding is often the limited capacity of the sewerage system to interact with overland flow [23].
The most common modelling approaches consider buildings to be obstacles with water flow between the structures (blocking-out), local elevation rise, or local increase in solid surface roughness [24]. The blocking-out approach has proven to be the most efficient method of representing buildings in urban environments for two-dimensional, fully dynamic flood-modelling applications [25], although modelling uncertainties can never be completely avoided. Deletic et al. [26] define three main groups of uncertainty sources—uncertainty in model inputs, uncertainty in calibration, and uncertainty in model structure—the latter determining how well the model represents the real system [24]. However, all these three approaches do not really represent the real system in which water can enter buildings, particularly basements.
The smaller temporal and spatial scale of pluvial floods endangers sensitive areas such as subways and underpasses [27]. On the one hand, buildings with basements or underground car parks are known to have a high damage potential [28,29], as water floods the lower structures first. On the other hand, these structures also provide significant storage volumes during floods and, in some cases, also provide floor drains, funnels, infiltration gravel beds, or trench drains, thus influencing the surface flooding situation. Quantifying water ingress into buildings is a research topic that has rarely been studied in the past [30,31,32]. In an experimental setup [33], it was verified that there is a significant influence of the storage effect of basements on the surface flooding situation, but that study still suggests further considerations for modelling. In urban flood modelling, the simulation of flow through and within buildings can be performed in 2D [34] or 3D [35], for example, for a single-family house [36]. However, a 2D/3D approach is inappropriate for larger areas like cities or city districts because of the need for high-resolution data and long simulation times.
The aim of this study is to investigate the impact of flood modelling that allows water to be stored in the included underground structures. As such, this paper analyses conceptualisation as part of model structure uncertainties according to the classification of Deletic et al. [26]. We used an existing model and combined a 1D approach with a 2D surface model. Specifically, 1D elements were used to represent underground structures in the model, which acted as additional storage areas and, thus, influenced the surrounding surface water conditions, which were represented with a generated 2D mesh of nodes and conduits. The 1D approach used to integrate underground structures can also be applied to larger areas and can provide additional information on vulnerable buildings. The modelling of such structures is based on assumptions because of the lack of information on underground structures, their openings, and the opening conditions during a flood event. Conventional modelling approaches in the literature have not considered water ingress into buildings; however, this may be the case in reality because buildings can have several openings (e.g., doors and windows). Therefore, this study addresses this research gap by identifying how such structures can be included in a model, how they affect the resulting flood situation, and, ultimately, possible further risk analysis. The aim is to compare the conventional (without buildings) and the presented (with buildings) approaches to identify the importance of building representations in flood modelling. Furthermore, data availability is an important issue in this context because the level of detail influences the results. Therefore, a sensitivity analysis of the selected control condition and a sensitivity analysis of the number and location of underground structures were carried out to test the robustness of the results and plan effective data collection.
2. Materials and Methods
2.1. Study Site
This research is based on an existing calibrated 1D/2D model of the study site in Graz, Austria [22]. Graz is located in the Northern Hemisphere, with an average temperature of 8.2 °C [37], and the annual precipitation is approximately 860 mm [38]. Heavy rainfall events typically occur during the summer (from June to September). The model includes a 1D sewer system and a 2D surface model. It was created using the commercial software PCSWMM2D (7.4) developed by the Computational Hydraulic Institute (CHI) [39], presented by James et al. [39], and demonstrated by Abdelrahman et al. [40]. The valley-shaped study area is in the eastern part of the city and covers approximately 132 ha (Figure 1).
The catchment consists of a small stream (Annabach), an urban area with a combined sewer system, and a hillside area with an average slope of approximately 20 percent [41]. Hillside runoff can be a major factor in pluvial flooding, particularly in the alpine regions of Austria [42]. The settlement area is a mixed residential area with single-family houses with basements and few underground car parks.
2.2. Data Requirements
An existing and calibrated 1D/2D model was utilised to integrate the underground structures using the data sources described in this chapter (Table 1).
Several flooding problems have been documented in the study area during recent heavy rainfall events. Therefore, the calculations were based on three real rainfall events (GCMN [38]) that occurred on 4 August 2020, 13 August 2020, and 30 July 2021 (Figure 2). All three events had a return period slightly below (13 August 2020: 91.4 years for a duration of 20 min) or above 100 years (4 August 2020: 604.6 years for a duration of 20 min; 30 July 2021: 5887.1 years for a duration of 4.5 h).
The existing model was modified to include underground structures such as basements and underground car parks. Therefore, in addition to the information provided by the city council “Building and Facilities Authority” of the City of Graz, a site visit and virtual inspection using Google Earth was carried out to identify the locations of such structures by identifying openings such as garage doors or basement windows and entrances to underground parking areas. Floor drains were not considered because of missing information and a potentially low impact. The locations of underground structures and their openings, such as windows and doors, are required, as is information about the geometry and offset of each type of entrance. Basically, 5 different types of openings/inlets have been defined; for more information, refer to Section 2.3. However, the following assumptions were made. The underground volume was determined on the basis of the assumption that the area of the underground structure was equal to the area of the building above and had a generally defined height of 2.5 m. In particular, the assumed location of underground structures and the geometry of openings are subject to a high degree of uncertainty and can, therefore, have a large impact on the database. A sensitivity analysis was conducted to assess these effects and identify the need for effective data collection by municipalities.
2.3. Modelling Approach
The software PCSWMM2D, developed by CHI [43], is based on the open-source Stormwater Management Model SWMM5.1 [44,45]. 1D elements from this software were used to represent underground structures. Calculations were performed using the dynamic wave equation and Green–Ampt method for infiltration. As a first step to include underground structures in the model, 1D storage elements were implemented to represent the basements and underground car parks. The assumptions described in Section 2.2 were used to define the size of the storage elements, and 1D model elements were chosen owing to the computational time and insufficient data on the underground structures. The storage elements were connected to the 2D mesh nodes in PCSWMM2D using 1D orifice elements, which represent the inlets such as windows and doors, and were defined by their geometry, height, and location according to Google Earth and site visits. There were five different ways to define the inlets (Figure 3): (a) basement window, (b) window with funnel, (c) window with an infiltration gravel bed, (d) door/garage door, and (e) underground garage door.
Various types of structures are characterised by their geometry and inlet offset, which represent the structure’s distance from the ground. Funnels and infiltration gravel beds were modelled with additional storage, allowing infiltration in the case of gravel beds but not funnels. Doors and garage doors have larger inlet areas than windows, with a smaller inlet offset. Underground garage doors with a trench drain were modelled with additional storage and a weir to allow a small amount of water to escape. Control strategies have been introduced to allow partial opening under specific circumstances, such as leakage or broken windows. These strategies were based on some average conditions from the literature [46] and involved checking the water level and velocity at connected nodes for values at which it was assumed that water could enter a building in an average situation:
- Condition 1: Water level at the connected mesh node is greater than 0.05 m (including the inlet offset).
- Condition 2: Velocity in the incoming mesh conduits is greater than 0.2 m/s.
If the conditions were met, the inlet would open by 20 percent of the cross-section, simulating a partially opened door or tilted window. A 20 percent value was assumed, and the effect was subsequently analysed in the sensitivity analysis in Section 3.2.2 The Python package PySWMM [47] was used to implement the control strategies in the simulation.
Three different scenarios were defined: (a) a reference scenario (conventional approach where buildings are blocked out as obstacles); (b) an unconditional scenario (where all inlets are permanently and fully open); and (c) a conditional scenario (where inlets are managed by the control strategies). Each scenario was calculated for all three rainfall events. The simulations were analysed with a focus on different metrics:
- Stored volume and number of flooded structures: This section compared the number of flooded structures and flood volume stored in the basements and garages. A structure was considered to be affected when water entered the underground structure, and this number was counted as the sum of all flooded structures. The stored flood volume was calculated as the sum of the maximum water volume in each flooded structure at the end of the event. Reference scenario (a) was ignored here, as there were no underground structures and, therefore, no stored volume in any structure.
- Reduction in surface flooded area: A comparison of the surface flooded area was performed for all three scenarios and all three events. An area was considered flooded if the water level exceeded 0.05 m.
2.4. Sensitivity Analysis
To assess the modelling assumptions and the need for better building information, two sensitivity analyses were conducted: one exploring the influence of the number and location of basement structures and the other examining the thresholds in the control strategy. The first analysis involved varying the number of buildings with basements from 0 to 100 percent in 10 percent increments, including 747 underground structures. The locations of these structures were considered using Monte Carlo simulations. The second analysis focused on different threshold values for the water level and velocity and various cross-section opening percentages. These analyses were performed in Python, utilising reservoirs and openings representing basement windows in the study area, and were conducted for the selected rainfall event on 30 July 2021, which had the highest rainfall sum of the three events analysed.
3. Results and Discussion
3.1. Impact of Underground Structures
3.1.1. Stored Volume and the Number of Flooded Structures
It has been reported that surface flood areas decrease slightly when more water is stored in underground structures, but as the stored volume is relatively small, the impact on the surface flood conditions is also relatively small. To interpret the stored volume in underground structures, it was necessary to distinguish between the (b) unconditional and (c) conditional scenarios (Table 2). The reference scenario was not included in this comparison because there were no underground structures that could store water. In general, the (c) conditional scenario is more realistic, as windows and doors are usually closed during rain events. Between 423 m3 (1.3 percent of the total rainfall) on 4 August 2020 and 2539 m3 (2.3 percent of the total rainfall) on 30 July 2021 was stored in underground structures. The difference between the conditional and unconditional scenarios was minimal. The events of 13 August 2020 (b: 1193 m3; c: 1134 m3) and 30 July 2021 (b: 2539 m3; c: 2378 m3) resulted in a higher stored flood volume in the underground structures for the (b) unconditional scenario, as in this scenario, all windows and doors were permanently open. In contrast, the 4 August 2020 event (b: 423 m3; c: 441 m3) showed a slightly higher stored flood volume in the underground structures for the (c) conditional scenario. This was the result of the changed routing of the calculated surface runoff, which was influenced by each open or closed window or door. The number of basements and garages affected, on the other hand, resulted in a higher number of affected structures for all three events in the case of the (b) unconditional scenario, which, as expected, proves that more underground structures were affected when more windows and doors were open. Compared to the total number of structures (211 underground structures were included), the number of flooded structures ranged from 23 (4 August 2020, (c) conditional scenario) to 56 (30 July 2021, (b) unconditional scenario).
3.1.2. Reduction of Flood Area on the Surface
Figure 4 illustrates the flood area with a water depth greater than 0.05 m at 10:35 pm, and this represents the maximum flooded area. The results are shown for the 30 July 2021 event as an example, but the trend was the same for all three events. The (b) unconditional scenario (light blue) had the least amount of flooded area (3.13 percent reduction compared with the reference scenario). The blue and dark blue areas show the additional flooded area in the (c) conditional scenario (3.10 percent reduction) and the (a) reference scenario. The (a) reference scenario represents the actual situation using the conventional approach of “blocking-out”. Although the experimental setup of Pritsis et al. [33] showed a significant influence of the storage effect of basements, this finding could not be demonstrated in the modelling approach applied in this work. This could be because of the fact that the experimental approach used an idealised structure, while the modelling approach represented the buildings and openings as realistically as possible. The small change in the flooded area between the different scenarios occurred because not all buildings are affected in the realistic representation, and, additionally, it indicates the limited impact of underground structures. All three events resulted in a smaller flooded area on the surface, where more structures were flooded.
However, the analysis also provides information regarding the question of whether individual protective measures negatively affected adjacent structures. While specific buildings and measures were not explicitly addressed in the results, the comparison between the reference scenario (where water could not enter buildings because of protection measures) and the conditional scenario (where water could enter buildings) suggested that holistic protection measures generally had a negligible negative impact on surface flooding. These findings are similar to those of a former study [36] that showed the marginal impact of a building on the flow field of the flood plain when considering 3D indoor flooding processes in one single-household building, as the volume inside the building is small compared to the volume of the flood hydrograph. However, it is important to note that changes in flow paths may lead to negative effects on specific buildings.
3.2. Sensitivity Analysis
3.2.1. Sensitivity Analysis of the Location and Number of Underground Structures
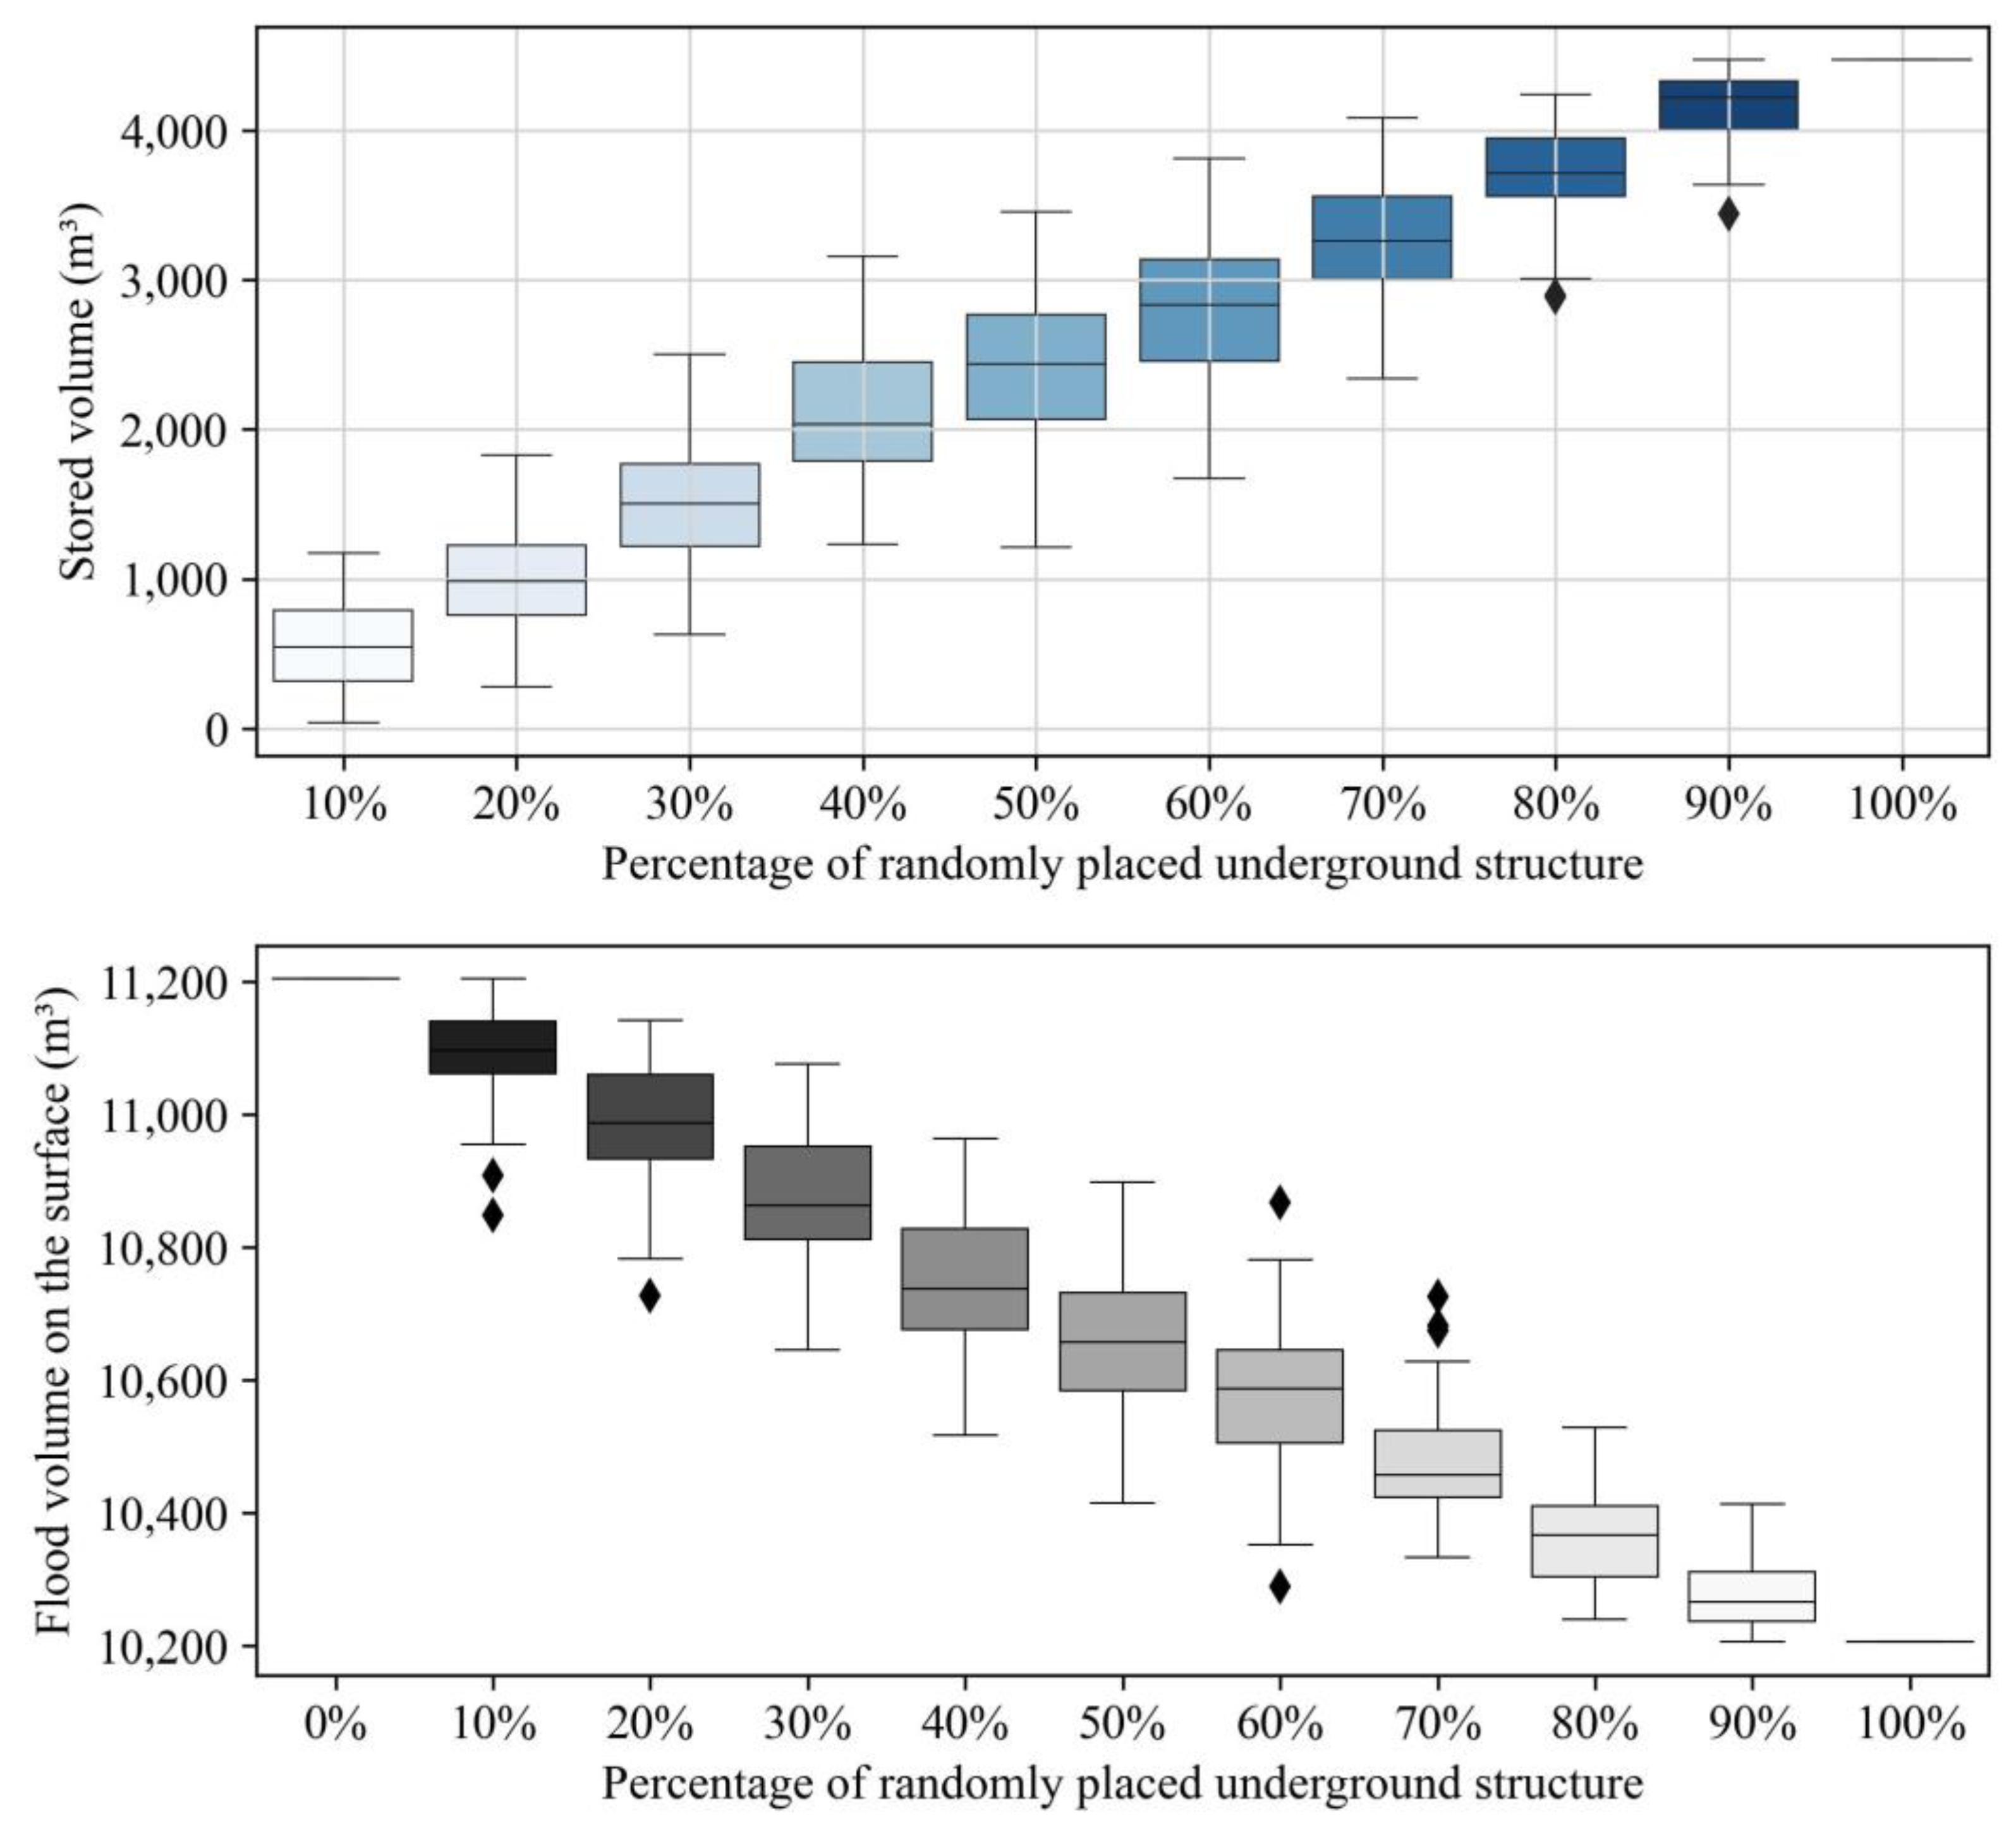
The sensitivity analysis showed the effect of the number of underground structures on the stored flood volume, surface flood volume, and number of buildings affected. The median increased from 536 m3 to 4216 m3 for the total stored volume in the underground structures (at the end of the analysed period) and decreased from 11,096 to 10,266 m3 for the maximum flood volume on the surface (during the simulation time) with an increase in the number of placed underground structures from 10 to 90 percent. The two boxplots show small variations among the 50 different scenarios for each number of underground structures and a small number of outliers (Figure 5).
Figure 5 shows large differences when considering the volume stored in underground structures, leading to the conclusion that the stored flood volume is sensitive to the number of underground structures. However, the maximum flood volume on the surface did not change considerably (less than 10 percent compared to 0 to 100 percent). This fact again proves the relatively small influence on the surface flood situation and, thus, additionally confirms the previous results. The few outliers and the low variability of both the stored volume and the surface flood volume for each percentage rate indicate that the simulation results are less sensitive to the location of the underground structures.
However, as expected, the number of structures affected showed a clear increase with each increase in the number of underground structures (Table 3). A building is considered to be affected at the moment the water enters the building. This assumption leads to a relatively large number of affected buildings, which, nevertheless, does not significantly change the flood situation on the surface. The use of a database with information on buildings and underground structures, therefore, has only a marginal influence on the flood situation in the study area of Graz, but it can be helpful for a more realistic representation of the study area and the simulated flood process.
3.2.2. Manual Sensitivity Analysis of the Control Strategy Parameters
The control strategies define the water level (condition 1) and flow velocity (condition 2) needed for windows and doors to open (described in Section 2.3). The opening conditions varied between the different percentages of the cross-section.
The second part of the sensitivity analysis (Table 4) showed that the change in water level in condition 1 and the change in velocity in condition 2 were highly sensitive and led to a relatively large change in the number of affected structures. This result suggests that even small measures such as heightening (e.g., stairs) can be used to protect vulnerable buildings. In contrast, changing the percentage of the partial opening of the inlet did not affect the number of affected buildings. It is possible that this change will lead to changes in the stored volume within the buildings; however, as the effect on surface flood conditions is generally minimal, this can be neglected.
4. Conclusions
In reality, the flooding of buildings is quite common. Therefore, it is important to investigate this aspect in modelling. In current flood models, buildings are usually considered in terms of blocking-out, local elevation rise, or local roughness increase. The objective of this study is to determine the impact of water ingress into buildings, particularly underground building structures (e.g., basements and underground garages), integrated into an existing 1D/2D model using 1D model elements (reservoirs and openings). In modelling, one is always faced with the question of which processes are relevant to the model and how they can be represented to get as close to reality as possible. In this context, the results provide excellent indications of how underground structures should be dealt with in future modelling. The results show how the integration of such structures affects flood behaviour in the model and allow conclusions to be drawn about protection measures, data requirements, and deeper insights into flood modelling.
The results demonstrate the ability to model buildings, including underground structures that allow water ingress, using 1D model elements (storage and openings). This new study approach represents a more realistic representation compared to state-of-the-art techniques such as blocking-out the solid area, local elevation increase, or local increase in solid area roughness. The results indicated a relatively small effect on the surface flooding conditions, although some basements and underground garages were flooded. In the model, however, an attempt was made to represent the openings as realistically as possible, resulting in some structures not being flooded, even though there was water in that area. The model also considered the distance between the opening and the ground. It should be noted that these results apply only to a specific study area in Graz and may be different for other study areas with more underground volume. Changing groundwater levels has also not been considered and could potentially change the results for long-term consideration. Furthermore, the situation could be improved by using a more accurate database that requires fewer items to gain a better understanding in this context.
The results also indicate the influence of protection measures. On the one hand, the different scenarios can be considered to comprise a scenario without protective measures ((c) conditional scenario) and a scenario where every building is protected ((a) reference scenario). This comparison does not answer the question regarding individual protection measures but rather shows that there are no major differences in the flood situation for the entire study area. On the other hand, the sensitivity analysis of the parameters of the control strategy proved the usefulness of even small protective measures, as the number of affected buildings decreased significantly when the required water height or water velocity at which the water could enter the building was increased. It should be noted that these results were for the entire catchment area and may vary for individual buildings. The study area in Graz also included only basements of single-family houses and a few underground car parks. This situation could change when considering large underground structures such as underground metro systems. Therefore, the results of this study refer to the specific study site of Graz or similar catchments, but the modelling approach could be applied to other urban catchments. It should also be noted that the interpretation could be improved if measurement data or post-flood water levels inside the buildings were available to adjust the model parameters and assumptions. Therefore, further analysis of other urban catchment characteristics could provide a deeper understanding of this area.
Because of the high effort required to obtain the necessary data and the incorporation of underground structures into the model, a high number of assumptions must be weighed against the small change in the model that was achieved. Therefore, the integration of such structures does not significantly benefit the model results. Despite the small influence on surface water conditions and the high effort required to investigate the necessary data, the integration of such structures can be useful for the application of damage functions. This facilitates the identification of water depths within vulnerable buildings, which provides important additional information for estimating damage costs. This is particularly important because buildings with underground structures are known to have increased damage potential.
Author Contributions
Conceptualisation, M.H., S.R., D.M. and M.K.; methodology, M.H., S.R., D.M. and M.K.; software, M.H. and M.O.; validation, M.H. and S.R.; formal analysis, M.H., S.R. and M.K.; investigation, M.H.; resources, M.K. and D.M.; data curation, M.H.; writing—original draft preparation, M.H.; writing—review and editing, M.H., S.R., M.O. and M.K.; visualisation, M.H.; supervision, M.K. and D.M. All authors have read and agreed to the published version of the manuscript.
Funding
The authors acknowledge Computational Hydraulics International (CHI), Canada, for providing a university grant to use PCSWMM for the current project.
Data Availability Statement
Data are contained within the article.
Conflicts of Interest
The authors declare no conflicts of interest.
References
- Moatti, J.-P.; Thiébault, S. The Mediterranean Region under Climate Change: A Scientific Update; IRD Éditions: Marseille, France, 2016; ISBN 978-2-7099-2219-7. [Google Scholar]
- Berndtsson, R.; Becker, P.; Persson, A.; Aspegren, H.; Haghighatafshar, S.; Jönsson, K.; Larsson, R.; Mobini, S.; Mottaghi, M.; Nilsson, J.; et al. Drivers of Changing Urban Flood Risk: A Framework for Action. J. Environ. Manag. 2019, 240, 47–56. [Google Scholar] [CrossRef] [PubMed]
- Papalexiou, S.M.; Montanari, A. Global and Regional Increase of Precipitation Extremes Under Global Warming. Water Resour. Res. 2019, 55, 4901–4914. [Google Scholar] [CrossRef]
- O’Donnell, E.; Thorne, C. Drivers of Future Urban Flood Risk. Philos. Trans. R. Soc. A Math. Phys. Eng. Sci. 2020, 378, 20190216. [Google Scholar] [CrossRef] [PubMed]
- Kleidorfer, M.; Tscheikner-Gratl, F.; Vonach, T.; Rauch, W. What Can We Learn from a 500-Year Event? Experiences from Urban Drainage in Austria. Water Sci. Technol. 2018, 77, 2146–2154. [Google Scholar] [CrossRef] [PubMed]
- ZAMG. Storm Chronicle (in German: Unwetterchronik)—ZAMG. Available online: https://www.zamg.ac.at/cms/de/klima/klima-aktuell/unwetterchronik?jahr=2018&monat=6 (accessed on 12 September 2022).
- Davies, R. Austria and Germany—More Deadly Flash Floods after Heavy Rain—FloodList. Available online: https://floodlist.com/europe/austria-germany-bavaria-floods-july-2021 (accessed on 20 September 2022).
- FloodList—Europe. Available online: https://floodlist.com/europe (accessed on 19 January 2023).
- Tsakiris, G.P.; Loucks, D.P. Adaptive Water Resources Management under Climate Change: An Introduction. Water Resour. Manag. 2023, 37, 2221–2233. [Google Scholar] [CrossRef]
- Bournas, A.; Baltas, E. Analysis of Weather Radar Datasets through the Implementation of a Gridded Rainfall-Runoff Model. Environ. Process. 2023, 10, 7. [Google Scholar] [CrossRef]
- Freddy, V.; Saidi, M.E.; Douvinet, J.; Fehri, N.; Nasrallah, W.; Menad, W.; Mellas, S. Sub-Chapter 3.4.1. Urbanization and Land Use as a Driver of Flood Risk. In The Mediterranean Region under Climate Change; IRD Éditions: Marseille, France, 2016; pp. 563–575. [Google Scholar] [CrossRef]
- Dutal, H. Determining the Effect of Urbanization on Flood Hazard Zones in Kahramanmaras, Turkey, Using Flood Hazard Index and Multi-Criteria Decision Analysis. Environ. Monit. Assess. 2022, 195, 92. [Google Scholar] [CrossRef]
- Ashley, R.M.; Balmforth, D.J.; Saul, A.J.; Blanskby, J.D. Flooding in the Future—Predicting Climate Change, Risks and Responses in Urban Areas. Water Sci. Technol. 2005, 52, 265–273. [Google Scholar] [CrossRef]
- Henonin, J.; Russo, B.; Mark, O.; Gourbesville, P. Real-Time Urban Flood Forecasting and Modelling—A State of the Art. J. Hydroinform. 2013, 15, 717–736. [Google Scholar] [CrossRef]
- Chang, T.-J.; Wang, C.-H.; Chen, A.S. A Novel Approach to Model Dynamic Flow Interactions between Storm Sewer System and Overland Surface for Different Land Covers in Urban Areas. J. Hydrol. 2015, 524, 662–679. [Google Scholar] [CrossRef]
- GebreEgziabher, M.; Demissie, Y. Modeling Urban Flood Inundation and Recession Impacted by Manholes. Water 2020, 12, 1160. [Google Scholar] [CrossRef]
- Dong, B.; Xia, J.; Zhou, M.; Deng, S.; Ahmadian, R.; Falconer, R.A. Experimental and Numerical Model Studies on Flash Flood Inundation Processes over a Typical Urban Street. Adv. Water Resour. 2021, 147, 103–824. [Google Scholar] [CrossRef]
- Nielsen, R.; Thorndahl, S. Sensitivity Analysis of an Integrated Urban Flood Model. In New Trends in Urban Drainage Modelling; Mannina, G., Ed.; Springer International Publishing: Cham, Switzerland, 2019; pp. 723–728. [Google Scholar]
- Starl, H. Hillside water modeling and its possibility of estimating potential hazards for buildings (in German: Hangwassermodellierungen und deren Möglichkeit zur Abschätzung von potenziellen Gefährdungen für Gebäude). Bautechnik 2020, 97, 255–267. [Google Scholar] [CrossRef]
- Bulti, D.T.; Abebe, B.G. A Review of Flood Modeling Methods for Urban Pluvial Flood Application. Model. Earth Syst. Environ. 2020, 6, 1293–1302. [Google Scholar] [CrossRef]
- Teshome, M. A Review of Recent Studies on Urban Stormwater Drainage System for Urban Flood Management. Preprints 2020, 2020100295. [Google Scholar] [CrossRef]
- Reinstaller, S.; Krebs, G.; Pichler, M.; Muschalla, D. Identification of High-Impact Uncertainty Sources for Urban Flood Models in Hillside Peri-Urban Catchments. Water 2022, 14, 1973. [Google Scholar] [CrossRef]
- Leitão, J.P.; Boonya-Aroonnet, S.; Prodanović, D.; Maksimović, Č. The Influence of Digital Elevation Model Resolution on Overland Flow Networks for Modelling Urban Pluvial Flooding. Water Sci. Technol. 2009, 60, 3137–3149. [Google Scholar] [CrossRef]
- Bellos, V. Ways for Flood Hazard Mapping in Urbanised: A Short Literature Review. Water Util. J. 2012, 4, 25–31. [Google Scholar]
- Bellos, V.; Tsakiris, G. Comparing Various Methods of Building Representation for 2D Flood Modelling In Built-Up Areas. Water Resour. Manag. 2015, 29, 379–397. [Google Scholar] [CrossRef]
- Deletic, A.; Dotto, C.B.S.; McCarthy, D.T.; Kleidorfer, M.; Freni, G.; Mannina, G.; Uhl, M.; Henrichs, M.; Fletcher, T.D.; Rauch, W.; et al. Assessing Uncertainties in Urban Drainage Models. Phys. Chem. Earth Parts A/B/C 2012, 42–44, 3–10. [Google Scholar] [CrossRef]
- Wang, X.; Hou, J.; Li, B.; Chai, J.; Wang, J.; Zhang, W. Study for Underpass Inundation Process Caused by Heavy Storm Using High-Resolution Urban Flood Model. Water Resour. Manag. 2022, 36, 3965–3980. [Google Scholar] [CrossRef]
- German Association for Water, Wastewater and Waste (DWA). Risk Management (in German: Risikomanagement); DWA-M119 (11/2016); DWA: Hennef, Germany, 2016. [Google Scholar]
- Sandink, D.; Binns, A.D. Reducing Urban Flood Risk through Building- and Lot-Scale Flood Mitigation Approaches: Challenges and Opportunities. Front. Water 2021, 3, 689202. [Google Scholar] [CrossRef]
- Liu, L.; Sun, J.; Lin, B.; Lu, L. Building Performance in Dam-Break Flow—An Experimental Study. Urban Water J. 2018, 15, 251–258. [Google Scholar] [CrossRef]
- Sturm, M.; Gems, B.; Keller, F.; Mazzorana, B.; Fuchs, S.; Papathoma-Köhle, M.; Aufleger, M. Experimental Analyses of Impact Forces on Buildings Exposed to Fluvial Hazards. J. Hydrol. 2018, 565, 1–13. [Google Scholar] [CrossRef]
- Mignot, E.; Camusson, L.; Riviere, N. Measuring the Flow Intrusion towards Building Areas during Urban Floods: Impact of the Obstacles Located in the Streets and on the Facade. J. Hydrol. 2020, 583, 124–607. [Google Scholar] [CrossRef]
- Pritsis, S.; Naves, J.; Del Puerto, X.; Deltsidis, N.; Cea, L.; Bermúdez, M.; Papakonstantis, I.; Puertas, J.; Sylaios, G.; Anta, J.; et al. Houses as Reservoirs in Urban Flood Modelling—Abstract Conference NOVATECH. 2023. Available online: https://www.novatech2023.org/ (accessed on 19 July 2023).
- Shettar, A.S.; Keshava Murthy, K. A Numerical Study of Division of Flow in Open Channels. J. Hydraul. Res. 1996, 34, 651–675. [Google Scholar] [CrossRef]
- Weber, L.J.; Schumate, E.D.; Mawer, N. Experiments on Flow at a 90° Open-Channel Junction. J. Hydraul. Eng. 2001, 127, 340–350. [Google Scholar] [CrossRef]
- Gems, B.; Mazzorana, B.; Hofer, T.; Sturm, M.; Gabl, R.; Aufleger, M. 3D-Hydrodynamic Modelling of Flood Impacts on a Building and Indoor Flooding Processes. Nat. Hazards Earth Syst. Sci. 2016, 16, 1351–1368. [Google Scholar] [CrossRef]
- CCCA Climate Change Centre Austria. Climate State Report (in German: Klimastatusbericht). Available online: https://ccca.ac.at/wissenstransfer/klimastatusbericht/klimastatusbericht-2020 (accessed on 8 February 2023).
- Maier, R.; Krebs, G.; Pichler, M.; Muschalla, D.; Gruber, G. Spatial Rainfall Variability in Urban Environments—High-Density Precipitation Measurements on a City-Scale. Water 2020, 12, 1157. [Google Scholar] [CrossRef]
- James, R.; Finney, K.; Perera, N.; James, B.; Peyron, N. SWMM5/PCSWMM Integrated 1D-2D Modeling. Fifty Years of Watershed Modeling—Past, Present and Future. Donigian, A.S., Field, R., Baker, M., Jr., Eds.; ECI Symposium Series. 2013. Available online: https://dc.engconfintl.org/watershed/ (accessed on 4 December 2023).
- Abdelrahman, Y.T.; Moustafa, A.M.E.; Elfawy, M. Simulating Flood Urban Drainage Networks through 1D/2D Model Analysis. J. Water Manag. Model. 2018, 26, C454. [Google Scholar] [CrossRef]
- Reinstaller, S.; Krebs, G.; Muschalla, D. Hazard Assessment of Pluvial Flooding in Urban Areas under Consideration of Fluvial Flooding. In Proceedings of the Interpraevent, Virtual, 31 May 2021. [Google Scholar]
- Simperler, L.; Kretschmer, F.; Ertl, T. A Methodical Framework for Analysing the Cause of Urban Pluvial Flooding in a Hillside Settlement. Water Sci. Technol. 2019, 79, 1798–1807. [Google Scholar] [CrossRef] [PubMed]
- CHI. Homepage CHI. Available online: https://www.chiwater.com/Home (accessed on 7 August 2023).
- Gironás, J.; Roesner, L.; Rossman, L.; Davis, J. A New Applications Manual for the Storm Water Management Model (SWMM). Environ. Model. Softw. 2010, 25, 813–814. [Google Scholar] [CrossRef]
- Rossman, L.A. Storm Water Management Model User’s Manual Version 5.1; EPA/600/R-05/040; Environmental Protection Agency: Washington, DC, USA, 2004. Available online: https://nepis.epa.gov/Exe/ZyPURL.cgi?Dockey=P100ERK4.txt (accessed on 17 March 2022).
- Municipal Agency NRW. Guideline for Municipal Heavy Rain Risk Management in Baden-Württemberg (in German: Leitfaden Kommunales Starkregenrisikomanagement in Baden-Württemberg). Available online: https://pudi.lubw.de/detailseite/-/publication/47871 (accessed on 28 November 2023).
- McDonnell, B.; Ratliff, K.; Tryby, M.; Wu, J.; Mullapudi, A. PySWMM: The Python Interface to Stormwater Management Model (SWMM). J. Open Source Softw. 2020, 5, 2292. [Google Scholar] [CrossRef] [PubMed]
Figure 1.
Study site in the eastern part of Graz, Austria, including the small stream Annabach, sewer system, and hillside area.
Figure 1.
Study site in the eastern part of Graz, Austria, including the small stream Annabach, sewer system, and hillside area.
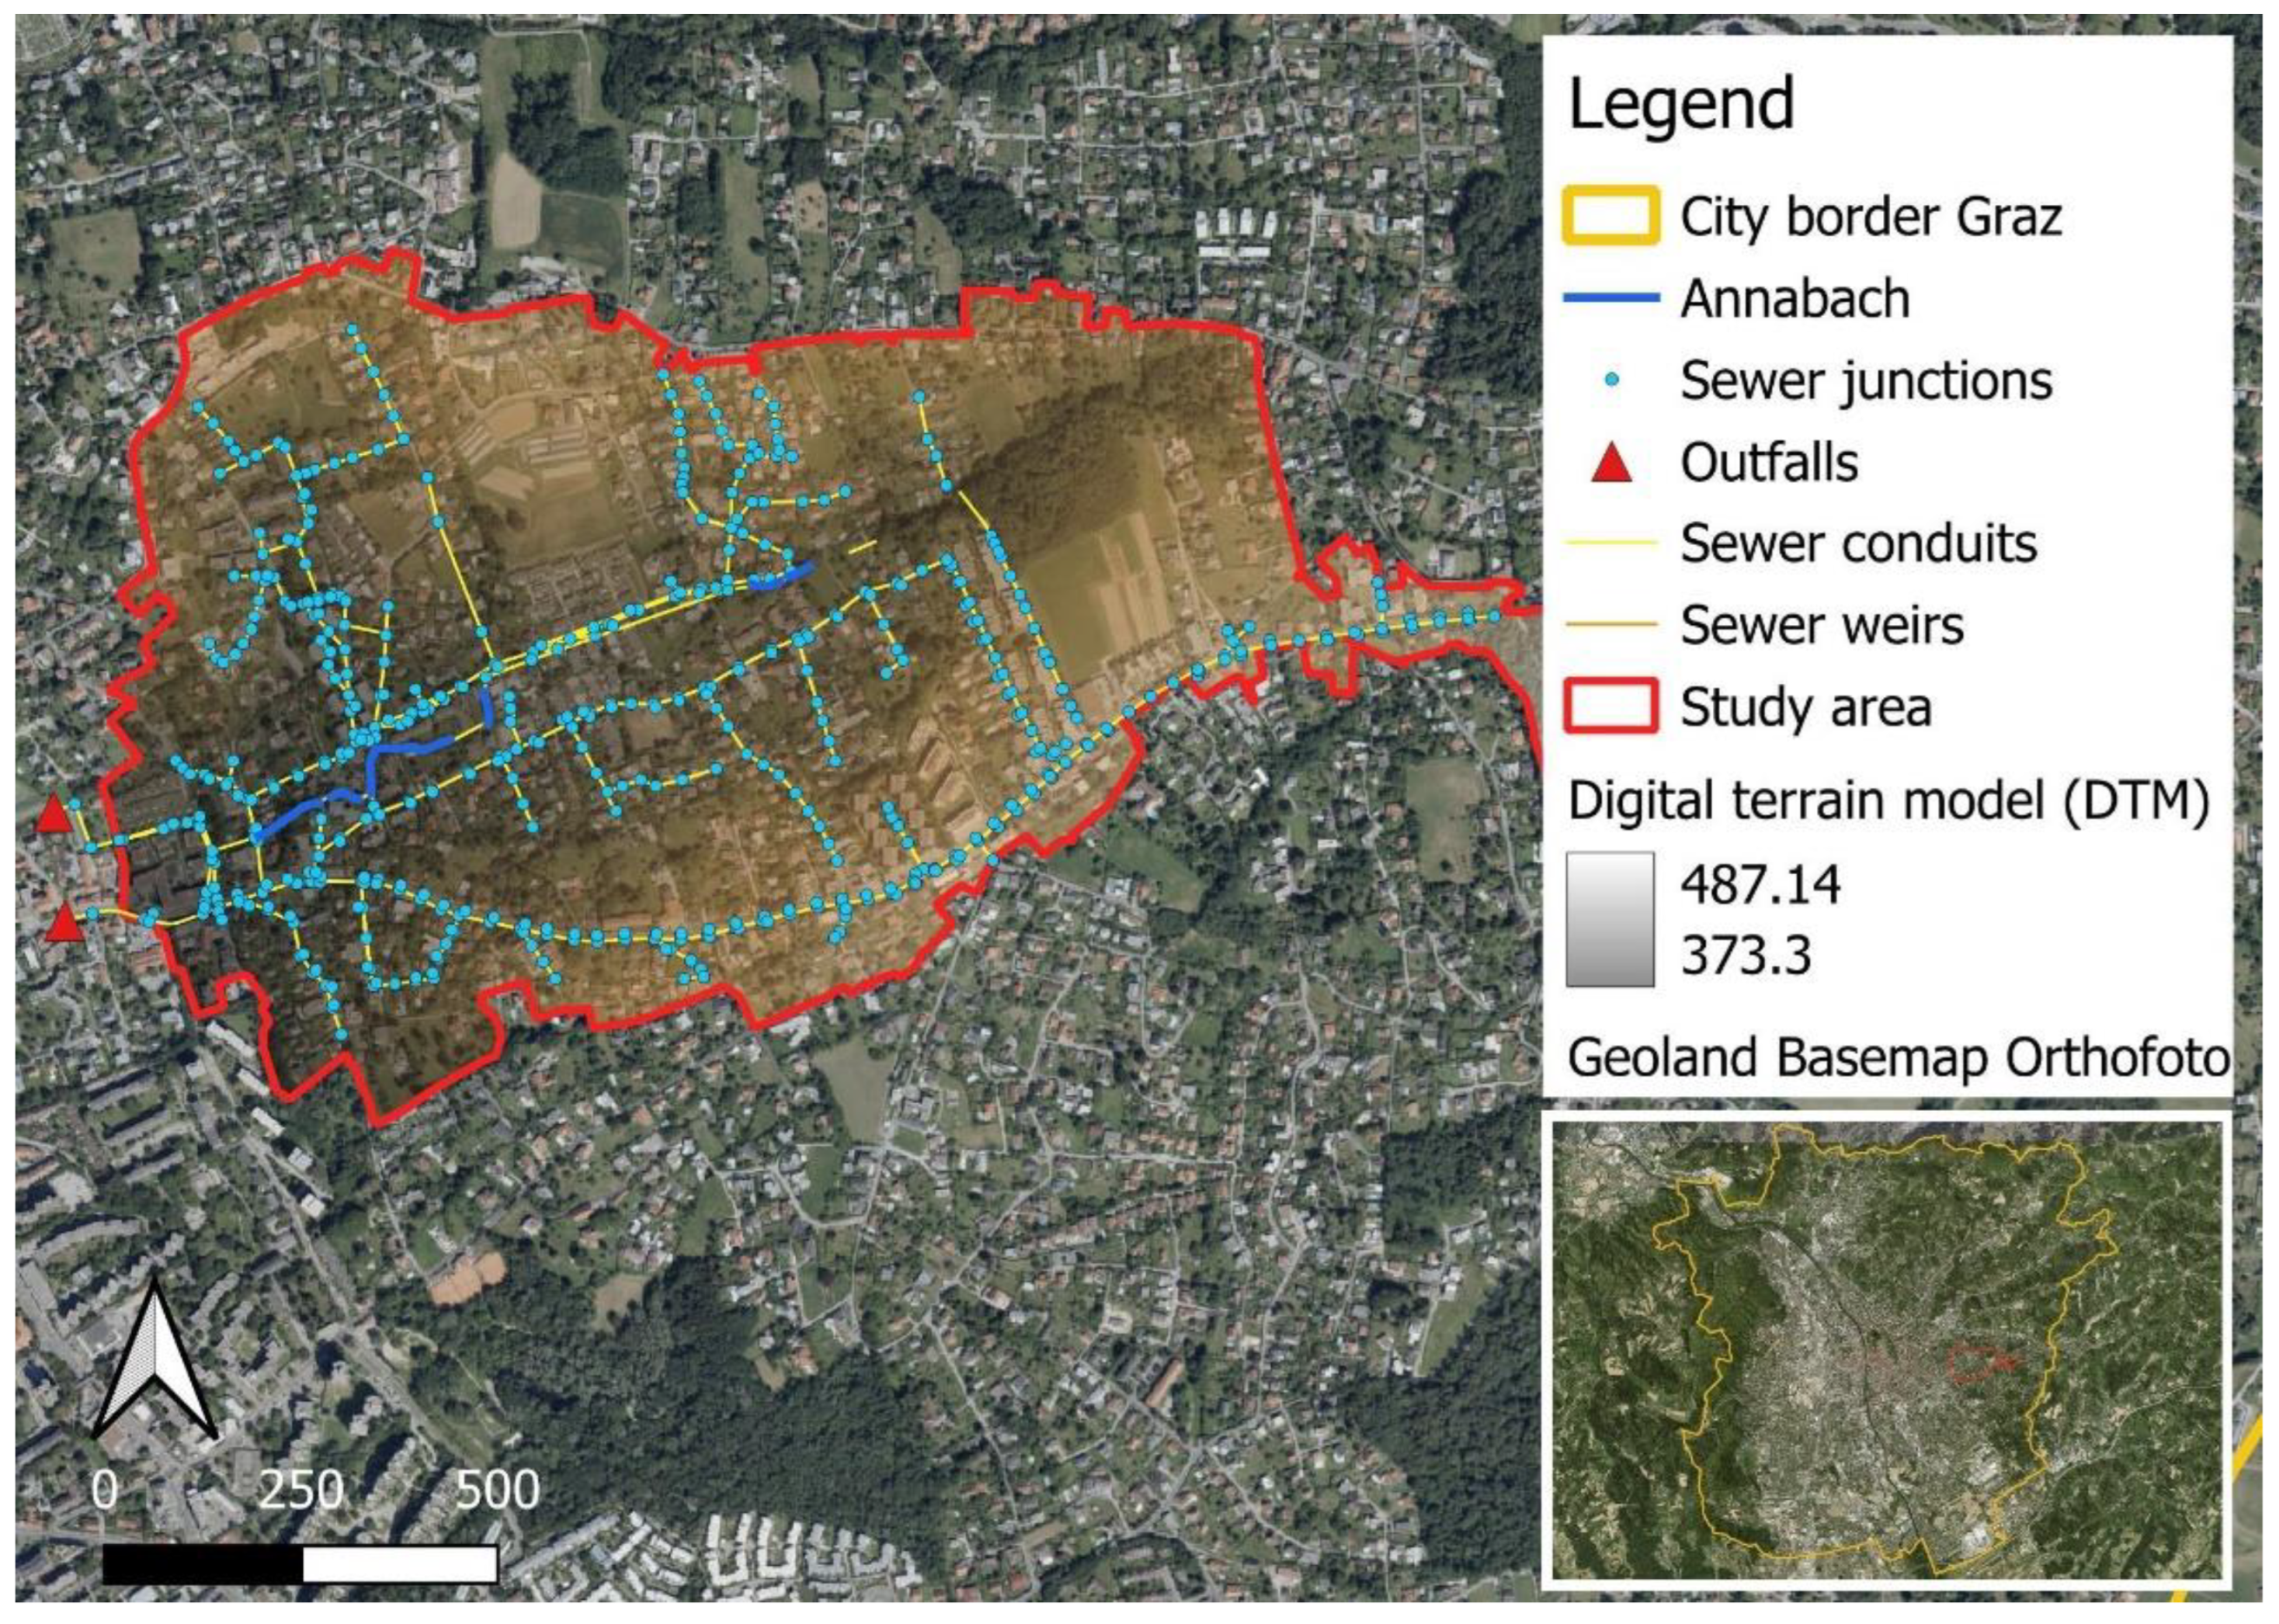
Figure 2.
Precipitation (mm/min) for the three real stormwater events on (a) 30 July 2021, (b) 13 August 2020, and (c) 4 August 2020.
Figure 2.
Precipitation (mm/min) for the three real stormwater events on (a) 30 July 2021, (b) 13 August 2020, and (c) 4 August 2020.

Figure 3.
Examples of the 5 different types of inlets in reality and in model representation (green are storage elements, pink are orifice elements and blue are weirs with an outlet): (a) basement window, (b) window with funnel, (c) window with infiltration gravel bed, (d) door/garage door, and (e) underground garage door with trench drain.
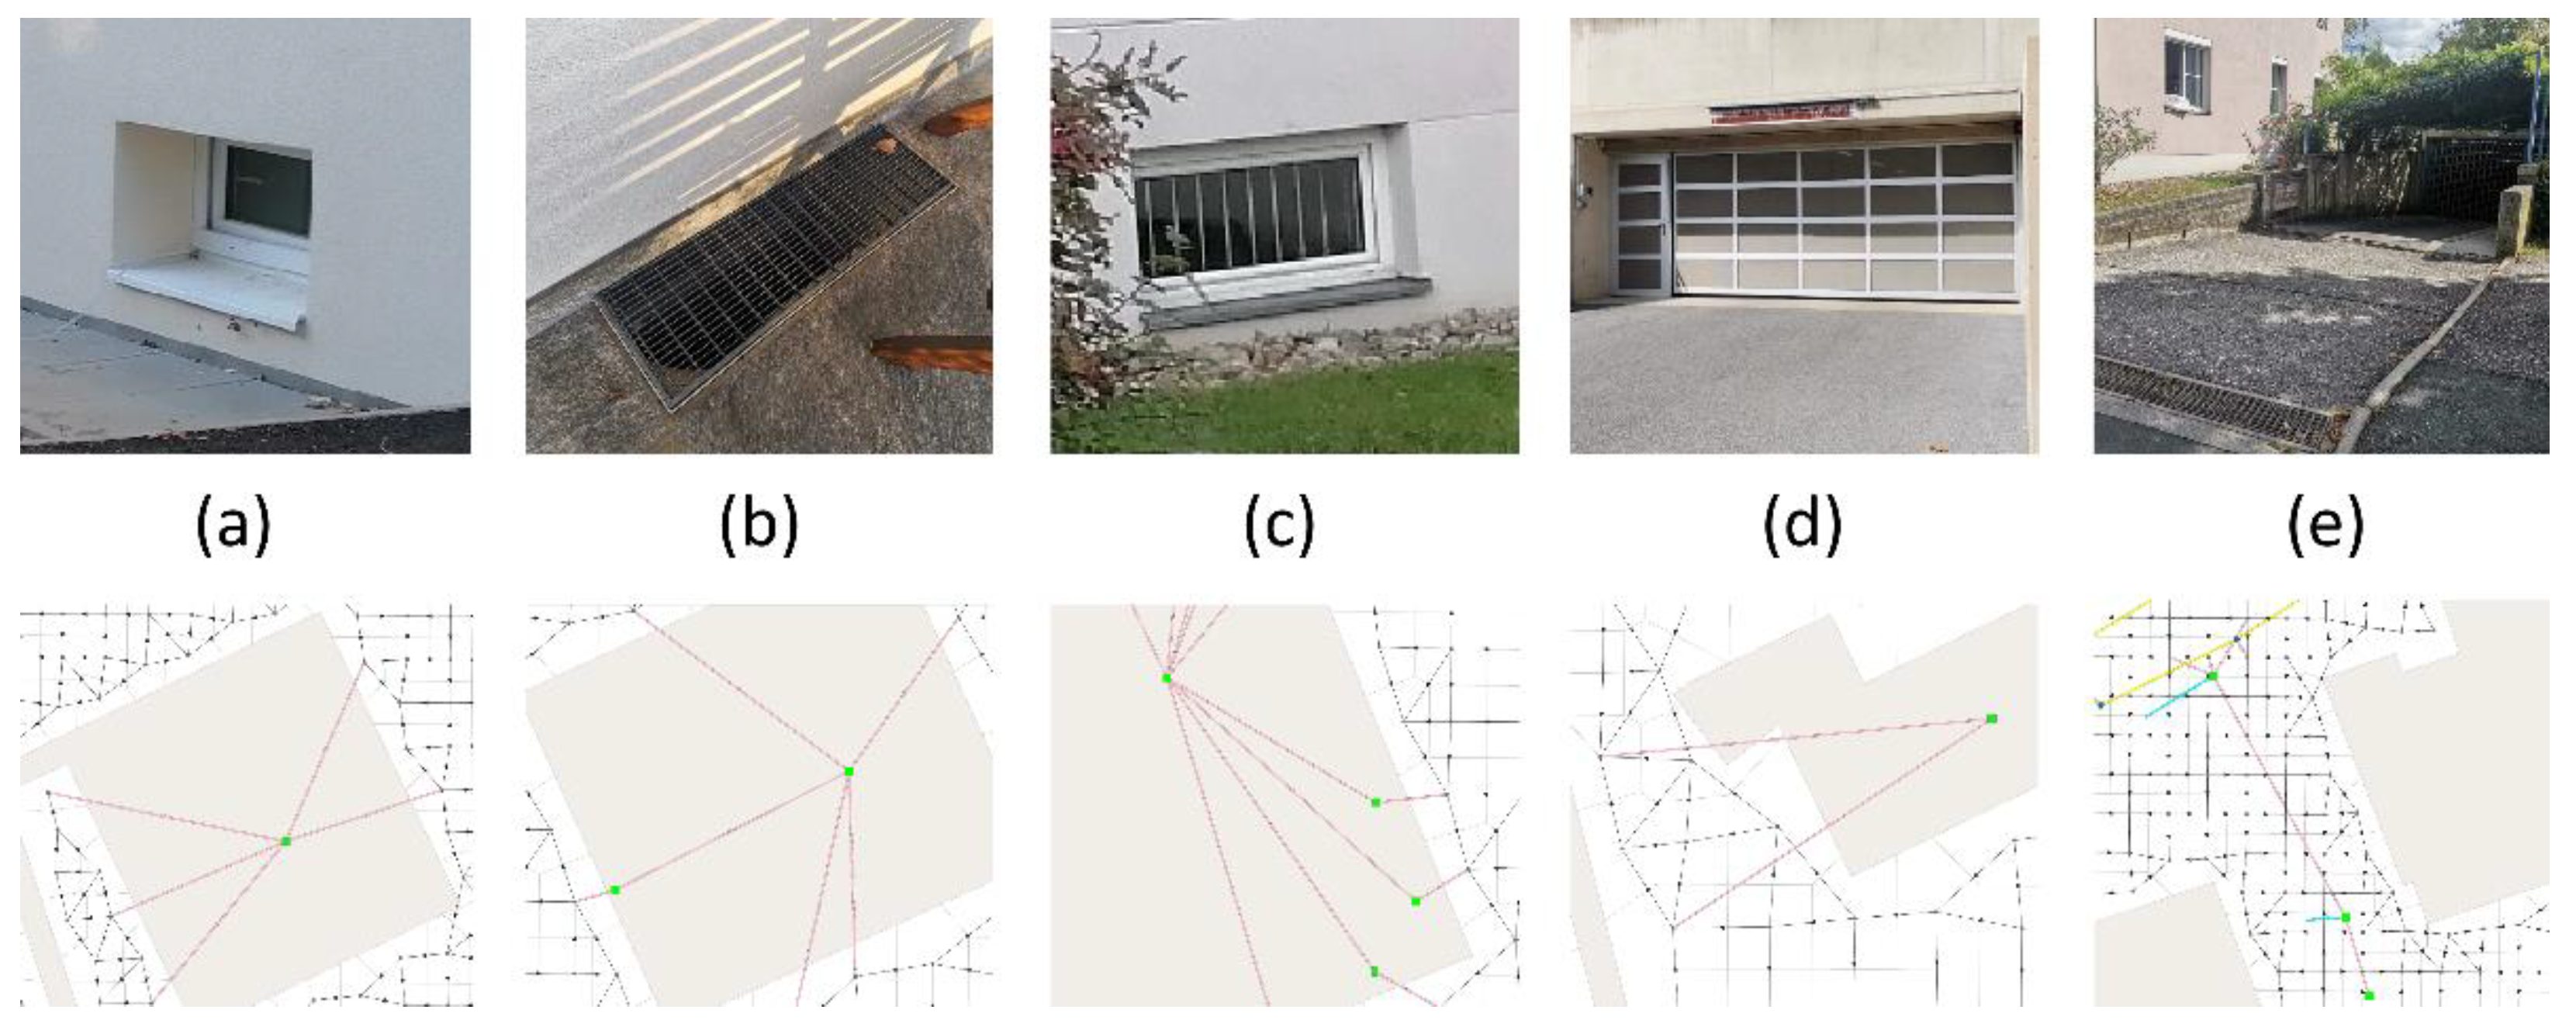
Figure 4.
Overlaid flood area in the (a) reference scenario (dark blue), (b) unconditional scenario (light blue), and (c) conditional scenario (blue) for the event on 30 July 2021.
Figure 4.
Overlaid flood area in the (a) reference scenario (dark blue), (b) unconditional scenario (light blue), and (c) conditional scenario (blue) for the event on 30 July 2021.
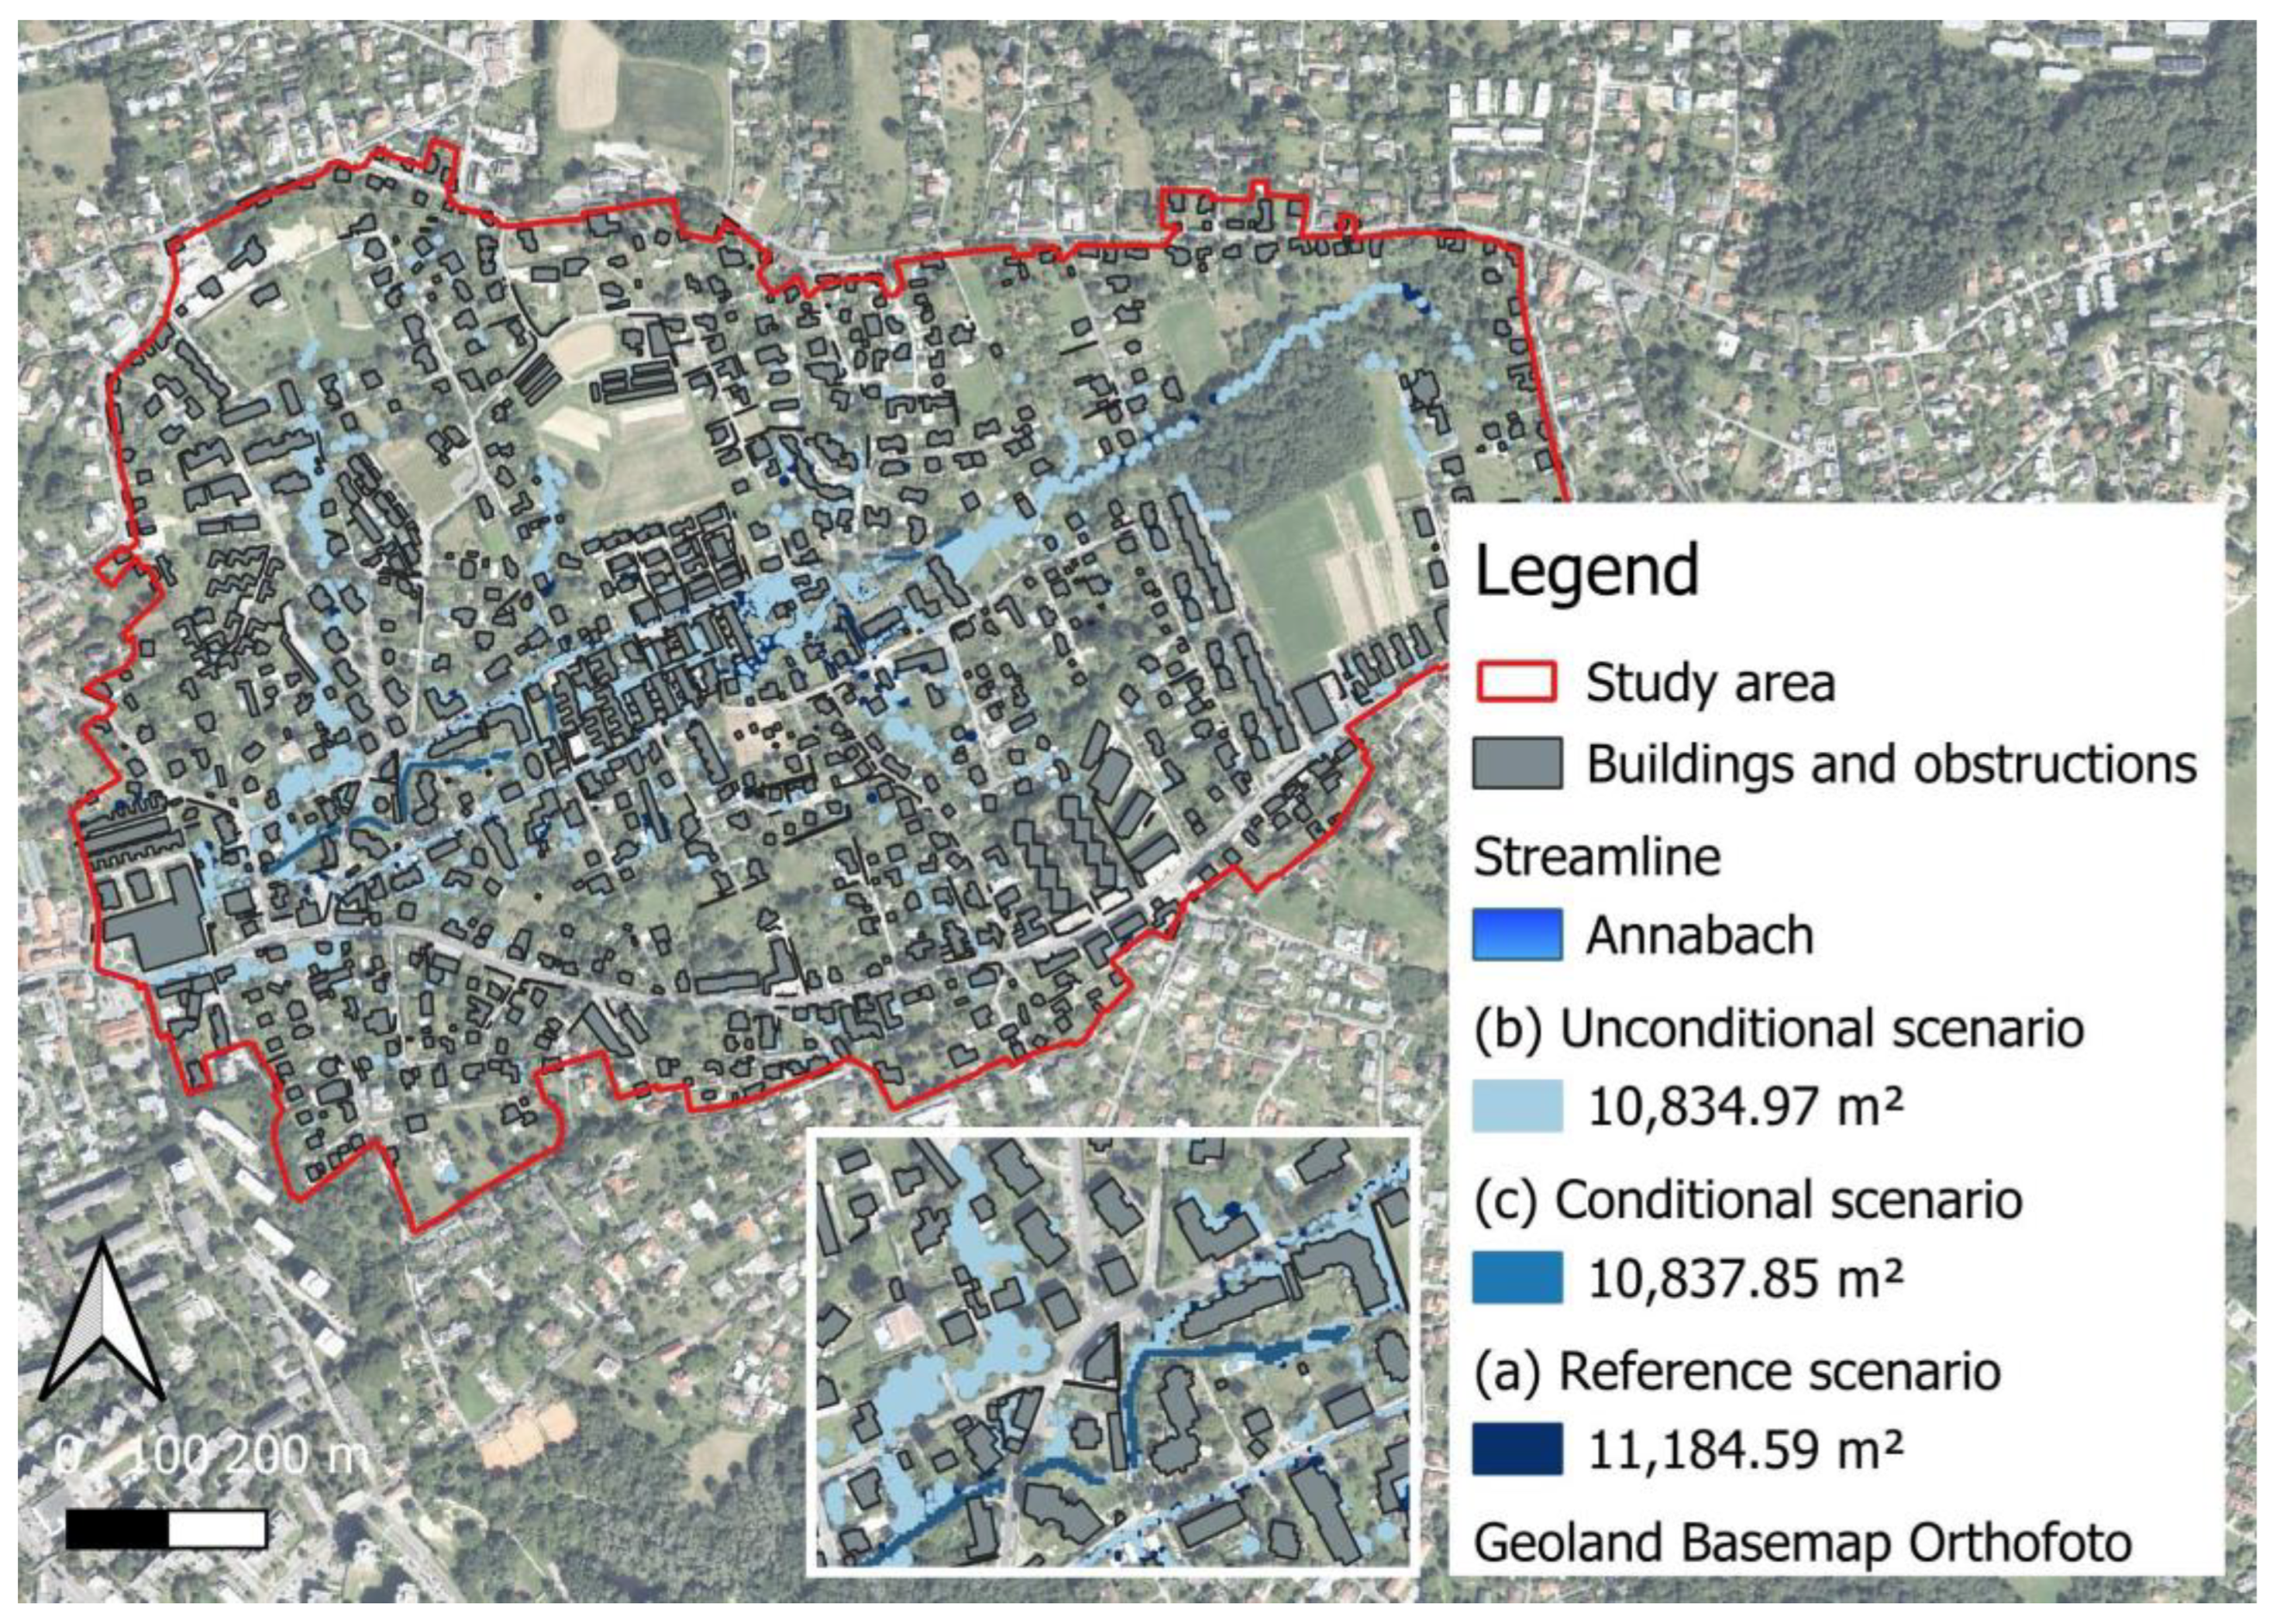
Figure 5.
Boxplot of the sensitivity analysis comparing the stored volume in the underground structures (m3) and the flood volume on the surface for different percentages of randomly placed underground structures.
Figure 5.
Boxplot of the sensitivity analysis comparing the stored volume in the underground structures (m3) and the flood volume on the surface for different percentages of randomly placed underground structures.

Table 1.
Utilised information, data, and data sources.
| Utilised Information/Data | Data | Source |
|---|---|---|
| Calibrated model used for including the underground structures 1D | 1D/2D model in SWMM | Reinstaller et al. [22] |
| Precipitation (1 min resolution) | 4 August 2020, 13 August 2020, 30 July 2021 | Graz city measurement network (GCMN) [38] |
| Identification of underground structures (Assumptions have been made for information that could not be obtained.) | Google Earth | |
| Site visits | Own experience | |
| Information sheet | Document provided by the city council “Building and Facilities Authority” of Graz |
Table 2.
Max. stored flood volume (m3) within the structures and number of flooded structures for all three events for the unconditional (b) and the conditional (c) scenarios.
Table 2.
Max. stored flood volume (m3) within the structures and number of flooded structures for all three events for the unconditional (b) and the conditional (c) scenarios.
| Max. stored volume within the underground structures (m3) | |||
| 30 July 2021 | 13 August 2020 | 4 August 2020 | |
| (b) Unconditional scenario | 2539 | 1193 | 423 |
| (c) Conditional scenario | 2378 | 1134 | 441 |
| Number of flooded underground structures | |||
| 30 July 2021 | 13 August 2020 | 4 August 2020 | |
| (b) Unconditional scenario | 56 | 42 | 27 |
| (c) Conditional scenario | 48 | 36 | 23 |
Table 3.
Minimum, maximum, and median numbers of affected buildings for different percentages of buildings with underground structures (US).
Table 3.
Minimum, maximum, and median numbers of affected buildings for different percentages of buildings with underground structures (US).
| Percentage of Buildings with US (%) | Max. Number | Min. Number | Median |
|---|---|---|---|
| 10 | 15 | 3 | 11 |
| 20 | 24 | 10 | 18 |
| 30 | 34 | 16 | 25 |
| 40 | 41 | 26 | 34 |
| 50 | 50 | 31 | 40 |
| 60 | 55 | 38 | 45 |
| 70 | 61 | 46 | 54 |
| 80 | 68 | 55 | 62 |
| 90 | 74 | 64 | 69 |
| 100 | 75 | 75 | 75 |
Table 4.
Manual sensitivity analysis of the threshold values in the control strategy.
| Water Level in Condition 1 | Affected Basements | Affected Garages | Sum |
|---|---|---|---|
| 0.02 m + 0.2 m/s | 46 | 8 | 54 |
| 0.05 m + 0.2 m/s | 40 | 8 | 48 |
| 0.10 m + 0.2 m/s | 34 | 5 | 39 |
| Velocity in condition 2 | Affected basements | Affected garages | Sum |
| 0.05 m + 0.05 m/s | 41 | 8 | 49 |
| 0.05 m + 0.2 m/s | 40 | 8 | 48 |
| 0.05 m + 0.5 m/s | 13 | 0 | 13 |
| Percentage of opening (%) | Affected basements | Affected garages | Sum |
| 5 | 40 | 8 | 48 |
| 20 | 40 | 8 | 48 |
| 50 | 40 | 8 | 48 |
| 100 | 40 | 8 | 48 |
Disclaimer/Publisher’s Note: The statements, opinions and data contained in all publications are solely those of the individual author(s) and contributor(s) and not of MDPI and/or the editor(s). MDPI and/or the editor(s) disclaim responsibility for any injury to people or property resulting from any ideas, methods, instructions or products referred to in the content. |
© 2024 by the authors. Licensee MDPI, Basel, Switzerland. This article is an open access article distributed under the terms and conditions of the Creative Commons Attribution (CC BY) license (https://creativecommons.org/licenses/by/4.0/).
Share and Cite
MDPI and ACS Style
Hauser, M.; Reinstaller, S.; Oberascher, M.; Muschalla, D.; Kleidorfer, M. The Impact of Underground Structures on Urban Flood Models. Water 2024, 16, 170. https://doi.org/10.3390/w16010170
AMA Style
Hauser M, Reinstaller S, Oberascher M, Muschalla D, Kleidorfer M. The Impact of Underground Structures on Urban Flood Models. Water. 2024; 16(1):170. https://doi.org/10.3390/w16010170
Chicago/Turabian StyleHauser, Martina, Stefan Reinstaller, Martin Oberascher, Dirk Muschalla, and Manfred Kleidorfer. 2024. "The Impact of Underground Structures on Urban Flood Models" Water 16, no. 1: 170. https://doi.org/10.3390/w16010170
Note that from the first issue of 2016, this journal uses article numbers instead of page numbers. See further details here.