
Study of a Tailings Dam Failure Pattern and Post-Failure Effects under Flooding Conditions

1
School of Resources and Environmental Engineering, Jiangxi University of Science and Technology, Ganzhou 341000, China
2
Zijin (Changsha) Engineering Technology Co., Ltd., Changsha 410006, China
3
Jiangxi Province Key Laboratory of Mining Engineering, Jiangxi University of Science and Technology, Ganzhou 341000, China
*
Author to whom correspondence should be addressed.
Water 2024, 16(1), 68; https://doi.org/10.3390/w16010068
Submission received: 15 November 2023
/
Revised: 19 December 2023
/
Accepted: 21 December 2023
/
Published: 23 December 2023
(This article belongs to the Special Issue Advanced Research on Hydraulic Engineering and Hydrological Modelling)
Abstract
:Tailings dams are structures that store both tailings and water, so almost all tailings dam accidents are water related. This paper investigates a tailings dam’s failure pattern and damage development under flood conditions by conducting a 1:100 large-scale tailings dam failure model test. It also simulates the tailings dam breach discharge process based on the breach mode using FLOW-3D software, and the extent of the impact of the dam failure debris flow downstream was derived. Dam failure tests show that the form of dam failure under flood conditions is seepage failure. The damage manifests itself in the form of flowing soil, which is broadly divided into two processes: the seepage stabilization phase and the flowing soil development damage phase. The dam failure test shows that the rate of rise in the height of the dam saturation line is faster and then slower. The order of the saturation line at the dam face is second-level sub-dam, third-level sub-dam, first-level sub-dam, and fourth-level sub-dam. The final failure of the tailings dam is the production of a breach at the top of the dam due to the development of the dam’s fluid damage zone to the dam top. The simulated dam breach release results show that by the time the dam breach fluid is released at 300 s, the area of over mud has reached 95,250 square meters. Local farmland and roads were submerged, and other facilities and buildings would be damaged to varying degrees. Based on the data from these studies, targeted measures for rectifying hidden dangers and preventing dam breaks from both technical and management aspects can be proposed for tailings dams.
1. Introduction
1.1. Research Status
The mud wastewater containing tailings will be discharged after metal and non-metal mine beneficiation. Tailings slurry contains mercury, arsenic, and other heavy metal ions, both resources and pollution sources [1]. The tailings dam is a dam body formed by the accumulation and rolling of the tailings after the mine selects the useful components [2]. It is of great significance to research the dynamic stability of tailings reservoirs for mine safety production, protection of downstream life and property safety, and the surrounding environment [3]. Tailings dams, an important source of danger if an accident, are bound to people’s lives and property [4]. In 2008, a dam break accident occurred in the 980 ditch tailings pond of Shanxi Xinta Mining Co., Ltd., Yuncheng, China, resulting in 281 deaths and 33 injuries. The direct economic loss was as high as CNY 96,192,000 [5]. On the afternoon of 30 April 2006, the tailings dam of Zhen’an Gold Mine in Shaanxi Province was constructed. The accident caused 17 people to disappear, five people were injured, and 76 houses were destroyed [6,7].
In many tailings reservoir accidents, due to the lack of flood discharge capacity of flood discharge structures in the reservoir area, flood overtopping, tailings dam break, and other phenomena occur occasionally [8,9]. In this regard, scholars in related fields have performed much research and achieved certain results. Chen Zhang et al. [10] established three-dimensional and two-dimensional finite element models. The seepage field of the project under different operating conditions was simulated, and the safety factor under different operating conditions was obtained by combining the seepage field with the stable surface. The influence of the length of the dry beach and the upstream slope ratio on the seepage and stability of the tailings dam was determined. Sánchez-Peralta et al. [11] took a dry tailings pond in Colombia as the research object, studied the movement characteristics of dam break debris flow with different water contents, and obtained the relationship between the length and width of dam break debris flow movement. Changbo Du et al. [12] studied and analyzed the influence of reinforcement on tailings dam and the change law of pore water pressure and internal pressure of the dam body after mud discharge. The pore water pressure and internal earth pressure of the accumulation dam after grouting gradually increased with time. Reinforcement can greatly reduce the pore water pressure and internal pressure of reinforced dams. Gregor Petkovšek et al. [13] proposed a dam break model EMBREA-MUD to calculate the water and tailings outflow of the tailings reservoir and the corresponding break growth. Weile Geng et al. [14] conducted experimental research on the settlement deformation and mesostructure evolution of unsaturated tailings under continuous load. The results showed that the mesostructure deformation of unsaturated tailings with different moisture contents under load was the same and could be divided into four stages: pore compression, elastic deformation, structure change, and further compaction. Alan Lolaev et al. [15] developed a method to determine the tailings filtration and secondary consolidation coefficient in the process of alluvial according to the physical conditions, density, and water phreatic, and a mathematical model to calculate the consolidation time. Kun Wang et al. [16] proposed a multidisciplinary program to simulate the dam break runoff of hypothetical tailings reservoirs on the downstream complex terrain using UAV photogrammetry and smooth particle hydrodynamics (SPH) numerical method. Rawya M. Kansoh [17] studied the influence of the earth-rock dam’s structural parameters on the dam failure process. Kehui Liu et al. [18] studied the microscopic characteristics of hydraulic erosion of reinforced tailings dams and revealed the influence of different reinforcement spacing on the critical start-up speed of tailings particles. It shows that the smaller the reinforcement spacing, the greater the critical start-up speed of the reinforced tailings samples. Luca Piciullo et al. [19] proposed a regression analysis that considers the functional relationship between the release amount and the characteristics of the tailings dam, such as height and water storage (i.e., dam factor). The effects of construction type, filling material, and failure mode on the release amount were also evaluated, as well as the failure frequency of the tailings dam as a function of the construction method. Tailing dams built using upstream construction methods are more prone to failure and are more susceptible to static and dynamic liquefaction. Chunhui Ma et al. [20] pointed out that a reasonable construction schedule and flexible waterproof material are key features of impervious bodies for dams with significant deformation. When the dam deformation becomes stable, consideration should be given to secondary treatment of the impervious body to enhance dam safety. Fukumoto et al. [21] used finite element software to simulate the seepage failure process caused by seepage. Alibek Issakhov et al. [22] combined the k-ω turbulence model to study this process numerically. The VOF (volume of fluid) method was used to simulate the fluid movement behind the tailings dam during the break-up of the fluid and the riverbed landscape. Yonas B. Dibike et al. [23] A two-dimensional hydrodynamic and component transport model was used to study the effect of OS tailings release on the water quality and sediment quality of LAR by simulating sediments and related chemicals. It was concluded that the tailings release location was different; 40% to 70% of the sediments and related chemicals were deposited on the riverbed of the 160 km study section, while the remaining sediments and related chemicals left the study area in the first three days after the release event. Research conducted by Xiaofei Jing et al. [24] investigated the overflow characteristics of tailings dams reinforced with steel bars. During the overflow process, they measured dam displacements, saturation lines, and internal stresses. The study demonstrated that the erosion resistance of tailings dams significantly improves with an increase in the number of reinforcement layers. Abdellah Mahdi et al. [25] studied the potential consequences of a hypothetical oil sand tailings dam failure. For this reason, a non-Newtonian dam–dam model with a viscoplastic rheological relationship is used. The model can reproduce the flood and water level changes in downstream lakes (due to destructive waves). The simulation study of oil sand tailings overflow proves the importance of considering the non-Newtonian characteristics of tailings. Naeini et al. [26] used SIGMA/W and QUAKE/W software to analyze the high-middle line tailings dam’s dynamic response and permanent deformation and evaluated the dam’s performance. Mohammad Reza Boroomand [27] used the numerical analysis method to analyze the earth dam’s seepage under the uncertainty of geotechnical parameters and analyzed the seepage of the earth dam under the condition of uncertainty of geotechnical parameters. Sumin Li et al. [28] simulated and analyzed the hazard range, degree, and spatial state of sediment flow after the dam break and obtained the influence of sand flow velocity, flow depth, and impact on the downstream villages in the disaster area. The feasibility of the expansion and heightening of the tailings dam project was demonstrated, and the disaster risk levels of different spatial locations in the downstream villages were obtained through simulation. Through experiments, Kong et al. [29] studied the influence parameters of tailings dams under seepage. They concluded that the particle size gradation, non-uniformity coefficient, and water content of tailings sand were the main factors affecting the critical hydraulic gradient. It is concluded that the seepage failure gradient with suitable gradation, uniform particles, and suitable water content is significantly higher than that with poor gradation, uneven particles, and poor water content.
Flood overtopping and seepage failure account for 80% of the total accidents, and these two failure forms mainly occur in flood season and are closely related to water. Therefore, it is necessary to explore the tailings dam failure mode, development process, and the impact on the downstream after dam failure under flood conditions to ensure its safe operation. Based on the engineering background of a tungsten mine tailings dam in Ganzhou City, Jiangxi Province, a 1:100 physical model test was carried out to explore the dam break form and failure development process of the tailings dam under flood conditions. The FLOW-3D fluid simulation software was used to solve the influence of the tailings dam on the downstream after the dam break, and the change law of the flow area, velocity development, and submerged depth of the dam break fluid during the flood discharge process was analyzed. Finally, reasonable prevention and remediation suggestions are proposed for the hidden dangers of tailings dams.
The innovation of this paper is to determine the dam break mode and dam break position of the tailings dam under flood conditions by constructing a physical model, which provides a basis for simulating the influence of dam break on the downstream of the dam body.
1.2. Research Flowchart
The research flowchart of this paper is shown in Figure 1.
2. Design and Construction of Large Physical Models
2.1. Overview of the Prototype Tailings Dam
The prototype tailings dam is a tungsten tailings dam located in a narrow valley running north–south in Ganzhou City, Jiangxi Province, China. The downstream of the tailings accumulation dam is farmland, dormitory buildings, mountain roads, etc., and the valleys in the downstream are relatively open. Figure 2 shows an overhead view of the prototype tailings dam. The tailings dam is built using the upstream damming method. The initial dam is a clay core wall weathering material dam located at the mouth of the northern valley. The bottom elevation is 262.0 m, the top elevation is 284.0 m, the dam height is 22 m, the upstream and downstream slope ratio is 1:2.5. The design average external slope ratio of the tailings accumulation dam is 1:5, the average slope of the tailings deposition beach is 5%, the design final tailings accumulation dam elevation is 368.00 m, the total dam height 106.00 m, with a complete storage capacity of 1550 × 104 m3 and a service life of 65 years. The present top elevation of the stacked dam is about 315 m, the height of the dam is 53 m, the accumulated storage capacity is about 559 × 104 m3, and the average external slope ratio of the stacked dam is 1:4.9. The reservoir is currently a fourth-class reservoir, with a flood protection standard of one in 200 years. At a later stage, it will be a second-class reservoir with a flood protection standard of 1000 years.
2.2. Selection of Model Sand
To ensure the relative reliability of the test results, the selected dam materials are properly relaxed to meet the primary conditions of similar main influencing factors. The model test focuses on the agglomeration effect of particle movement during the deformation of the dam body. For the selection of model sand, the initial dam is built with silty clay, and the accumulation dam adopts the mine prototype tailings. Figure 3 is the particle size distribution curve of the model sand. According to the particle size distribution curve, two quantitative indexes of soil particles can be determined: non-uniformity coefficient Cu and curvature coefficient Cc. Cu and Cc can jointly determine the gradation of soil. The expressions of the two are:
The calculated Cu and Cc of the model sand are 2.29 and 0.84, respectively. It is generally believed that the sand soil with Cu < 5 or Cc outside 1~3 belongs to the poorly graded soil, so the model sand is determined to be the poorly graded soil. If the seepage failure occurs in the dam, the development mode of seepage failure can be predicted by some parameters of the soil, that is, whether the soil is piping or flowing soil. According to the non-uniform coefficient discrimination method proposed by the former Soviet Union scholar Istomina, it is preliminarily judged that the model sand is a flowing soil-type soil.
2.3. Construction of the Dam Failure Model
The dam break process of a tailings reservoir involves many aspects, such as hydraulics, mud and sand dynamics, and soil mechanics. It involves many disciplines and is highly complex, which leads to the similarity relationship of model tests.
Therefore, we must put aside the generality of similarity and focus on the similarity of critical elements. This experiment uses the engineering background of a tungsten mine tailings dam in Jiangxi Province, China. The similarity criterion is appropriately relaxed, and the accumulation effect of particle movement during the deformation of the dam body is emphasized to construct the physical model.
Under the condition of geometric similarity, the physical model test of the 1:100 large-scale tailings dam is carried out according to the level of the second-class reservoir of the prototype tailings dam. The prototype range of the tailings dam is 1200 m × 700 m, and the model size is 12 m × 7 m. The model mainly comprises bedrock, a dam body, an observation system, and a water supply circulation system. The specific steps are as follows: According to the topographic map data provided by the mine, the three-dimensional model of the prototype tailings dam is established using Civil-3D modeling software (ver.2018) according to the size of the actual tailings dam (Figure 4). Then, several vertical sections are cut out in the model with the east–west direction as the standard line, and the points on each vertical section are taken equidistantly to extract the elevation value of each point on each vertical section. The model is intended to build a model with an elevation of 230 m in the actual terrain. The steel frame structure of the bedrock is made based on the elevation of each point on the vertical section. The square steel pipe is used as the bedrock support. Each steel pipe corresponds to the elevation of its relative point in proportion. Finally, the waterproof cloth is covered on the steel frame group and fixed to obtain a complete view of the bedrock terrain. Figure 5 is the completed mountain steel frame group, and Figure 6 is the complete bedrock after laying waterproof cloth.
The initial dam is piled up with silty clay. In the process of stacking the initial dam, two PVC pipes with holes in the wall body and tightly wrapped with permeable geotextiles are symmetrically buried at the bottom of the initial dam to simulate the drainage pipe. A valve is installed at the outlet end of the two drainage pipes to control the drainage speed. The sub-dam uses the pipeline method commonly used in the mine to simulate the ore drawing. An ore drawing main pipe is introduced from the slurry pool to start the ore drawing from the model’s right side, and a valve is set in the main pipe to control the flow rate of the square ore. When the pulp flows into the tailings pond, the tailings will be layered and precipitated under hydraulic screening. After precipitation, the ore is suspended when the tailings reach the target dam height. Start to build the next sub-dam, use the layered filling method to build the dam body to the design elevation, and use the vertical line method to control the elevation when building the dam. (Figure 7) is the construction of the second sub-dam. Four pore water pressure gauges are buried in the dam construction process to monitor the position of the saturation line of the dam body. The four pore water pressure gauges’ positions are arranged along the dam body’s central axis. They are located directly below the dam crest of the first-, second-, third-, and fourth-level accumulation dams. They are named as site 1, site 2, site 3, and site 4 (Figure 8).
Due to the need to supply a large amount of water for the test, a water tower was placed on the site (Figure 9), and a return water collection system was designed to achieve a water supply cycle (Figure 10). The observation equipment of the test (Figure 11) uses a trinocular camera and a high-definition camera to record the dam break process of the tailings dam.
3. Tailings Dam Break Model Experiment
The dam failure mode under specific flood conditions is characterized by permeation damage, manifested as soil erosion. Through analysis of experimental phenomena and data, the development process of dam failure is elucidated, revealing the variation patterns of pore water pressure at different locations and the saturation line of the dam body.
3.1. Dam Failure Experiment
The test was carried out by intermittently injecting water into the reservoir to simulate flood conditions, keeping the flow rate stable during the injection, and keeping the drainage pipe open during the whole test. The beginning of the water injection was taken as the beginning of the test, and the entire dam break test lasted 448 min. It can be roughly divided into two stages, each accounting for one-half of the total length. Figure 12 shows a typical picture of the damage to the dam during the test. Figure 13 shows a timeline of the test damage development. The specific tailings dam damage development process is as follows:
The first stage is seepage stabilization: the overflow water is clear, the dam’s surface is stable, and there is no movement of particles. At 138 min of the test, the contact zone between the right end of the second sub-dam and the bedrock began to seep first (Figure 12a). The seepage water flows along the contact zone between the dam body and the bedrock and overflows down the dam face. There are two reasons for the seepage here. The first is fine cracks in the contact area between the soil and the bedrock, which provides a breakthrough for the seepage water. The second is based on calculating the data collected by the pore water pressure gauge. It can be seen that the saturation line at this time escapes on the slope of the second sub-dam, where the dam surface overflows. Subsequently, the second-stage sub-dam continued to seep, and the overflow area gradually expanded and merged with the second-stage sub-dam dam surface. At 174 min, the third-stage sub-dam began to overflow on the left side (Figure 12b). At this time, according to the collected data, it can be calculated that the buried depth of the saturation line has been exposed to the third-level sub-dam. At 190 min, the first sub-dam also overflowed (Figure 12c). Then, the sand boiling point appears at the right end of the first-stage sub-dam, and the soil particles fluctuate obviously with the overflow water. The sand boiling causes the soil particles to be continuously taken out of the soil body. At 203 min, the dam surfaces of the first, second, and third sub-dams have all become swampy.
The second stage is the development and failure stage of the flowing soil: seepage deformation occurs continuously, and more earthwork is lost. At 236 min, the first flow soil damage happened at the right end of the second sub-dam (Figure 12d). The failure form is flow slip. At 239 min, a second flow soil damage occurred on the left side of the first sub-dam (Figure 12e). The flow-slipping soil will form a pit that evolves into a breach, making the seepage velocity and seepage flow faster and larger. Then, the pit part of the soil slides, and the seepage water erodes the downstream dam surface. At 248 min, two erosion ditches have been formed in the flow soil failure area on both sides of the dam (Figure 12f,g).
The erosion gully on the left side is located at the junction of the right side of the first-order sub-dam and the bedrock. The critical hydraulic gradient is lower, the dominant flow develops more rapidly, the sand is wrapped violently, and the subsequent seepage damage is more likely to occur. The erosion gully produces more water flow to scour multiple branches on the dam’s surface. The right erosion ditch is located at the junction of the secondary dam and the bedrock. At this time, the erosion ditch has developed to a certain depth, and the sand boiling point has reached 6. The flowing soil migrates downward under the action of overflow water. The flowing water will bring the fine particles to the downstream area. The coarse particles will be accumulated to form a ‘filter layer‘ to block the overflow water channel. The seepage pressure on both sides of the filter layer gradually increases. A new seepage channel will be formed when the seepage pressure on one side reaches the critical value. At 292 min, the flow soil damage eroded to the third sub-dam and further developed upstream along the boundary. Part of the erosion gully’s inner wall soil is washed away underwater, and the internal wall forms holes and expands upward until the upper part forms a suspended surface. When the shear strength of the upper soil is greater than the shear strength of the soil, it will collapse and continue to repeat the next round of erosion. At this time, the left-flowing soil does not develop to the upstream failure but to the proper lateral erosion, and the right side flushes out a new channel due to the obstruction of the ‘filter layer‘. At 303 min, the third flow soil failure occurred on the left side of the third sub-dam (Figure 12h). Because of the increase in overflow water and the acceleration of water flow, the right scouring area opens the downstream channel at the particle deposition, and fine particles are continuously taken out of the dam by seepage water. The overflow water also washes away the ‘filter layer‘ on the left side. After that, the first sub-dam eroded to the deep, and the dam surface failure area did not expand. There is a hydraulic–gravity erosion cycle in the flow soil damage area of the second-stage sub-dam, which extends to the upstream and the middle of the dam body. With the increase in the erosion damage area of the water flow, the more the sand boiling point, the faster the seepage damage, and the erosion area of the lower section continues to expand, and the water flow in the erosion gully is large and fast. The flowing soil failure zone of the third-stage sub-dam has not yet formed a penetrating failure path and is in the initial stage of erosion. At 348 min, the fourth-stage sub-dam overflowed (Figure 12i). At 448 min, the flow soil was eroded to the fourth sub-dam (Figure 12j).
The flow soil damage area is eroded to the fourth sub-dam, which is regarded as the whole dam damage. It is measured that the depth of the collapse area is about 12 cm, and the width is about 80 cm. It should be noted that although the dam body has undergone a large area of seepage failure, the dam body has not yet experienced an unstable landslide. The tailings dam finally broke because the dam body soil damage zone developed to the top of the dam to produce a breach.
3.2. The Change Rule of the Saturation Line
Figure 14 is about the change curve of the saturation line. At the beginning of the test, as the upstream water level rose, the saturation line rose rapidly despite the drain being in a normal discharge condition. After the lifting of the head has ceased, the rate of the upward lifting of the saturation line becomes significantly slower due to the hysteresis effect. Then, a certain depth of burial is maintained. In the middle and late stages of the test, most of the dam had become saturated, and the soil matrix suction had weakened. When water is again stored in the reservoir, the saturation line will again lift, but at a reduced rate compared to the initial period. If the reservoir level is no longer raised, the saturation line tends to fall after a period of time. By approximately 270 min into the test, the dam face had already developed a certain size of the flow damage zone, and it was no longer meaningful to discuss the depth of the saturation line.
In the previous study [30], a two-dimensional finite element model of the tailings dam, chosen from the central axis of the three-dimensional tailings dam model, was used to analyze the distribution of saturation line in the tailings dam under flood conditions. The numerical simulation results show that when the upstream water head rose to 125 m (Figure 15), the saturation line intersected with the first and fourth-level accumulation dams and was exposed throughout the dam surface. The variation law of the saturation line obtained by the numerical simulation is consistent with the experimental phenomenon; that is, the saturation line increases with the rise of the reservoir water level, and the order of the dam surface exposure is the second-stage sub-dam, the third-stage sub-dam, the first-stage sub-dam, and the fourth-stage sub-dam. According to the simulation results, the displacement of the dam body does not change greatly, and the plastic strain zone does not appear on the slope and crest of the dam body, and there is no penetration. It can be judged that the tailings dam model does not have deep slip when the water level is about to overflow; that is, the skeleton structure of the dam body is stable. Combined with the physical model test, before the saturation line of the dam body reaches the dam surface of the fourth-level sub-dam, the tailings dam has undergone seepage failure, but the dam body has not undergone structural instability. The results of numerical simulation are consistent with the phenomenon of physical model test. After that, with the development of flowing soil, the damaged area of the dam body continues to extend to the top of the dam, which will eventually cause the breach of the dam top and cause the flood discharge of the dam.
4. Impact Analysis after Dam Break and Prevention Suggestions
Based on the results of the physical model experiment, it can be inferred that the tailings dam failure was triggered by seepage failure. This means the area of flowing soil gradually eroded upstream until a breach was created at the top of the dam, and the reservoir fluid poured downstream. Therefore, an erosion damage trench was set up on the model for the dam breach calculation in FLOW-3D (ver. 9.3), extending from the top of the initial dam to the top of the dam, and the shape was simplified to a semi-cylinder. Figure 16 shows a model of the tailings dam after completion of the pre-treatment.
4.1. Dam Failure Test Results
An overview of the area downstream of the tailings dam is shown in Figure 17. The downstream area is dominated by the production facilities (red and yellow line areas in the figure), staff accommodation buildings (pink line area), the road around the mountain (blue curve), villages (green line area), and scattered agricultural land.
4.1.1. Overflow Area
Figure 18 shows the change in the extent of fluid inundation at 60 s, 120 s, 180 s, 240 s, and 300 s as calculated by the software, with the fluid in blue in the figure. As can be seen from the diagram, the breached fluid was rapidly released downstream in a short period and, by 300 s, covered the entire flat area downstream, with an overflow area of approximately 95,250,000 square meters. Farmland and roads in the area will be flooded, and production facilities and residential buildings will also be affected. In addition, emergency escape plans can be challenging to implement successfully at short notice. It is thus clear that in the event of a breach of this tailings dam, it would be a major accidental disaster.
4.1.2. Flooding Depth
Figure 19 shows a cloud of the distribution of flooding depth at 60 s, 120 s, 180 s, 240 s, and 300 s. Due to the lower topography in the eastern part of the downstream area, the fluids that wash down first collect in the east and then spread westwards. As can be seen from the graph, the maximum inundation depth is always located in the eastern part of the lower reaches near the initial dam. The mudslide did not affect the northern area due to the terrain’s advantage; when the situation was urgent, people could be evacuated along the northwest-facing road to the north.
4.1.3. Flow Rate Analysis
The flow velocity during the release process reflects the magnitude of the fluid impact. Figure 20 shows the flow velocity clouds during the dam breach release process at 60 s, 120 s, 180 s, 240 s, and 300 s. Due to inertia, the fluid emerges from the breach. It rapidly completes the transformation from potential energy to kinetic energy in the trench eroded by the flowing soil, with the flow velocity reaching a maximum. In addition, there is some leakage around the dam at the junction of the tailings dam and the mountain. After the fluid is flushed off the tailings dam, the average flow velocity decreases due to the diffusion principle and frictional forces. In general, the flow of emissions increases and then falls.
Three points, A, B, and C, are selected in the flow direction of the release to analyze the fluid’s flow velocity characteristics, specifically during the dam failure process. The three points are located at the top of the initial dam, the foot of the initial dam, and the downstream area adjacent to the tailings dam (Figure 21). Figure 22 shows the variation in flow rate over time at three points. Overall, the flow velocities at points A, B, and C are successively reduced as the flow path develops. From the point of view of the flow velocity at a single point, it does not increase to a peak all at once but has an undulating, phased variation. At about 30 s, the overflow velocity starts to appear at the three points, after which the trend is a cyclic process of “increase-smooth or decrease” because the increase in flow velocity does not coincide with the expansion of the breach, which, in turn, determines the flow velocity of the discharge. The flow rate increases accordingly when the breach expands and becomes deeper again. After several cycles of this until the breach is no longer extended, the flow rate at points A, B, and C all fall during the last 30 s of the figures and will return to zero as the flooding stops.
The analysis of the variation in the flow rate of the release shows that the debris flow impacts downstream in a segmented manner. Therefore, the decrease in flow velocity should not be regarded as the end of the entire dam break, nor should blindly carry out the aftermath of the accident at this stage, but should wait for a longer period to observe and confirm so as not to cause more damage.
4.2. Recommendations for Prevention and Management
4.2.1. Technical Measures
Dam surface treatment: According to the seepage characteristics of the tailings dam, to prevent overflow water and rainwater from scouring the shoulder and face of the dam and to collect the seepage water, a shoulder drainage ditch should be installed along the junction of the dam with the slopes of the two banks, and a face drainage ditch should be installed on the face of the dam. Moreover, the downstream slope of the dam can be mulched, turfed, and, if necessary, reinforced by stone pitching at the foot of the dam.
Additional seepage facilities: Combined with the model test results, it is clear that control of the saturation line of the tailings dam should be a top priority for safety management. To effectively control the depth of the saturation line, additional drainage facilities can be provided in the form of a combined horizontal drainage pipe and a vertical shaft connected to the end of the horizontal drainage pipe. In addition, the vertical drainage pipe should be raised with the height of the stockpile dam and pumped out periodically.
4.2.2. Management Measures
Routine inspection and maintenance: Besides monitoring various safety indicators such as the tailings dam saturation line and dry beach length, the person responsible for safety should regularly inspect the dam body for cracks, collapses, and surface erosion. They should also ensure that the slope protection is intact and that the drainage facilities are clear of blockages, siltation, or waterlogging. Check for seepage, pipe surges, or flowing soil, focusing on the junction between the dam and the hills on either side, and be vigilant for changes in seepage flow and turbidity. If a potential problem is identified, the cause must be immediately determined, and remedial action must be taken to prevent it.
Ensure excellence in flood management, including pre-flood preparation, response during flooding, and post-flood rescue work.
5. Conclusions
- (1)
- The reservoir’s water level had not yet crested before the dam was damaged. In other words, the cause of dam failure under flood conditions is seepage failure, which manifests itself in the form of flowing soil. Before the flow soil is destroyed, the dam surface will produce overflow, water accumulation, sand boiling, and other phenomena. The phenomenon of the dam failure test shows that the flow soil damage starts at the weak point of the dam at the junction with the bedrock. These areas have a high saturation gradient and are more prone to local damage. In the early stage of soil flow failure, multiple sand boiling points were generated on the dam surface. With the development of seepage, collapsible cracks appeared on the dam surface one after another, forming erosion ditches. In the middle stage of soil failure, the failure area is widened. The soil cycle undergoes the process of erosion–gravity erosion, and the ‘filter layer’ will slow down the failure rate to a certain extent. In the later stage of flow soil damage, the flow water damage area began to penetrate, and the erosion intensified until the whole dam body was damaged. Therefore, when the sand boiling point is generated, and the collapsible cracks appear on the dam surface, these can be used as a warning sign of seepage failure.
- (2)
- The buried depth of the saturation line becomes shallow with the increase in the upstream water head. And, the rate of increase is first fast and then slow. After the lifting head is stopped, the saturation line will still rise slightly for a period of time due to the lag effect. If the reservoir water level is not replenished for a long time, the saturation line will be reduced under normal drainage. The order of the saturation line escaping from the dam surface is the second sub-dam, the third sub-dam, the first sub-dam, and the fourth sub-dam. It can be seen that before the flood, it is necessary to check and repair the drainage facilities to ensure their suitable operation. During the flood season, all measures should be taken to enhance the flood discharge, reduce the saturation line, and avoid the seepage damage of the tailings dam.
- (3)
- The results of the FLOW-3D hydrodynamic simulation software show that the breach fluid was rapidly discharged within a short period, covering the entire flat area downstream by 300 s. The local farmland and roads were submerged, and the rest of the construction facilities were also damaged to a certain extent. Therefore, it will be a major disaster once the tailings dam breaks. The rapid development of the dam breach mudslide and the short release time make it impractical to organize the evacuation of people when the release occurs. Therefore, in combination with the mechanism of tailings dam failure, targeted measures for potential remediation and dam failure prevention can be proposed from both technical and management aspects.
- (4)
- The innovation point is to use a large-scale physical model test to study the dam break mode of tailings dam under flood conditions. By monitoring the internal changes of the tailings reservoir under flood conditions, the stage of seepage failure of the dam body can be judged, which can serve as an early warning for the subsequent break of the tailings dam. The experimental process and experimental results of the model can provide a reference for the changes in tailings reservoir under flood conditions under real working conditions so as to correspond to the changes of tailings reservoir fluid under flood conditions under real working conditions. Provide guidance for staff to monitor changes in tailings ponds. The determination of dam break position and dam break mode by model test provides a basis for simulating the influence of tailings dam break on the downstream. The use of a steel frame structure to build a tailings dam model can cover the entire tailings dam terrain more comprehensively and economically and can more comprehensively analyze the entire dam break process of the tailings dam. Compared with the local tailings dam similarity simulation and on-site exploration, it is more profound and comprehensive, which has practical significance for the safety of the tailings reservoir. The defect is that there is a prototype of the model, and it cannot be used for all tailings mines. The actual situation needs to be analyzed in detail. In addition, according to the tailings pond model test, it can be expected that the tailings pond model can be used to study the useful mineral components in the recovery reservoir, which has practical significance for environmental protection and resource recovery.
Author Contributions
Software, J.L.; Data curation, B.L.; Writing—original draft, Z.G. and Z.T.; Visualization, M.W.; Supervision, W.H. All authors have read and agreed to the published version of the manuscript.
Funding
This study is supported by the National Natural Science Foundation of China under the project (No. 51604127 and No. 51874268) and the Science and Technology Innovation Talent Project of Ganzhou City (No. 202101094905).
Data Availability Statement
The data presented in this study are available on request from the corresponding author.
Conflicts of Interest
Author Zhong Gao was employed by the company Zijin (Changsha) Engineering Technology Co., Ltd. The remaining authors declare that the research was conducted in the absence of any commercial or financial relationships that could be construed as a potential conflict of interest.
References
- Yue, T.; Wu, X. Effect of magnetic starch on the clarification of hematite tailings wastewater. IOP Conf. Ser. Earth Environ. Sci. 2018, 121, 032051. [Google Scholar] [CrossRef]
- Jin, W.; Wei, Z. Research progress on land reclamation and environmental management benefit estimation of non-ferrous metal tailings reservoir. Environ. Sci. Res. 2019, 8, 1304–1313. (In Chinese) [Google Scholar]
- Kang, Z.; Han, Q.; Wang, S. umerical model of dynamic stability of a proposed tailings dam To be studied. Min. Res. Dev. 2015, 35, 59–62. [Google Scholar]
- Zhou, K.; Liu, F.; Hu, J.; Gao, F. Research on dam-break disaster chain and chain-breaking disaster reduction control technology of tailings reservoir. Disasterology 2013, 28, 24–29. (In Chinese) [Google Scholar]
- Chen, C.; Zhao, Y.; Jiang, L. Review on the current research of dam break of tailings pond. Min. Res. Dev. 2019, 39, 103–108. (In Chinese) [Google Scholar]
- Zhou, Z.; Li, X. Causes and ecological environment impact assessment of tailings dam break accident in China. Met. Mine 2012, 11, 121–124. (In Chinese) [Google Scholar]
- Zhou, L.; Huang, Y. Discussion on the causes and countermeasures of tailings reservoir accident. China Manganese Ind. 2016, 34, 37–39. (In Chinese) [Google Scholar]
- Yang, M.; Song, Z. A tailings reservoir based on flood calculation and flood routing analysis. China Met. Bull. 2020, 5, 263–264. (In Chinese) [Google Scholar]
- Zhang, X.; Song, Z.; Zhang, Z. Example analysis of a tailings pond flooded with a dam failure. Eng. Constr. 2020, 52, 44–48. (In Chinese) [Google Scholar]
- Zhang, C.; Chai, J.; Cao, J.; Xu, Z.; Qin, Y.; Lv, Z. Numerical simulation of seepage and stability of tailings dams: A case study in Lixi, China. Water 2020, 12, 742. [Google Scholar] [CrossRef]
- Sánchez-Peralta, J.A.; Beltrán-Rodríguez, L.N.; Trujillo-Vela, M.G.; Larrahondo, J.M. Flows of liquefied filtered tailings: Laboratory-scale physical and numerical modeling. Int. J. Civ. Eng. 2020, 18, 393–404. [Google Scholar] [CrossRef]
- Du, C.; Liang, L.; Yi, F.; Niu, B. Effects of geosynthetic reinforcement on tailings accumulation dams. Water 2021, 13, 2986. [Google Scholar] [CrossRef]
- Petkovšek, G.; Hassan, M.A.A.M.; Lumbroso, D.; Roca, M. A two-fluid simulation of tailings dam breaching. Mine Water Environ. 2021, 40, 151–165. [Google Scholar] [CrossRef]
- Geng, W.; Wang, W.; Wei, Z.; Huang, G.; Jing, X.; Jiang, C.; Tian, S. Experimental study of mesostructure deformation characteristics of unsaturated tailings with different moisture content. Water 2021, 13, 15. [Google Scholar] [CrossRef]
- Lolaev, A.; Oganesyan, A.; Badoev, A.; Oganesyan, E. Tailing dams formation algorithm. Arab. J. Geosci. 2020, 13, 974. [Google Scholar] [CrossRef]
- Wang, K.; Yang, P.; Yu, G.; Yang, C.; Zhu, L. 3D numerical modelling of tailings dam breach run out flow over complex terrain: A multidisciplinary procedure. Water 2020, 12, 2538. [Google Scholar] [CrossRef]
- Kansoh, R.M.; Elkholy, M.; Abo-Zaid, G. Effect of shape parameters on failure of earthen embankment due to overtopping. KSCE J. Civ. Eng. 2020, 24, 1476–1485. [Google Scholar] [CrossRef]
- Liu, K.; Cai, H.; Jing, X.; Chen, Y.; Li, L.; Wu, S.; Wang, W. Study on hydraulic incipient motion model of reinforced tailings. Water 2021, 13, 2033. [Google Scholar] [CrossRef]
- Piciullo, L.; Storrøsten, E.B.; Liu, Z.; Nadim, F.; Lacasse, S. A new look at the statistics of tailings dam failures. Eng. Geol. 2022, 303, 106–657. [Google Scholar] [CrossRef]
- Ma, C.; Gao, Z.; Yang, J.; Cheng, L.; Chen, L. Operation performance and seepage flow of impervious body in blast-fill dams using discrete element method and measured data. Water 2022, 14, 1443. [Google Scholar] [CrossRef]
- Fukumoto, Y.; Ohtsuka, S. 3-D direct numerical model for failure of non-cohesive granular soils with upward seepage flow. Comput. Part. Mech. 2018, 5, 443–454. [Google Scholar] [CrossRef]
- Issakhov, A.; Borsikbayeva, A. The impact of a multilevel protection column on the propagation of a water wave and pressure distribution during a dam break: Numerical simulation. J. Hydrol. 2021, 598, 126–212. [Google Scholar] [CrossRef]
- Dibike, Y.B.; Shakibaeinia, A.; Droppo, I.G.; Caron, E. Modeling the potential effects of Oil-Sands tailings pond breach on the water and sediment quality of the Lower Athabasca River. Sci. Total Environ. 2018, 642, 1263–1281. [Google Scholar] [CrossRef] [PubMed]
- Jing, X.; Chen, Y.; Williams, D.J.; Serna, M.L.; Zheng, H. Overtopping failure of a reinforced tailings dam: Laboratory investigation and forecasting model of dam failure. Water 2019, 11, 315. [Google Scholar] [CrossRef]
- Mahdi, A.; Shakibaeinia, A.; Dibike, B.Y. Numerical modelling of oil-sands tailings dam breach runout and overland flow. Sci. Total Environ. 2020, 703, 134–568. [Google Scholar] [CrossRef] [PubMed]
- Naeini, M.; Akhtarpour, A. Numerical analysis of seismic stability of a high centerline tailings dam. Soil Dyn. Earthq. Eng. 2018, 107, 179–194. [Google Scholar] [CrossRef]
- Boroomand, M.R.; Mohammadi, A. Evaluation of earth dam leakage considering the uncertainty in soil hydraulic parameters. Civ. Eng. J. 2019, 5, 1543–1556. [Google Scholar] [CrossRef]
- Li, S.; Yuan, L.; Yang, H.; An, H.; Wang, G. Tailings dam safety monitoring and early warning based on spatial evolution process of mud-sand flow. Saf. Sci. 2020, 124, 104–579. [Google Scholar] [CrossRef]
- Kong, X.; Liu, Y.; Li, X.; Li, R.; He, Y. Analysis and experimental study of mechanical factors of permeation damage of a uranium tailings pond dam. Eng. Saf. Environ. Prot. 2019, 45, 30–36. (In Chinese) [Google Scholar]
- He, W.; Chen, H.; Zheng, C. Experimental study on dam break of a tailings dam under flood conditions. J. Saf. Environ. 2022, 22, 3126–3134. (In Chinese) [Google Scholar]
Figure 1.
Research flowchart.

Figure 2.
Top view of a tailings dam.

Figure 3.
Cumulative distribution curve of particle size.
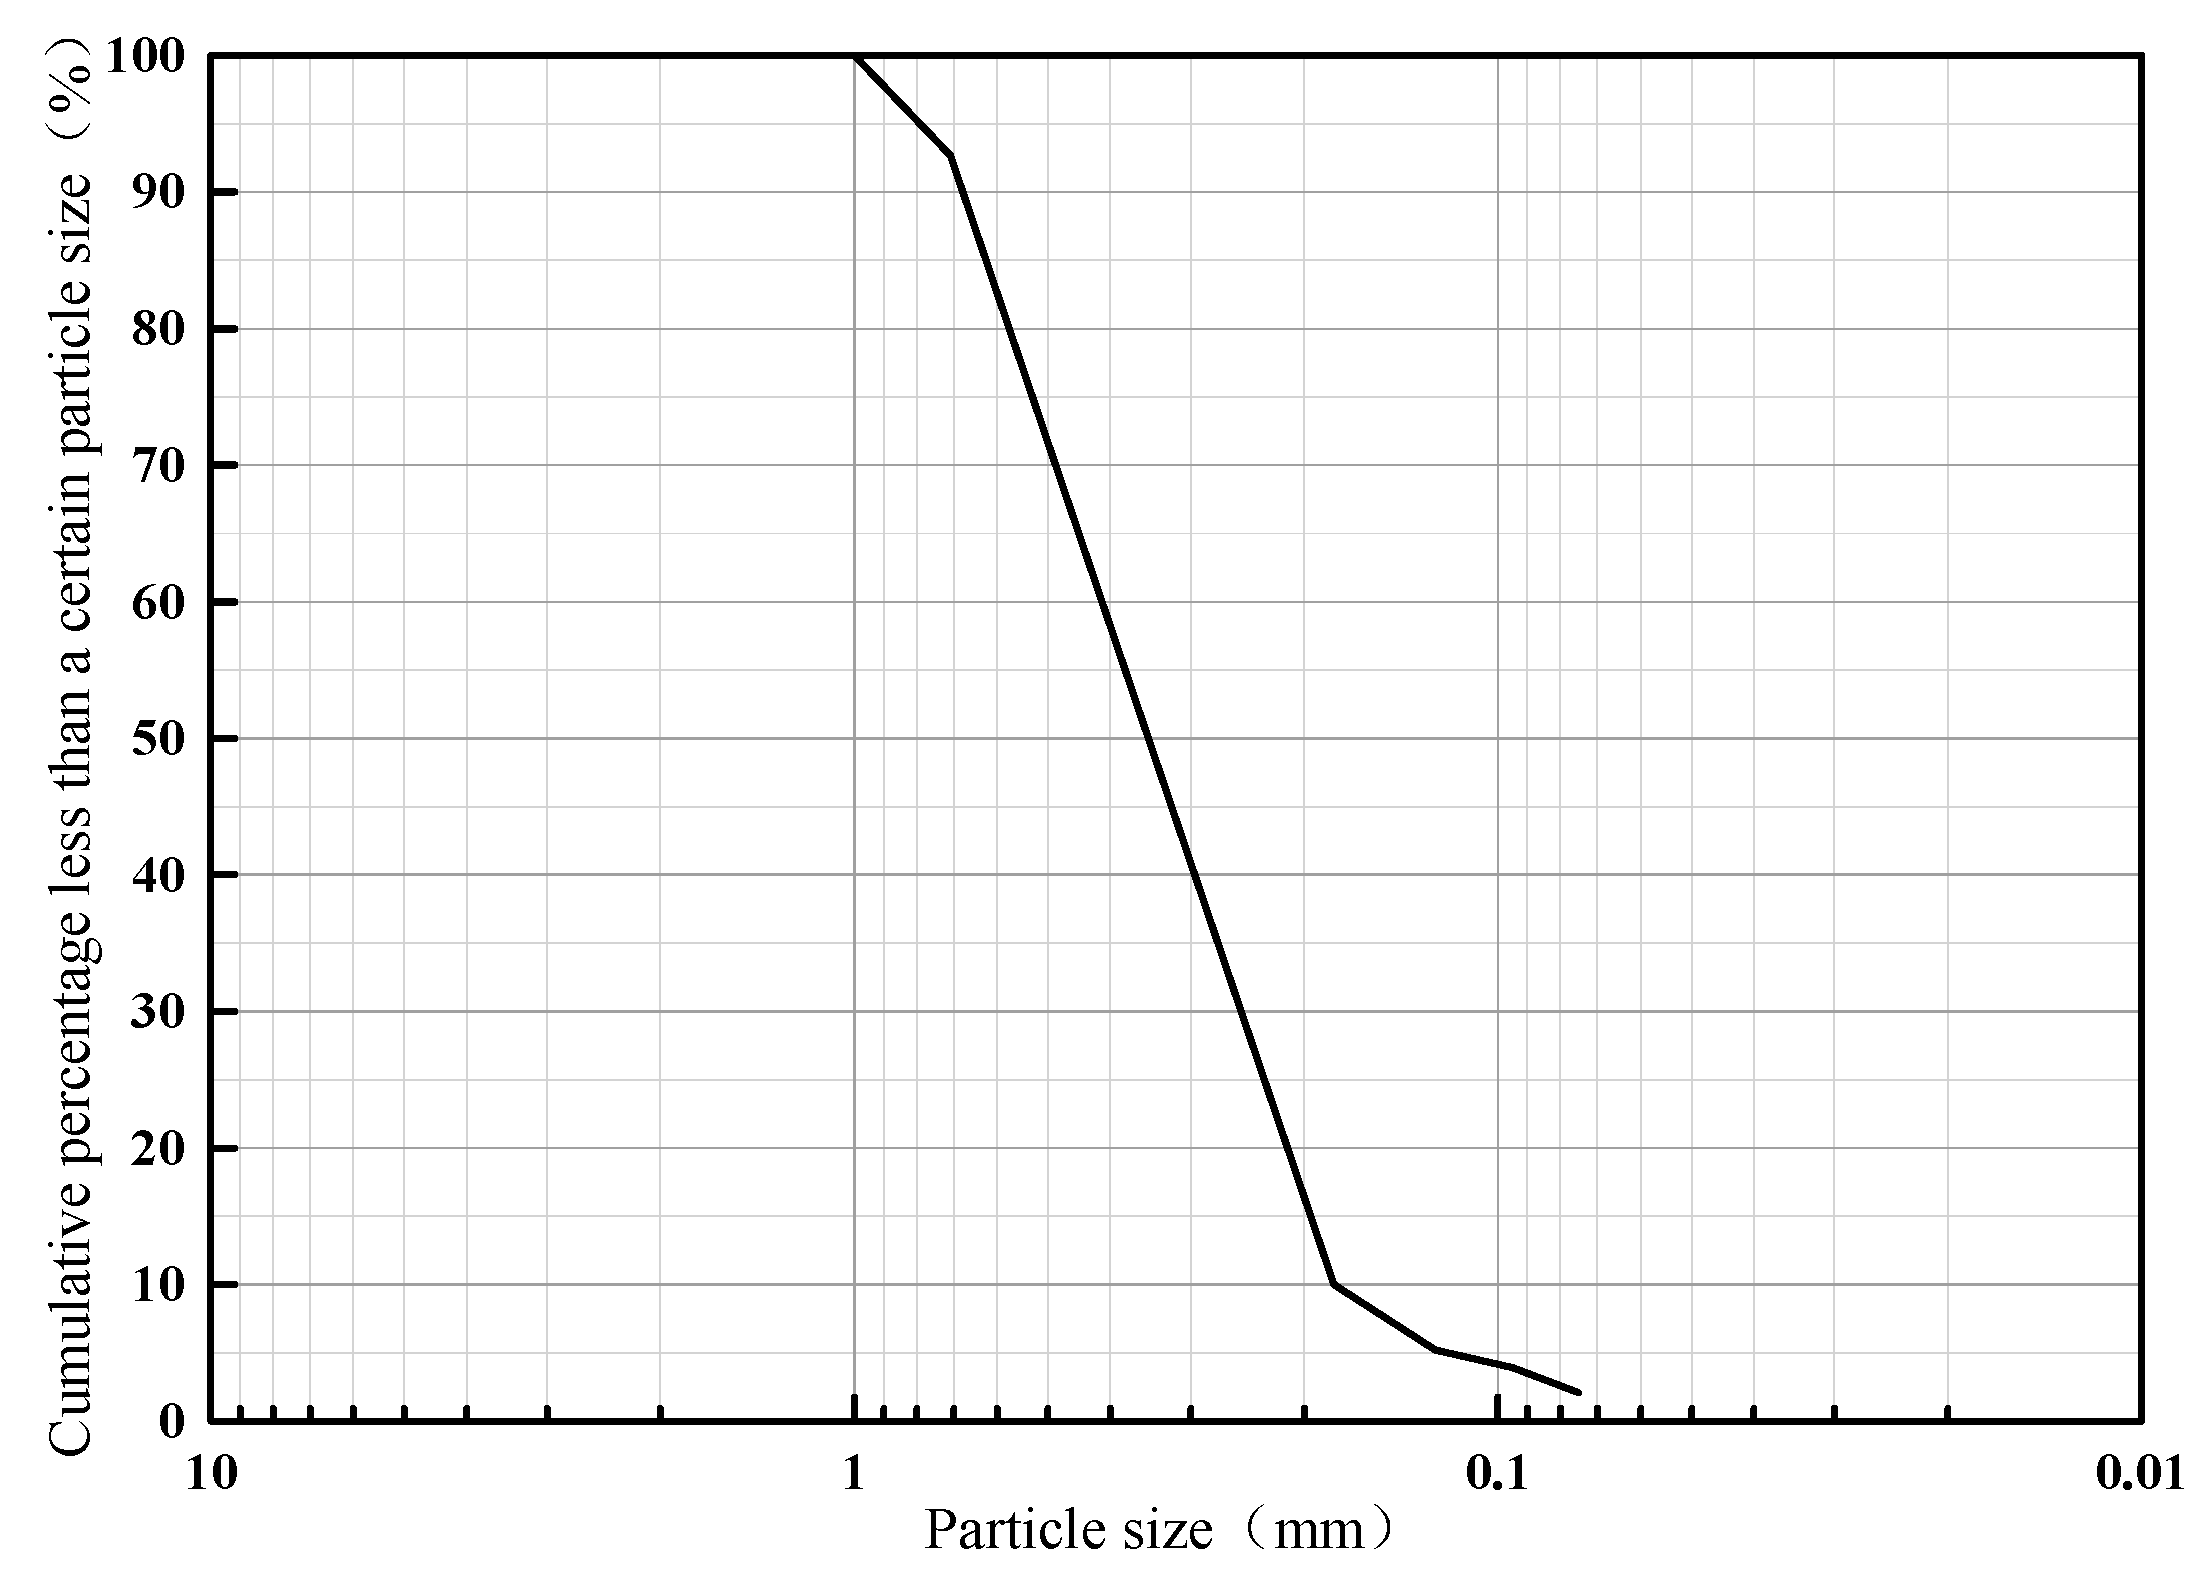
Figure 4.
Three-dimensional model of the tailings dam.
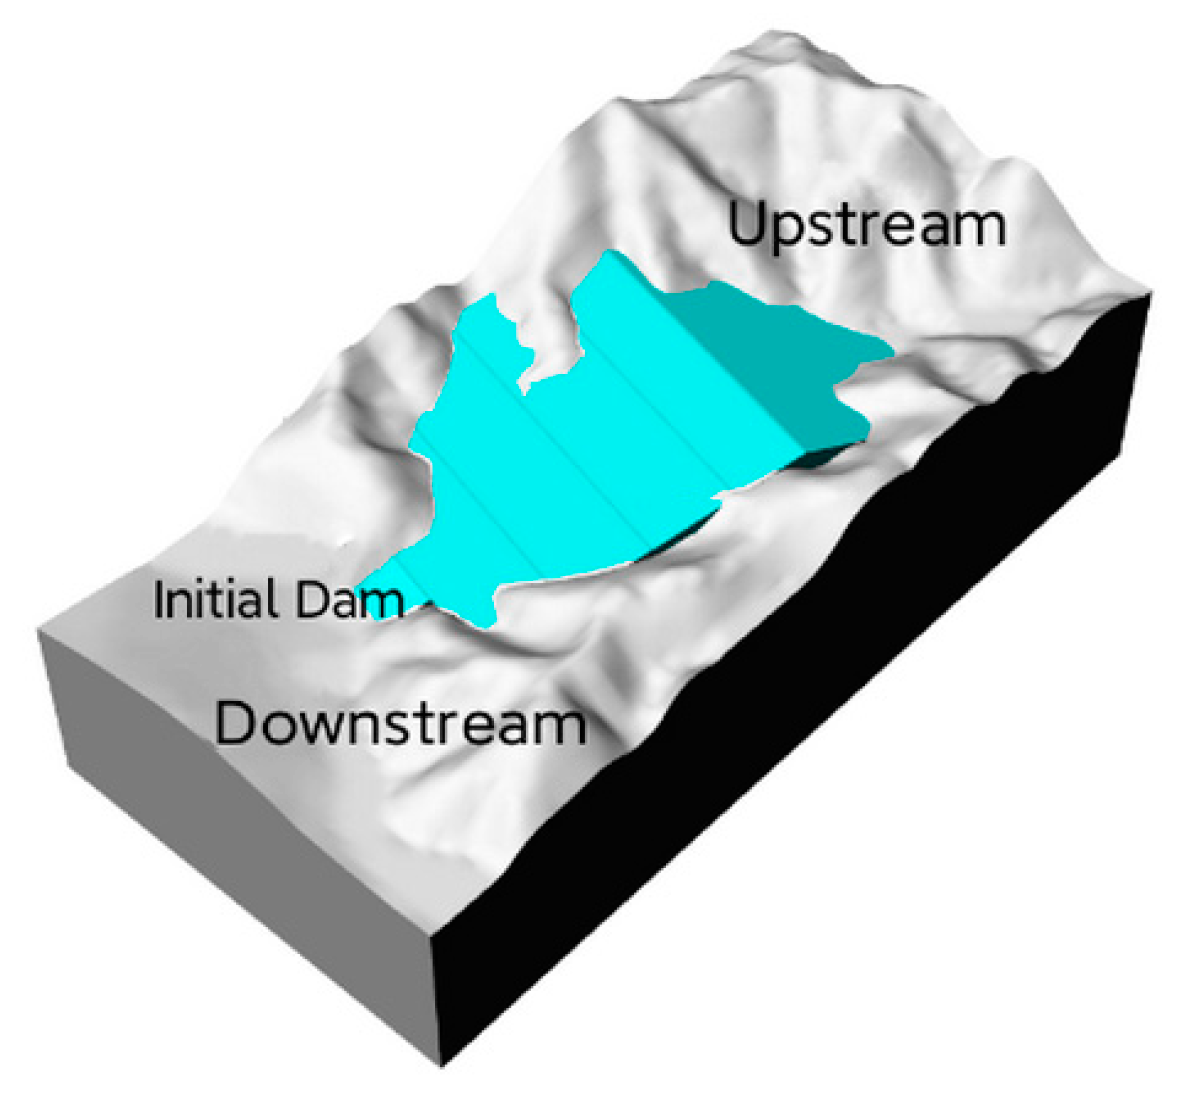
Figure 5.
Mountain support structures.
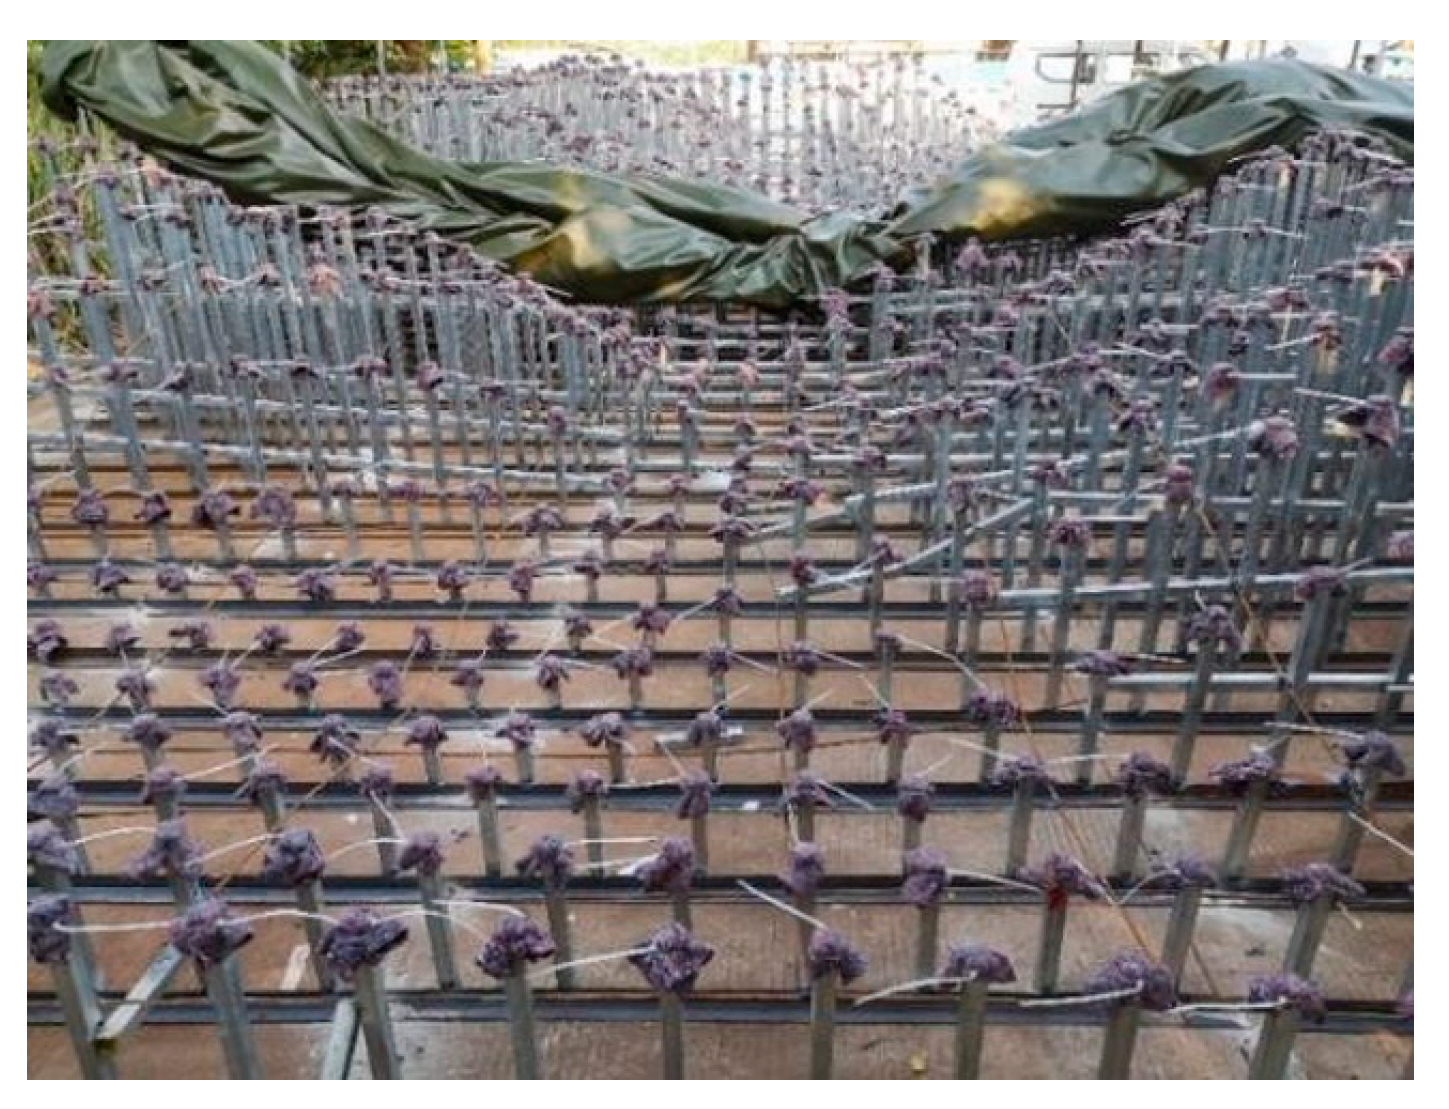
Figure 6.
A complete view of bedrock.

Figure 7.
Second-stage sub-dam stacking.
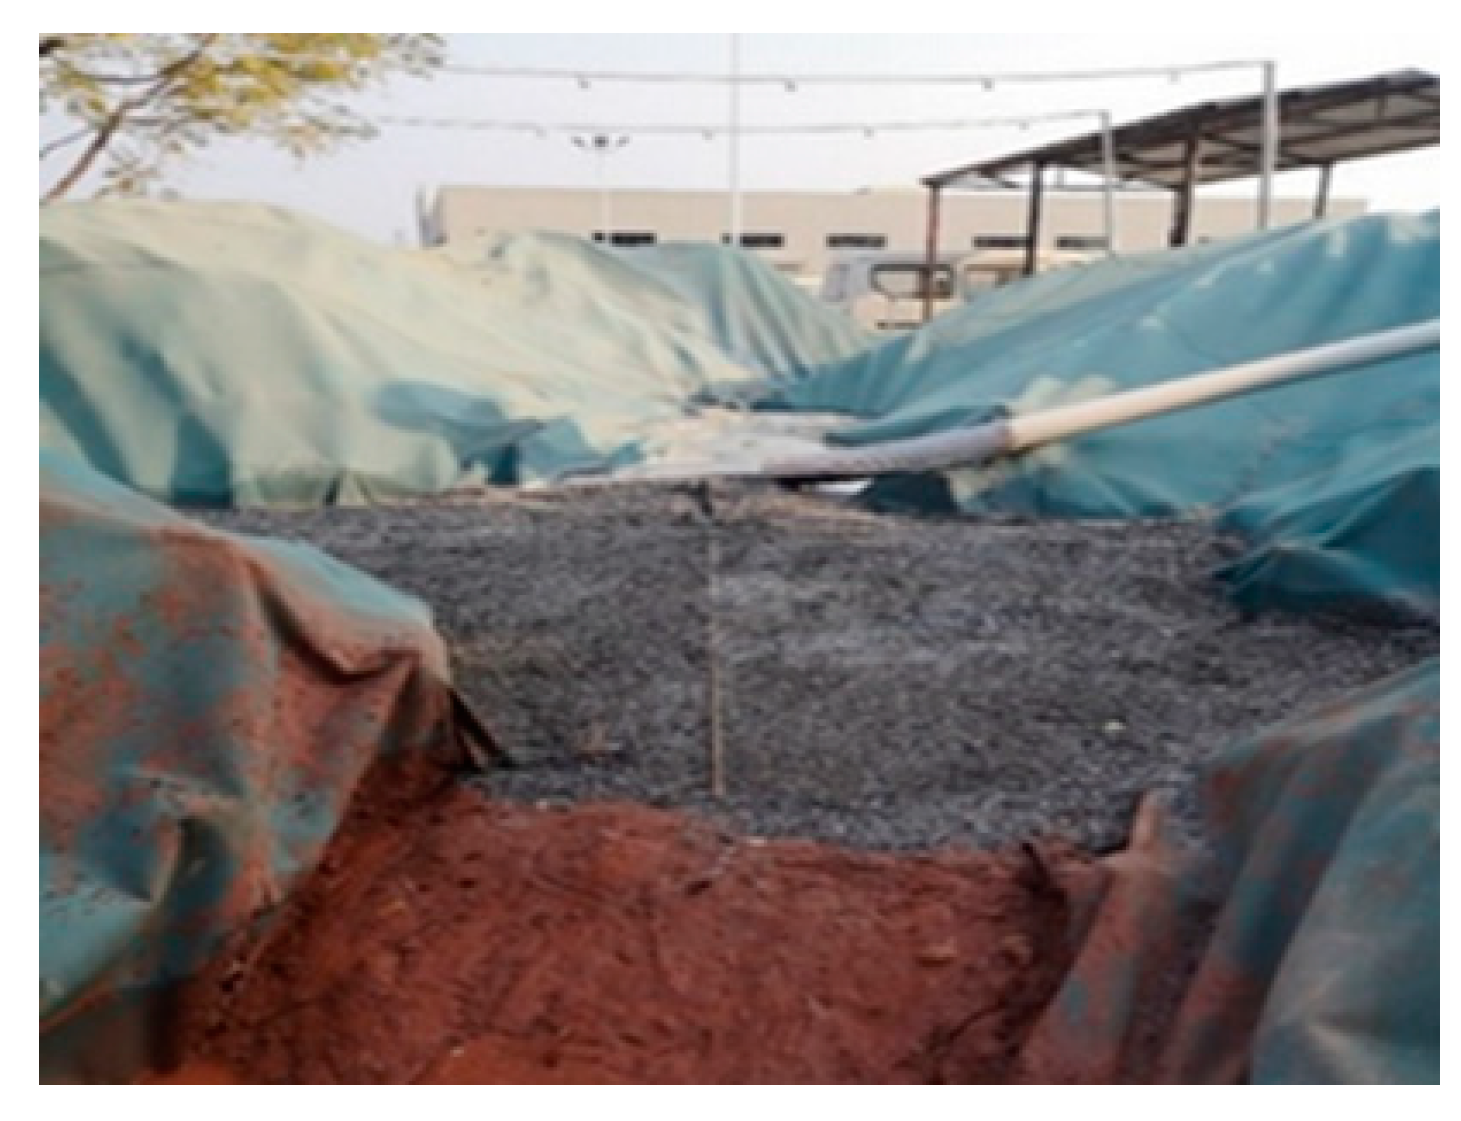
Figure 8.
Buried pore water pressure gauges.
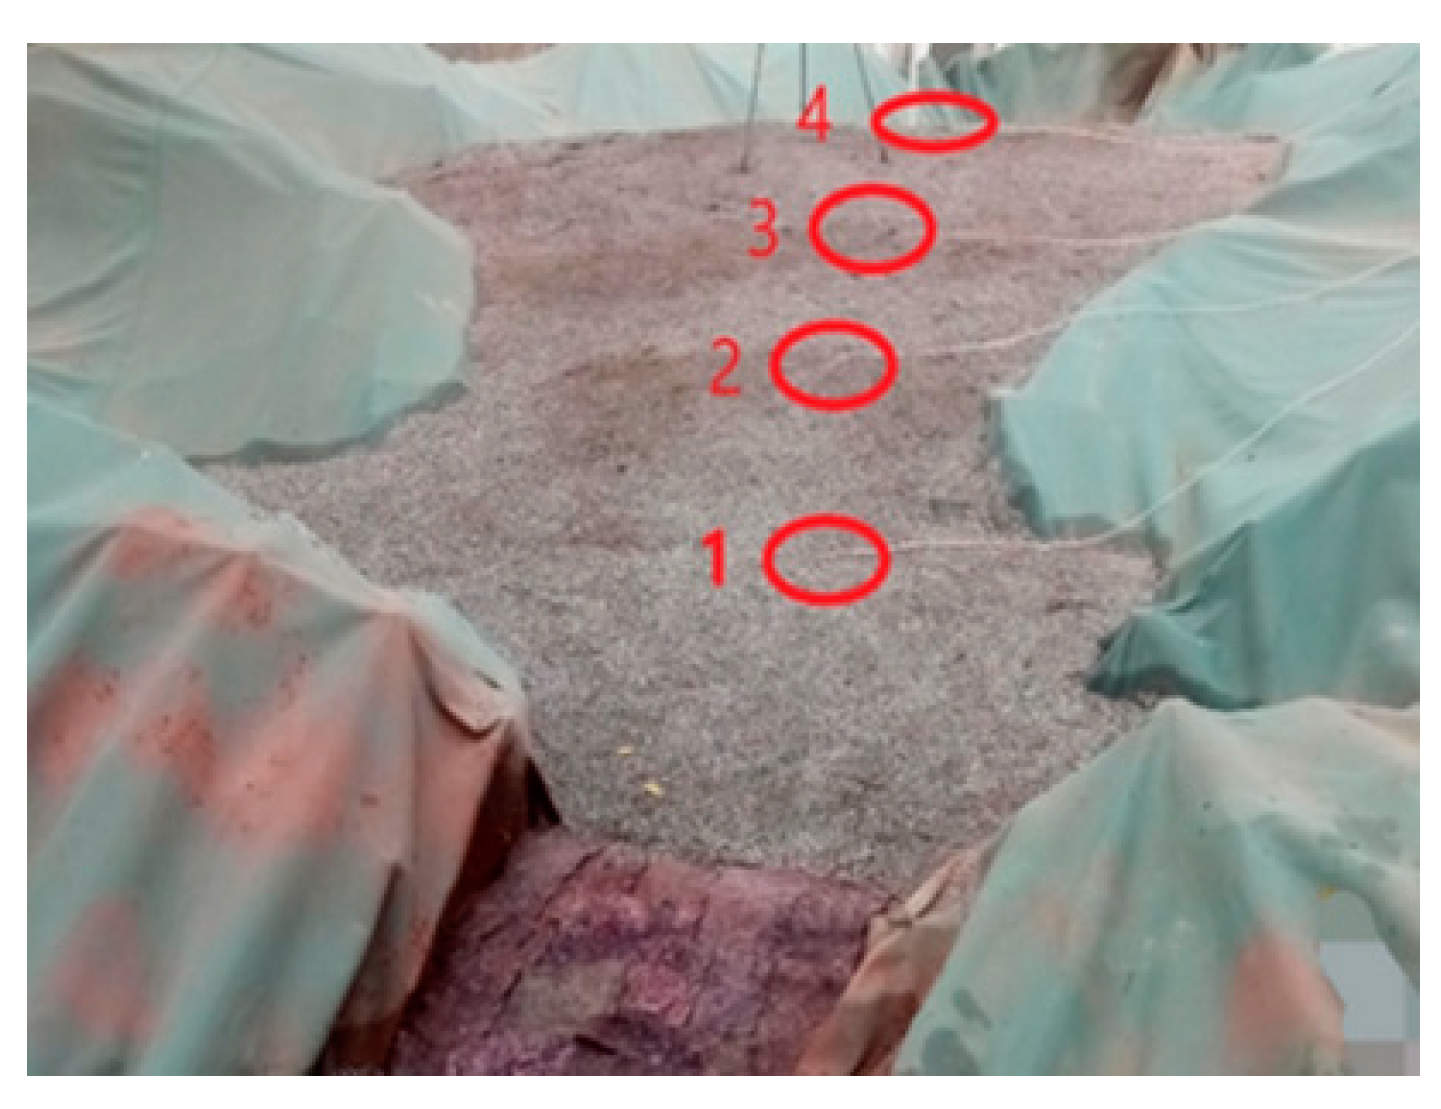
Figure 9.
Water tower.
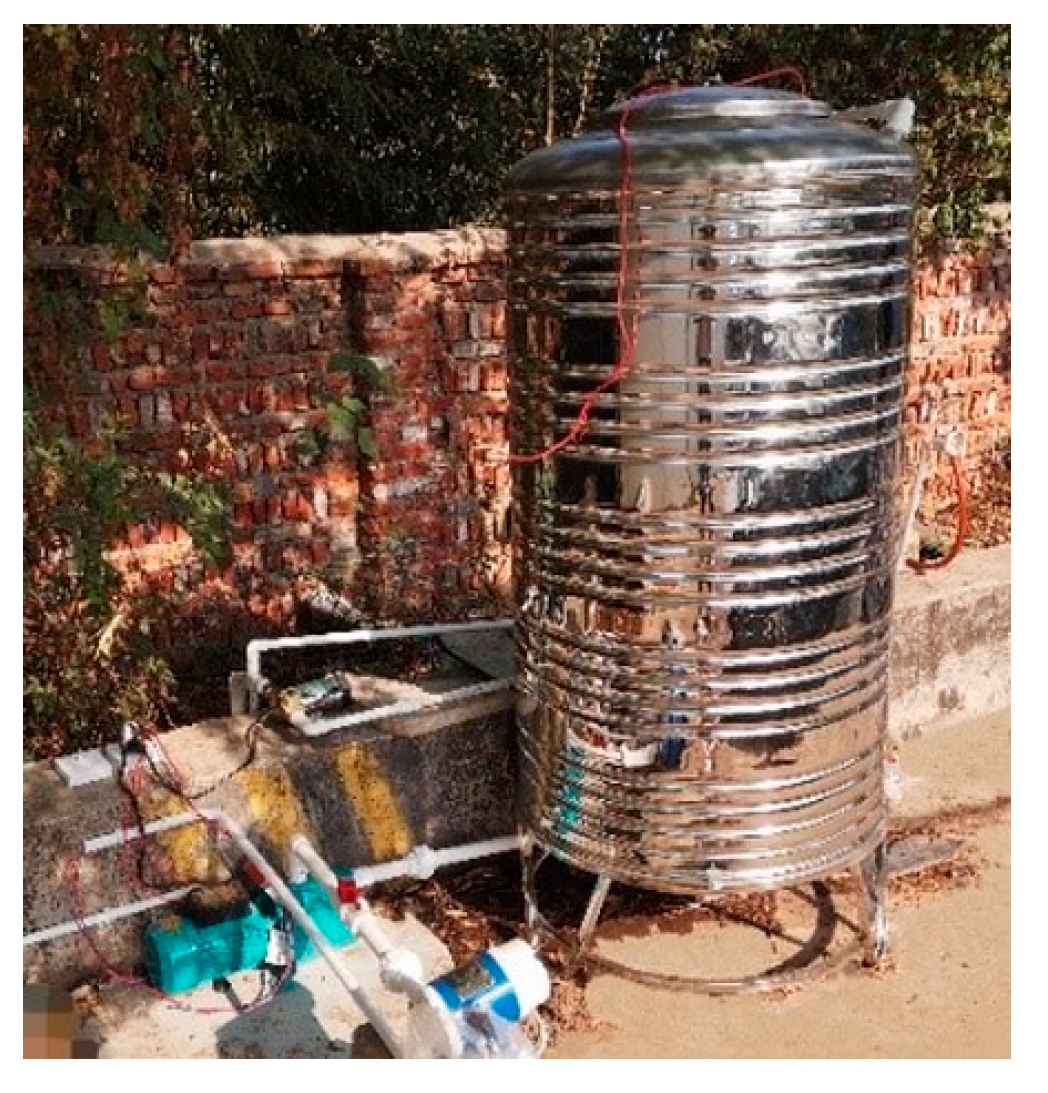
Figure 10.
Water supply circulation system.
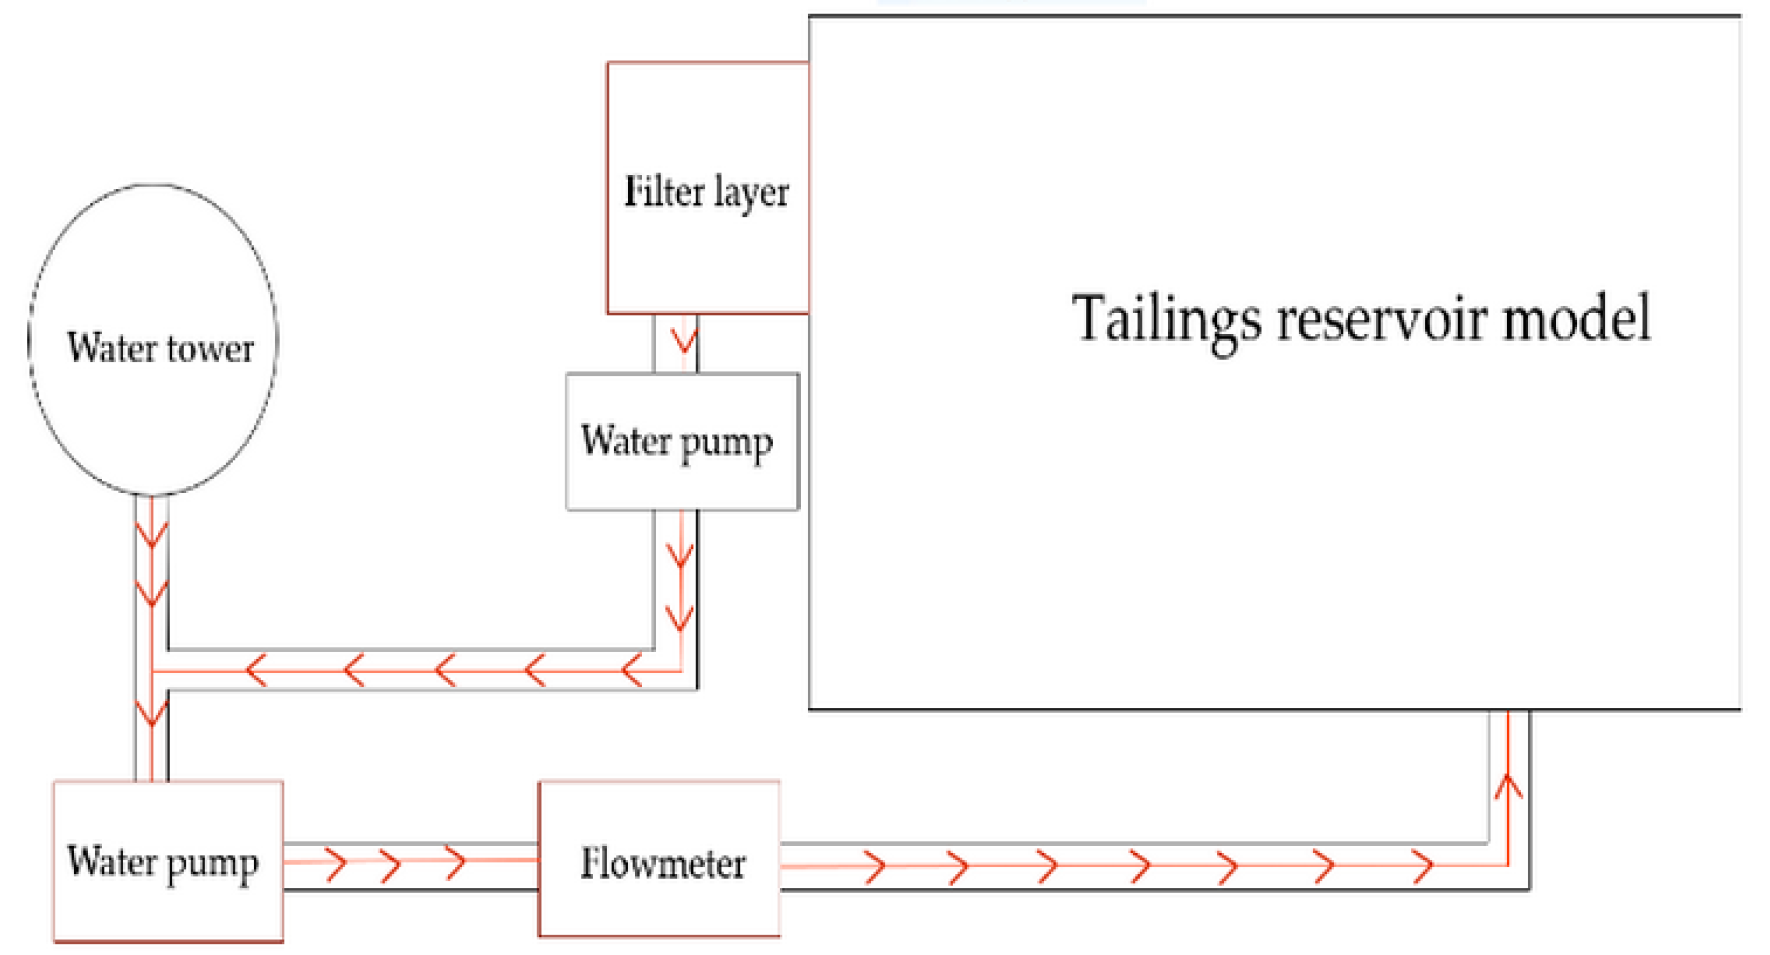
Figure 11.
Experimental observation system.
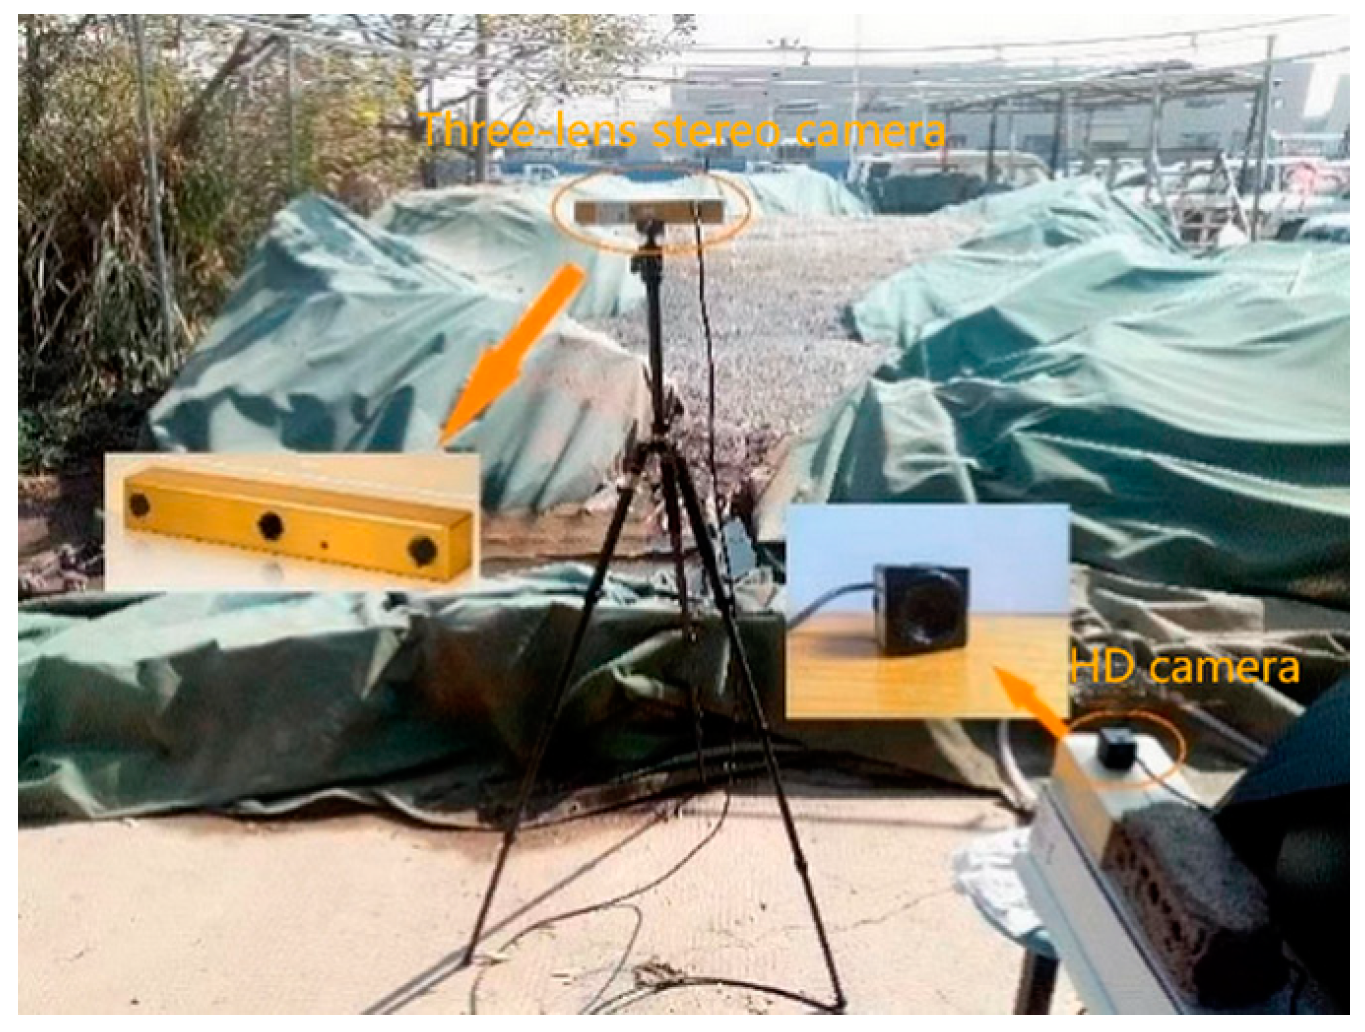
Figure 12.
Dam failure model tests.

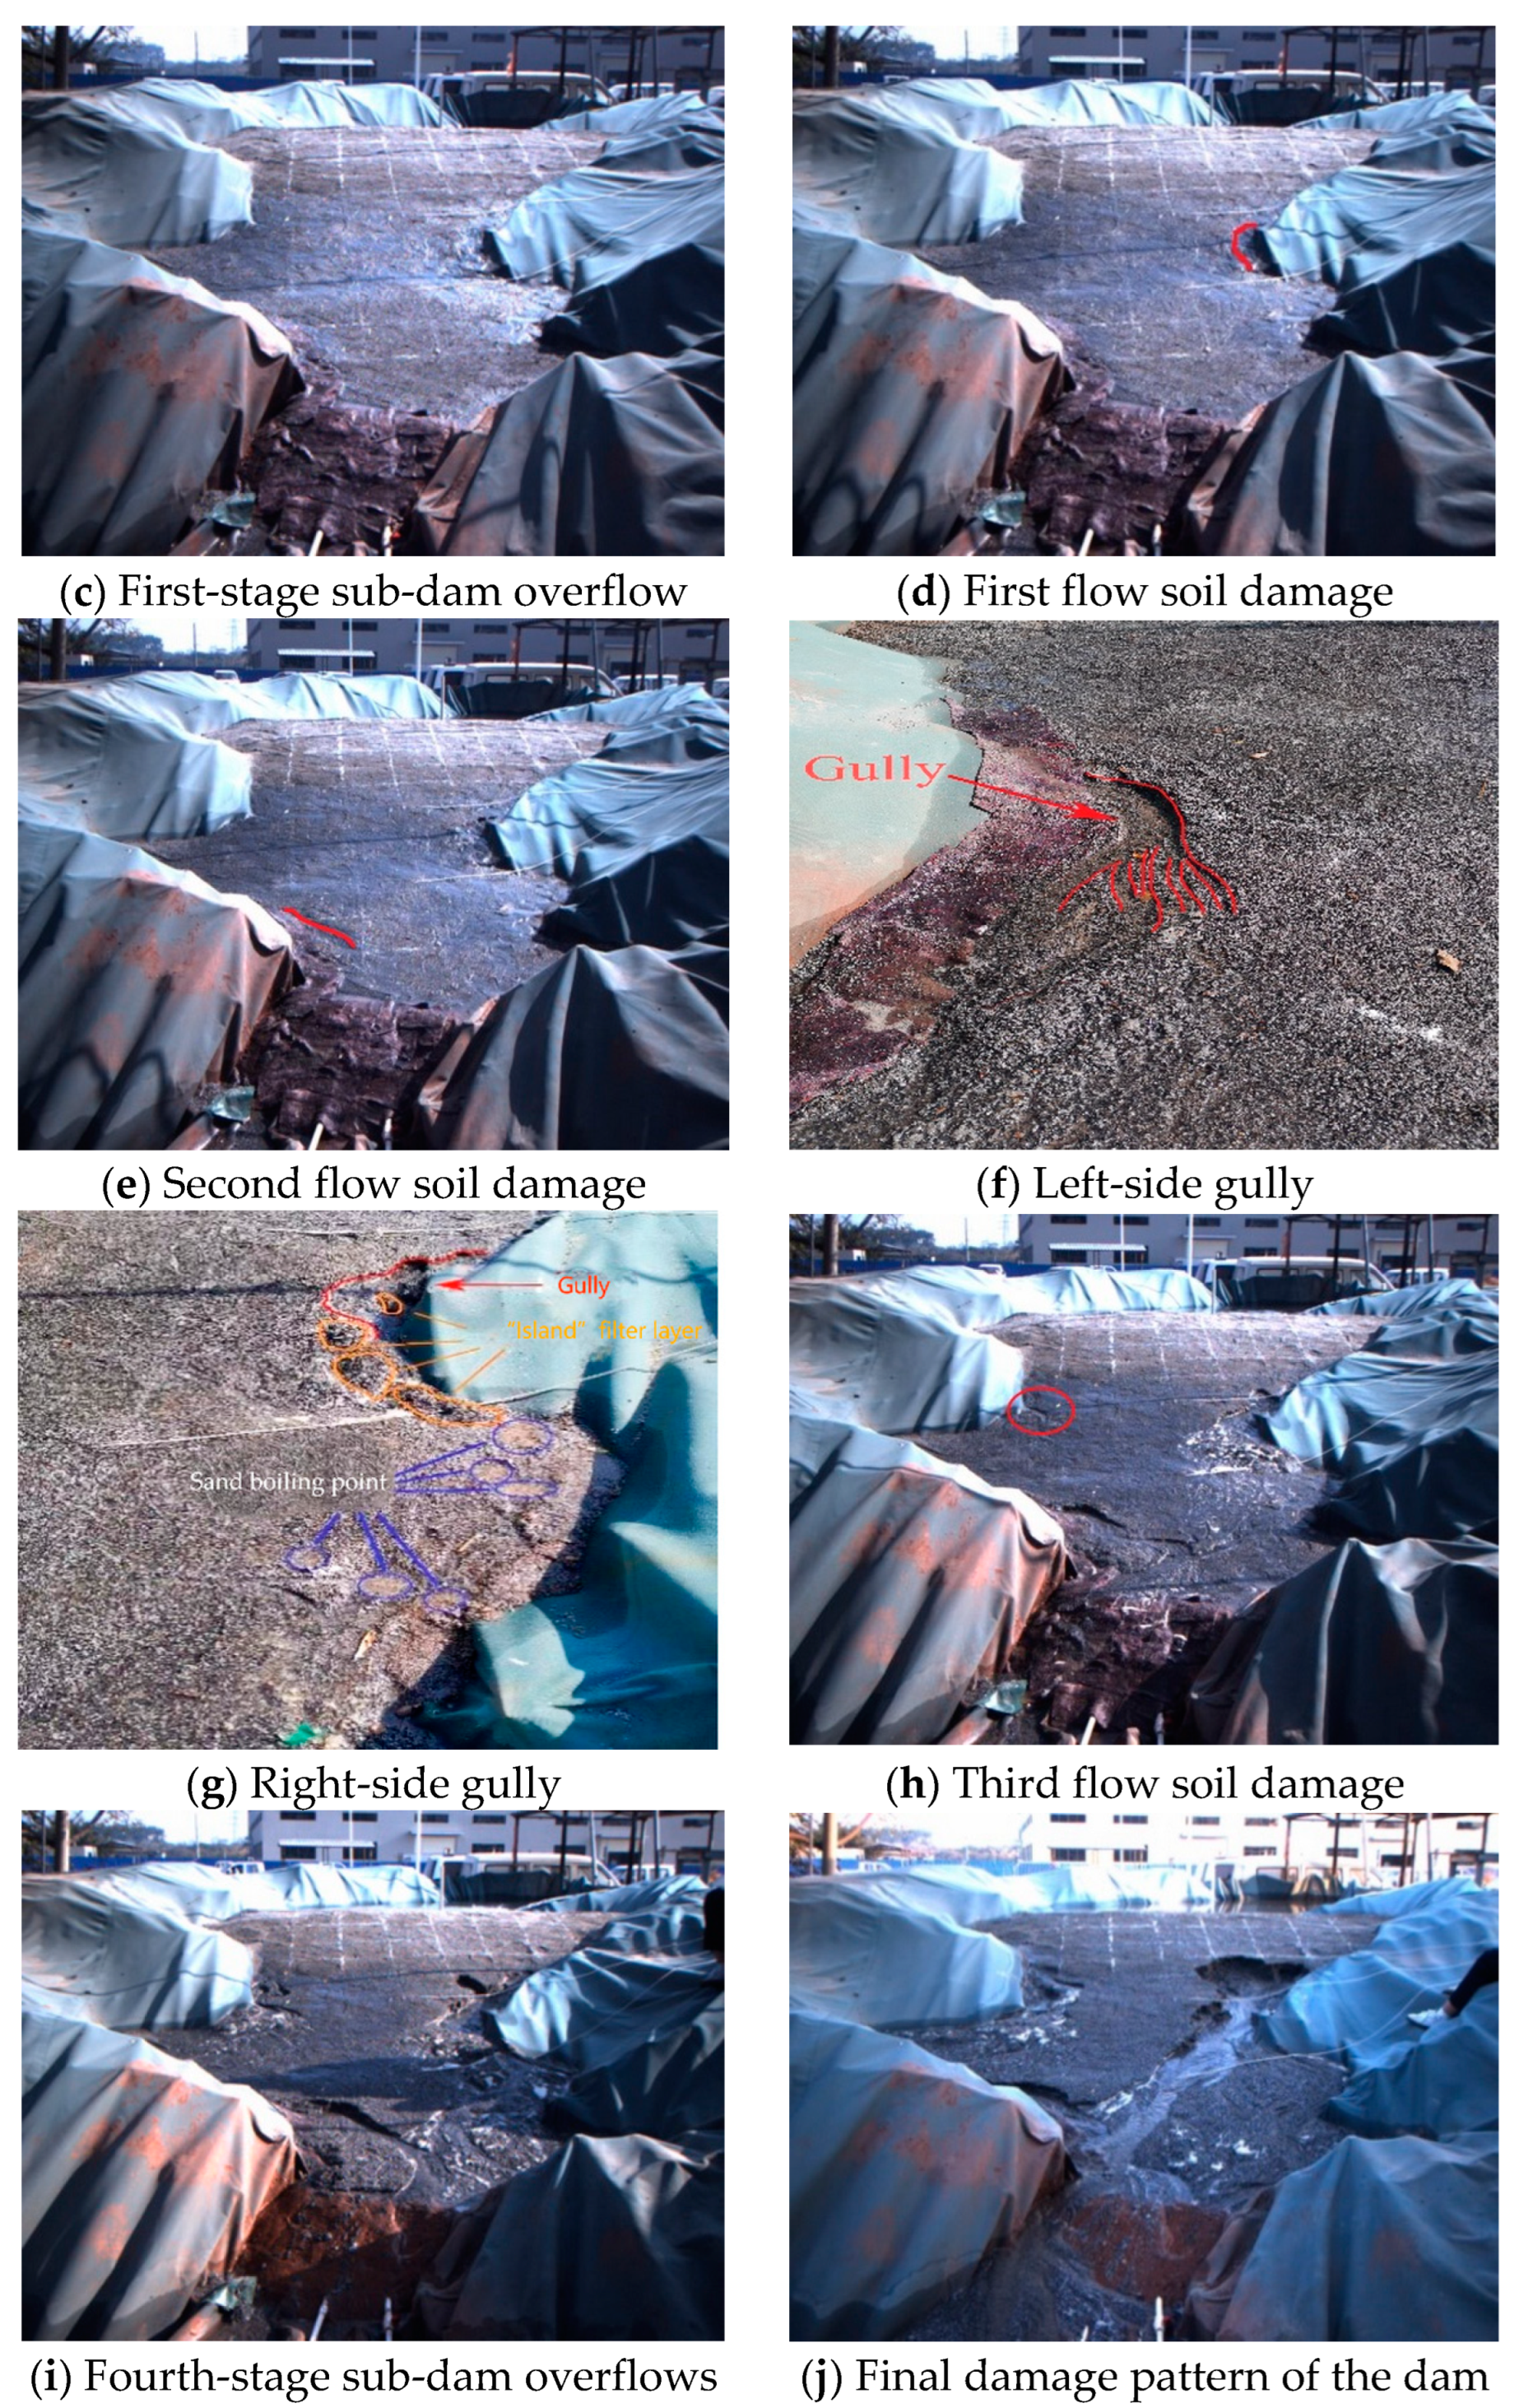
Figure 13.
Timeline of the development of the flowing soil destruction.
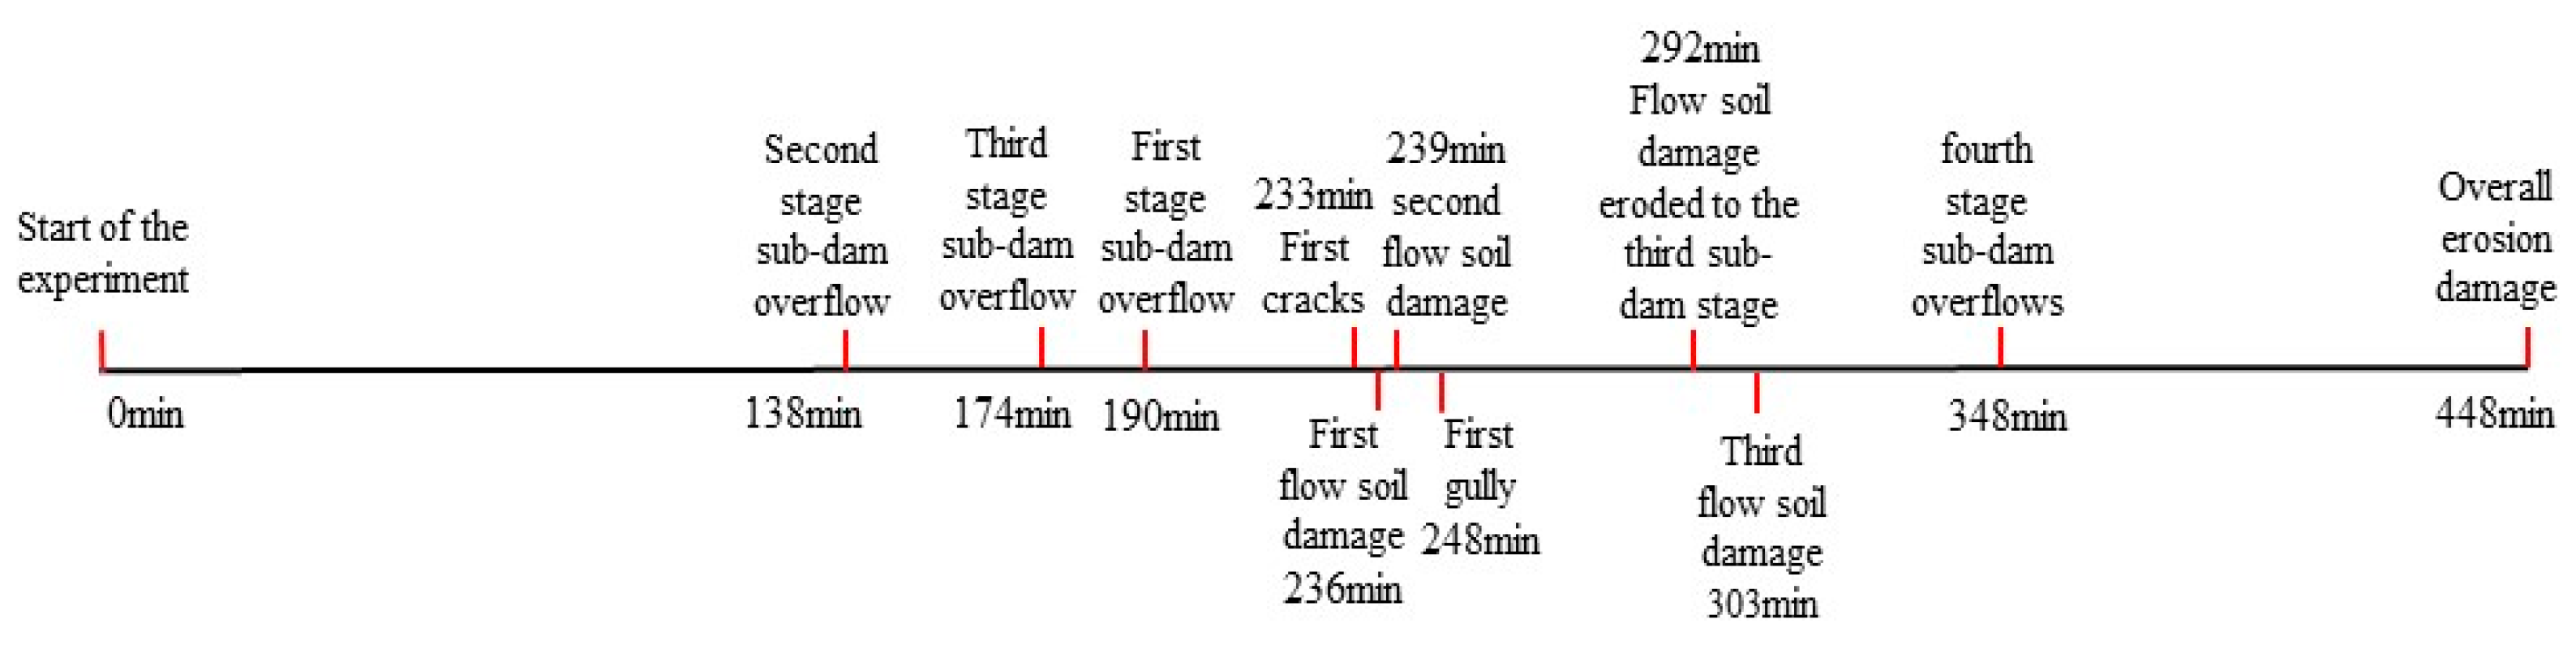
Figure 14.
Variation curve of saturation line.

Figure 15.
Saturation line distribution of the tailings dam under 125 m water level.
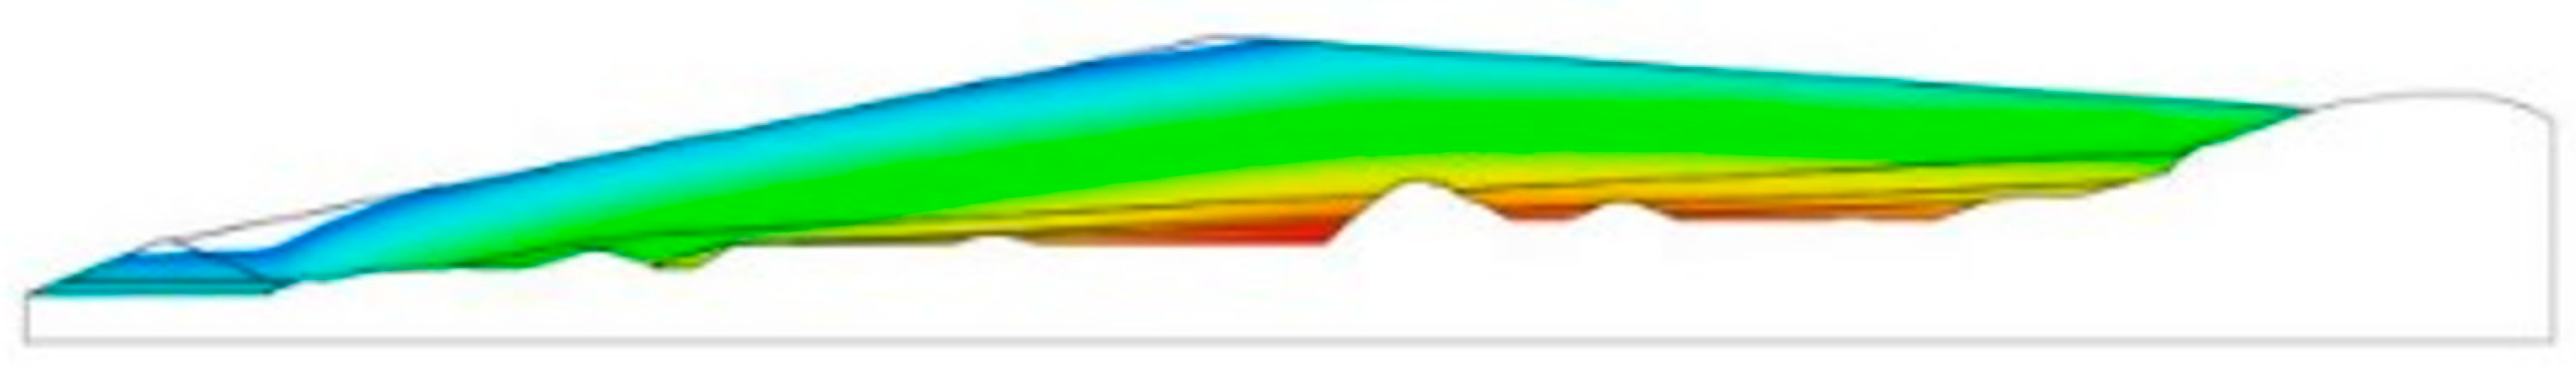
Figure 16.
FLOW-3D 3D calculation model.
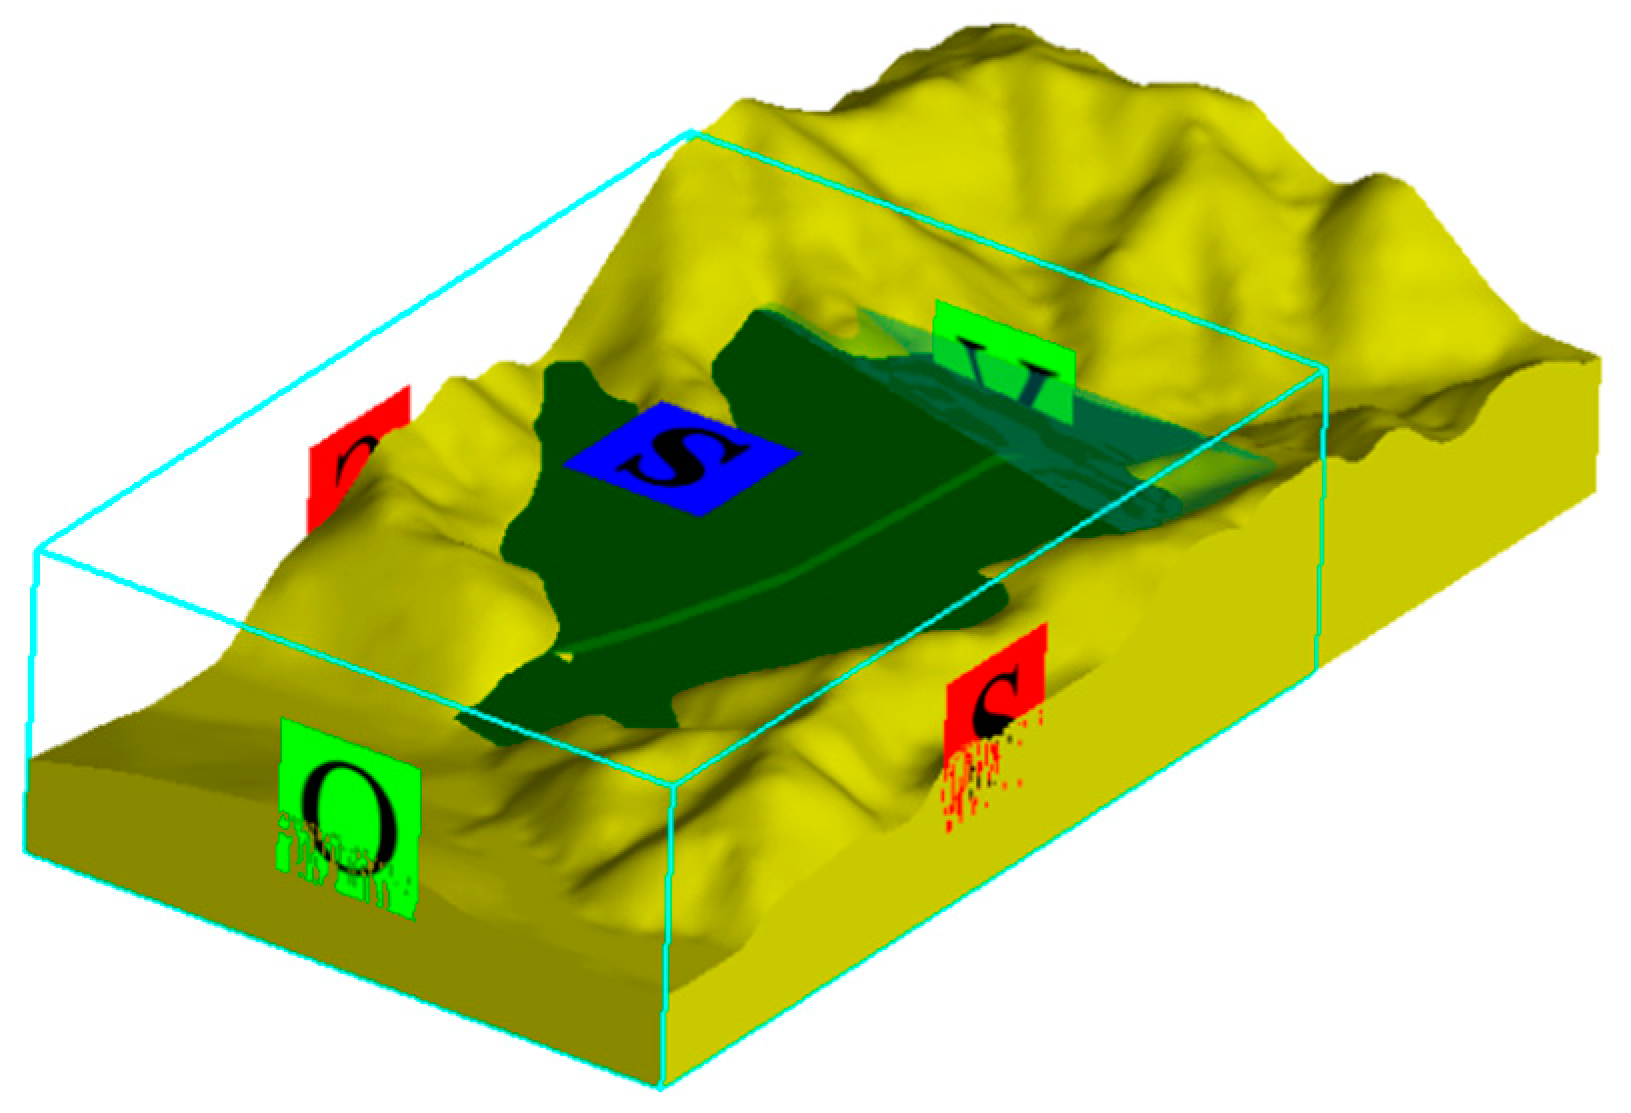
Figure 17.
Aerial view downstream of tailings dam.
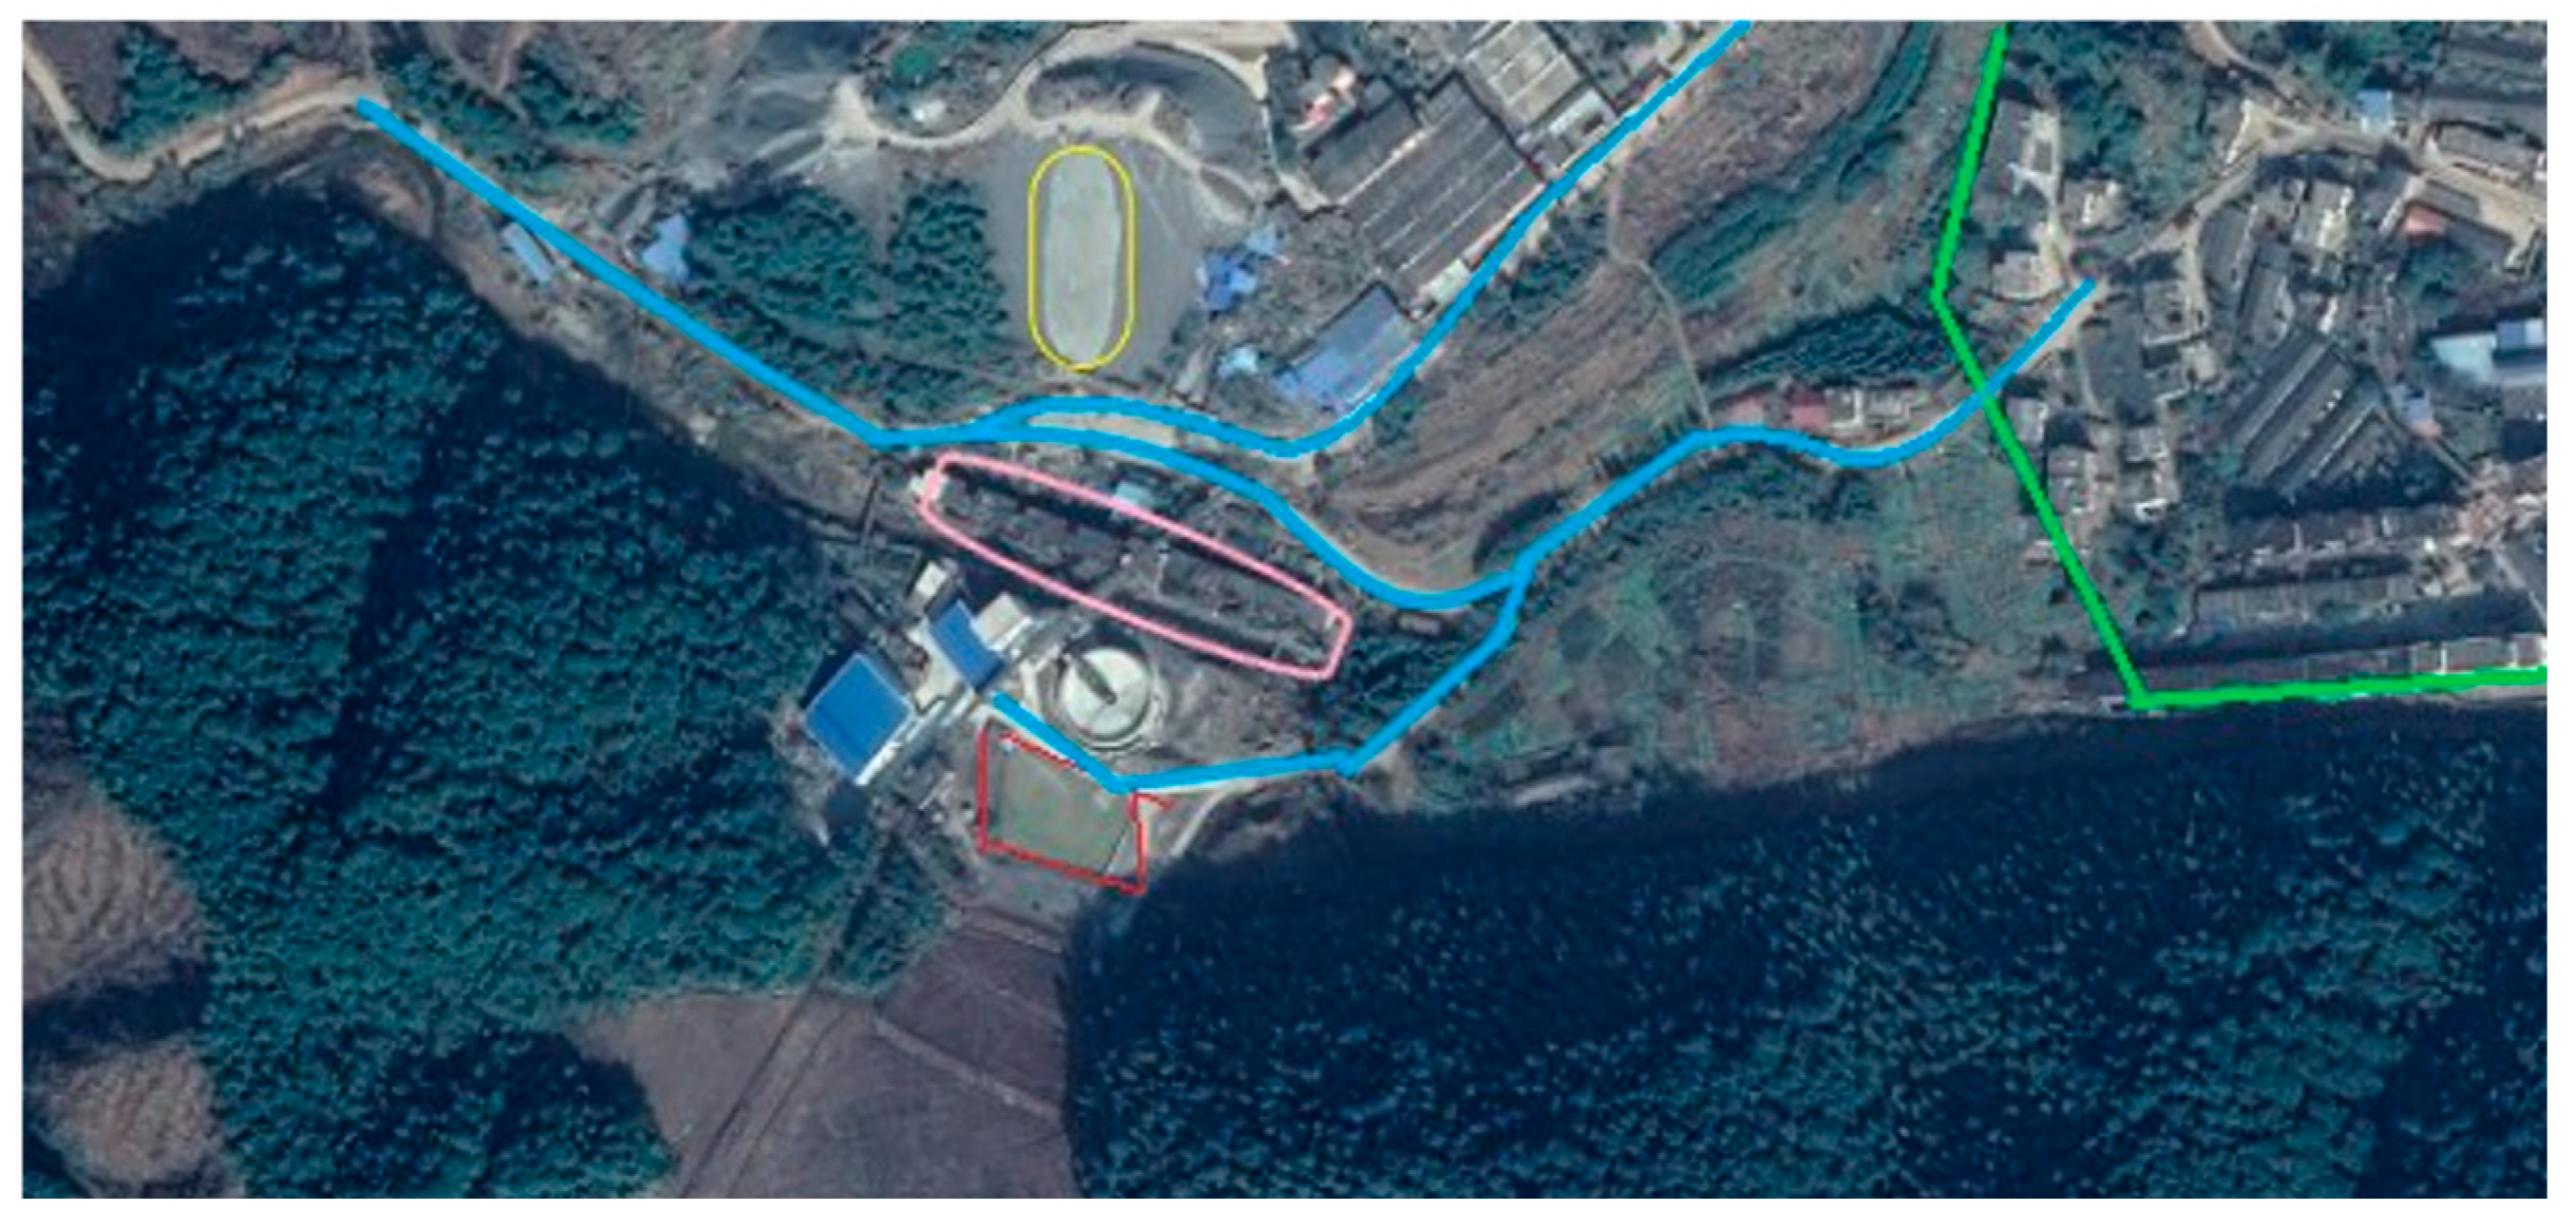
Figure 18.
Time-course diagram of mud area.
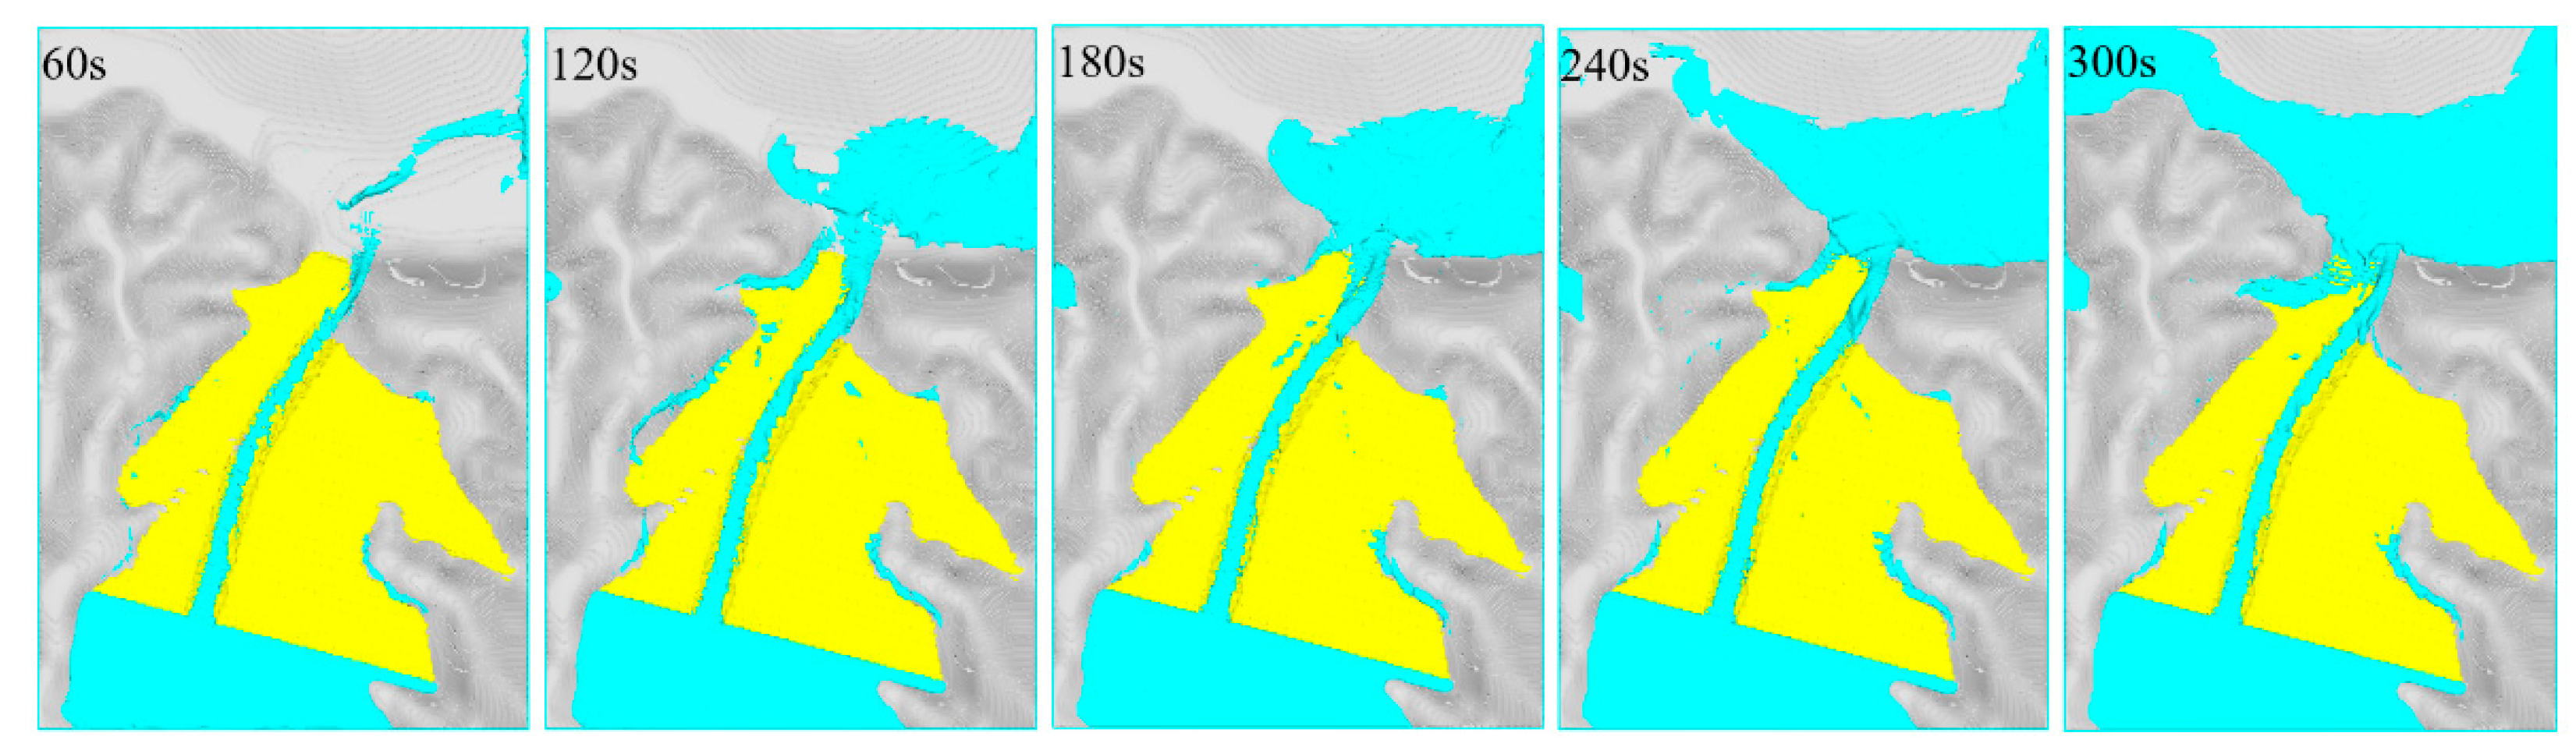
Figure 19.
Cloud map of flooding depth.
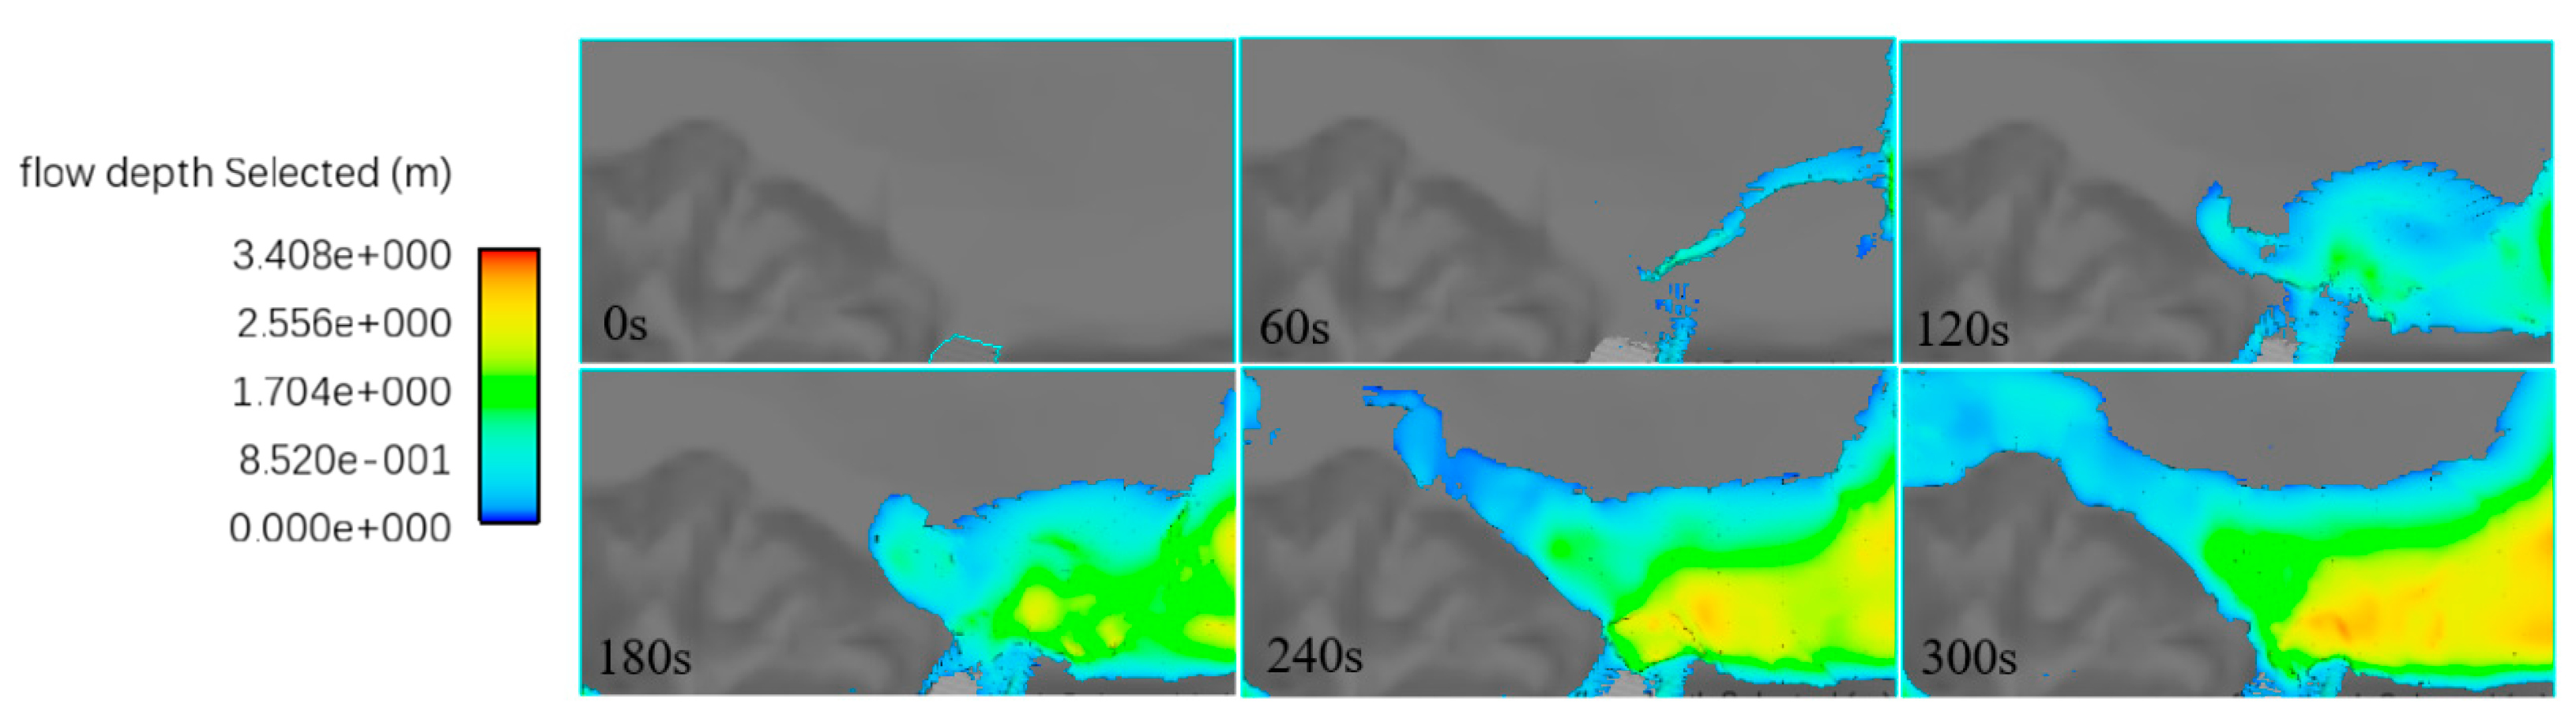
Figure 20.
Cloud map of flow rate.
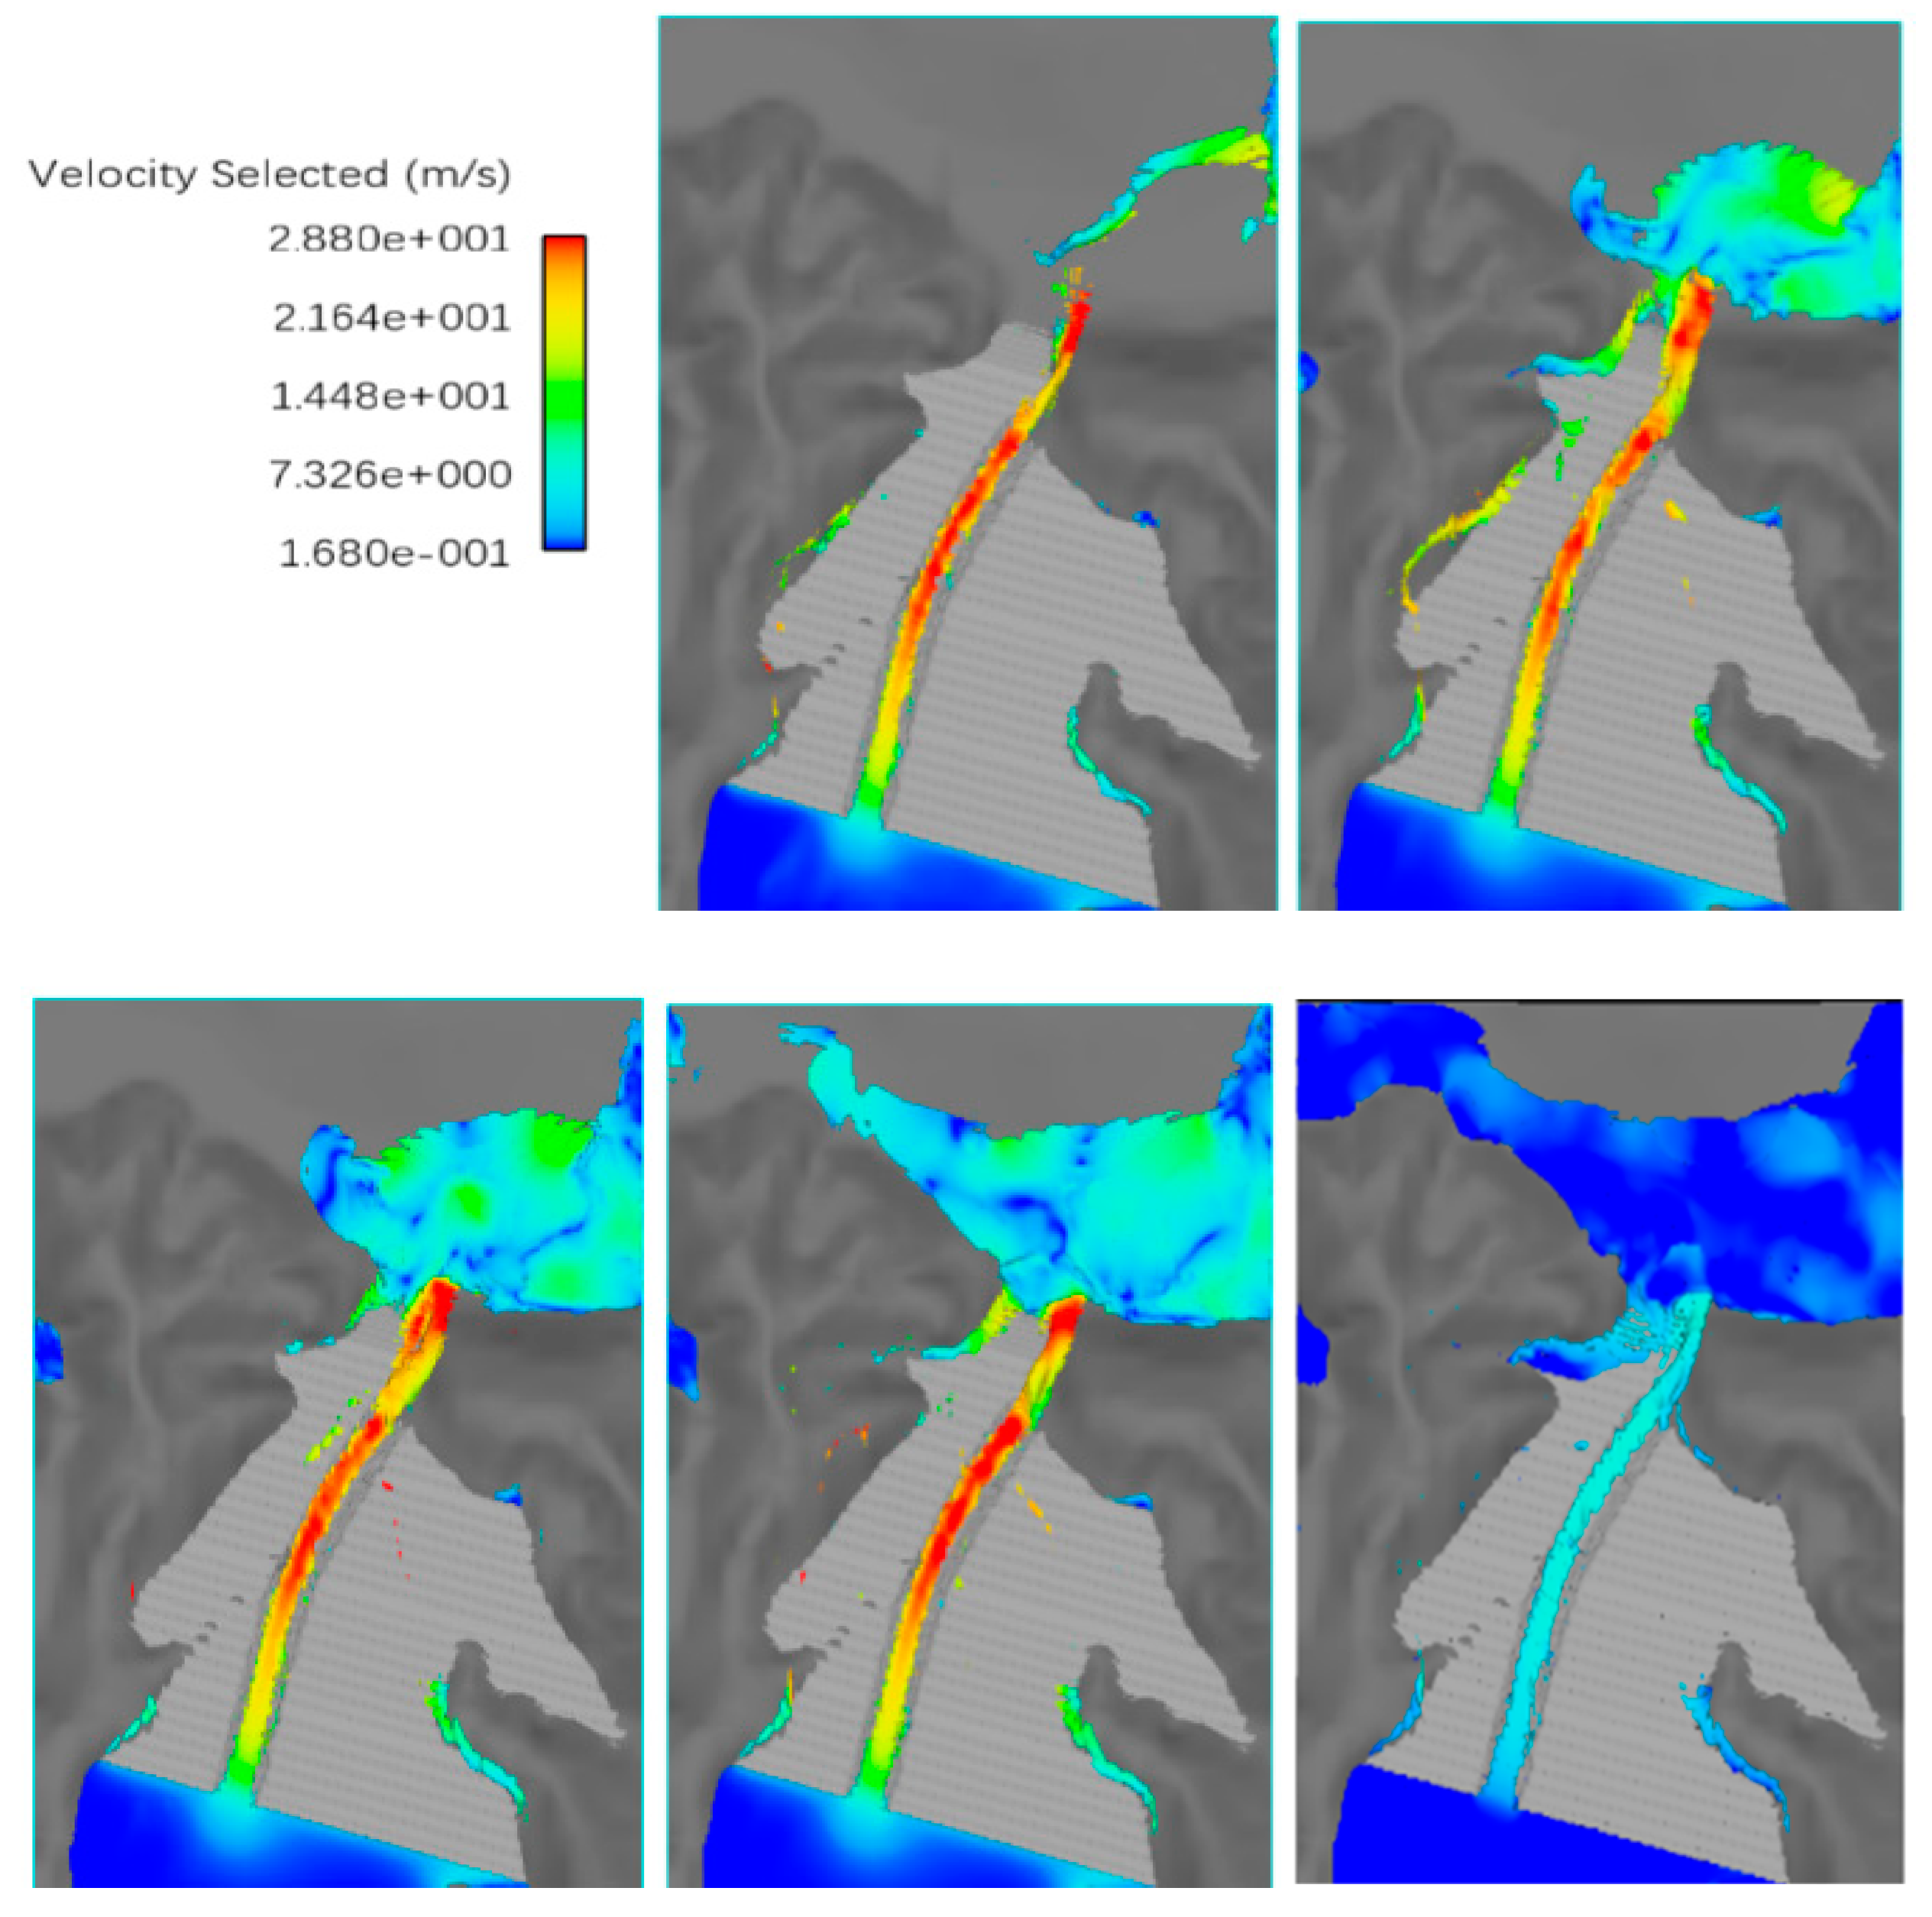
Figure 21.
Flow rate reference points.

Figure 22.
Flow rate time history diagram.

Disclaimer/Publisher’s Note: The statements, opinions and data contained in all publications are solely those of the individual author(s) and contributor(s) and not of MDPI and/or the editor(s). MDPI and/or the editor(s) disclaim responsibility for any injury to people or property resulting from any ideas, methods, instructions or products referred to in the content. |
© 2023 by the authors. Licensee MDPI, Basel, Switzerland. This article is an open access article distributed under the terms and conditions of the Creative Commons Attribution (CC BY) license (https://creativecommons.org/licenses/by/4.0/).
Share and Cite
MDPI and ACS Style
Gao, Z.; Liu, J.; He, W.; Lu, B.; Wang, M.; Tang, Z. Study of a Tailings Dam Failure Pattern and Post-Failure Effects under Flooding Conditions. Water 2024, 16, 68. https://doi.org/10.3390/w16010068
AMA Style
Gao Z, Liu J, He W, Lu B, Wang M, Tang Z. Study of a Tailings Dam Failure Pattern and Post-Failure Effects under Flooding Conditions. Water. 2024; 16(1):68. https://doi.org/10.3390/w16010068
Chicago/Turabian StyleGao, Zhong, Jinpeng Liu, Wen He, Bokai Lu, Manman Wang, and Zikai Tang. 2024. "Study of a Tailings Dam Failure Pattern and Post-Failure Effects under Flooding Conditions" Water 16, no. 1: 68. https://doi.org/10.3390/w16010068
Note that from the first issue of 2016, this journal uses article numbers instead of page numbers. See further details here.