
Water Quality Monitoring in the Volga Headwaters
by
 , , and
Vyacheslav V. Kuzovlev
1,2,*,
Irina L. Grigoryeva
3,
Ekaterina A. Chekmareva
3 and
Martin Schletterer
4,* 1
Faculty of Environmental Management and Ecology, Tver State Technical University, Nab. Afanasiya Nikitina 22, Tver 170026, Russia
2
Tver Center for Hydrometeorology and Environmental Monitoring, Russian Federal Service for Hydrometeorology and Environmental Monitoring, Efimova Str., 6, Tver 170006, Russia
3
Branch of WPI RAS “Ivankovskaya Research Station”, Water Problems Institute, Russian Academy of Sciences, Belavinskaya 61a, Konakovo 171251, Russia
4
Institute of Hydrobiology and Aquatic Ecosystem Management, University of Natural Resources and Life Sciences, Vienna (BOKU), Gregor-Mendel-Straße 33, 1180 Vienna, Austria
*
Authors to whom correspondence should be addressed.
Water 2024, 16(3), 491; https://doi.org/10.3390/w16030491
Submission received: 31 December 2023
/
Revised: 29 January 2024
/
Accepted: 30 January 2024
/
Published: 2 February 2024
(This article belongs to the Special Issue River Science: Integrated Management of Water Resources in the Anthropocene)
Abstract
:The Volga River is the largest river in Europe in terms of basin area (1.36 mio. km2), length (3531 km), and water content (annual flow 254 km3). We conduct long-term water quality studies in the Volga headwaters: in the Upper Volga Lakes, the free-flowing section, as well as in the Ivankovskoye and Uglich Reservoirs. At the source of the river, the water is very soft, slightly mineralized, characterized by high color indicators (up to 400 degrees Pt-Co scale) and permanganate oxidation (60.3–72 mgO/L). In the Upper Volga Lakes, water mineralization increases to 110 mg/L, and the color of the water decreases significantly. In the Ivankovo Reservoir, higher concentrations of manganese and BOD5 are noted than in the Volga above Tver. Based on total phosphorus concentrations, the Upper Volga Reservoir (Lake Volgo) and the free-flowing section of the Upper Volga (from Selizharovo to Tver) belong to the “mesotrophic” class, and the Ivankovskoye Reservoir belongs to the “eutrophic” class. We characterize the Volga headwaters based on physico-chemical parameters “balanced” and discuss the relevance of “natural pollution”. Especially the free-flowing section comprises an important reference section for lowland rivers; thus, long-term monitoring of abiotic and biotic aspects is an important issue.
1. Introduction
The hydrosphere contains about 1.386 million km3 water [1], but about 97.5% of the global water is salt water vs. only 2.5% freshwater, of which 68.9% is stored in glaciers and permanent snow cover, 30.8% in the groundwater (including soil moisture), and only 0.3% in rivers and lakes [2]. The annual net transport from the sea to the land is 40,000 km2, and the river flow to the oceans also amounts to 40,000 km2 per year [3]. Thus, among freshwater resources, rivers are often referred to as lifelines [4,5,6,7,8] or arteries [9,10,11,12], as lotic systems often formed the cradles of civilizations [13]. But we also need to take into account “flying rivers” [14] and that 40% of terrestrial precipitation originates from land evaporation [15]. In the context of long-distance moisture transport, the theory of the biotic pump run by forests was developed, which predicts that forests supply moisture as well as the winds that carry it [16]. The large boreal forests of Scandinavia and Russia provide about 80% of the rainfall in China [15].
The catchment of Europe’s largest river, the Volga, is located in the southern taiga, and a major part of the runoff comes from boreal forests [17]. Due to large forests and minor anthropogenic activities, the headwater section of the Volga is of great interest regarding long-term monitoring [18]. In Agenda 2030, water is highlighted in Goal 6, “Clean water and sanitation”, and goal 15, “Life on Land” (which includes terrestrial and inland freshwater ecosystems) [19], but de facto is each of the 17 goals related to water and water availability.
In the Russian Federation, the governmental monitoring of running waters (according to RD 52.24.309-2016 [20]) includes quantity (discharge) and quality (physico-chemical parameters) [21], and some scientific campaigns include biological parameters to assess water quality [18,22]. In general, monitoring programs about physico-chemical parameters consider biogenic elements as well as organic substances [23]. Biogenic elements include mineral substances that are actively involved in the life of aquatic organisms, i.e., compounds of nitrogen, phosphorus, and silicon. Also, insufficient iron content can be one of the limiting factors in the development of phytoplankton; therefore, iron is often also included in the group of biogenic elements of water [21]. Organic substances in natural waters are compounds of carbon with other elements. The simplest and most common way to characterize the content of organic matter is the method of determining the oxidizability of water by the amount of oxygen consumed for the oxidation of this substance. Depending on the oxidizing agent used, permanganate or bichromate oxidizability is distinguished (COD—chemical oxygen demand). The quantitative assessment of easily oxidized organic substances by the amount of oxygen is estimated by the BOD (biochemical oxygen demand) [21].
Herein, we present results from long-term water-quality monitoring campaigns in the headwaters of the Volga in order to exemplify (a) the hydrochemical regime of the Upper Volga in the summer low-flow period, (b) the temporal and spatial variability of physico-chemical parameters, (c) the problem of “natural pollution”, as well as (d) changes in the content of biogenic elements and indicators of organic matter in the water of the Ivankovskoye Reservoir.
2. Materials and Methods
2.1. Research Area
The source of the Volga is a limnokrene located near the village of Volgoverkhovye in the Valdai hills (Tver Region) at the margin of a small mire at an altitude of 228 m above sea level [24,25]. At the village of Kokovkino, the river enters the Upper Volga lakes, i.e., Sterzh, Vselug, Peno, and Volgo (the latter is often divided into Upper and Lower, or Small and Large Volgo). The Upper Volga Reservoir was formed in 1843 during the construction of a dam (Beishlot) ~2 km downstream of the place where the Volga flows out of the lake Volgo. The section of the Volga between the Upper Volga Beishlot and Tver is unregulated and represents the least disturbed free-flowing section in the headwaters of the Volga [18,25]. The catchment area at Tver (including the Tvertsa River basin) amounts to 31,300 km2 [26]. Between Tver and Dubna, the Ivankovskoye Reservoir, created in 1937, is located. The Ivankovskoye Reservoir is a large reservoir of the valley–hollow type, the surface area of which is 327 km2, and the total volume is 1.12 km3 [27]. Approximately 50% of the reservoir is up to 2 m deep, the average depth amounts to 3.4 m and the maximum depth is 17 m near the dam. The multi-purpose Reservoir is used for water supply of Moscow [28], water disposal after cooling the turbines of the Konakovskaya GRES (thermal power station), hydropower, waterborne transport, as well as recreation.
Bedrock in the Upper Volga basin is represented mainly by Carboniferous, Permian, and Jurassic deposits. The deposits of the Upper Carboniferous (limestones and clays) are closest to the surface; they are overlain by deposits of the Jurassic period and thick strata of Quaternary rocks. Upper Carboniferous rocks are represented by limestones and clays. Quaternary rocks are represented by formations of various glacial epochs. The relief of the region is rather monotonous. Landforms of glacial, lacustrine, and alluvial origin are developed, represented mainly by slightly hilly and hilly plains.
The climate, in accordance with the geographic location in the center of the Russian Plain, is temperate continental with alternating cyclonic and anticyclonic weather throughout the year and with complex and diverse circulation processes of various directions and intensities. The average annual value of the radiation balance for the study area is 33.1 kcal/cm2 [26], and the average annual air temperature in Tver is 4.5 °C (1944–2017). The average amount of precipitation in the region ranges from 330 to 890 mm, mainly due to cyclonic activity. The duration of the growing season is between 100 and 170 days. The main soil-forming rocks in a significant part of the catchment area are moraine loams, less often sandy loams, fluvio-glacial sands, alluvial deposits, and peat bogs. In terms of mechanical composition, moraine deposits are very diverse and are represented by light, medium, and heavy loams. Soil-forming rocks in the northwest of the region are mainly glacial, and in the east—fluvioglacial deposits. On the slopes of river valleys, carbonate rocks protrude to the surface in many places [29].
The features of the relief, hydrological, and climatic conditions, as well as the diversity of soil-forming rocks and plant associations, led to the formation of a rather variegated soil cover in the catchment area. Soddy–podzolic soils (of varying degrees of podzolization), podzolic, and, in depressions, soddy–gley and marsh soil types predominate. Meadow and peaty soils are developed on the surface of river terraces and floodplains. The mechanical composition of soils varies from clayey and loamy to sandy and sandy loamy [29]. Hydrocarbonate waters of predominantly low and medium mineralization are formed in the region since the thickness of podzolic and soddy–podzolic soils are everywhere well-washed from easily soluble salts of sulfates and chlorides. Peat mire soils, having high acidity, reduce the mineralization of surface waters and enrich it with organic (OM) and biogenic substances. Some of the most important physical and geographical characteristics of the river basin, which have a great influence on the regime of water runoff and the chemical composition of river waters, are lakes, mires, and forest cover of the territory. The mean share of mires amounts to 10% in the Tver region (Cadastre of peat deposits of the Tver region). The lake content of various parts of the study area varies from 2 to 6%, mires—from 2 to 7%, and forest cover—from 38 to 66% [30].
The water regime of the territory is characterized by well-marked flood, fairly stable winter and summer low water, as well as summer and autumn floods. The change of hydrological phases during the year and the differences in the water content of individual years cause significant fluctuations in the mineralization and chemical composition of surface waters [31].
2.2. Sampling and Data Analyses
Regular hydrochemical monitoring of the Upper Volga within the framework of the state observation network of Roshydromet (Russian Federal Service for Hydrometeorology and Environmental Monitoring) has been conducted since 1950. Currently, there are 8 monitoring sites operating on the uppermost 670-km section of the Volga River from the source to the city of Kalyazin. Another 15 sites operate on water bodies (rivers, lakes, and reservoirs) within the catchment area of the Volga River to Kalyazin.
The analysis of water samples at these sites is conducted by the Tver Center for Hydrometeorology and Environmental Monitoring of Roshydromet. Sampling is carried out from 4 to 13 (12 monthly samples + 1 sample during flood) times a year (depending on the monitoring category of the monitoring point). All water samples were taken at an adequate distance from the bank, at the surface, i.e., 0.2–0.3 m from the surface. Up to 40 hydrochemical parameters are determined in the samples using standard methods for the analyses of surface waters [32]. The water color (chromaticity) was measured according to the platinum–cobalt scale (Pt-Co scale). To assess the hydrological regime of the Volga River, data on water discharge at the gauging station in the city of Staritsa are used. Based on hydrochemical data, the shortened version of Kurlov’s formula [33] was used to describe and compare the ionic composition of the water in the Volga headwaters in the summer low-water period 2021 (Supporting Information Table S1).
In addition, hydrochemical and hydrobiological studies of the Upper Volga are conducted by scientific institutions, such as Tver State Technical University [18,34,35] and the Institute of Water Problems (IWP) of the Russian Academy of Sciences [26]. Since 1975, the IWP has carried out scientifically-based research in support of water-related administration, facilitating the decision-making process of water management, as well as consulting the public and private sectors at both local and regional scales. The “Ivankovskaya Research Station” at Konakovo was founded in 1981 and facilitates research on the Ivankovskoye Reservoir as well as the Volga headwaters.
In August 2021, the IWP studied the chemical composition of the water at the source of the Volga, the Upper Volga lakes, as well as the unregulated section of the Volga and the Ivankovskoye Reservoir, with 23 sampling sites in total (Figure 1, Table 1).
Further, between 2009 and 2021, the source of the Volga River was sampled 5 times (23 June 2009, 24 July 2012, 14 August 2014, 7 April 2016, and 21 August 2021) in order to characterize the natural composition of the water with high influence from a mire over different years. At the sampling sites, some parameters (temperature, pH, conductivity, and dissolved oxygen) were measured in situ. Analyses in the laboratories were carried out with standard methods for the analyses of surface waters [32].
3. Results
3.1. Hydrochemical Characteristics of the Upper Volga in Summer Low-Flow Period
As a characteristic of the mineral composition of the water of the Volga River (and its reservoirs) in the upper reaches, we present the formula of the ionic composition of water (so-called Kurlov formula) in the different monitoring points for the summer low-water period in 2021 (Table 2). Hydrologically, 2021 was characterized as a year of average water content: the average annual water discharge in the Volga River in Staritsa in 2021 was 163 m3/s (the average annual discharge is 162 m3/s).
Water mineralization (M, g/L) is steadily increasing downstream up to the city of Kimry (583 km from the source). In the middle part of the Uglich Reservoir (monitoring point Kalyazin, 649 km from the source), mineralization becomes slightly lower. The ionic composition of the water in the upper reaches (up to the city of Rzhev) is bicarbonate calcium, and below, it is bicarbonate magnesium–calcium. An increase in the percentage equivalent of chloride ions downstream of the river can also be noted.
In terms of chemical composition, the water in the Volga River from the source to the mouth of the Oka River throughout the year is characterized by a bicarbonate character with a predominance of calcium ions in the composition of cations [36].
In 2021, the mineralization of water at the source of the Volga did not exceed 100 mg/L. In the water of the Upper Volga lakes (Sterzh, Vselug, Peno, Volgo), mineralization increased to 150 mg/L, in the unregulated section of the Volga—up to 175 mg/L, and in the Ivankovskoye Reservoir—up to 280 mg/L (Figure 2).
In most sites in the Volga headwaters, the water color (chromaticity) did not exceed 56° Pt-Co scale (Figure 3a), while at the source of the Volga, it reached 300–450° Pt-Co scale—also related to the influence of mires. Similarly, the Volga headwaters are characterized by high values of easily oxidizable organic matter (BOD5, Figure 3b). The highest BOD5 values in summer 2021 were recorded in Lk. Sterzh and Lk. Peno, as well as in the bays of the Ivankovskoe Reservoir, where a significant phytoplankton bloom was observed.
The mineral nitrogen values varied considerably in sections, i.e., from 0.55 mg/L upstream of Tver (point 8) to 3.14 mg/L at the Konakovo gauge (point 13) (Figure 3c). The maximum concentration of mineral phosphorus was recorded at the source of the Volga (0.047 mg/L), while in most of the sections, the concentrations of mineral phosphorus ranged from 0.025 to 0.044 mg/L (Figure 3d). Based on total phosphorus concentrations, the Upper Volga Reservoir and the free-flowing section of the Upper Volga (from Selizharovo to the city of Tver) belong to the “meso-trophic” class, and the Ivankovskoye Reservoir belong to the “eutrophic” class.
The Volga River emerges from a mire at Volgoverkhovye. The water at the source is characterized by organic substances, high chromaticity (360–450° Pt-Co scale), high permanganate oxidizability (58.8–72.0 mgO/L), low values of pH (6.1–7.4), and mineralization (40–84 mg/L). The ionic composition at the source is dominated by bicarbonate and calcium ions (Table 3).
3.2. Temporal and Spatial Variability of Hydrochemical Parameters
It is known that the water quality in rivers is influenced by the prevailing sources of water feeding (snowmelt, rain, ground vs. mire water), as well as meteorological parameters. Therefore, it is interesting how the properties of water change along its length in different hydrological phases and seasons of the year.
For this purpose, the timing of water sampling dates for different phases of the water regime has been determined. Then, the values of hydrochemical indicators were pooled for 7 years (2012–2018) in various hydrological phases: winter (low water), spring (high water), summer (low water) and rain flood (Figure 4). Some indicators have a tendency to increase downstream in all hydrological phases, for example, the sum of ions, sulfates, nitrites, and hardness. There are indicators that can either increase downstream or decrease in different seasons: BOD; BO; and iron.
The analysis of the long-term series (2001–2018) from governmental monitoring made it possible to determine the modal intervals of hydrochemical indicators [37] of the upper Volga, that is, the intervals of the most common concentrations (Table 4). According to the recommendations of the State Hydrochemical Institute of Roshydromet [38], the status of river ecosystems can be classified into five classes: natural; balanced; crisis; critical; and catastrophic. Modal intervals of hydrochemical and hydrobiological parameters, as well as the frequency of exceeding the MPC of priority pollutants, are used as classification criteria. The key hydrochemical indicators are as follows: dissolved oxygen (regarding minimal concentration); BOD5; and ammonium nitrogen. Based on this classification, as well as the catchment characteristics, we classify the status of the Volga River ecosystem on the uppermost 670 km section (calculated from the monitoring points of Roshydromet, see Table 2) as “balanced”.
3.3. The Problem of “Natural Pollution”
It is important to note that in the upper part of the Volga basin, mires have a great influence on water quality. Due to mires, increased concentrations of difficult-to-oxidize organic substances, iron, manganese, zinc, copper, and phenols are very often observed in the water [31]. Such natural features should be taken into account when assessing water quality using formal criteria.
Using the example of the Roshydromet monitoring points located in Tver (above and below the city), it can be seen that the values of some hydrochemical indicators often exceed the MPC (maximum permitted concentration; defined in the order of the Ministry of Agriculture of the Russian Federation No. 552 dated 13 December 2016 “On approval of water quality standards for fishery waterbodies, including maximum concentration limits of pollutants in the water”) even upstream of the city (Figure 5).
Meanwhile, there are definite problems with water quality associated with the phenomenon of secondary pollution that occurs in certain periods of the year (complete freezing in late winter as well as algal blooms in summer), and mainly—in reservoirs where sediments accumulate. Sometimes, the concentrations of the element manganese in the water of reservoirs reach 2000 mg/L.
The reason for the high concentrations of manganese is the lack of oxygen in some periods. Under reducing conditions, active diffusion of manganese into water goes from bottom sediments, and, accordingly, a sharp rise in concentration is observed.
3.4. Changes in the Content of Biogenic Elements and Indicators of Organic Matter in the Water of the Ivankovskoye Reservoir over a Long-Term Period
The content of biogenic elements and organic matter in the water of reservoirs are important characteristics of the ecological state of the reservoir; therefore, the study of these indicators is included in the mandatory monitoring programs.
Previous studies have shown that the Ivankovskoye Reservoir is characterized by relatively high concentrations of nitrates and phosphates, which is due to the anthropogenic load on the reservoir and its catchment [26,39,40,41]. For nitrates in the long-term context, there is an insignificant upward trend (Figure 6a) [40]. The analyses of average annual concentrations of nitrates in the water of the Ivankovskoye Reservoir revealed a slight tendency to increase. This is related to an increase in the supply of nitrates as a result of the development of the coastal zone of the reservoir, as well as the establishment of dacha (a seasonal or year-round second home) zones.
A change in the anthropogenic load leads to a change in the content of biogenic elements in the water of water bodies. The most intensive agricultural use of the territory adjacent to the Ivankovskoye Reservoir was in the 80s of the last century; this is reflected by the highest concentrations of phosphates (Figure 6b) in the water of the reservoir in this period [40].
4. Discussion
Our study provides a holistic view on the physico-chemical condition of the headwaters of the Volga. The hydrochemical features of the region are mainly associated with a large number of mires and consist of increased values of chromaticity, oxidability, and high concentrations of iron, manganese, zinc and copper [35,42]. At the border of the mire and forest landscapes, surface waters are intensively saturated with various inorganic and organic substances, which is explained by the contact of acidic mire waters containing large amounts of fulvic acids with mineral soil and the subsequent formation of water-soluble and colloidal complexes. This is described herein as “natural pollution”. Further, data from Ivankovskoye VDHR revealed that the bottom sediments accumulated in reservoirs under certain conditions became a source of secondary water pollution, in particular manganese.
Based on the calculation of modal intervals of values of hydrochemical indicators in accordance with the criteria of the Hydrochemical Institute of Roshydromet, we assign the status of the Volga River ecosystem on its uppermost 670 km section as “balanced“. It is important to note that the specific combinatorial index of water pollution (UKIZV; see RD 52.24.643-2002 [43]) is currently used to assess the quality of surface waters in Russia. This indicator has a significant drawback since its value is also influenced by naturally caused exceedances of MPC of such indicators as oxidizability, iron, manganese, copper, zinc, and phenols. In accordance with the values of the UKIZV in the monitoring points of Roshydromet, the uppermost 670-km section of the Volga River is officially characterized as “very polluted” [31]. The system for assessing the quality of surface waters based on comparison with the country-wide MPC standards does not take into account the regional hydrochemical specifics of water bodies and leads to a distorted view of water quality (worse than it actually is). Thus, modal values of hydrochemical parameters determined on anthropogenically undisturbed sections of the river flow can be an alternative to MPC for assessing water quality.
Within different scientific projects biological sampling is also carried out. Based on this data, the free-flowing section between the Upper Volga Lakes and Tver is characterized as beta-mesosaprobic based on phytoplankton [44] and macroinvertebrates [18]. Also, the free-flowing section provides important habitats for rare species, such as the mayfly Prosopistoma pennigerum [45].
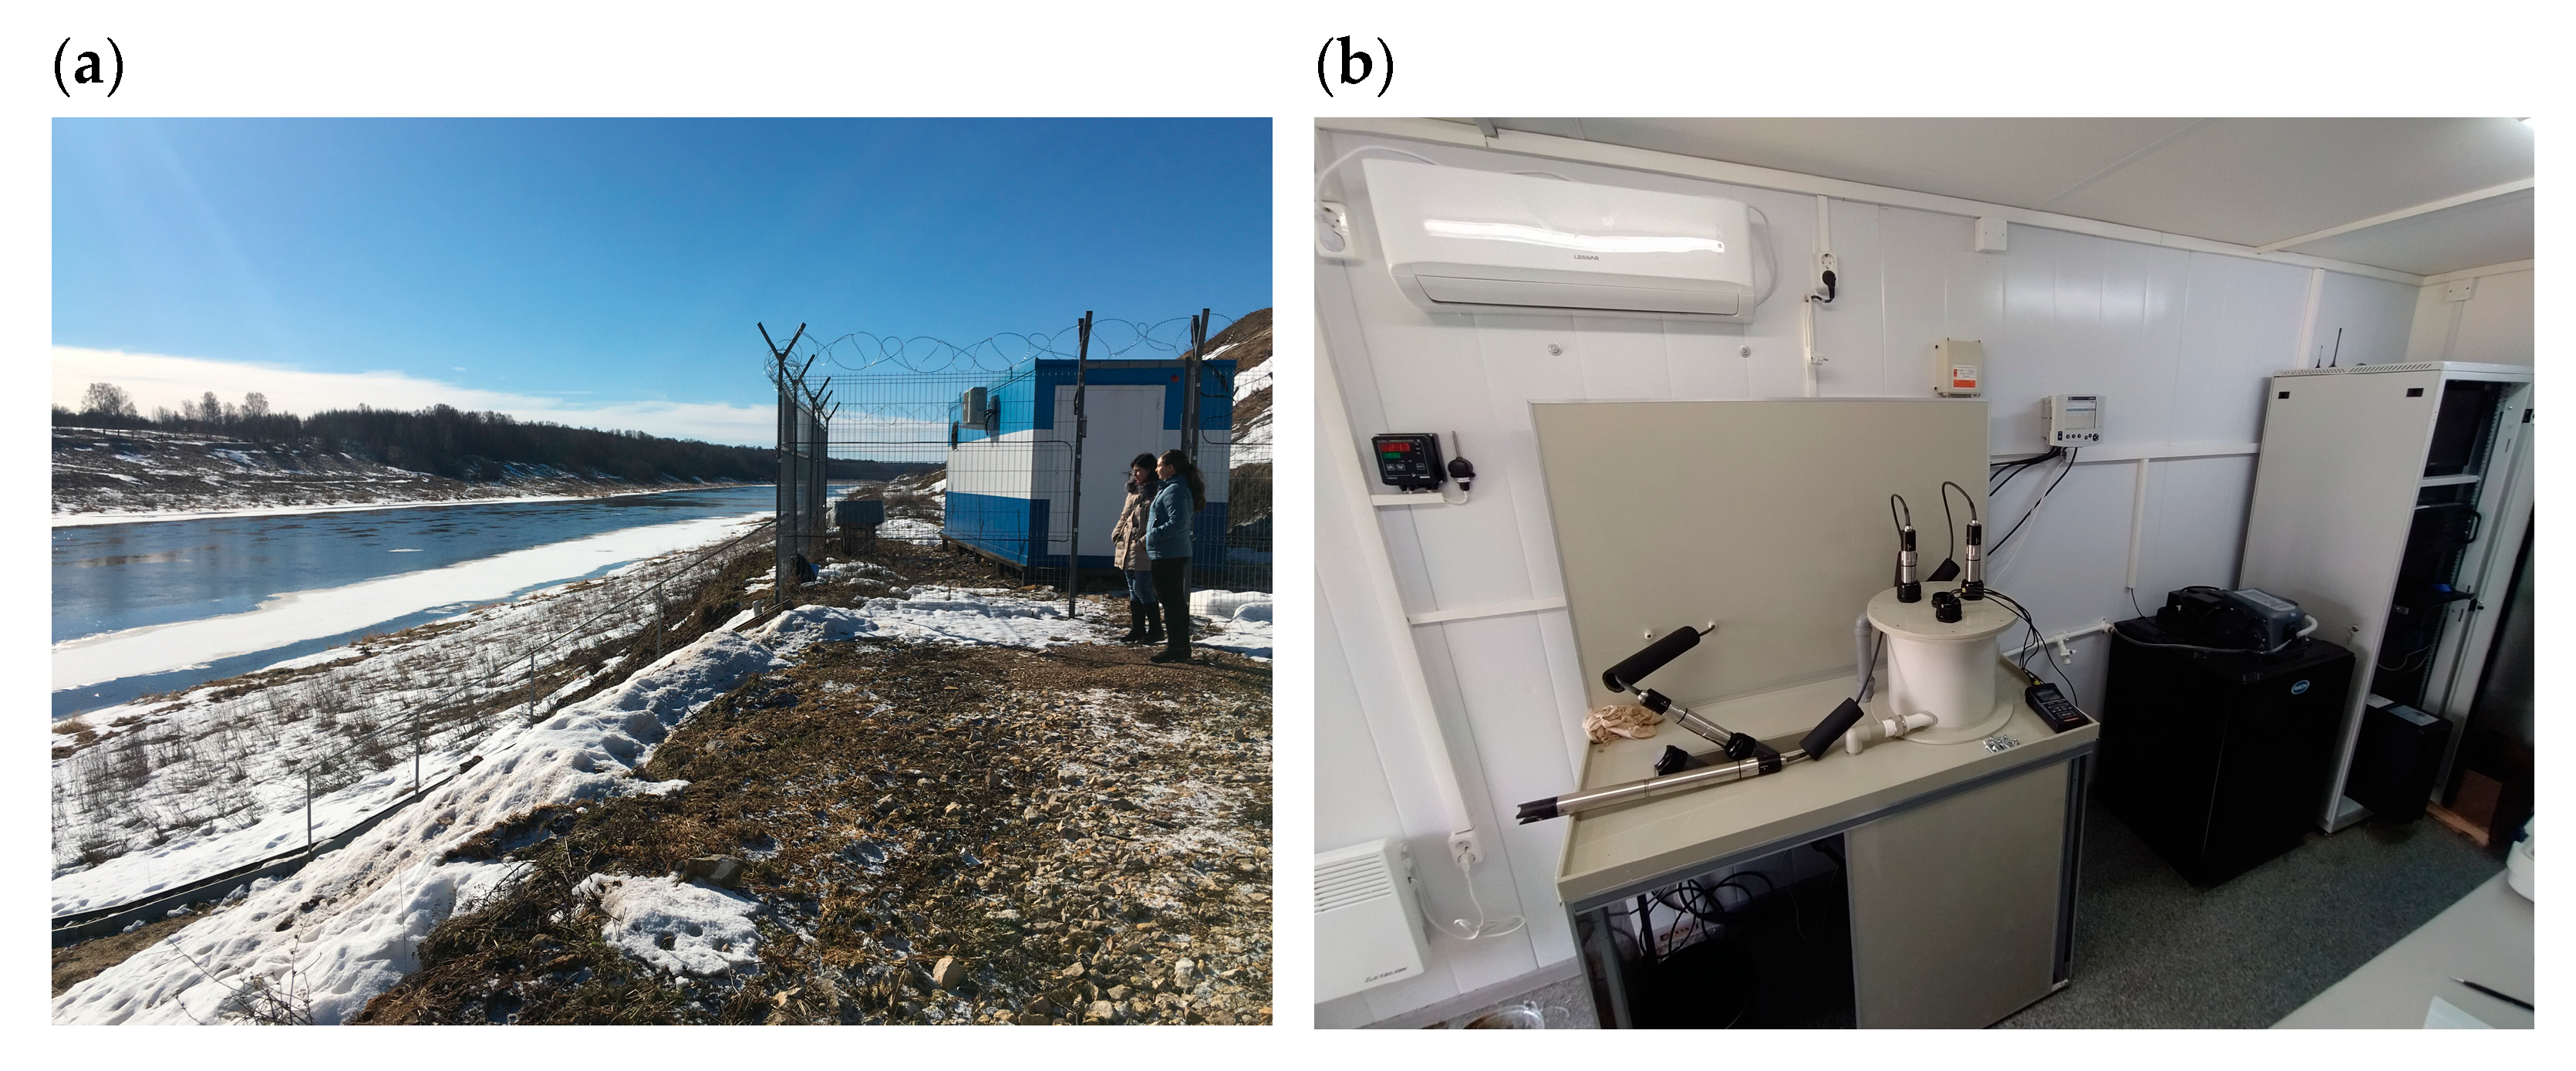
Our long-term data from the Volga headwaters reveal a good overview of dynamics and seasonal changes in water quality. However, from the scientific point of view, the existing data (mostly monthly time series) have limitations regarding the identification of extreme (minimum and maximum) values. This could be overcome with automatic observation stations that allow for studying the dynamics of hydrochemical indicators with minimal time discreteness, i.e., real-time water quality (RTWQ) monitoring [46,47]. An attempt to create such a station was made by the Tver division of Roshydromet in 2018 on the Volga River in Staritsa (Figure 7). Water was pumped continuously through the station, where temperature, oxygen, pH, Eh (redox potential), conductivity, as well as turbidity were measured at 10 min intervals. If critical changes were recognized, automatically, the samples were filled within the station and stored in a fridge. Unfortunately, due to technical reasons (blockage of the intake system by sediments), this station worked only for less than a year. Future research and monitoring campaigns along rivers, i.e., longitudinal studies, should consider the construction of automatic observation stations, as well as the joint use of hydrochemical and hydrobiological methods for assessing the status of the aquatic environment.
An analysis of the literature sources [27,39,40,41] and data from our own field studies showed that over a long period in the water of the Ivankovskoye Reservoir, the concentrations of ammonium and nitrate nitrogen increased, which is evidence of a deterioration in the sanitary condition of the reservoir. The concentrations of total iron and the values of permanganate oxidizability, due to natural factors, on average, change in the same ranges as in the first years of the reservoir’s existence. The intra- and inter-annual variability of all analyzed indicators is still noted. The study in 2021 confirmed the earlier conclusion that it is necessary to clarify the critical concentrations of nitrogen and phosphorus at which intensive algal blooms could occur in the reservoir. It is also necessary to take a number of environmental measures (e.g., riparian vegetation) to reduce the ingress of nitrogen and phosphorus into the reservoir.
The characteristics of the chemical composition of the water of the Ivankovskoye Reservoir at the beginning of the backwater (Tver, 100 m below the mouth of Tvertsa River) and in front of the Ivankovskoye HPP in the first years after the creation of the reservoir (1938, 1944–45) were published by D.D. Kudryavtsev [39]. Total iron concentrations in 1944–1945 downstream of Tver ranged from 0.12 to 0.60 mg/L; ammonium nitrogen concentrations ranged from 0.04 to 0.23 mgN/L, and the maximum concentrations of nitrates did not exceed 0.16 mgN/L. In 1938, the values of oxidizability in the water of the reservoir varied from 9.9 (September) to 15.8 mg/L (June), and in 1944, they ranged from 11.2 to 17.1 mg/L.
Analyses of the current state of surface water quality in the upper Volga basin make it possible to assess the existing levels of pollution, trends in change, and possibilities for its restoration. In order to assess the possibility of restoring water quality, it is necessary to determine the concentrations of pollutants. Nutrients, primarily nitrates and phosphates, are the limiting factors of water “blooming”, which is typical for shallow water bodies of slow water exchange, in particular, the Ivankovo reservoir. Previous studies [40] showed that the maximum concentration of phosphorus and mineral nitrogen, at which the phytoplankton biomass did not exceed its background value (0.81 mg/L), was 0.07 mg/L, respectively 1.5 mg/L.
Concentrations of ammonium nitrogen in the water of the Ivankovskoye Reservoir in the period from 2018 to 2021 changed, on average, in the range of 0.03–1.61 mgN/L and were higher in certain periods than in the first years of existence [40]. An increase in concentrations is evidence of a deterioration of the sanitary condition of the reservoir. The concentrations of nitrate nitrogen in the water of the reservoir in recent years have fluctuated in the range of 0.06–0.88 mgN/L and were higher than in the first years of the existence of the reservoir [40,41] but below the limit at which the phytoplankton values exceed the background values.
Total iron concentrations from 2018 to 2021, on average, fluctuated in the range of 0.06–0.34 mgN/L. The maximum concentrations were recorded in winter at the Bezborodovo gauge. The range of their change in comparison with the first years of the existence of the reservoir [39] has practically not changed, which is not surprising since the content of iron in the water of the reservoir is determined mainly by natural factors. The seasonal dynamic in the iron concentrations in rivers with paludified catchments is also known from other catchments, e.g., [48,49], which is linked to fluctuating pH [48] as well as the source (surface water vs. groundwater) [50].
The maximum values of color and permanganate oxidizability in recent years in all observation sites were noted in spring. The range of values varied from 24 to 90 degrees (Pt-Co scale), respectively, from 6.6 to 21.2 mgO/L. The range of changes in permanganate oxidizability in recent years, on average, has remained the same as in the first years of the reservoir’s existence. But the minimum and maximum observed values in some years differed from those observed in the first years of existence. For indicators of the content of organic matter and biogenic elements, spatio-temporal variability is characteristic under the influence of changes in water discharge and anthropogenic load.
Since 2004, the ECOMAG (ECOlogical Model for Applied Geophysics) model has been used for the simulation of hydrological characteristics and water inflow into reservoirs of the Volga–Kama cascade [51], and recently, heavy metals were also included in the model [52,53]. A future application could be the modeling of nitrogen loads toward the Ivankovskoye Reservoir based on the data presented herein.
In the last century, in European rivers and lakes, the water temperature rose in the range from +0.05 to +0.8 °C per decade, and our case study along Tudovka—a tributary of the Volga in Tver region—revealed an increase of 0.20 °C/decade [54]. For the free-flowing section of the Volga River in the Tver region, we are currently analyzing the available dataset in order to compare the data from a mid-sized tributary with the main channel.
5. Conclusions
Our case study showcases the effect of mires on river water quality, which is recognized globally, e.g., [55,56,57], and establishes a methodological framework for water quality monitoring. Overall, long-term research and monitoring support the process of understanding a natural system, and it is important to address changes associated with climate change [58,59] and, subsequently, rising water temperatures.
Supplementary Materials
The following supporting information can be downloaded at https://www.mdpi.com/article/10.3390/w16030491/s1, Supporting Information S1: Physico-chemical characterization of Volga in summer low water period 2021.
Author Contributions
Conceptualization, V.V.K. and M.S.; methodology, V.V.K., I.L.G., E.A.C. and M.S.; validation, V.V.K. and M.S.; formal analysis, V.V.K. and I.L.G.; investigation, V.V.K., I.L.G., E.A.C. and M.S.; resources, V.V.K. and I.L.G.; data curation, V.V.K.; writing—original draft preparation, V.V.K., I.L.G. and M.S.; writing—review and editing, V.V.K., I.L.G., E.A.C. and M.S.; project administration, V.V.K. and M.S.; funding acquisition, I.L.G. All authors have read and agreed to the published version of the manuscript.
Funding
This research is partially funded by the Water Problems Institute of the Russian Academy of Sciences, state assignment No. FMWZ-2022-0002 (Ministry of Science and Higher Education of the Russian Federation).
Data Availability Statement
Data are contained within the article or supplementary material.
Acknowledgments
We acknowledge Alexey Borisovich Komissarov for his support during fieldwork and analyses.
Conflicts of Interest
The authors declare no conflicts of interest.
References
- Meran, G.; Siehlow, M.; von Hirschhausen, C. Water Availability: A Hydrological View. In The Economics of Water; Meran, G., Siehlow, M., von Hirschhausen, C., Eds.; Springer Water: Cham, Switzerland; Berlin/Heidelberg, Germany, 2021; pp. 9–21. [Google Scholar]
- Shiklomanov, I.A. World Water Resources: A New Appraisal and Assessment for the 21st Century; United Nations Educational, Scientific and Cultural Organization: Paris, France, 1998; pp. 1–40. [Google Scholar]
- Alley, W.M.; Healy, R.W.; LaBaugh, J.W.; Reilly, T.E. Flow and Storage in Groundwater Systems. Science 2002, 296, 1985–1990. [Google Scholar] [CrossRef]
- Portner, K.M. Cooperative riverfront planning: The Colorado river, Grand Junction, Colorado. Can. Water Resour. J. 1992, 17, 264–269. [Google Scholar] [CrossRef]
- Mendelsohn, J.; El Obeid, S. Okavango River-The Flow of a Lifeline; Struik Publishers: Cape Town, South Africa, 2004; pp. 1–176. [Google Scholar]
- Wymenga, E.; van der Kamp, J.; Fofana, B.; Zwarts, L. Ecological evaluation of dams and irrigation in the Upper Niger. In The Niger, a Lifeline. Effective Water Management in the Upper Niger Basin; Zwarts, L., van Beukering, P., Kone, B., Wymenga, E., Eds.; Tienkamp & Verhey: Vlaardingen, The Netherlands, 2005; pp. 211–223. [Google Scholar]
- Taïbi, A.N.; Kane, A.; Bourlet, M.; Lorin, M.; Ballouche, A. The Senegal River, a Disturbed Lifeline in the Sahel. In River Culture–Life as a Dance to the Rhythm of the Waters; Wantzen, K.M., Ed.; UNESCO Publishing: Paris, France, 2023; pp. 79–113. [Google Scholar]
- Kashchenko, O.; French, M. The Volga River: Russia’s Strained Lifeline. 2005. Available online: http://www.cabri-volga.org/DOC/CabriVolgaBriefIssue1.pdf (accessed on 18 November 2023).
- Kruse, J.; Fellin, L.; Fuller, S.; Womack, A. Analyses of the Upper Mississippi and Illinois Rivers as Grain Transport Arteries: A Spatial Equilibrium Analyses. In Proceedings of the 48th Annual Transportation Research Forum, Boston, MA, USA, 15–17 March 2007. [Google Scholar]
- de Villeneuve, C.H.V. Western Europe’s Artery: The Rhine. Nat. Resour. J. 1996, 36, 441–454. [Google Scholar]
- Denisov, N. The Artery of Eastern Ukraine. Summary of the Analysis of Water Issues in the Siverskyi Donets River and Programme of Measures to Address Them; Vaite LLC: Kyiv, Ukraine, 2021; pp. 1–102. [Google Scholar]
- Clark, C.; Emmanouil, N.; Page, J.; Pelizzon, A. Can You Hear the Rivers Sing? Legal Personhood, Ontology, and the Nitty Gritty of Governance. Ecol. Law Q. 2019, 45, 787–844. [Google Scholar]
- Boccaletti, G. Water: A Biography; Pantheon: New York, NY, USA, 2021; pp. 1–400. [Google Scholar]
- Salati, E.; Dall’Olio, A.; Matsui, E.; Gat, J.R. Recycling of water in the Amazon Basin: An isotopic study. Water Resour. Res. 1979, 15, 1250–1258. [Google Scholar] [CrossRef]
- van der Ent, R.J.; Savenije, H.H.G.; Schaefli, B.; Steele-Dunne, S.C. Origin and fate of atmospheric moisture over continents. Water Resour. Res. 2010, 46, W09525. [Google Scholar] [CrossRef]
- Makarieva, A.M.; Gorshkov, V.G. Biotic pump of atmospheric moisture as driver of the hydrological cycle on land. Hydrol. Earth Syst. Sci. 2007, 11, 1013–1033. [Google Scholar] [CrossRef]
- Oltchev, A.; Cermak, J.; Gurtz, J.; Tishenko, A.A.; Kiely, G.; Nadezhdina, N.; Zappa, M.; Lebedeva, N.; Vitvar, T.; Albertson, J.D.; et al. The response of the water fluxes of the boreal forest region at the Volga’s source area to climatic and land-use changes. Phys. Chem. Earth Parts A B C 2002, 27, 675–690. [Google Scholar] [CrossRef]
- Schletterer, M.; Füreder, L.; Kuzovlev, V.V.; Zhenikov, Y.N.; Grigorieva, I.L. Lowland river reference condition: Spatial and temporal patterns of the zoobenthos community in the Volga headwaters (2006–2010). Hydrobiologia 2014, 729, 175–189. [Google Scholar] [CrossRef]
- The 17 Goals. Available online: https://sdgs.un.org/goals (accessed on 18 November 2023).
- RD 52.24.309-2016; Regulatory Document: Organization and Conduct of Regime Observations of the State and Pollution of Surface Land Waters. Publishing House of the Meteorological Agency Roshydromet: Moscow, Russia, 2016; 104p.
- Nikanorov, A.M. Hydrochemistry; NOK: Rostov-on-Don, Russia, 2008; 462p. [Google Scholar]
- Pavluk, T.I.; Bij de Vaate, A.; Leslie, H.A. Development of an Index of Trophic Completeness for benthic macroinvertebrate communities in flowing waters. Hydrobiologia 2000, 427, 135–141. [Google Scholar] [CrossRef]
- Bartram, J.; Balance, R. (Eds.) Water Quality Monitoring. A Practical Guide to the Design and Implementation of Freshwater Quality Studies and Monitoring Programmes; F & FN Spon Ltd.: London, UK, 1996; pp. 1–400. [Google Scholar]
- Butorin, N.V. (Ed.) Volga i Eyo Zhizn (The Volga and Its Life); Nauka: Leningrad, Russia, 1978; 350p. [Google Scholar]
- Mineeva, N.; Lazareva, V.; Litvinov, A.; Stepanova, I.; Chuiko, G.; Papchenkov, V.; Korneva, L.; Shcherbina, G.; Pryanichnikova, E.; Perova, S.; et al. Chapter 2-The Volga River. In Rivers of Europe, 2nd ed.; Tockner, K., Zarfl, C., Robinson, C.T., Eds.; Elsevier Ltd.: Amsterdam, The Netherlands, 2022; pp. 27–79. [Google Scholar]
- Grigoryeva, I.L.; Lantsova, I.V.; Tulyakova, G.V. Geoekologiya Ivan’kovskogo Vodokhranilishcha i ego Vodosbora (Geoecology of the Ivan’kovo Reservoir and Its Drainage Basin); Bulat: Tver, Russia, 2000; 248p. [Google Scholar]
- Butorin, N.V. (Ed.) Ivankovskoye vodokhranilishche i ego zhizn. Tr. Inst. Biol. Vnutr. Vod. AN SSSR 1978, 34, 1–304. [Google Scholar]
- Grishantseva, E.S.; Safronova, N.S. Ecological-geochemical assessment of the state of the Volga source of water supply to Moscow. Water Resour. 2012, 39, 305–321. [Google Scholar] [CrossRef]
- Hydrometeorological Regime of Lakes and Reservoirs in the USSR: Upper Volga Reservoirs; Gidrometeoizdat: Leningrad, Russia, 1975; 291p.
- Gosudarstvennyi Doklad o Sostoyanii Okruzhayushchei Sredy na Territorii Tverskoi Oblasti v 2010 g. (State Report on the Environmental Conditions in Tver Province in 2010), Tver, 2011. Available online: https://minpriroda.tverreg.ru/deyatelnost-iogv/napravleniya/okhrana-okruzhayushchey-sredy/ (accessed on 29 December 2023).
- The Quality of Surface Waters of the Russian Federation. The Yearbook 2021. Rostov-on-Don, The State Hydrochemical Institute of Roshydromet, 2022, 620p. Available online: https://gidrohim.com/node/44 (accessed on 29 December 2023).
- RD 52.18.595-96. Federal List of Measurement Techniques Permitted for Use in the Monitoring of Environmental Pollution, 1998; 48p. Available online: https://meganorm.ru/Data2/1/4293824/4293824448.pdf (accessed on 14 January 2024). (In Russian)
- Kurlov, M.G.; Sobkevich, A.I. Opyt Klassifikatsii Sibirskikh Tselebnykh Mineral’nykh Vod, Soglasno Khimicheskomu Ikh Sostavu. Tomsk, USSR, Tomskogo Gubernskogo Otdeleniya Gosizdatelstva. 1921. Available online: http://vital.lib.tsu.ru/vital/access/manager/Repository/vtls:000396437 (accessed on 7 April 2021).
- Schletterer, M.; Füreder, L.; Kuzovlev, V.V.; Zhenikov, K.Y.; Zhenikov, Y.N. REFCOND_ VOLGA: A monitoring programme for water quality in the headwaters of the Volga River (Tver region, Russia). Rev. Eletrônica De Gestão E Tecnol. Ambient. GESTA 2016, 4, 18–40. [Google Scholar]
- Zhenikhov, K.Y.; Kuzovlev, V.V.; Zhenikhov, Y.N.; Schletterer, M. The study of the relationships between indicators of surface water quality in wetland catchments: A case study of the Tudovka River in the Tver Region. Geoekologia 2019, 3, 68–76. [Google Scholar]
- Naydenova, V.I. Hydrochemical Characteristics of Medium and Large Rivers of the European Territory of the USSR; Voronkov, P.P., Ed.; Gidrometeoizdat: Leningrad, Russia, 1971; 296p. [Google Scholar]
- R 52.24.862-2017; Recommendation: Choice of Permissible Fluctuation Limits of Informative Hydrochemical Indicators of the State of River Ecological Systems Located in Various Climatic Conditions. Roshydromet: Rostov-on-Don, Russia, 2017; 18p.
- RD.52.24.661–2004; Regulatory document: Assessment of the Risk of Anthropogenic Impact of Priority Pollutants on the Surface Waters of the Land. Publishing House of the Meteorological Agency Roshydromet: Moscow, Russia, 2006; 26p.
- Kudryavtsev, D.D. Comparative characteristics of the hydrochemical regime of the Upper Volga reservoirs: Ivankovo, Uglich and Rybinsk. Proc. Borok Biol. Stn. 1950, 1, 80–96. [Google Scholar]
- Grigoryeva, I.L.; Komissarov, A.B.; Chekmareva, E.A. Transformation of the water quality of the Ivankovo reservoir and its small tributaries over a long period under the in-fluence of natural and anthropogenic factors. Quest. Geogr. 2018, 145, 337–346. [Google Scholar]
- Debolsky, V.K.; Kocharyan, A.G.; Grigoryeva, I.L.; Lebedeva, I.P.; Tolkachev, G.Y. Problems of water quality formation in surface water supply sources and ways to solve them using the example of the Ivankovo reservoir. Water Chem. Ecol. 2009, 7, 2–11. [Google Scholar]
- Kuzovlev, V.V.; Schletterer, M. Limnological characterization of the sources of Volga, Dnieper & Western Dvina (Daugava). Glob. J. Ecol. 2022, 7, 072–076. [Google Scholar]
- The Method of Integrated Assessment of the Degree of Pollution of Surface Waters by Hydrochemical Indicators; Publishing House of the Meteorological Agency Roshydromet: Moscow, Russia, 2002; 55p.
- Komissarov, A.V. Phytoplankton of the unregulated Upper Volga River. In Algae: Problems of Taxonomy, Ecology and Use in Monitoring; Voloshko, L.N., Ed.; Renome: St. Petersburg, Russia, 2018; pp. 238–241. [Google Scholar]
- Schletterer, M.; Weiss, S.J.; Kuzovlev, V.V.; Vitecek, S.; Borgwardt, F.; Graf, W. The rare and enigmatic mayfly Prosopistoma pennigerum (Müller, 1785): Habitat characteristics, recent records from the Volga (Russia) and Vjosa (Albania) rivers, and a proposal for flagship species status. Aquat. Conserv. Mar. Freshw. Ecosyst. 2021, 31, 3636–3643. [Google Scholar] [CrossRef] [PubMed]
- Harvey, R.; Lye, L.; Khan, A. Recent Advances in the Analysis of Real-time Water Quality Data Collected in Newfoundland and Labrador. Can. Water Resour. J. Rev. Can. Des Ressour. Hydr. 2011, 36, 349–361. [Google Scholar] [CrossRef]
- Mijović, S.; Palmar, B. Water quality monitoring automation of rivers in Serbia. In FACTA UNIVERSITATIS, Series: Working and Living Environmental Protection; 2012; Volume 9, pp. 1–10. Available online: https://tarjomefa.com/wp-content/uploads/2016/02/4367-engilish.pdf (accessed on 30 December 2023).
- Heikkinen, K. Seasonal-changes in iron transport and nature of dissolved organic-matter in a humic river in northern Finland. Earth Surf. Process. Landf. 1990, 15, 583–596. [Google Scholar] [CrossRef]
- Abesser, C.; Robinson, R.; Soulsby, C. Iron and manganese cycling in the storm runoff of a Scottish upland catchment. J. Hydrol. 2006, 326, 59–78. [Google Scholar] [CrossRef]
- Ingri, J.; Conrad, S.; Lidman, F.; Nordblad, F.; Engström, E.; Rodushkin, I.; Porcelli, D. Iron isotope pathways in the boreal landscape: Role of the riparian zone. Geochim. Et Cosmochim. Acta 2018, 239, 49–60. [Google Scholar] [CrossRef]
- Gelfan, A.N.; Motovilov, Y.G. Long-term hydrological forecasting in cold regions: Retrospect, current status and prospects. Geogr. Compass 2009, 3, 1841–1864. [Google Scholar] [CrossRef]
- Motovilov, Y.G.; Fashchevskaya, T.B. Simulation of spatially-distributed copper pollution in a large river basin using the ECOMAG-HM model. Hydrol. Sci. J. 2019, 64, 739–756. [Google Scholar] [CrossRef]
- Motovilov, Y.; Fashchevskaya, T. Modeling Management and Climate Change Impacts on Water Pollution by Heavy Metals in the Nizhnekamskoe Reservoir Watershed. Water 2021, 13, 3214. [Google Scholar] [CrossRef]
- Bui, M.T.; Kuzovlev, V.V.; Zhenikov, Y.N.; Füreder, L.; Seidel, J.; Schletterer, M. Water temperatures in the headwaters of the Volga River: Trend analyses, possible future changes, and implications for a pan-European perspective. River Res. Appl. 2018, 34, 495–505. [Google Scholar] [CrossRef]
- Pickard, A.E.; Heal, K.V.; McLeod, A.R.; Dinsmore, K.J. Temporal changes in photoreactivity of dissolved organic carbon and implications for aquatic carbon fluxes from peatlands. Biogeosciences 2017, 14, 1793–1809. [Google Scholar] [CrossRef]
- Pschenyckyj, C.; Donahue, T.; Kelly-Quinn, M.; O’Driscoll, C.; Renou-Wilson, F. An examination of the influence of drained peatlands on regional stream water chemistry. Hydrobiologia 2023, 850, 3313–3339. [Google Scholar] [CrossRef]
- Bhattacharjee, J.; Marttila, H.; Molina Navarro, E.; Juutinen, A.; Tolvanen, A.; Haara, A.; Jouni Karhu, J.; Kløve, B. Impacts on water quality in the peatland dominated catchment due to foreseen changes in Nordic Bioeconomy Pathways. Sci. Rep. 2023, 13, 6283. [Google Scholar] [CrossRef]
- Ekström, S.M.; Regnell, O.; Reader, H.E.; Nilsson, P.A.; Löfgren, S.; Kritzberg, E.S. Increasing concentrations of iron in surface waters as a consequence of reducing conditions in the catchment area. J. Geophys. Res. Biogeosci. 2016, 121, 479–493. [Google Scholar] [CrossRef]
- Škerlep, M.; Nehzati, S.; Sponseller, R.A.; Persson, P.; Laudon, H.; Kritzberg, E.S. Differential trends in iron concentrations of boreal streams linked to catchment characteristics. Glob. Biogeochem. Cycles 2023, 37, e2022GB007484. [Google Scholar] [CrossRef]
Figure 1.
Headwaters of the Volga and sampling locations in 2021 (details in Table 1).
Figure 1.
Headwaters of the Volga and sampling locations in 2021 (details in Table 1).

Figure 2.
Mineralization in the headwaters of the Volga in summer 2021.

Figure 3.
Range of (a) color, (b) biological oxygen demand, (c) mineral nitrogen and (d) mineral phosphorous in the headwaters of the Volga in summer 2021.
Figure 3.
Range of (a) color, (b) biological oxygen demand, (c) mineral nitrogen and (d) mineral phosphorous in the headwaters of the Volga in summer 2021.
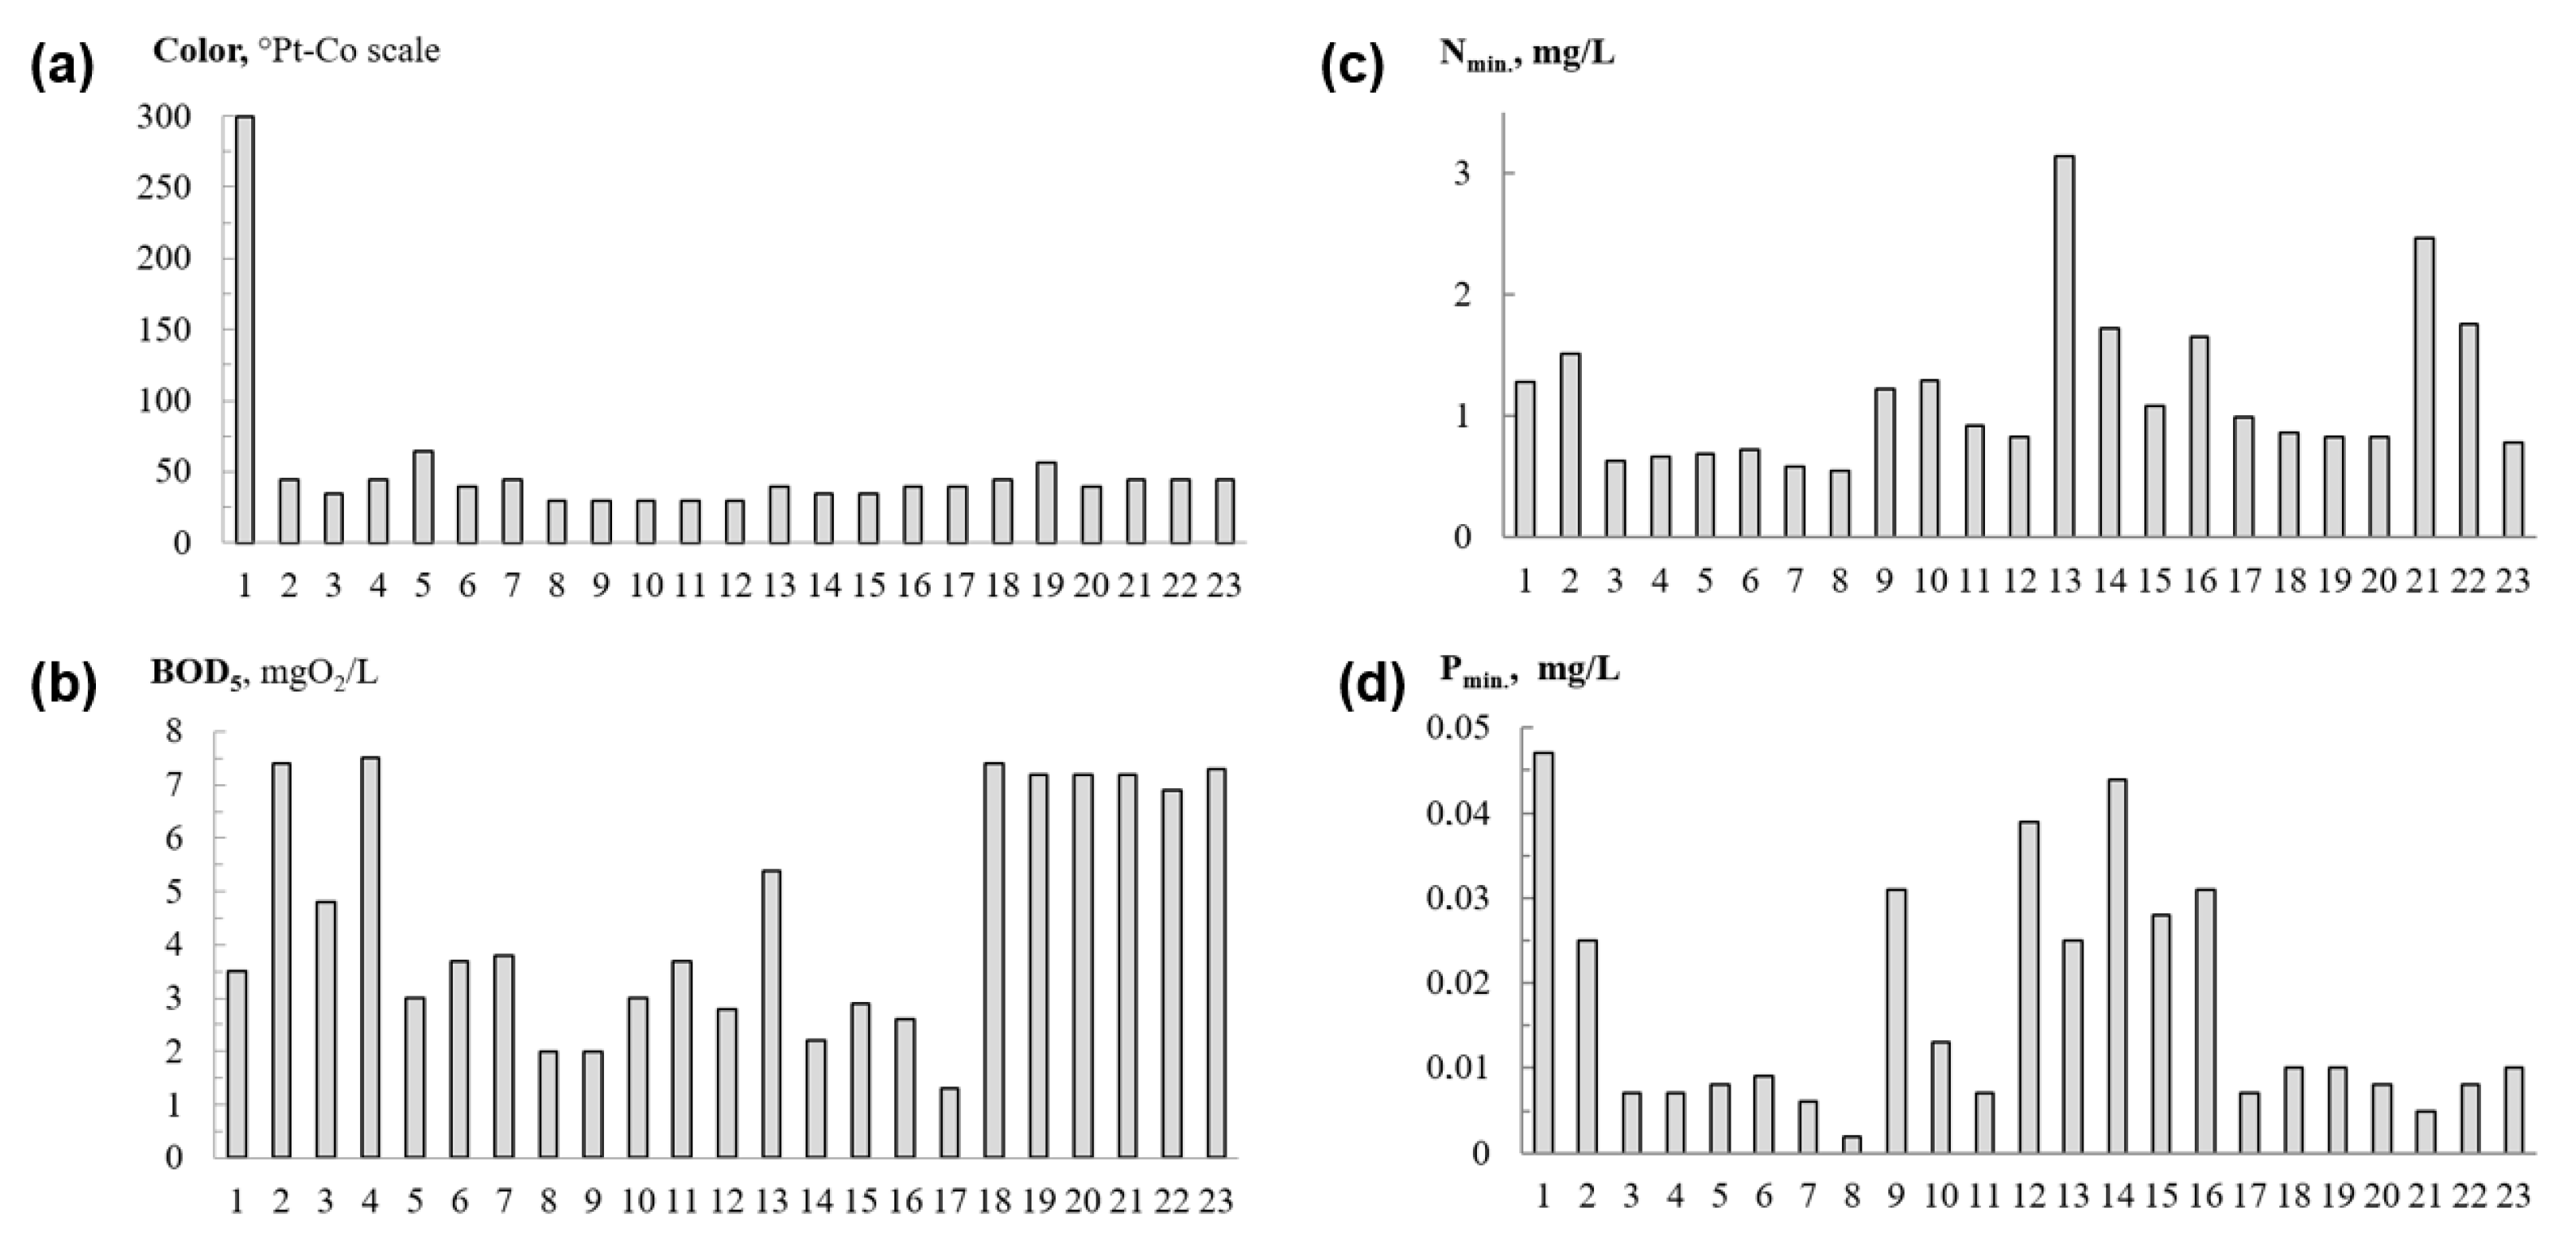
Figure 4.
Variability of some hydrochemical parameters in different phases of the hydrological regime (2012–2018) along the headwaters of the Volga River (locations according to Table 2).
Figure 4.
Variability of some hydrochemical parameters in different phases of the hydrological regime (2012–2018) along the headwaters of the Volga River (locations according to Table 2).
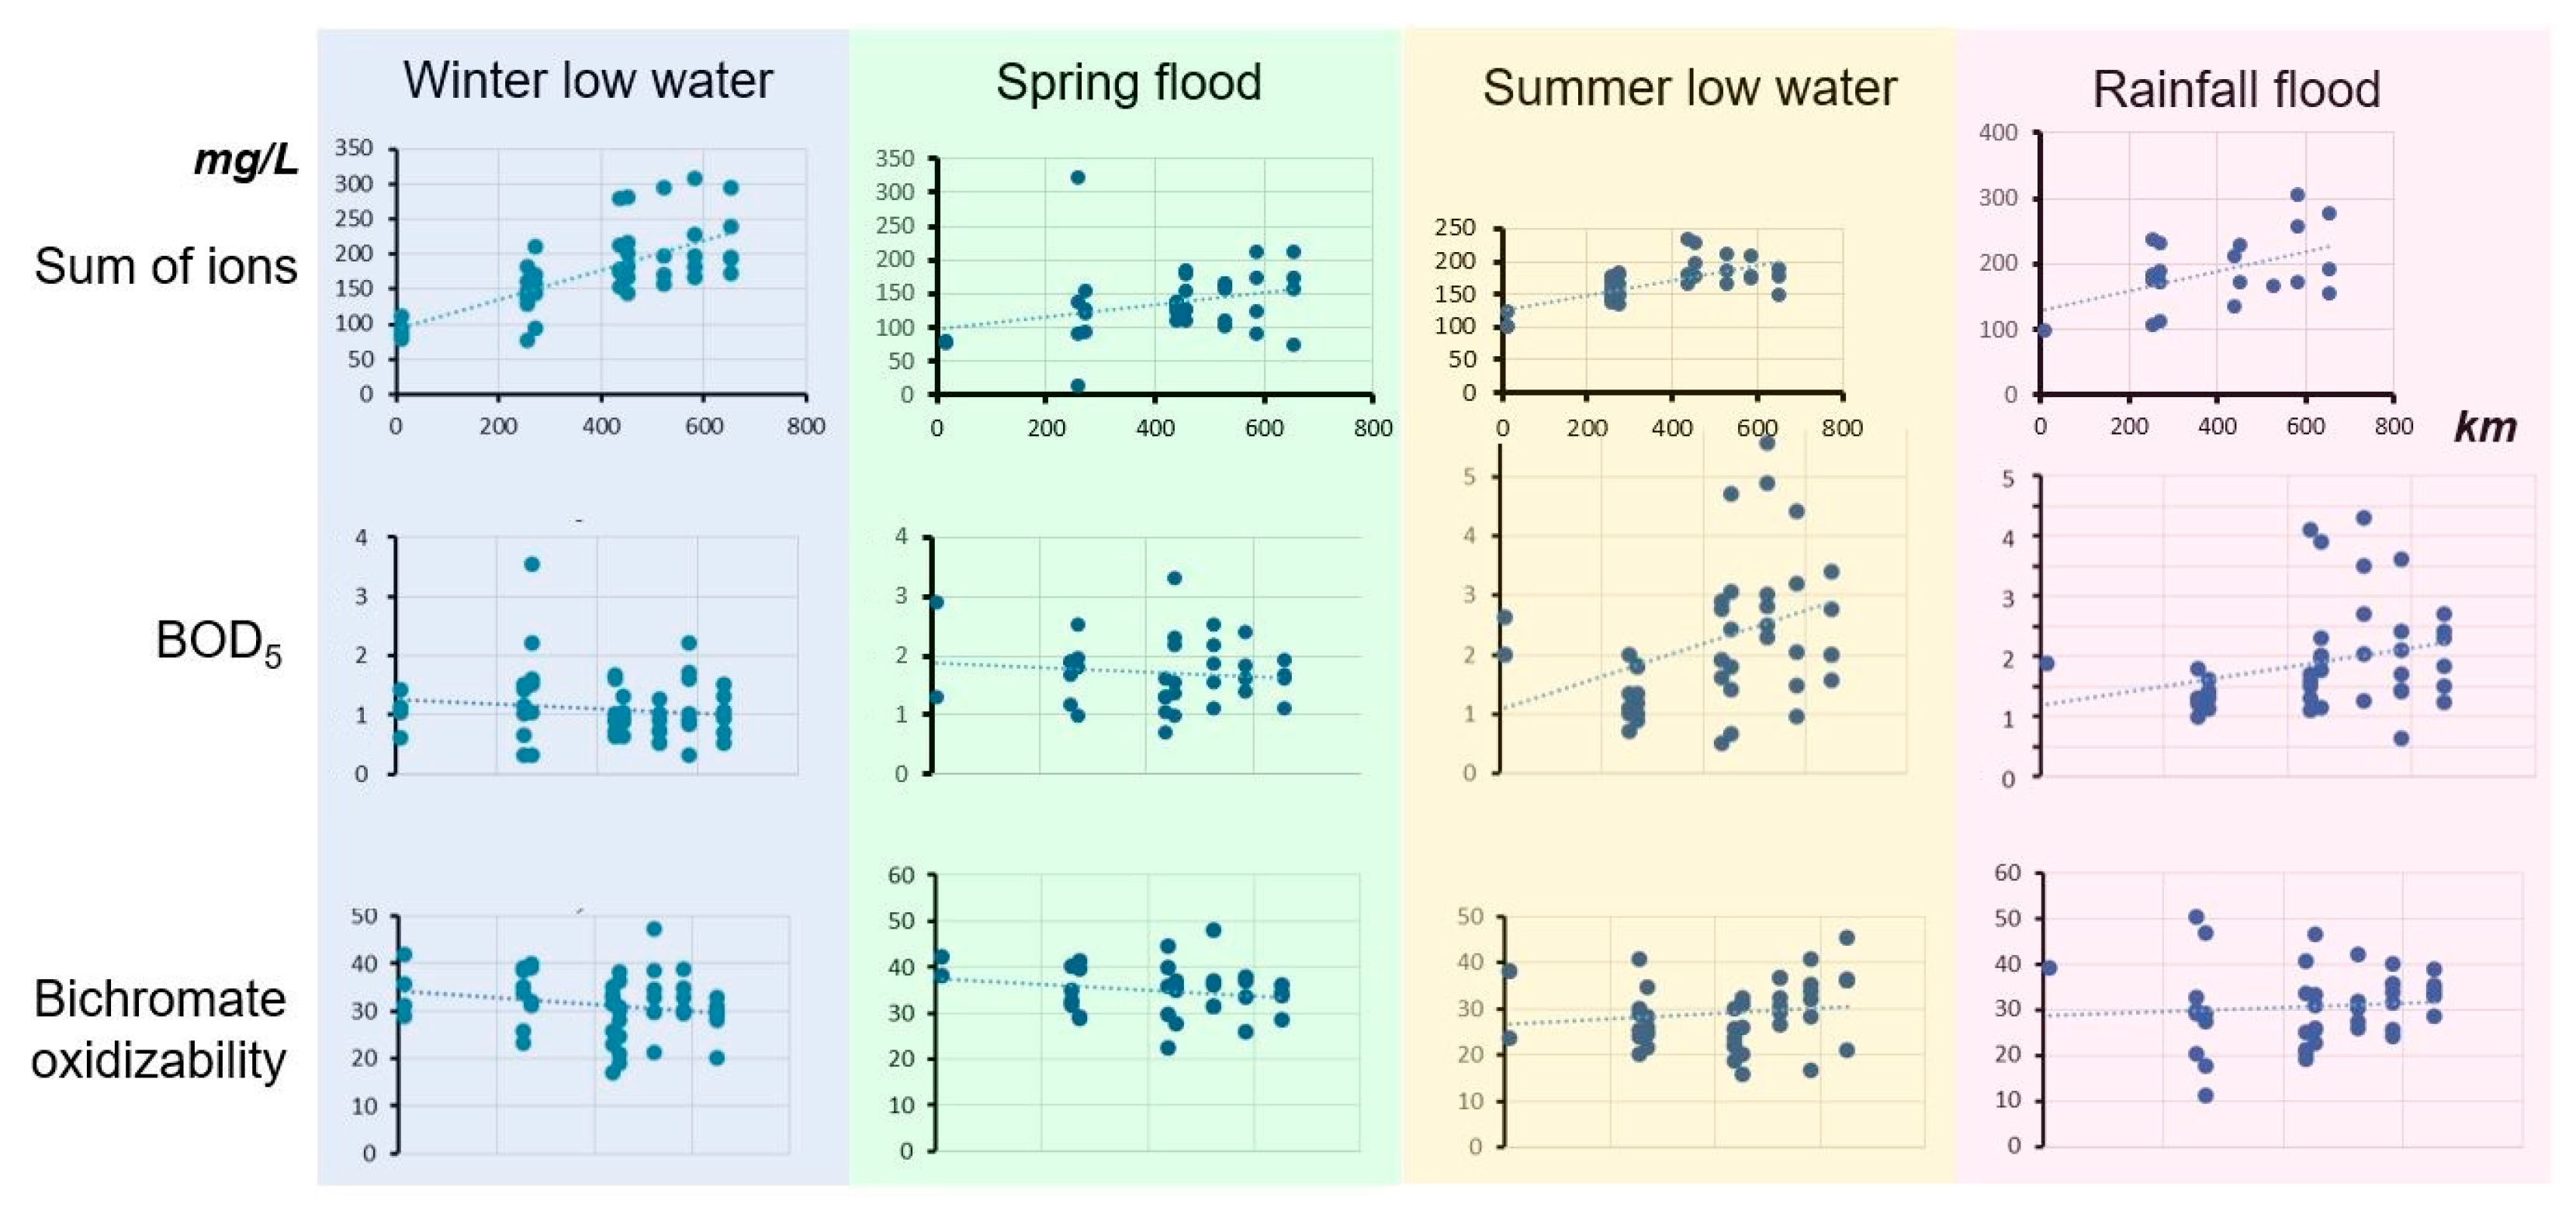
Figure 5.
Monthly dynamics of hydrochemical indicators in the Volga River upstream (green) and downstream (orange) of Tver: (a) Fe, mg/L (MPC = 0.1 mg/L); (b) Bichromate oxidizability (COD), mg/L (MPC = 15 mg/L).
Figure 5.
Monthly dynamics of hydrochemical indicators in the Volga River upstream (green) and downstream (orange) of Tver: (a) Fe, mg/L (MPC = 0.1 mg/L); (b) Bichromate oxidizability (COD), mg/L (MPC = 15 mg/L).

Figure 6.
Long-term dynamics of (a) Phosphate P, mg/L; and (b) Nitrate N, mg/L in Ivankovskoye Reservoir.
Figure 6.
Long-term dynamics of (a) Phosphate P, mg/L; and (b) Nitrate N, mg/L in Ivankovskoye Reservoir.

Figure 7.
Real-time water quality monitoring station at the Volga River in Staritsa: (a) the station on the orographic left bank of the river, (b) measuring devices inside the station.
Figure 7.
Real-time water quality monitoring station at the Volga River in Staritsa: (a) the station on the orographic left bank of the river, (b) measuring devices inside the station.

Table 1.
Sampling sites in the headwaters of the Volga in summer 2021.
| Name of Site | Distance from Source, km | |
|---|---|---|
| 1. | Source of Volga | 0 |
| 2. | Lake Sterzh, v. Kokovkino | 16 |
| 3. | Lake Vselug, v. Gorka | 41 |
| 4. | Lake Peno, v. Peno | 57 |
| 5. | Lake Volgo, v. Selishche | 106 |
| 6. | Volga River, Rzhev | 264 |
| 7. | Volga River, Staritsa | 353 |
| 8. | Volga River, v. Ryabeevo | 432 |
| 9. | Ivankovskoye Reservoir, Gorodnya village | 486 |
| 10. | Ivankovskoye Reservoir, Nizovka Island | 503 |
| 11. | Ivankovskoye Reservoir, mouth of Shosha river | 505 |
| 12. | Ivankovskoye Reservoir, v. Ploski | 512 |
| 13. | Ivankovskoye Reservoir, Konakovo | 522 |
| 14. | Ivankovskoye Reservoir, Moshkovichi Bay | 533.5 |
| 15. | Ivankovskoye Reservoir, Korchev tract | 537.5 |
| 16. | Ivankovskoye Reservoir, Dubna | 557 |
| 17. | Ivankovskoye Reservoir, Peretrusovsky Bay | 544 |
| 18. | Ivankovskoye Reservoir, Novoselsky Bay | 544.5 |
| 19. | Ivankovskoye Reservoir, Fedorovsky Bay | 550.5 |
| 20. | Ivankovskoye Reservoir, Omutninsky Bay | 552 |
| 21. | Ivankovskoye Reservoir, Korovinsky Bay | 558 |
| 22. | Ivankovskoye Reservoir, Domkinsky Bay | 558 |
| 23. | Ivankovskoye Reservoir, 1st technical bay | 562.5 |
Table 2.
Ionic composition of water in the Volga River and its reservoirs at the monitoring points of Roshydromet (summer low water period in 2021).
Table 2.
Ionic composition of water in the Volga River and its reservoirs at the monitoring points of Roshydromet (summer low water period in 2021).
| Monitoring Sites | Distance from Source, km | Kurlov Formula of the Ionic Composition of Water (Mineralization, g/L; Concentration of Ions, % Equivalent) |
|---|---|---|
| Kokovkino | 16 | |
| Rzhev (upstream the city) | 263 | |
| Tver (upstream the city) | 436 | |
| Konakovo | 523 | |
| Kimry | 583 | |
| Kalyazin | 649 |
Table 3.
Hydrochemical characterization of the water in the source of the Volga in different years.
| 23 June 2009 | 24 July 2012 | 14 August 2014 | 4 July 2016 | 21 August 2021 | |
|---|---|---|---|---|---|
| (a) Physico-chemical parameters | |||||
| pH | 7.4 | 6.4 | 6.3 | 6.1 | 6.2 |
| Alkalinity, mg-eq/L | 0.6 | 0.6 | 0.4 | 0.6 | 0.6 |
| Hardness, mg-eq/L | 0.8 | 0.8 | 0.6 | 0.7 | 1.4 |
| (b) Concentration of the main ions and mineralization (M), mg/L | |||||
| HCO3− | 36.6 | 38.3 | 24.4 | 37.4 | 36.8 |
| Ca2+ | 10 | 10 | 6.6 | 6.4 | 13.4 |
| Mg2+ | 3.7 | 3.6 | 3.5 | 4.4 | 9.0 |
| SO42− | 19.0 | 3.0 | 0.1 | 1.3 | 16.3 |
| Cl− | 3.2 | 0.8 | 0.7 | 0.7 | 2.9 |
| M | 75 | 56 | 40 | 53 | 84 |
| (c) Concentrations of biogenic elements (mg/L) | |||||
| N-NH4+ | 1.21 | 0.51 | 0.16 | 0.07 | 0.37 |
| N-NO32− | 0.61 | 0.15 | 0.36 | 0.21 | 0.15 |
| N-NO2− | 0.040 | 0.004 | 0.021 | 0.002 | 0.045 |
| P-PO43+ | 0.009 | 0.016 | 0.027 | 0.004 | 0.047 |
| Ptotal dissolved | 0.030 | 0.079 | 0.107 | 0.022 | 0.105 |
| Fe total dissolved | 0.66 | 0.73 | 1.02 | 0.48 | 0.10 |
| Si | - | 2.1 | 0.1 | 2.6 | 3.5 |
| (d) Concentrations of organic elements | |||||
| Color, ° Pt-Co scale | 360 | 400 | 400 | 450 | 300 |
| Permanganate oxidizability (PO), mgO/L | 60.3 | 69.0 | 72.0 | 66.4 | 58.8 |
| BOD5, mgO2/L | 1.6 | 2.1 | 4.2 | 1.0 | 3.5 |
| Mn, mg/L | 0.52 | 0.04 | 0.07 | 0.01 | 0.01 |
Table 4.
Modal intervals (concentration interval with the highest frequency) in the headwaters of the Volga (2001–2018), Roshydromet data from the locations in Table 2.
Table 4.
Modal intervals (concentration interval with the highest frequency) in the headwaters of the Volga (2001–2018), Roshydromet data from the locations in Table 2.
| Indicator | Modal Interval |
|---|---|
| Cl−, mg/L | 2.0–5.9 |
| Hardness, ° | 2.33–3.52 |
| Bichromate oxidizability, mg/L | 29.7–37.8 |
| BOD5, mg/L | 0.54–1.30 |
| Ammonium N, mg/L | 0.007–0.129 |
| Nitrite N, mg/L | 0.002–0.007 |
| Nitrate N, mg/L | 0.008–0.269 |
| Phosphate P, mg/L | 0.003–0.028 |
| Fe, mg/L | 0.031–0.187 |
| Cu, µg/L | 0.9–4.6 |
| Mn, µg/L | 39.5–72.7 |
| Oil products, mg/L | 0.016–0.029 |
Disclaimer/Publisher’s Note: The statements, opinions and data contained in all publications are solely those of the individual author(s) and contributor(s) and not of MDPI and/or the editor(s). MDPI and/or the editor(s) disclaim responsibility for any injury to people or property resulting from any ideas, methods, instructions or products referred to in the content. |
© 2024 by the authors. Licensee MDPI, Basel, Switzerland. This article is an open access article distributed under the terms and conditions of the Creative Commons Attribution (CC BY) license (https://creativecommons.org/licenses/by/4.0/).
Share and Cite
MDPI and ACS Style
Kuzovlev, V.V.; Grigoryeva, I.L.; Chekmareva, E.A.; Schletterer, M. Water Quality Monitoring in the Volga Headwaters. Water 2024, 16, 491. https://doi.org/10.3390/w16030491
AMA Style
Kuzovlev VV, Grigoryeva IL, Chekmareva EA, Schletterer M. Water Quality Monitoring in the Volga Headwaters. Water. 2024; 16(3):491. https://doi.org/10.3390/w16030491
Chicago/Turabian StyleKuzovlev, Vyacheslav V., Irina L. Grigoryeva, Ekaterina A. Chekmareva, and Martin Schletterer. 2024. "Water Quality Monitoring in the Volga Headwaters" Water 16, no. 3: 491. https://doi.org/10.3390/w16030491
Note that from the first issue of 2016, this journal uses article numbers instead of page numbers. See further details here.