
Operation Risk Simulation and Interaction Impact of Stormwater and Sewage Systems Based on Storm Water Management Model


1
Faculty of Architecture, Civil and Transportation Engineering, Beijing University of Technology, Beijing 100124, China
2
Guangzhou Municipal Engineering Design & Research Institute Co., Ltd., Guangzhou 510095, China
*
Author to whom correspondence should be addressed.
Water 2024, 16(7), 953; https://doi.org/10.3390/w16070953
Submission received: 19 February 2024
/
Revised: 19 March 2024
/
Accepted: 22 March 2024
/
Published: 26 March 2024
(This article belongs to the Special Issue Urban Flood Mitigation and Sustainable Stormwater Management)
Abstract
:With the increasing urbanization rate, higher demand is placed on drainage systems, necessitating analysis of their risk profiles. While many studies focus on the individual hydraulic modeling of stormwater and wastewater systems when considering operational risks, they often overlook the exacerbating effects of combined stormwater and wastewater flows on each other’s risks. In this study, we constructed a model of the combined stormwater and wastewater drainage system in Lijiao, Guangdong Province. We analyzed the operational risks of both stormwater and sewage networks in different scenarios, focusing on full-load pipes, overload pipes, node overflows, and minimum flow velocities. Furthermore, we compared the exacerbating effects of sewage and stormwater on each other’s network operational risks. Simulation results indicated that, for sewage networks with combined sewer sections, the lengths of full-load pipes and overload pipes increased by an average of 27.4% and 16.3%, respectively, during rainy weather scenarios compared to dry weather. After considering the inflow of sewage into combined sewer sections, the average length of full-load pipes increased by 3.8 km, overload pipe length increased by 1.1 km, and overflow volume increased by 2.26 × 10⁴ m3. As the return period of rainfall events increases, these inter-system impacts gradually diminish. Therefore, when modeling drainage systems and assessing operational risks, particularly during low return period rainfall events, the inclusion of both stormwater and sewage in combined sewer networks should be comprehensively considered.
1. Introduction
With the acceleration of urbanization, drainage systems are assuming an increasingly vital role in both urban development and daily life. These systems, characterized by their vastness and complexity, encompass stormwater, sewage, and combined sewer networks, tasked with the collection, conveyance, and discharge of stormwater and wastewater [1,2]. The stormwater drainage system, comprised of a stormwater pipe network and combined sewer network, is responsible for gathering stormwater surface runoff. Any operational deficiencies can lead to drainage blockages, surface water accumulation, and subsequent urban flooding disasters [3,4,5]. Simultaneously, the wastewater drainage system, formed by the sewage pipe network and combined sewer network, is responsible for expelling sewage from various urban sources, including residential and industrial areas. Malfunctions within this system can result in sewage overflow [6,7], inundating treatment plants [8], and other risks. Thus, recognizing operational risks within urban drainage systems is crucial.
The operation risk of a stormwater drainage network mainly refers to the full-load pipe (reaching the maximum drainage capacity), overload pipe (exceeding the maximum drainage capacity), and node overflow from pipes caused by poor drainage of the rainwater pipe network. In examining the operational risks of stormwater pipe networks, research diverges into two primary directions. Firstly, some studies focus on the topology of the network itself. Jinwoo Lee [9] starts by analyzing the planar structure of the network, investigating the relationship between drainage density and the extent of surface runoff. Nariman Valiza-deh [10] quantifies the resilience risk of stormwater pipe network structures from the perspectives of network connectivity, system adaptability, and network redundancy, utilizing graph theory. Secondly, attention is directed towards the drainage capacity displayed by the network during rainfall events, which serves as an indicator of the operational risks of stormwater pipe networks. Typically, hydraulic indicators computed using hydraulic models, such as water depth, duration of inundation, and inundated area, are used for characterization [11]. Xu Huan [12] employed MIKE Urban to analyze the risk of urban flooding in the study area based on the degree of filling of the pipeline. Meanwhile, Wang Peng [13] computed risk indices and inundation losses through measures like inundated area, duration, and recovery time, reflecting the severity of the risks. Pan Xiaowen [14] addressed the challenge of subjective judgment and the multitude of influencing parameters in flood risk analysis by considering seven evaluation indicators including maximum flow rate, maximum flow velocity in pipes, and the number of hours with restricted conduit capacity, employing a variable fuzzy clustering model.
As a gravity flow pipe network, the risks of sewage drainage network operation also include full load, overload and overflow. Due to the particularity of its water quality, too-low flow velocity may cause deposition at the bottom of the pipe, so an additional risk of sedimentation is identified by the minimum flow velocity. These occurrences stem from either structural damages within the pipe [15] or alterations in the flow section [16]. Structural damage within the pipes is typically assessed through Closed-Circuit Television (CCTV) monitoring systems, which provide internal images of the pipes for direct evaluation of their operational conditions. Li Duanshun [17] evaluated pipe conditions by manually inspecting internal videos captured by CCTV. Mingzhu Wang [18] and L. Minh Dang [19] employed deep learning methods, such as Faster R-CNN and text recognition, to process CCTV videos for identifying pipe defects. However, due to equipment limitations, CCTV primarily identifies leakage [20] and sedimentation [21] in pipes, making it challenging to address issues like overload and overflow. Some scholars use hydraulic models to simulate changes in pipe cross sections, thereby identifying risks such as surcharging, overloading, and overflow. Cao Mingyu [22] and Yu Chenhui [23] evaluated full-load and overload risks in existing sewer networks based on the fullness and overloading status of pipe segments using the InfoWorks ICM model. Song Ruining [16] identified sewage overflow risk points based on the predicted overflow volume by the model and, in conjunction with the fullness and minimum flow velocity in pipes, assessed sedimentation risk.
Hydraulic models offer an effective means to simulate drainage processes in stormwater and sewage systems, enabling precise identification of operational risks within pipe networks [24]. However, prevailing studies often construct separate hydraulic models for stormwater and sewage, overlooking the compounding effects of mixed flow between stormwater and sewage on their respective risks [25]. Moreover, combined sewer systems are typically examined in isolation, neglecting their interaction with stormwater and sewage systems [26]. Nonetheless, urban drainage networks are complex, characterized by phenomena such as stormwater and sewage mixing and misconnections, leading to reciprocal flow between stormwater and sewage systems, which increases the flow of the network and the drainage load, making the phenomena of surcharging, overloading, and overflow more prominent, and eventually aggravating the original risk. Thus, it is imperative to establish unified models for both stormwater and sewage systems when employing hydraulic models to identify operational risks, facilitating comprehensive risk simulation, and acknowledge the compounding effects of mixed flow, a dimension disregarded in previous studies.
To identify heightened risks arising from the interaction between stormwater and sewage systems, this paper investigates the influence of sewage inflow on stormwater pipe network risks and the impact of stormwater inflow on sewage pipe network risks during dry and rainy weather conditions. Utilizing the EPA SWMM, simulations were conducted for five rainfall events. By comparing the differences in full-load status, overflow volumes, and minimum sewage velocities, the paper quantifies and analyzes the effects of sewage inputs on stormwater pipe network operational risks, and the disparities in sewage pipe network operation risks during dry and rainy weather scenarios, which can finally provide support for the water affairs bureaus to assess and control the operational risk of the drainage network.
2. Materials and Methods
2.1. Study Area
The study area was located in the Lijiao drainage system of Haizhu district, Guangzhou City, Guangdong Province, China, with a total area of approximately 90.4 km2 and a population of 1.739 million. The region experiences a subtropical monsoon climate characterized by concurrent high temperatures and humidity, with abundant rainfall throughout the year [27,28]. The drainage system comprises a combined sewer network for stormwater and sewage. It consists of separate networks for stormwater pipes, sewage pipes, and combined sewers. The stormwater pipeline spans 237.7 km, the wastewater pipeline 47.6 km, and the combined sewer pipeline 31.9 km. A total of 5 zones have combined sewage pipes, labeled as I to V. Additionally, the area includes 7 pump stations (6 intermediate lift stations and 1 terminal lift station), 5 intercepting wells, and 1 wastewater treatment plant (WWTP), as illustrated in Figure 1. During dry weather, the combined sewer network and sewage pipe network collect residential and industrial wastewater, discharging it downstream to the WWTP. During rainfall, both the combined sewer network and stormwater pipe network collect surface runoff. However, the combined sewer network not only carries wastewater but also collects additional stormwater runoff. The mixture of stormwater and sewage flows downstream through the combined sewer network. After passing through intercepting wells, a portion of the water is discharged into water bodies via outlets, while the remainder is directed into the sewage pipeline. During rainfall events, the mixing of stormwater and sewage exacerbates the operational risks of the sewer network.
2.2. Urban Drainage Pipe Network Hydraulic Modeling
The Storm Water Management Model (SWMM) is a stormwater flood management model developed by the United States Environmental Protection Agency (EPA). It simulates the pipe network system in one dimension by solving the Saint-Venant equations [29,30]. The SWMM has been widely applied in various fields such as current situation assessment of urban drainage systems, design verification, flood risk assessment, and water pollution simulation. SWMM can simulate either sewage pipe networks or stormwater pipe networks independently, as well as combined sewer networks. It can also simulate various structures within drainage pipe network, such as pumps, weirs, wells, and reservoirs. Therefore, in this study, the SWMM is utilized to model both stormwater and sewage pipe networks.
2.2.1. Stormwater Drainage System Modeling
The stormwater drainage model is employed to simulate the movement of rainfall from the surface into stormwater pipes and combined sewers, and its subsequent discharge downstream within the pipe network. This model encompasses surface runoff generation models and one-dimensional hydraulic models of the pipe network. Sub-catchment areas are delineated based on stormwater pipe and combined sewer nodes for the construction of the surface runoff generation model. Surface runoff parameters are determined using land use data [31,32], while sub-catchment slopes are extracted from digital elevation model (DEM) data. Figure 2 and Figure 3 display the land use and DEM data. The one-dimensional hydraulic model of the pipe network is constructed using the stormwater pipe and combined sewer pipe data from Figure 1 [33,34]. The generalized model comprises 10,191 stormwater pipes, 10,014 stormwater nodes, and 415 outlets, along with 117 combined sewer pipes and 117 combined sewer nodes. The majority of collected stormwater is discharged into rivers, with a small fraction flowing into green lands within the area.
The stormwater pipe network system is operated through simulations of various return period rainfall events to assess operational risks. This study utilizes simulations based on five return period rainfall events lasting three hours each, following the guidelines outlined in the “Compilation and design of rainstorm intensity formula in Guangzhou: a brief technical report on rainstorm pattern research” published by the Guangdong Climate Center [35]. The design rainstorm types for the study area are depicted in Figure 4. The calculation formula is as Equation (1),
where q is rainfall density, L/(s·hm2); P is the return period of rainstorms (equals 2, 3, 5, 10 or 20), yr; t is the rainfall duration (equals 180), min.
2.2.2. Sewage Drainage System Modeling
The sewage drainage model is expanded upon the basis of the stormwater model in Section 2.2.1. Sewage pipes depicted in Figure 1 are added to the existing stormwater pipe network to form the sewage drainage model alongside combined sewers. This model serves to simulate the flow of residential sewage and industrial wastewater within sewage pipes and combined sewers, utilizing a one-dimensional hydraulic network model. Sewage is introduced directly into sewage nodes and combined sewer nodes. The input sewage flow consists of two primary categories: residential sewage from residential areas and industrial wastewater from commercial and industrial sectors. Estimation of residential sewage involves key parameters such as population density, population drainage equivalents, and temporal variations. Population data for the study area are sourced from vector population density data, as illustrated in Figure 5. As per the “Detailed Control Plan of Drainage System in Guangzhou Central Urban Area (2015–2030)—Haizhu District” [36], the per capita comprehensive drainage equivalent is set at 380 L/(cap·d), with the potential to increase to 600 L/(cap·d) in areas with a higher proportion of commercial lands. The nodal flow diurnal pattern is derived from flow monitoring data at service area nodes, depicted in Figure 6. Industrial wastewater volume in the study area is estimated to be 3.75 × 10⁴ m3/d [36], allocated to nearby nodes based on the proportion of industrial land area, as indicated in Figure 4. The study area is situated in a subtropical region with a humid climate and high soil moisture content, and groundwater influence is considered. According to [36], the groundwater infiltration rate is determined to be 5.91 × 10⁴ m3/d.
With the exception of zone III, where combined sewer networks directly join the sewage trunk pipes, all other combined sewer networks converge into the sewage trunk pipes via intercepting wells, totaling five locations. The overflow orifice of the intercepting wells matches the downstream stormwater pipe diameter, diverting sewage and initial stormwater to the downstream sewage trunk pipes, while excess water spills over into the stormwater pipes.
2.2.3. Coupled Simulation for Stormwater and Sewage Pipe Networks
In Section 2.2.1 and Section 2.2.2, models for the stormwater and sewage pipe networks were formulated, incorporating designed rainfall patterns and urban sewage flow rates as input parameters. The coupling simulation of the combined sewer system was executed by merging the rainfall hydrograph with the nodal flow diurnal pattern of sewage flow.
2.2.4. Model Calibration
After establishing the model, it is necessary to calibrate the model using measured data to ensure that the constructed model accurately reflects reality. During the calibration of the stormwater pipe network model, adjustments were made to imperviousness, slope, roughness, etc., for various land use types. The model parameters were calibrated by the water level changes of two nodes 70,310,026 and 70,310,008 under the rainfall event on 26 March 2023 with rainfall duration of 30 min. It is worth noting that the two nodes belong to different rainfall stations. The total rainfall of node 70,310,026 on 26 March 2023 was 13.12 mm, while that of node 70,310,008 was 22.07 mm. The rainfall event on 1 June 2023, with rainfall duration of 60 min, was used for validation. The total rainfall of node 70,310,026 on 1 June 2023 was 37.68 mm, while that of node 70,310,008 was 37.45 mm. The process of measured and simulated water levels is illustrated in Figure 7. The Nash–Sutcliffe Efficiency (NSE) of 70,310,026 and 70,310,008 in the calibration period was 0.83 and 0.93, respectively. For verification, it was 0.94 and 0.82, respectively.
For the sewage pipe network model, adjustments were made to initial population density, Manning’s coefficient, etc. During model calibration, the average daily pumping volume of each pump station was used as the standard, with a deviation of total flow data within ±10% considered to indicate a good match between the model results and monitoring data. A comparison of daily accumulated measured flow rates and simulated flow rates for each pump station is shown in Figure 8.
The stormwater network model and sewage network model, after calibration, can accurately simulate real-world scenarios and can be used for risk assessment and analysis of the current operation status of the drainage system.
2.3. Drainage Pipe Network Risk Assessment
Stormwater drainage networks function as gravity-flow pipelines with specific fullness during design and operation. When evaluating operational risks, it is essential to identify full-load pipes, overload pipes, and node overflow risks. Pipes under full-load status lack excess space, hindering their ability to regulate water volume and adapt to fluctuations in water levels. A pipe enters an overload status, or becomes a bottleneck, when the water level continues to rise upstream and downstream until the hydraulic gradient surpasses the slope of the pipe section [37]. The overload status indicates inadequate flow capacity, elevating the risk compared to full-load conditions. As an overload pipe deteriorates further, the upstream water level rises continuously, resulting in node overflow when the water level in the upstream node exceeds ground elevation. Similar to stormwater drainage network, sewage drainage networks, also gravity-flow pipelines, require identification of full-load pipes, overload pipes, and node overflow risks. However, sewage contains more impurity particles compared to stormwater, making larger particles in sewage prone to sedimentation when pipes remain in a low-flow state for prolonged periods, thereby compromising the drainage capacity. According to the “Standard for Design of Outdoor Wastewater Engineering” (GB50014-2021) [38], the minimum flow velocity for pipelines is set at 0.6 m/s to prevent sedimentation. Thus, comparing the minimum flow velocity in pipes in sewage drainage networks with the specified non-sedimentation velocity facilitates the assessment of sedimentation risks. Operational risk indicators for drainage networks are summarized in Table 1.
As for the stormwater drainage system, the assessment was initiated by quantifying the proportions of full-load pipes, overload pipes, and overflow volumes across five return period rainfalls (rain scenario) to evaluate operational risks comprehensively. Regardless of meteorological conditions, persistent wastewater inflow characterizes the operational dynamics of a combined sewer network. To explore the impact of heightened sewage influx on the operational risks of stormwater drainage networks, an additional scenario (rain–sewage scenario) was introduced, integrating sewage inflow into the combined sewer system. Subsequent simulations were executed across the aforementioned five return period rainfalls to elucidate disparities in the operational risk indicators of stormwater drainage networks. It is noteworthy that when computing the proportions of full-load/overload pipes, the denominator encompasses the cumulative lengths of stormwater pipes and combined sewer pipes, while the numerator represents the length of a specific pipe.
For the sewage drainage system, simulations were conducted following the nodal flow diurnal pattern described in Section 2.2.2. Proportions of full-load pipes, overload pipes, low velocity pipes and overflow volume are summarized to assess operational risks during dry weather scenarios. Additionally, during rainy weather scenarios, stormwater inflow of a combined sewer network should be considered. Five rainfall events were added to the existing input, and simulations were carried out separately for rainy weather scenarios. The differences in operational risks between dry and rainy weather scenarios were characterized by comparing changes in the proportions of full-load pipes, overload pipes, low velocity pipes and overflow nodes. When calculating the proportions of full-load/overload/low velocity pipes, the denominator was the sum of the length of sewage pipes and combined sewer pipes. However, for calculating the proportion of overflow nodes, the denominator was the sum of the number of nodes in sewage pipes and combined sewer pipes, with the numerator representing the number of nodes experiencing overflow.
3. Results
3.1. Risks of Stormwater Drainage System in Rain Scenario
In the rain scenario, the research object was the stormwater drainage system, including combined sewers and stormwater pipes. Under simulated conditions, combined sewers exclusively manage rainfall runoff from the catchment area without any sewage inflow. During the initial stages, characterized by light rainfall intensity, accumulated stormwater within the combined sewers directly enters downstream sewage pipes. However, as rainfall intensity intensifies in later stages, the connectivity between combined sewers and stormwater pipes is established via an intercepting well, leading to consequential effects on the operational risk of the stormwater pipes.
3.1.1. Analysis of Full-Load and Overload Pipes
Figure 9 and Figure 10 illustrate the spatial distribution of full-load pipes and overload pipes. Most of the pipes were in full-load status during the simulation process, while overload pipes were primarily distributed near sewage trunk lines. As the return period increased, the number of overload pipes (depicted by red lines in Figure 10) also gradually increased. Figure 11 presents the percentage of full-load pipes and overload pipes relative to the total length. Specifically, the proportions of full-load pipes at return periods of 2 yr, 3 yr, 5 yr, 10 yr, and 20 yr were 69.03%, 71.24%, 72.39%, 73.97%, and 74.88%, respectively. Correspondingly, the proportions of overload pipes were 27.61%, 29.64%, 30.99%, 32.31%, and 33.18%, respectively. As the return period of rainfall increased, the proportions of overload pipes and full-load pipes both increased. A higher return period implies greater rainfall intensity, leading to an increase in both full-load pipes and overload pipes, as some pipes with good flow capacity during low return periods fail to cope with high return period rainfall, resulting in more instances of full-load pipes and overload pipes.
3.1.2. Analysis of Node Overflow
Based on the overflow volume of nodes, the severity of overflow is divided into four levels. Figure 12 shows the distribution of total overflow volume of nodes under different return periods of rainfall. Overflow nodes are evenly distributed throughout the entire network. With the increase of return period, there is no significant change in the spatial distribution of node overflow volume, but the severity of overflow at existing overflow nodes increases. For the five return periods considered, the number of nodes with overflow volume greater than 20 × 104 m3 are 10, 12, 15, 22, and 29, respectively. Correspondingly, the number of red nodes in Figure 12 gradually increases. Table 2 summarizes the number of overflow points at different levels under each return period. Under the return periods of 2 yr, 3 yr, 5 yr, 10 yr, and 20 yr, the total number of overflow nodes is 2998, 3143, 3313, 3525, and 3712, respectively. As the return period increases, the total number of nodes experiencing overflow in the area increases, and the number of nodes at each level also increases. The fastest increase is observed in the category of 1 × 10⁴ m3–10 × 104 m3. Among the five return periods of rainfall, the number of low overflow nodes, <1 × 10⁴ m3, is the highest, and as the level increases, the number of overflow nodes within the corresponding levels decreases.
3.2. Risks of Stormwater Drainage System in Rain-Sewage Scenario
Employing the stormwater drainage model described above, sewage integration into the model is conducted in accordance with the nodal flow diurnal pattern delineated in Section 2.2.2. The sewage peak aligns with the peak period of rainfall. In this scenario, combined sewer systems accommodate both stormwater and sewage from nearby communities during rainy periods, with water flow persisting even after rainfall. This comparative assessment aims to elucidate the impact of sewage input from combined sewer systems on the operational risks of the stormwater drainage network.
3.2.1. Analysis of Full-Load and Overload Pipes
Figure 13a illustrates the shifts in the proportion of full-load pipes before and after sewage input. Across all five rainfall scenarios, sewage input consistently augmented the prevalence of pipe operating at full-load status, resulting in an average increase in full-load pipe length of 3.8 km and an average rise in full-load pipe proportion of 2%. These effects exhibited variations across different return periods, with increases of 3.6%, 1.9%, 2.2%, 1.4%, and 1.0%, respectively. Significantly, this impact is more pronounced during rainfall events with lower return periods. Figure 13b presents the alterations in the proportion of overload pipes considering sewage input. Across the five considered rainfall scenarios, sewage input affected the proportion of overload pipes, leading to an average length increase of 1.1 km and a relative increase of 1.3% compared to the rain scenario. The relative increases varied across different return periods, being 3.9%, 0.09%, 0.87%, 1.19%, and 0.86%, respectively. Similar to the impact on full-load pipes, the most noticeable effect was observed during the 2 yr return period rainfall. As the return period increases, this effect tends to attenuate, demonstrating an overall decreasing tendency.
3.2.2. Analysis of Node Overflow
Figure 14 illustrates the alterations in node overflow volumes within the stormwater drainage system before and after sewage inputs in the combined sewer network. Regardless of sewage inputs, an escalation in return period consistently leads to higher node overflow volumes. Across all return periods, the total node overflow volumes considering sewage inputs always surpass those without consideration. Sewage inputs contribute to an average increase of 2.26 × 10⁴ m3 in overflow volume. The impact of sewage inputs on overflow volumes diminishes monotonically with increasing return periods. Under a 2 yr return period, sewage inputs lead to a 0.9% increase in overflow volume, whereas under a 20 yr return period, the overflow volume increases by only 0.5%.
3.3. Risks of Sewage Drainage System in Dry Weather Scenario
In the dry weather scenario, the combined sewer network operates solely to manage sewage, without the presence of stormwater runoff inflow.
3.3.1. Analysis of Full-Load and Overload Pipes
A total of 12 pipes were observed to be operating at full-load status, covering a length of 9.2 km, which represents 11.6% of the total length. Additionally, overload status was identified in 1.86 km of pipes, accounting for 2.34% of the total length. The spatial distribution of full-load and overload pipes is illustrated in Figure 15. Combined sewer pipes in zone II demonstrated a propensity for overload occurrences, while sewage pipes in zones II and III posed higher risks of reaching full load.
3.3.2. Analysis of Node Overflow
Results of the simulations demonstrate that sewage nodes within the study area exhibit overflow, with approximately 12.7% of nodes being affected, resulting in a total overflow volume of 14,048 m3. Figure 16 represents the spatial distribution of sewage overflow in the dry weather scenario, highlighting pronounced overflow in the combined sewer pipes located in zone II.
3.3.3. Analysis of Low Velocity
A total of 58.5% of sewage conduits exhibit a minimum flow velocity below the non-sedimentation velocity 0.6 m/s. Classified by flow velocity, pipes are segmented into low-risk (0.10–0.60 m/s), moderate risk (0.01–0.10 m/s), and high risk (<0.01 m/s). Within the study area, 46.5% of the pipes pose low risk, 3.46% moderate risk, and 7.08% high risk in terms of flow velocity. Spatial distribution of minimum flow velocities, as depicted in Figure 17, reveals a concentration of high-risk pipelines notably in zone II, particularly of combined sewers and their associated downstream sewage trunk pipes. Vigilant monitoring and regular desilting operations are warranted for zones identified as moderate-to-high risk for sedimentation.
3.4. Risks of Sewage Drainage System in Rainy Weather Scenario
Section 3.2 assesses how sewage affects stormwater pipe network during rain occurrences. In rainy weather scenarios, additional inflow of stormwater will also impact the operation of the sewage pipe network. Design rainfall in risk assessment of sewage drainage network is the same as in a stormwater drainage network. During such conditions, combined sewer pipe networks are tasked with both sewage conveyance and the management of stormwater surface runoff. As these combined sewer pipes are situated upstream of sewage trunk pipes, the increased volume of sewage conveyed during rainy weather escalates the load on sewage trunk lines, thereby altering the operational risk of sewage pipe networks.
3.4.1. Analysis of Full-Load and Overload Pipes
As depicted in Figure 18, the proportions of full-load pipes and overload pipes increase in the rainy weather scenario compared to the dry weather scenario. The full-load pipe proportions for return periods of 2 yr, 3 yr, 5 yr, 10 yr, and 20 yr are 37.6%, 37.8%, 38.7%, 39.5%, and 42.1%, respectively, representing a notable average increase of 27.4% relative to the dry weather scenario. Correspondingly, the proportions of overload pipes in these five rainfalls are 17.6%, 17.6%, 18.8%, 19.4%, and 20%, respectively, indicating an average increase of 16.3% compared to the dry weather scenario.
Both the full-load pipe proportion and overload pipe proportion exhibit a positive correlation with the return period. Notably, the change in overload pipe proportion shows a slower response to the variation in return period, with rainfall events resulting in a modest 3% increase from 2 yr to 20 yr.
3.4.2. Analysis of Node Overflow
In comparison to dry weather scenarios, the overflow volume and the proportion of overflow nodes in the sewage pipe network notably escalated during rainy weather scenarios (Figure 19). The average overflow volume increased by 1 × 10⁵ m3, while the percentage of overflow nodes increased by an average of 22.06%. As the return period extended, both the proportion of overflow nodes and the total overflow volume exhibited a gradual ascent, escalating from 6.95 × 10⁴ m3 and 32.14% to 17.43 × 10⁴ m3 and 36.9%, respectively.
3.4.3. Analysis of Low Velocity
Figure 20 depicts the distribution of flow velocities across different scenarios. The category of low velocity encompasses speeds below 0.6 m/s, spanning < 0.01 m/s, 0.01–0.1 m/s, and 0.1–0.6 m/s. In comparison to dry weather scenarios, during rainy scenarios, there was a notable increase in the proportion of pipe within the sewage drainage network exhibiting susceptibility to sedimentation, with an average augmentation of 2.6 km. Notably, the predominant increase occurred within pipes featuring moderate-risk velocities ranging from 0.01 m/s to 0.10 m/s.
4. Discussion
4.1. Risk of Drainage Network
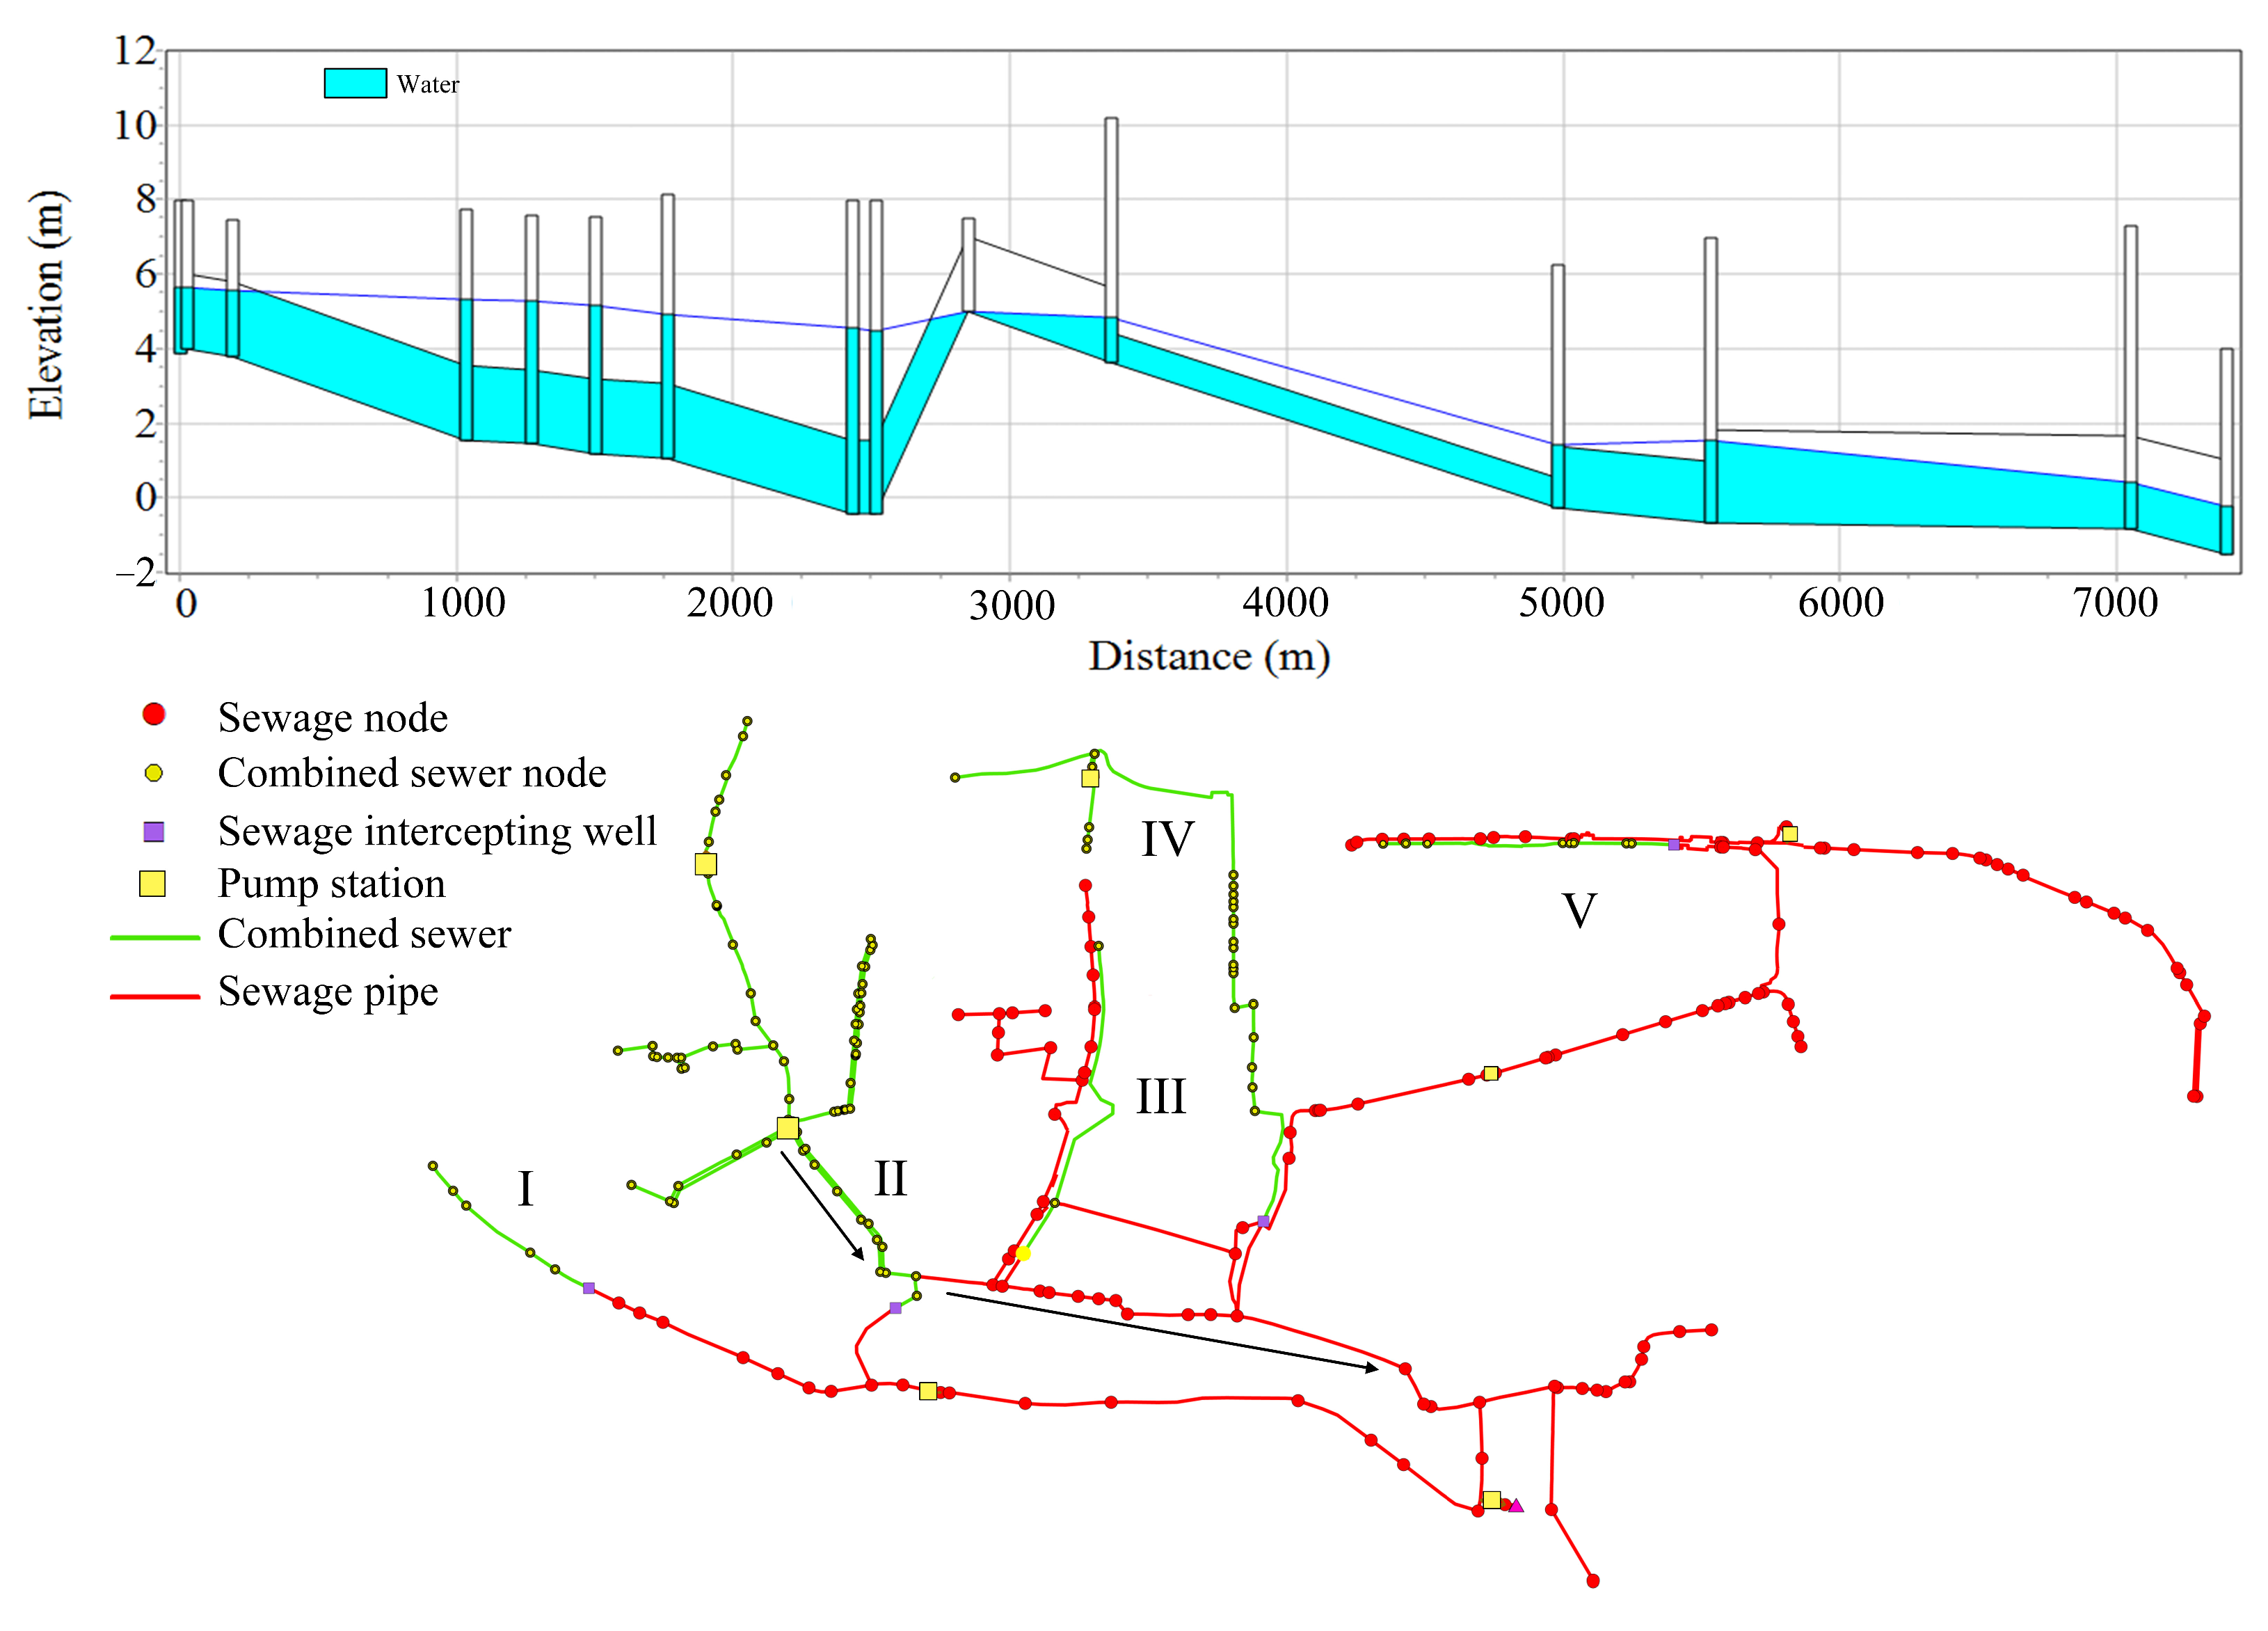
The stormwater pipe network across the study area exhibits a scattered distribution with a multitude of outlets but lacks integration into a unified system covering the entire region. Most stormwater is directed to permeable green lands or a water body nearby. Nodes experiencing overflow are primarily situated upstream in small-scale stormwater pipe networks. Figure 21 depicts a longitudinal profile of one such overflow node, with other similar nodes experiencing considerable overflow. Within this small-scale network, a phenomenon of reverse slope is evident, preventing water from reaching outlet nodes and causing upstream nodes to overflow due to surcharge. Figure 22 displays a longitudinal profile of the combined sewer network in zone II and its downstream sewage trunk pipes, where a similar reverse slope condition exists. This leads to numerous pipe segments operating at full-load status, resulting in decreased flow velocity and sedimentation risks. Consequently, future rehabilitation efforts should focus on correcting the reverse slope sections within the pipe network. Furthermore, enlarging the pipe diameter is advisable for zones II and III.
4.2. Impact of Stormwater Inflow on the Operational Risks of Sewage Drainage System
The comparative analysis conducted in Section 3.2 revealed that sewage input does not alter the overall spatial distribution of overflow nodes. However, substantial improvements were noted in overflow volume, the proportions of full-load and overload pipes. Regarding overflow volume, sewage input resulted in an average increase of 2.26 × 10⁴ m3 in overflow volume, representing a relative increase of 6.9%. Although the relative increases in full-load pipes and overload pipes were only 2% and 1.3%, respectively, the lengths of full-load pipes and overload pipes increased by 1.1 km and 3.8 km, respectively. This phenomenon can be attributed to the increased volume of water flowing into the pipes due to sewage inputs, thereby filling the space in previously non-full normal pipes and raising the proportion of full-load pipes. Meanwhile, the existing full-load pipes accumulated more water at upstream nodes, deteriorating into bottleneck pipes, ultimately leading to node overflow. With an increase in return periods, overflow volume, the proportion of full-load pipes, and the proportion of overload pipes all experienced growth. The consideration of sewage inputs weakened the impact of return period variations on the stormwater drainage network. Particularly at lower return periods, the influence of sewage inputs on overflow volume, the proportion of full-load pipes, and the proportion of overload pipes was more prominent. As return periods increase, the disparity between rainfall and sewage volume widens, with rainfall playing a more dominant role. Therefore, when modeling stormwater networks and conducting risk assessments, combined sewer network should also incorporate sewage inflow, especially in scenarios with lower return period rainfalls.
4.3. Impact of Sewage Inflow on the Operational Risks of Stormwater Drainage System
During precipitation, combined sewer pipes receive both sewage and stormwater, leading to a sudden surge in inflow water volume. Pipes that are already operating at full-load and overload status during dry weather lack the flexibility to accommodate changes in water volume, thereby becoming critical impediments to drainage during rainy conditions. Consequently, sewage networks exhibit more pronounced overload and overflow phenomena in rainy weather scenarios. In rainy weather scenarios, previously vulnerable sections of the combined sewer networks in zones II and III experience a notable increase in the risk level of sedimentation. This escalation is due to the significant influx of stormwater during rainfall, resulting in certain nodes temporarily reaching overload status, which hinders the rapid discharge of water due to buoyancy effects and consequently slows down flow velocities.
Overflow volume exhibits heightened sensitivity to changes in return periods. Minimal deviations are observed in proportions of full-load and overload pipes across diverse return periods. This phenomenon is likely attributed to the obstructive impact of overload pipes, whereby high return period rainfall events fail to engender a surge in blocked overload pipes. Consequently, a substantial quantity of stormwater does not accumulate in overloaded conditions at the nodes, ultimately being discharged via node overflow.
Overall, the operational risk of drainage pipe networks becomes serious with the increase of return period, which is similar to the research of He Lei [39] and Liu Yang [40]. Additionally, not only is the operational risk identified, but the influence of mixed inflow of rain and sewage on the risk is also analyzed and quantified.
5. Conclusions
In this study, the operational risks of both stormwater and sewage networks under different scenarios were analyzed, focusing on full-load pipes, overload pipes, node overflows, and minimum flow velocities, using the EPA SWMM model with a 3-h duration rainfall of five return periods. Comparative analysis highlighted the exacerbating effects of stormwater and sewage on each other’s risks. The following conclusions were drawn.
Hydraulic models serve as effective tools for identifying operational risks in stormwater and sewage networks. Notably, the sewage pipe network system exhibits a full-load pipe length and overload pipe length of 9.2 km and 1.86 km, respectively, constituting 11.6% and 2.34% of the total network length. A total of 12.7% of nodes experience overflow, contributing to a total overflow volume of 14,048 m3. Moreover, 58.5% of sewage pipes demonstrate minimum flow velocities below the critical sedimentation velocity. Combined sewer networks in zones II and III exhibit heightened risks of overflow and sedimentation, underscoring the imperative for targeted upgrades. Additionally, stormwater pipe network risks exhibit slight variations across different rainfalls. The proportions of full-load and overload pipes during rainfall events with return periods of 2 yr, 3 yr, 5 yr, 10 yr, and 20 yr are 69.03%, 71.24%, 72.39%, 73.97%, and 74.88%, and 27.61%, 29.64%, 30.99%, 32.31%, and 33.18%, respectively. The total number of overflow nodes in stormwater pipe network are 2998, 3143, 3313, 3525, and 3712 for return periods of 2 yr, 3 yr, 5 yr, 10 yr, and 20 yr, respectively. Overflow nodes predominantly concentrated in upstream areas, highlighting the necessity of investigating reverse slope phenomena in stormwater pipe networks.
In the assessment of stormwater pipe network risks, the inclusion of sewage from combined sewer network leads to an average increase of 3.8 km in full-load pipe length, 1.1 km in overload pipe length, and 2.26 × 10⁴ m3 in overflow volume. This sewage input significantly impacts the overall operational risk of the pipe network, with more pronounced effects observed during low return period rainfall events. For example, under a 2 yr return period, full-load pipe lengths increase by 3.9%, overload pipe lengths by 3.6%, and overflow volume by 0.9%. Similarly, under a 20 yr return period, these indicators increase by 1.0%, 0.86%, and 0.5%, respectively. Therefore, accounting for sewage from combined sewer network in stormwater drainage network assessment is crucial, particularly during low return period rainfall.
In combined sewer networks, the lengths of pipes experiencing full-load and overload status in rainy weather scenarios increased by an average of 27.4% and 16.3%, respectively, compared to dry weather scenarios. Moreover, rainy weather scenarios exacerbate the blocking effect of overload pipes, resulting in an average increase of 1 × 10⁵ m3 in overflow volume at nodes, with the proportion of overflow nodes accounting for an average increase of 22.06%, thus heightening the overall severity of overflow. In the assessment of sewage drainage network risks, particularly during rainfall scenarios, the significance of combined sewer networks in handling stormwater should not be underestimated.
Author Contributions
Conceptualization, W.L. and H.W.; methodology, W.L. and Z.W.; software, J.Z. and Z.W.; validation, J.Z.; formal analysis, W.L. and H.W.; data curation, W.L. and Y.P.; writing—original draft preparation, W.L.; writing—review and editing, H.W. and W.L.; visualization, Z.W. and Y.P.; supervision, J.Z. All authors have read and agreed to the published version of the manuscript.
Funding
This research was funded by R&D Program of Beijing Municipal Education Commission (grant number: KM202210005017& KM202310005023), Major Science and Technology Innovation Pilot Project for Water Resources Protection and Integrated-Saving Utilization in the Yellow River Basin of Inner Mongolia Autonomous Region (grant number: 2023JBGS0007), National Natural Science Foundation of China General Project (grant number:72373011) and Beijing Natural Science Foundation (grant number: 8242003).
Data Availability Statement
The data presented in this study are available on request from the corresponding author.
Conflicts of Interest
Author Wentao Li was employed by the company Guangzhou Municipal Engineering Design & Research Institute Co., Ltd. The remaining authors declare that the research was conducted in the absence of any commercial or financial relationships that could be construed as a potential conflict of interest.
References
- Zhang, Y. Study on Risk Assessment in Operation of Urban Drainage Network. Urban Roads Bridges Flood Control. 2022, 6, 104–109. [Google Scholar] [CrossRef]
- Waters, D.; Watt, W.E.; Marsalek, J.; Anderson, B.C. Adaptation of a Storm Drainage System to Accommodate Increased Rainfall Resulting from Climate Change. J. Environ. Plan. Manag. 2003, 46, 755–770. [Google Scholar] [CrossRef]
- Lin, J.; He, P.; Yang, L.; He, X.; Lu, S.; Liu, D. Predicting Future Urban Waterlogging-Prone Areas by Coupling the Maximum Entropy and FLUS Model. Sustain. Cities Soc. 2022, 80, 103812. [Google Scholar] [CrossRef]
- Alfonso, L.; Mukolwe, M.M.; Di Baldassarre, G. Probabilistic Flood Maps to Support Decision-Making: Mapping the Value of Information. Water Resour. Res. 2016, 52, 1026–1043. [Google Scholar] [CrossRef]
- Jato-Espino, D.; Lobo, A.; Ascorbe-Salcedo, A. Urban Flood Risk Mapping Using an Optimised Additive Weighting Methodology Based on Open Data. J Flood Risk Manag. 2019, 12, e12533. [Google Scholar] [CrossRef]
- Joseph-Duran, B.; Jung, M.N.; Ocampo-Martinez, C.; Sager, S.; Cembrano, G. Minimization of Sewage Network Overflow. Water Resour Manag. 2014, 28, 41–63. [Google Scholar] [CrossRef]
- Yin, H.; Lu, Y.; Xu, Z.; Li, H.; Schwegler, B.R. Characteristics of the Overflow Pollution of Storm Drains with Inappropriate Sewage Entry. Env. Sci. Pollut. Res. 2017, 24, 4902–4915. [Google Scholar] [CrossRef]
- Wang, H.; Lei, X.; Khu, S.-T.; Song, L. Optimization of Pump Start-Up Depth in Drainage Pumping Station Based on SWMM and PSO. Water 2019, 11, 1002. [Google Scholar] [CrossRef]
- Lee, J.; Chung, G.; Park, H.; Park, I. Evaluation of the Structure of Urban Stormwater Pipe Network Using Drainage Density. Water 2018, 10, 1444. [Google Scholar] [CrossRef]
- Shamseldin, A.Y.; Wotherspoon, L.; Raith, A. Indicator-Based Resilience Assessment of Stormwater Infrastructure Network Structure. Urban Water J. 2023, 1–12. [Google Scholar] [CrossRef]
- Du, W.; Gong, Y.; Chen, N. PSO-WELLSVM: An Integrated Method and Its Application in Urban Waterlogging Susceptibility Assessment in the Central Wuhan, China. Comput. Geosci. 2022, 161, 105079. [Google Scholar] [CrossRef]
- Xu, H.; Wang, Y.; Fu, X.; Wang, D.; Luan, Q. Urban Flood Modeling and Risk Assessment with Limited Observation Data: The Beijing Future Science City of China. Int. J. Environ. Res. Public Health 2023, 20, 4640. [Google Scholar] [CrossRef] [PubMed]
- Wang, P.; Li, Y.; Yu, P.; Zhang, Y. The Analysis of Urban Flood Risk Propagation Based on the Modified Susceptible Infected Recovered Model. J. Hydrol. 2021, 603, 127121. [Google Scholar] [CrossRef]
- Pan, X.; Yu, H.; Wang, L. Waterlogging risk analysis method based on variable fuzzy clustering model. Water Resour. Plan. Des. 2023, 8, 32–35. [Google Scholar]
- Baah, K.; Dubey, B.; Harvey, R.; McBean, E. A Risk-Based Approach to Sanitary Sewer Pipe Asset Management. Sci. Total Environ. 2015, 505, 1011–1017. [Google Scholar] [CrossRef] [PubMed]
- Song, R.; Guo, Y.; Xu, W.; Wang, X.; Ci, S.; Zheng, Y.; Han, D.; Fan, D. Application on sewage pipe network operation management with InfoWorks ICM. Water Wastewater Eng. 2022, 58, 401–405. [Google Scholar] [CrossRef]
- Li, D.; Cong, A.; Guo, S. Sewer Damage Detection from Imbalanced CCTV Inspection Data Using Deep Convolutional Neural Networks with Hierarchical Classification. Autom. Constr. 2019, 101, 199–208. [Google Scholar] [CrossRef]
- Cheng, J.C.P.; Wang, M. Automated Detection of Sewer Pipe Defects in Closed-Circuit Television Images Using Deep Learning Techniques. Autom. Constr. 2018, 95, 155–171. [Google Scholar] [CrossRef]
- Dang, L.M.; Hassan, S.I.; Im, S.; Mehmood, I.; Moon, H. Utilizing Text Recognition for the Defects Extraction in Sewers CCTV Inspection Videos. Comput. Ind. 2018, 99, 96–109. [Google Scholar] [CrossRef]
- Peche, A.; Graf, T.; Fuchs, L.; Neuweiler, I. Physically Based Modeling of Stormwater Pipe Leakage in an Urban Catchment. J. Hydrol. 2019, 573, 778–793. [Google Scholar] [CrossRef]
- Wirahadikusumah, R.; Abraham, D.M.; Iseley, T.; Prasanth, R.K. Assessment Technologies for Sewer System Rehabilitation. Autom. Constr. 1998, 7, 259–270. [Google Scholar] [CrossRef]
- Cao, M.; Sun, Z.; Zhang, L.; Yan, S.; Fan, H. Research on Optimization of Safe Water Delivery and Water Quality Control of Sewage System Based on Integrated Catchment Management (ICM). Fresenius Environ. Bull. 2022, 30, 12891–12897. [Google Scholar]
- Yu, C.; Li, P.; Zhang, H.; Fan, L.; Li, J. Yiliang He Evaluation of Diversion Capacity of Sewage Pipeline Network and Optimization of Drainage Capacity of Pump Station Based on Infoworks ICM Model. Water Purif. Technol. 2019, 38, 60–67. [Google Scholar] [CrossRef]
- Agonafir, C.; Lakhankar, T.; Khanbilvardi, R.; Krakauer, N.; Radell, D.; Devineni, N. A Review of Recent Advances in Urban Flood Research. Water Secur. 2023, 19, 100141. [Google Scholar] [CrossRef]
- Perry, W.B.; Ahmadian, R.; Munday, M.; Jones, O.; Ormerod, S.J.; Durance, I. Addressing the Challenges of Combined Sewer Overflows. Environ. Pollut. 2024, 343, 123225. [Google Scholar] [CrossRef] [PubMed]
- Wambecq, T.; Kroll, S.; Van Assel, J.; Delgado, R. CSO Generator—A Parsimonious Wastewater Quality Model for Combined Sewer Overflows. Water 2023, 15, 3424. [Google Scholar] [CrossRef]
- Lyu, H.-M.; Wang, G.-F.; Shen, J.; Lu, L.-H.; Wang, G.-Q. Analysis and GIS Mapping of Flooding Hazards on 10 May 2016, Guangzhou, China. Water 2016, 8, 447. [Google Scholar] [CrossRef]
- Ding, Y.; Wang, H.; Liu, Y.; Lei, X. Urban Waterlogging Structure Risk Assessment and Enhancement. J. Environ. Manag. 2024, 352, 120074. [Google Scholar] [CrossRef]
- Tamm, O.; Kokkonen, T.; Warsta, L.; Dubovik, M.; Koivusalo, H. Modelling Urban Stormwater Management Changes Using SWMM and Convection-Permitting Climate Simulations in Cold Areas. J. Hydrol. 2023, 622, 129656. [Google Scholar] [CrossRef]
- US EPA; Rossman, L.A. Storm Water Management Model (SWMM). Available online: https://www.epa.gov/water-research/storm-water-management-model-swmm (accessed on 21 March 2024).
- Mobilia, M.; Longobardi, A.; Amitrano, D.; Ruello, G. Land Use and Damaging Hydrological Events Temporal Changes in the Sarno River Basin: Potential for Green Technologies Mitigation by Remote Sensing Analysis. Hydrol. Res. 2023, 54, 277–302. [Google Scholar] [CrossRef]
- Johannessen, B.G.; Hamouz, V.; Gragne, A.S.; Muthanna, T.M. The Transferability of SWMM Model Parameters between Green Roofs with Similar Build-Up. J. Hydrol. 2019, 569, 816–828. [Google Scholar] [CrossRef]
- Hamouz, V.; Muthanna, T.M. Hydrological Modelling of Green and Grey Roofs in Cold Climate with the SWMM Model. J. Environ. Manag. 2019, 249, 109350. [Google Scholar] [CrossRef] [PubMed]
- Li, W.; Wang, H.; Zhou, J.; Yan, L.; Liu, Z.; Pang, Y.; Zhang, H.; Huang, T. Simulation and Evaluation of Rainwater Runoff Control, Collection, and Utilization for Sponge City Reconstruction in an Urban Residential Community. Sustainability 2022, 14, 12372. [Google Scholar] [CrossRef]
- Climate Center of Guangdong Province. Compilation and Design of Rainstorm Intensity Formula in Guangzhou: A Brief Technical Report on Rainstorm Pattern Research; Water Affairs Bureau of Guangzhou City: Guangzhou, China, 2022. [Google Scholar]
- Guangzhou Municipal Engineering Design&Research Instutute Co., Ltd. Controlled Detailed Planning of Drainage System in Central District of Guangzhou City (2015-2030)--Haizhu District; Water Affairs Bureau of Guangzhou City: Guangzhou, China, 2018. [Google Scholar]
- Zhang, D.; Han, D.; Zhong, Q.; Chen, Q. Classification and Description of the Drainage State of Manholes in Urban Drainage Systems. Water Sci. Technol. 2024, 89, 146–159. [Google Scholar] [CrossRef] [PubMed]
- Shanghai Municipal Engineering Design Institute (Group) Co., Ltd. Standard for Design of Outdoor Wastewater Engineering; China Planning Press: Beijing, China, 2021; p. 286. [Google Scholar]
- He, L.; Li, S.; Cui, C.-H.; Yang, S.-S.; Ding, J.; Wang, G.-Y.; Bai, S.-W.; Zhao, L.; Cao, G.-L.; Ren, N.-Q. Runoff Control Simulation and Comprehensive Benefit Evaluation of Low-Impact Development Strategies in a Typical Cold Climate Area. Environ. Res. 2022, 206, 112630. [Google Scholar] [CrossRef]
- Liu, Y.; Zhao, W.; Wei, Y.; Sebastian, F.S.M.; Wang, M. Urban Waterlogging Control: A Novel Method to Urban Drainage Pipes Reconstruction, Systematic and Automated. J. Clean. Prod. 2023, 418, 137950. [Google Scholar] [CrossRef]
Figure 1.
Schematic of the study area.

Figure 2.
Land use distribution of Lijiiao.
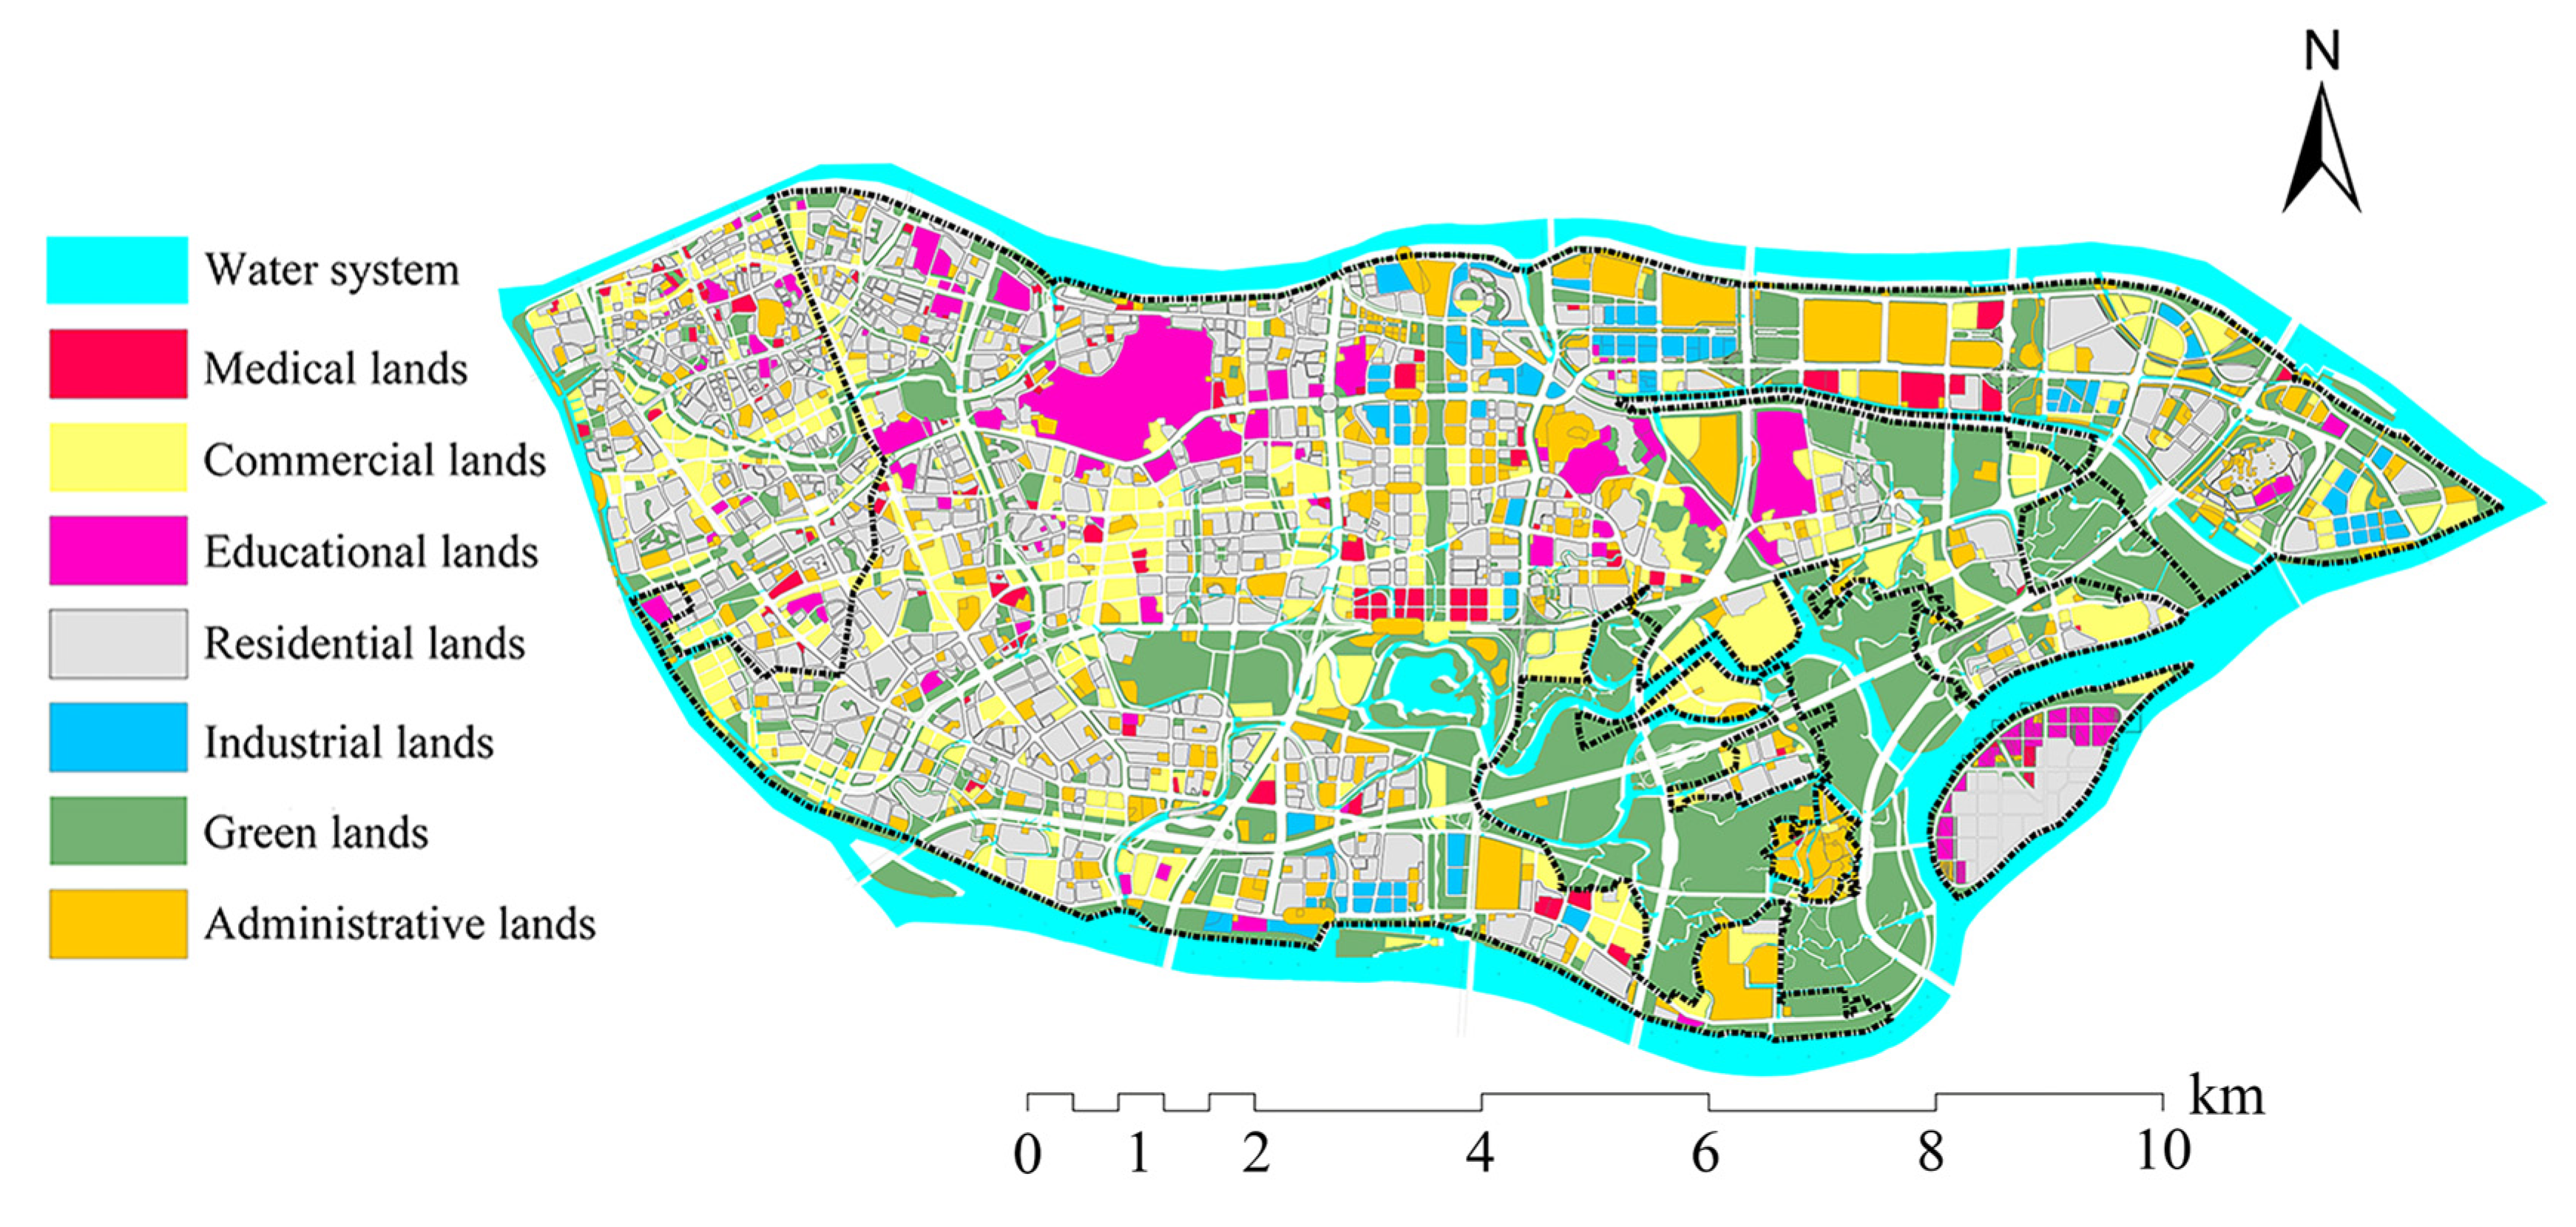
Figure 3.
DEM figure of Lijiao.

Figure 4.
Design rainfall for five different return periods in Guangzhou City.
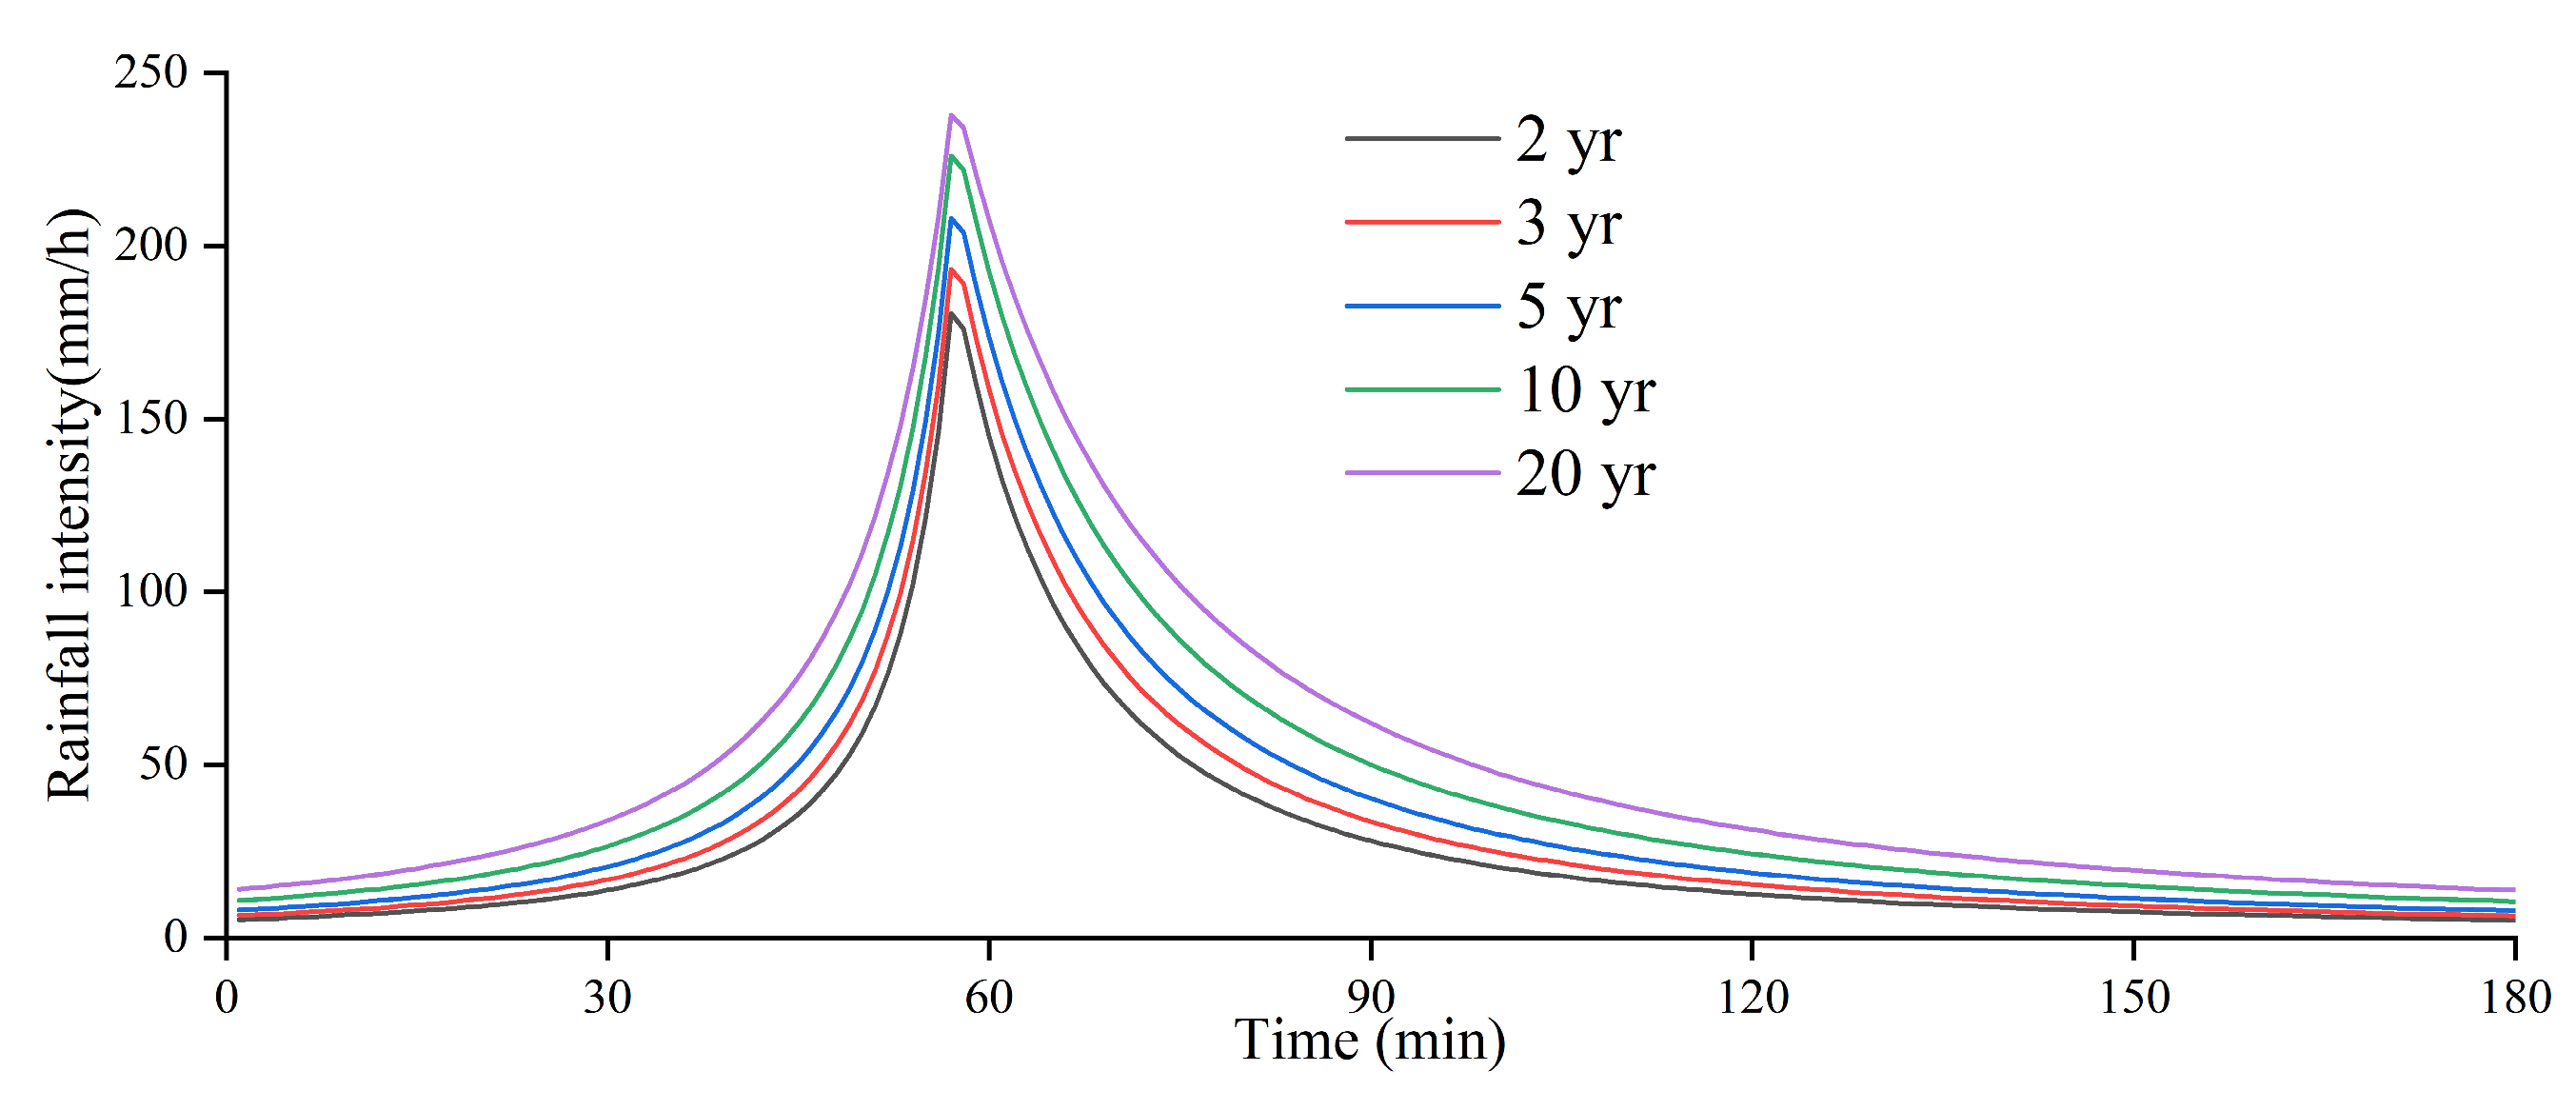
Figure 5.
People distribution of Lijiao.

Figure 6.
Nodal flow diurnal patterns.

Figure 7.
Comparison of measured and simulated water level. (a): 70,310,026 node for 2023-06-01 rainfall; (b): 70,310,008 node for 1 June 2023 rainfall; (c): 70,310,026 node for 26 March 2023; (d): 70,310,008 node for 26 March 2023 rainfall.
Figure 7.
Comparison of measured and simulated water level. (a): 70,310,026 node for 2023-06-01 rainfall; (b): 70,310,008 node for 1 June 2023 rainfall; (c): 70,310,026 node for 26 March 2023; (d): 70,310,008 node for 26 March 2023 rainfall.

Figure 8.
Comparison of simulation and measured daily cumulative flow of each pump station.
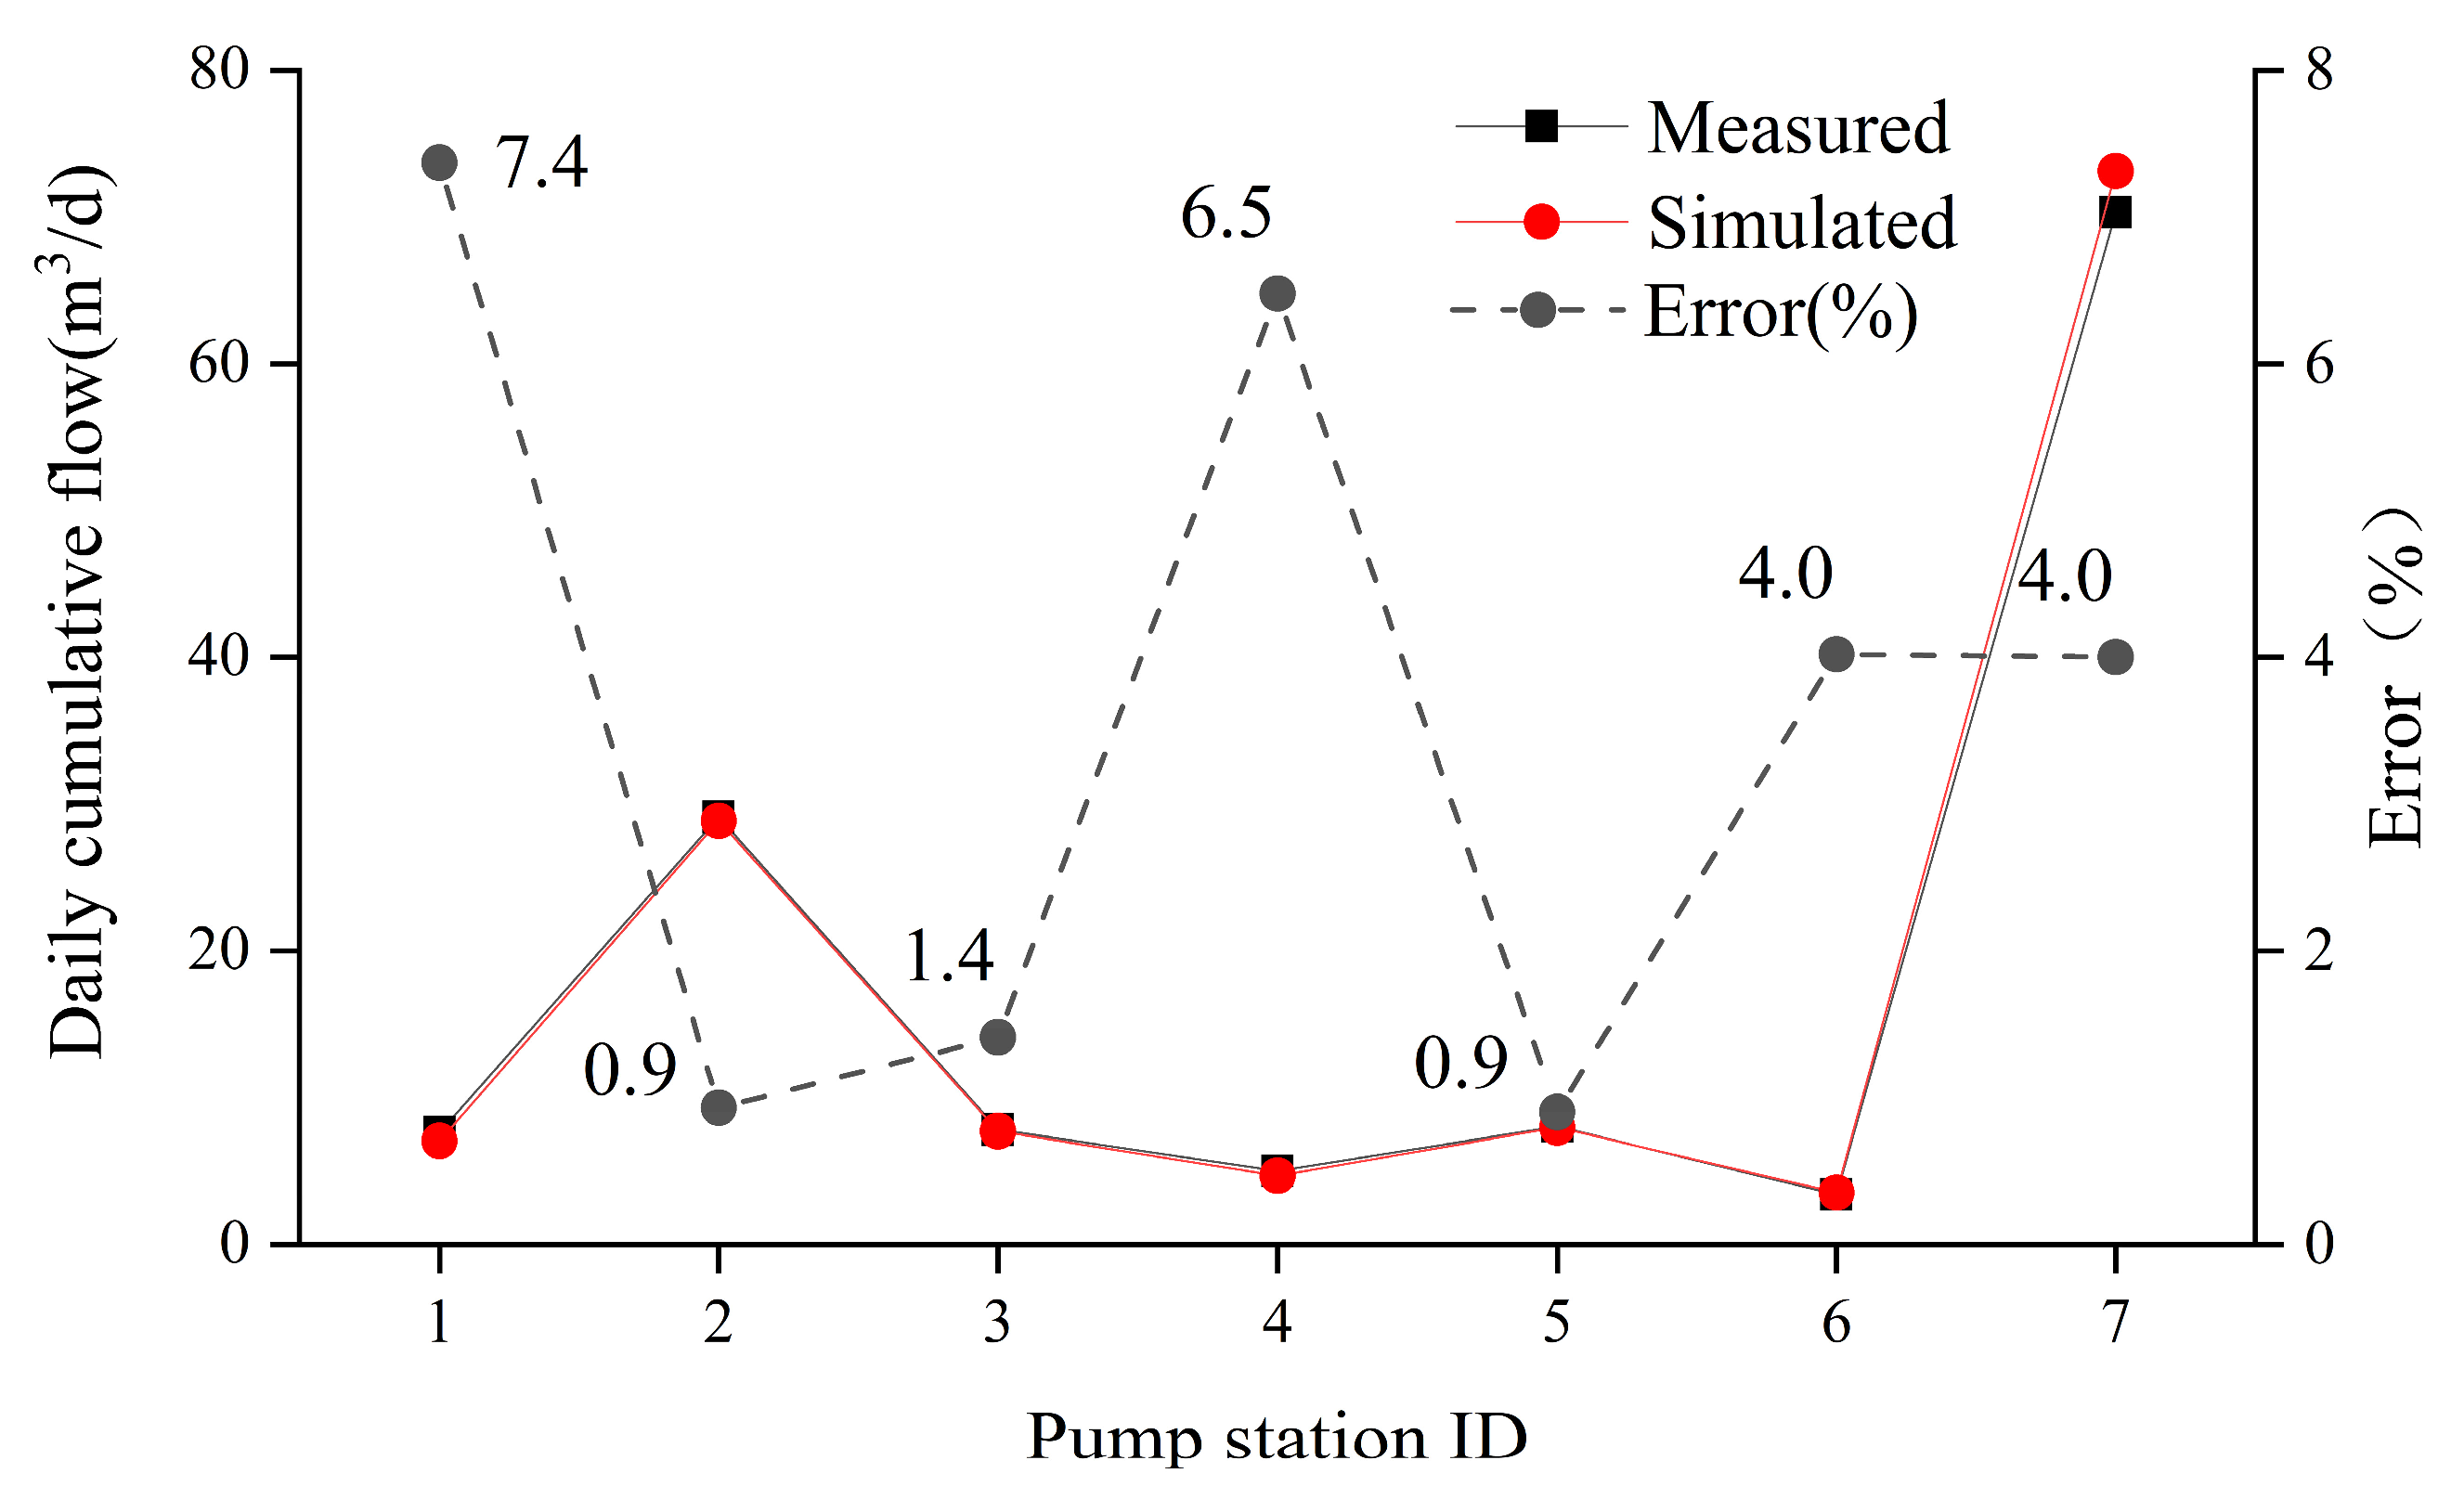
Figure 9.
Distribution of full-load stormwater pipe in rain scenario.
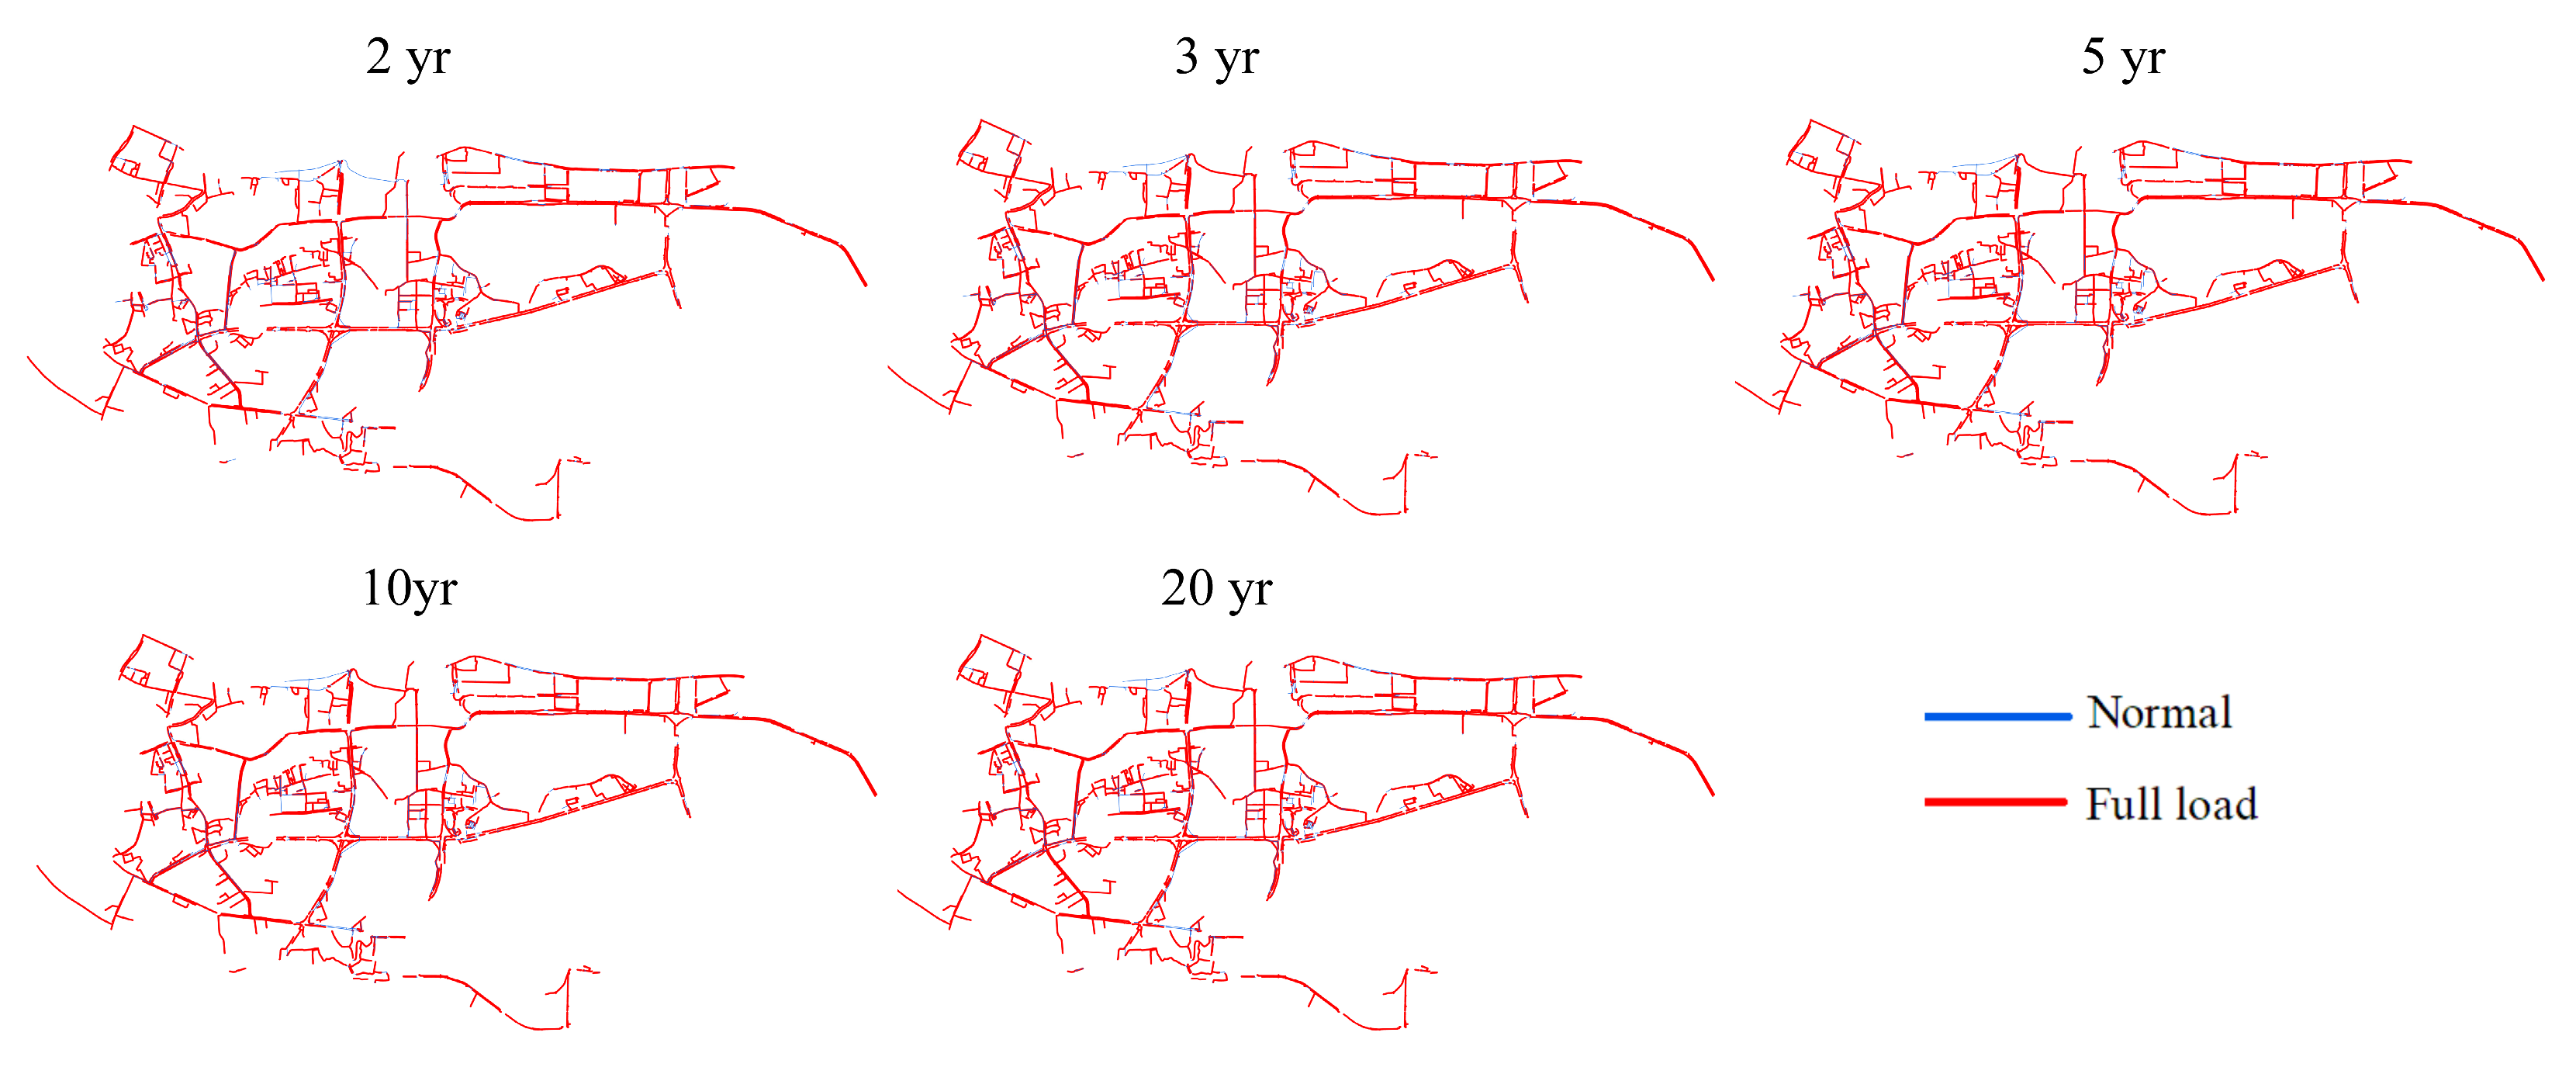
Figure 10.
Distribution of overload stormwater pipe in rain scenario.

Figure 11.
Proportion of full-load/overload stormwater pipe in rain scenario (a): full load; (b): overload.
Figure 11.
Proportion of full-load/overload stormwater pipe in rain scenario (a): full load; (b): overload.
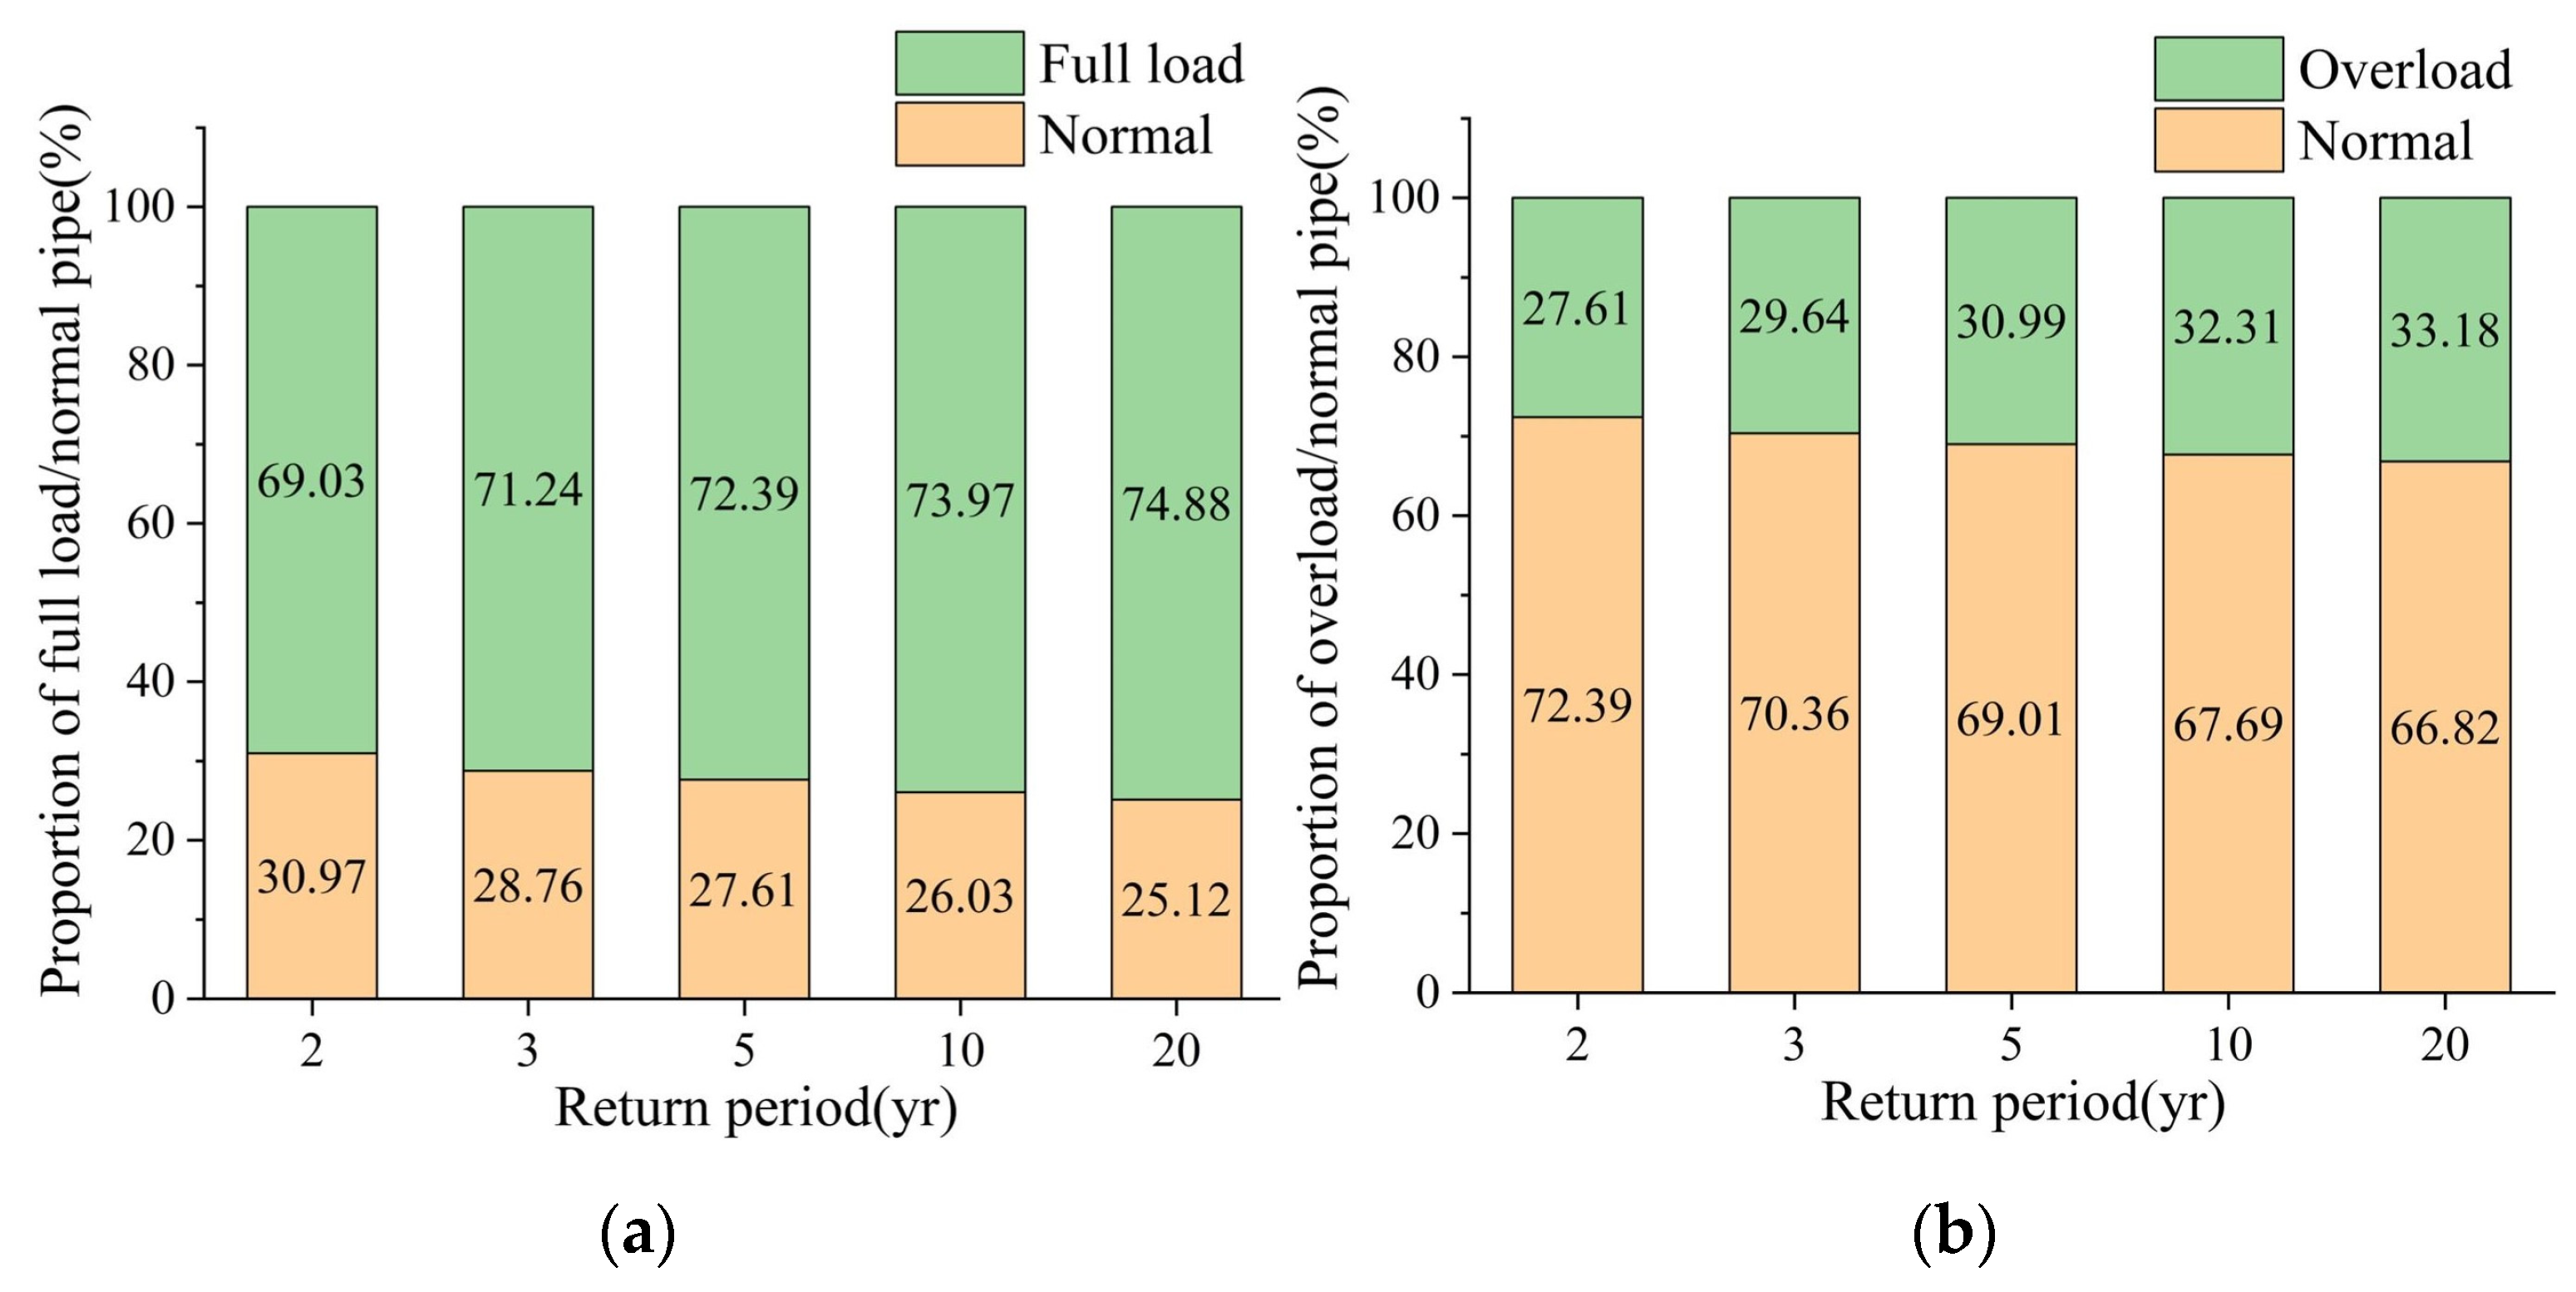
Figure 12.
Distribution of node overflow in rain scenario.

Figure 13.
Comparison of full-load and overload stormwater pipes in rain and rain–sewage scenario. (a): full load; (b): overload.
Figure 13.
Comparison of full-load and overload stormwater pipes in rain and rain–sewage scenario. (a): full load; (b): overload.

Figure 14.
Comparison of the node overflow in rain and rain–sewage scenario.

Figure 15.
Distribution of full-load sewage pipe and overload pipe in dry weather. (a): full load; (b): overload.
Figure 15.
Distribution of full-load sewage pipe and overload pipe in dry weather. (a): full load; (b): overload.

Figure 16.
Distribution of node overflow in dry weather.
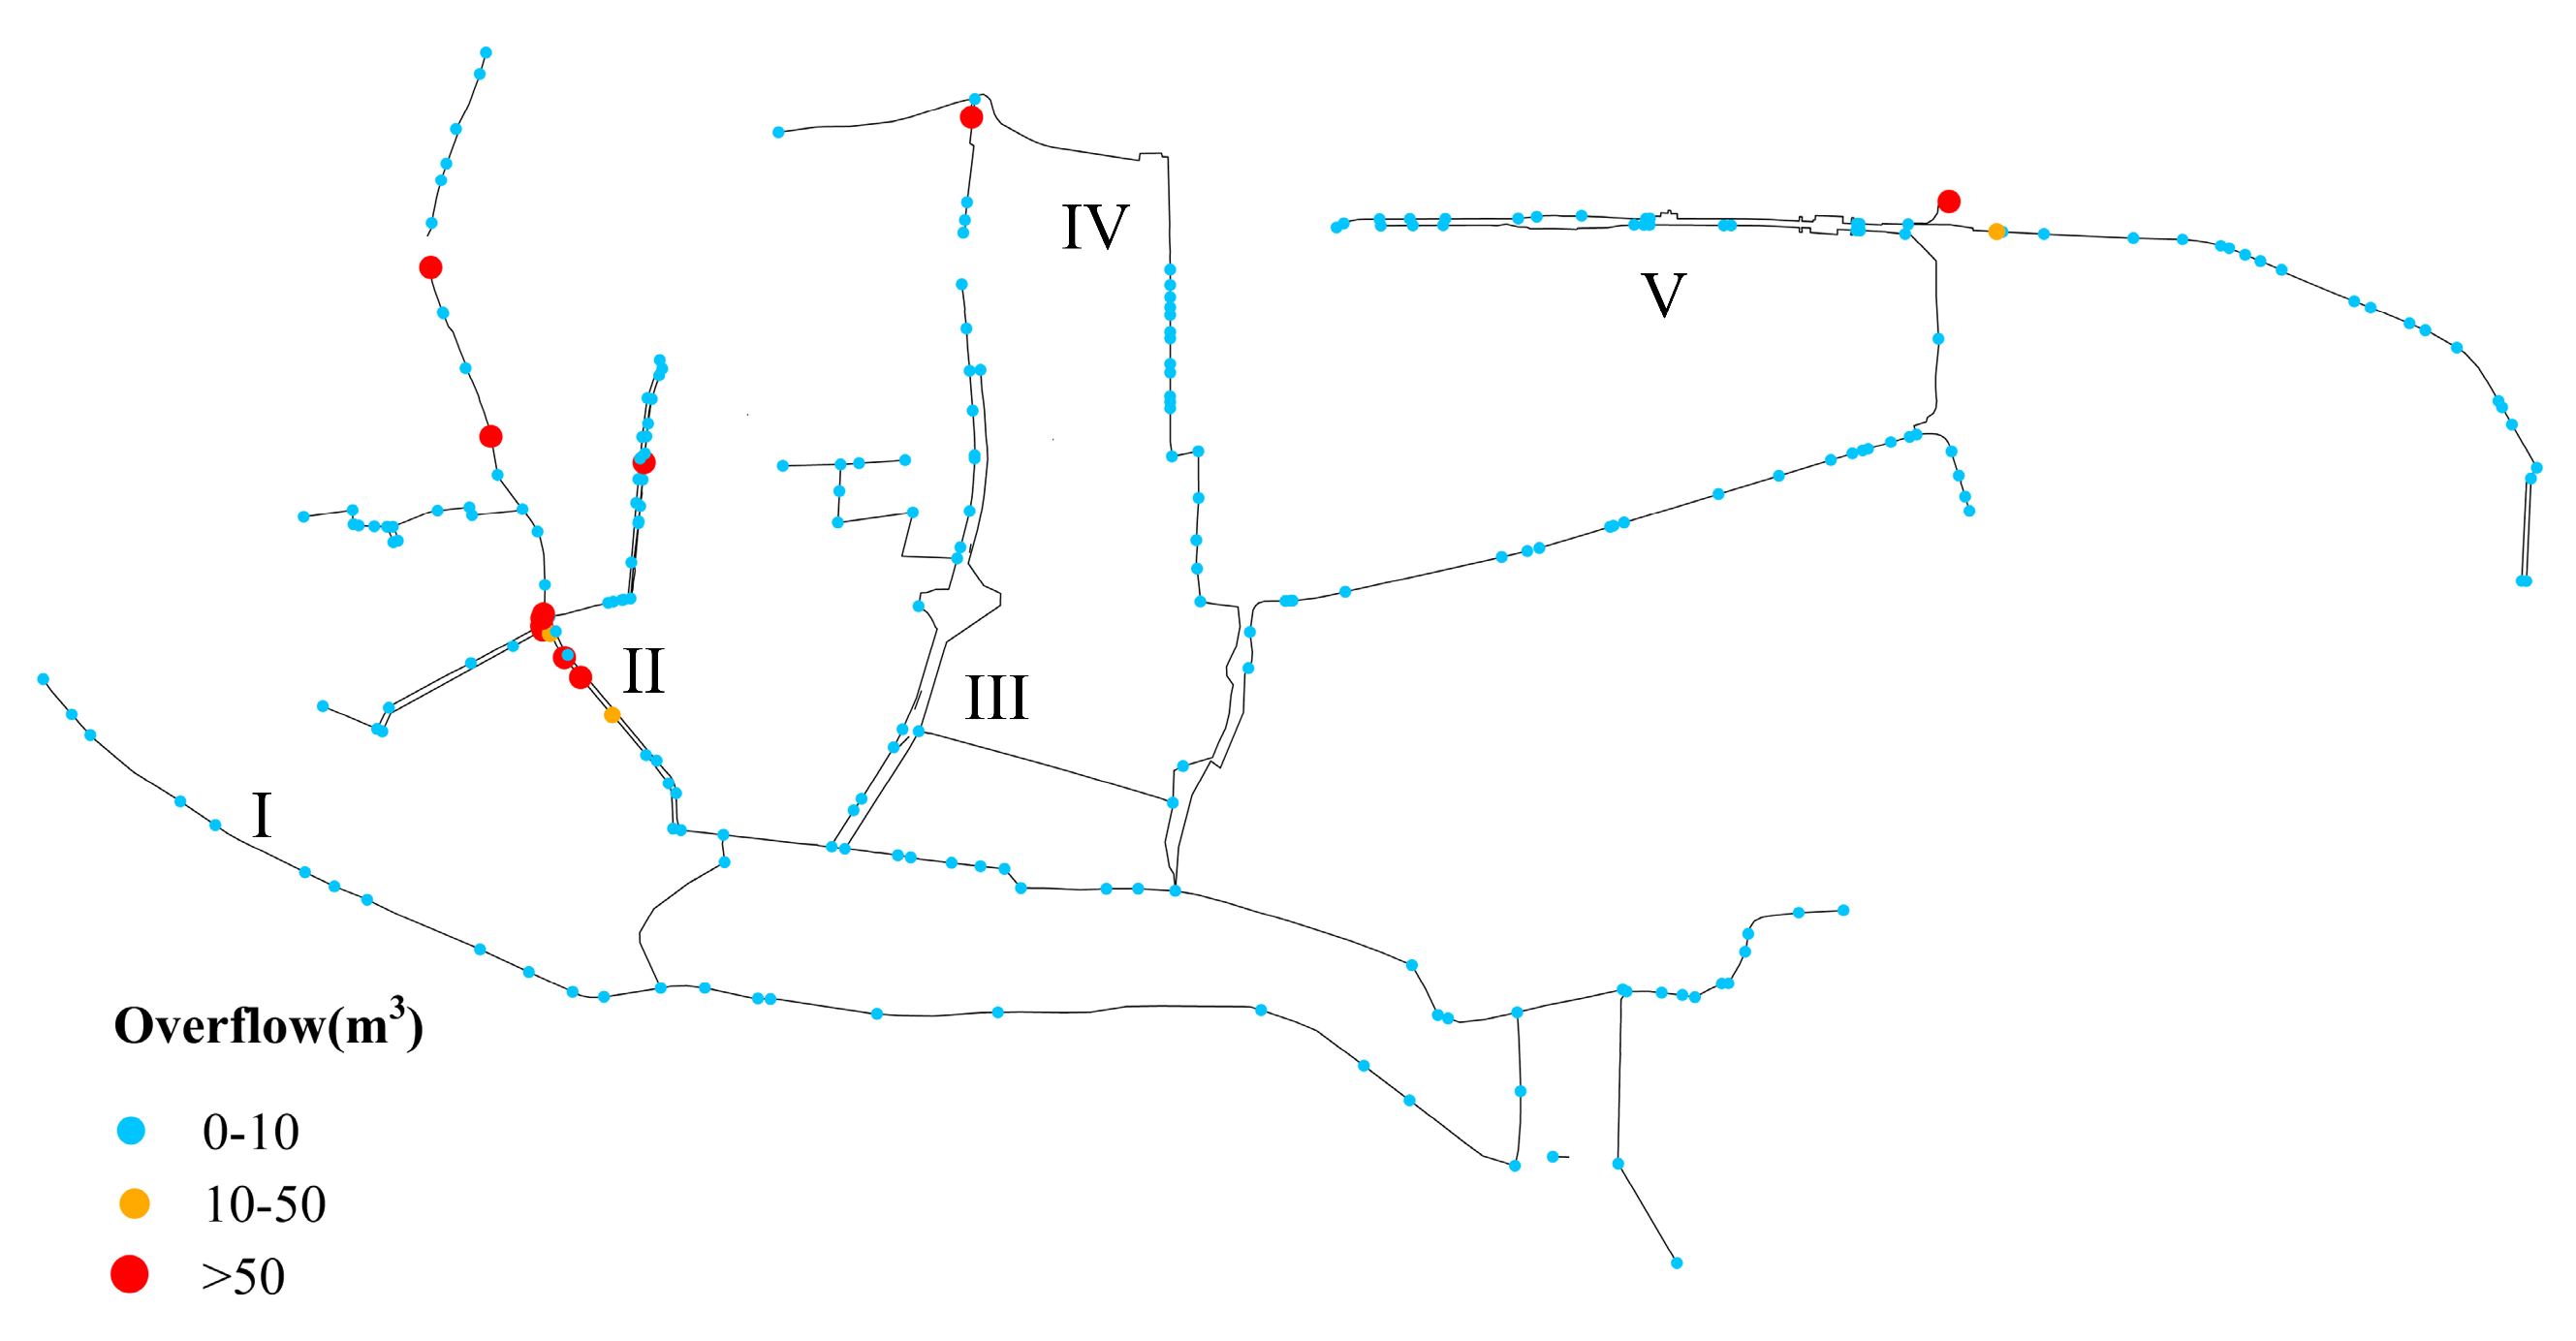
Figure 17.
Distribution of sewage pipe minimum velocity in dry weather.
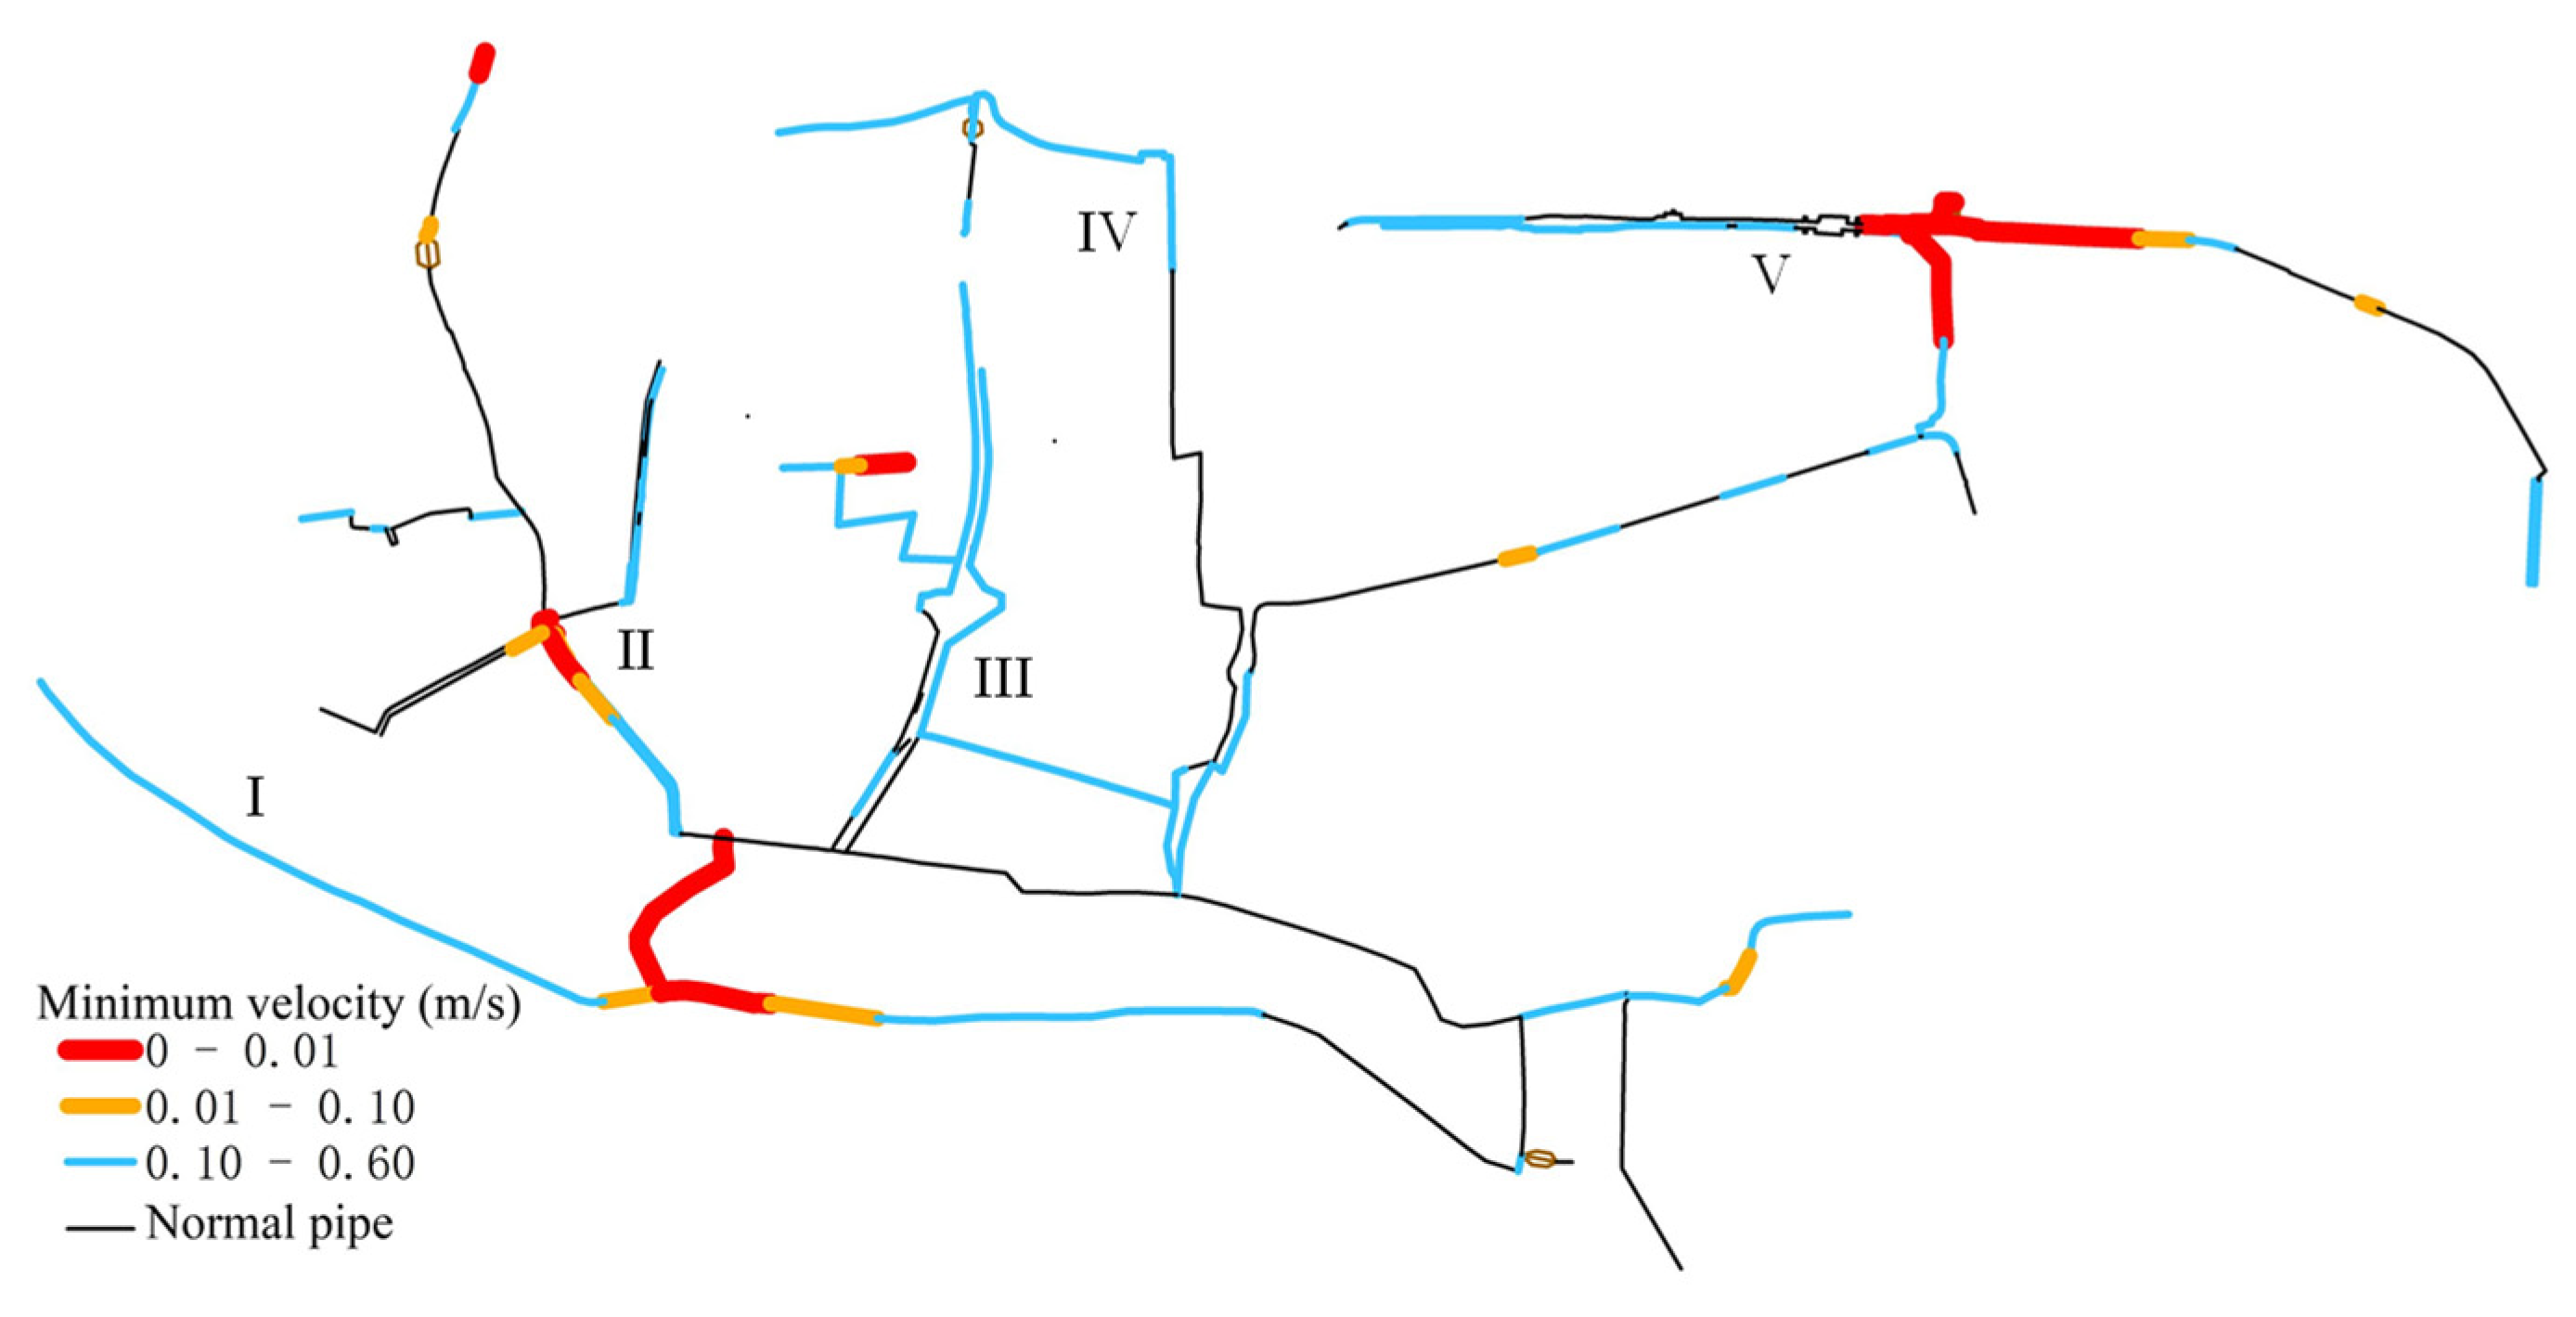
Figure 18.
Comparison of the proportion of full-load/overload sewage pipes in dry weather and rainy weather scenario.
Figure 18.
Comparison of the proportion of full-load/overload sewage pipes in dry weather and rainy weather scenario.
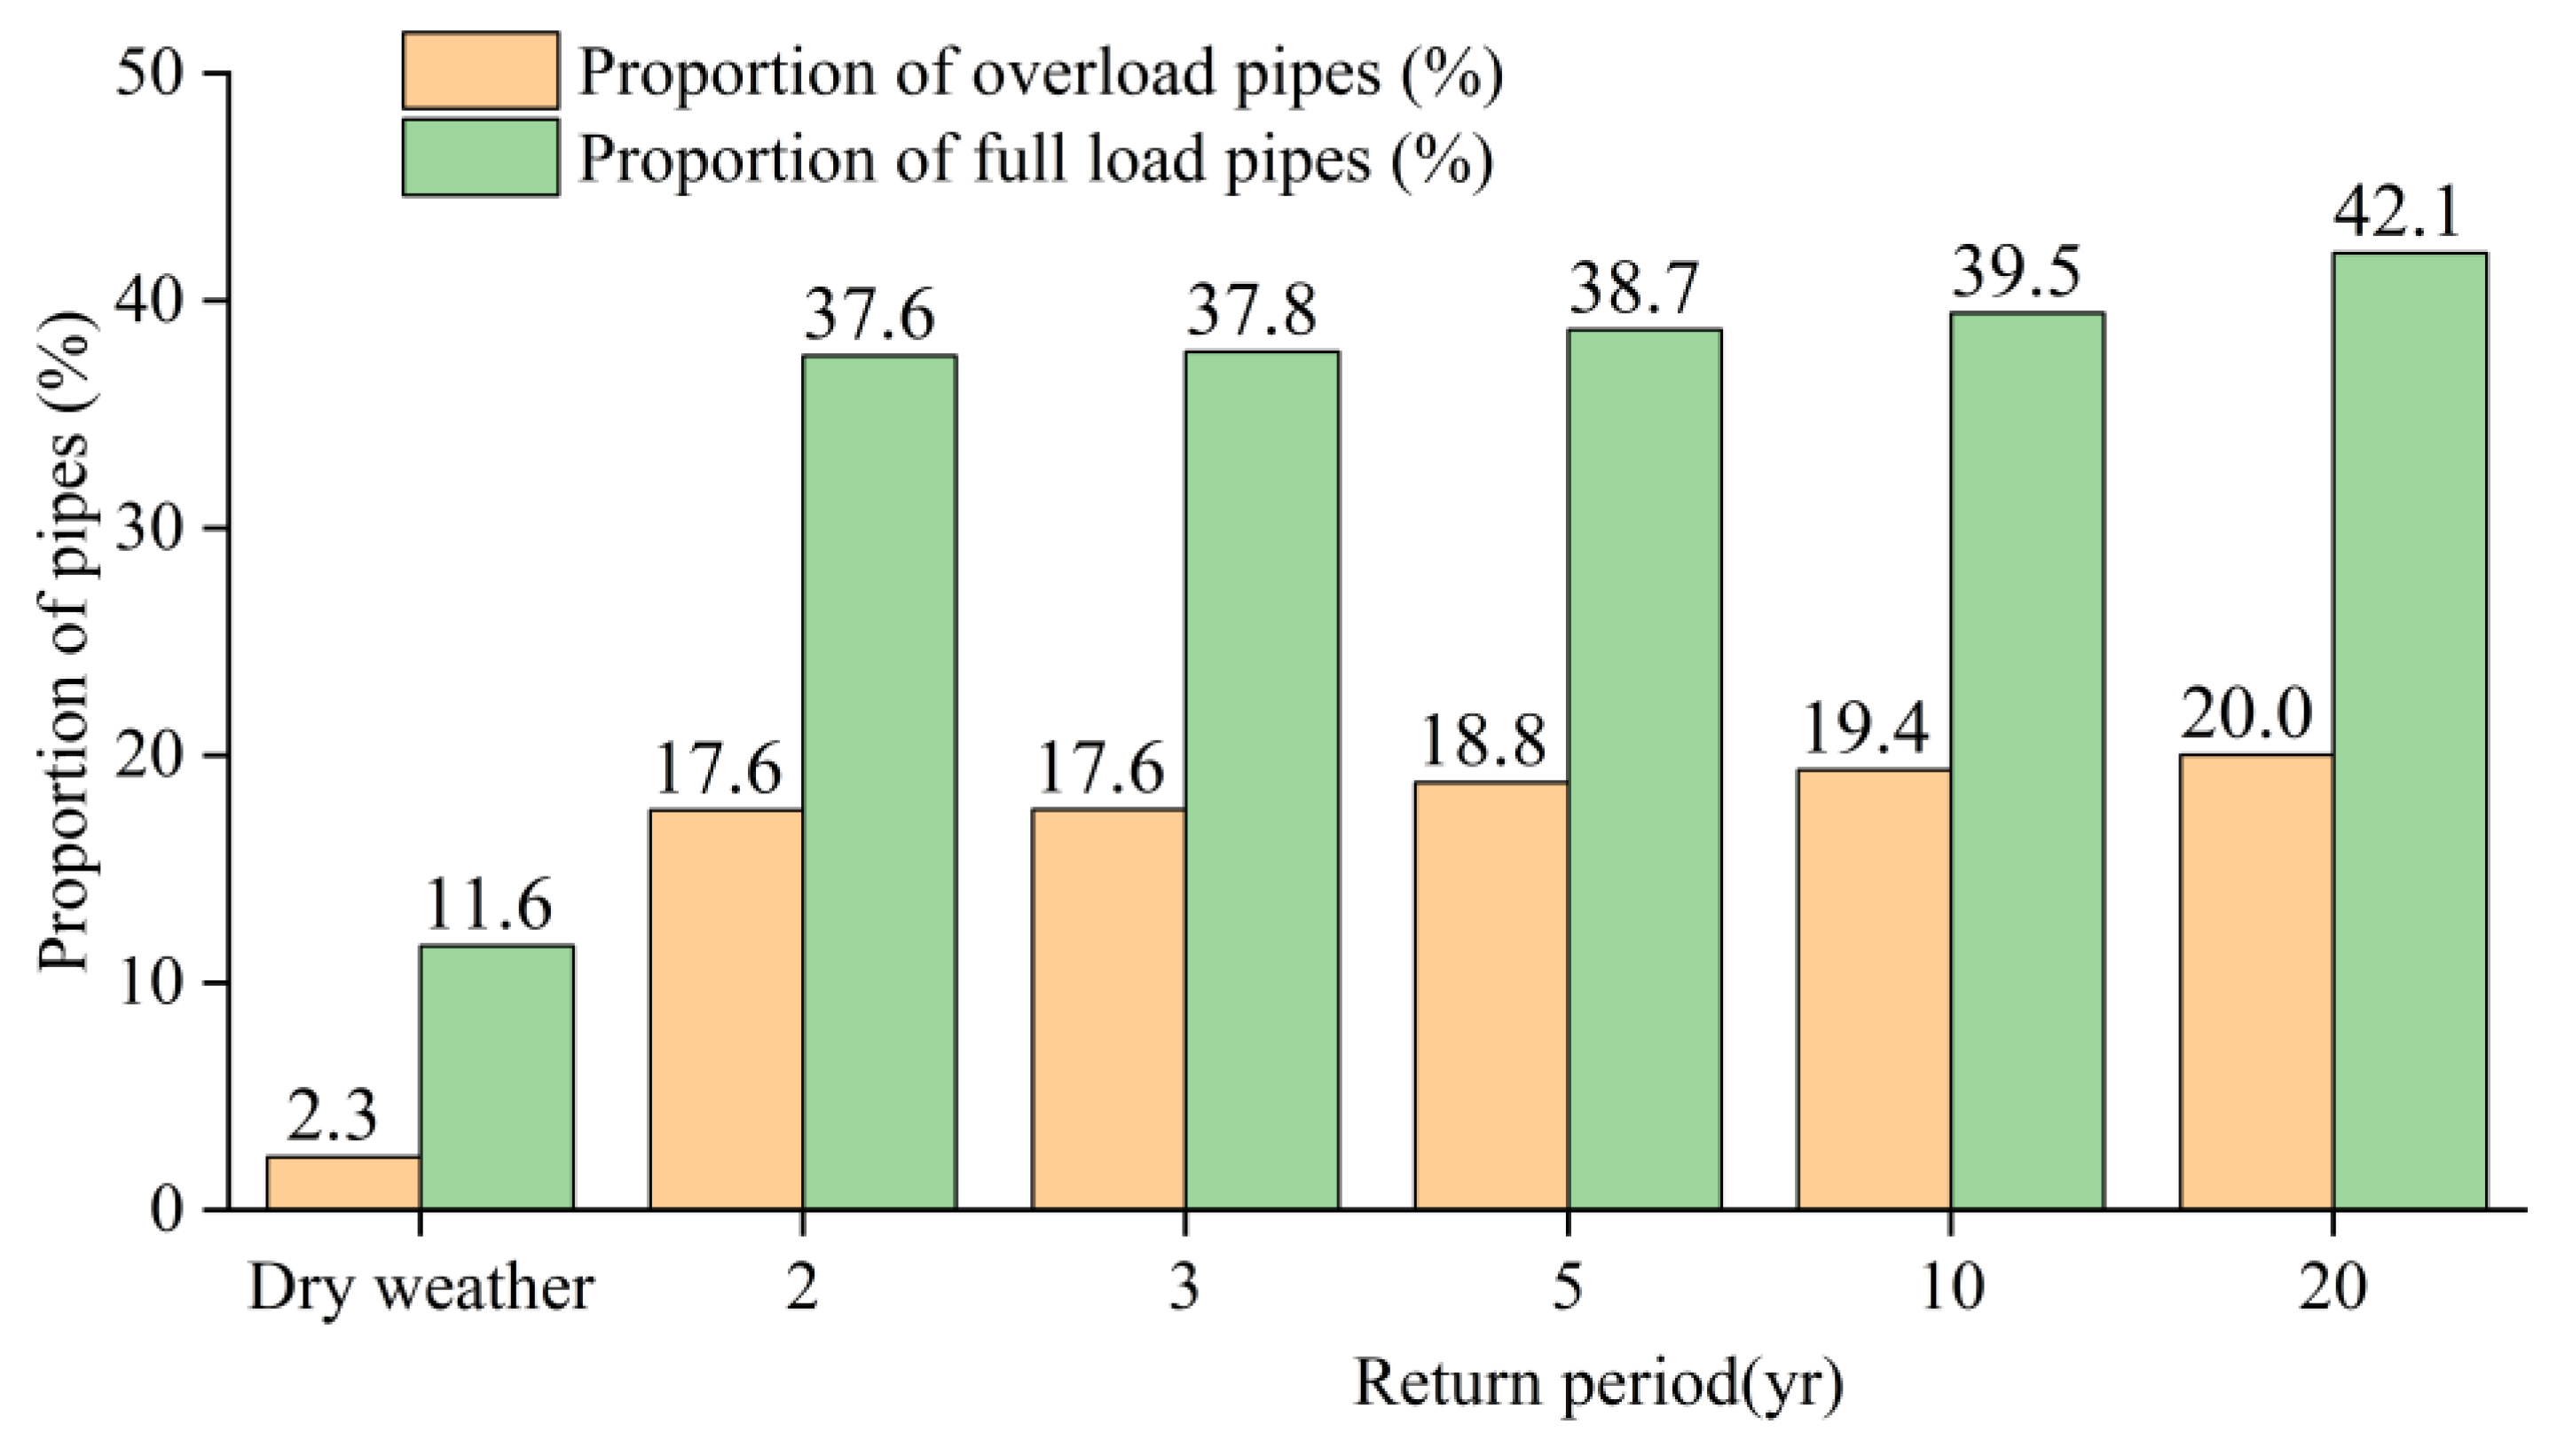
Figure 19.
Comparison of the node overflow in dry weather and rainy weather scenario.

Figure 20.
Comparison of the proportion of low velocity sewage pipe in dry weather and rainy weather scenario.
Figure 20.
Comparison of the proportion of low velocity sewage pipe in dry weather and rainy weather scenario.

Figure 21.
Profile of overflow node.

Figure 22.
Profile of the combined sewer network in zone II and its downstream sewage trunk pipes.

Table 1.
Index of drainage pipe network operational risk.
| Pipe Status | Meaning | Graphical Representation |
|---|---|---|
| full load | The water level either upstream or downstream of the pipe attains the upper limit of the pipe height | 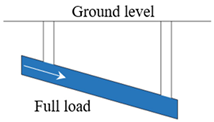 |
| overload | The water level exceeds the diameter of the pipe either upstream or downstream, and the hydraulic gradient exceeds pipe slope. |  |
| overflow | An overflow occurred in the node of the pipeline. | 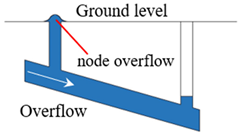 |
| low velocity | Sediment accumulation occurs due to the slow flow velocity |  |
Table 2.
Amount of overflow nodes in each return period.
| Amount | Return Period | |||||
|---|---|---|---|---|---|---|
| Node Overflow (×103 m3) | 2 yr | 3 yr | 5 yr | 10 yr | 20 yr | |
| <1 | 2572 | 2612 | 2654 | 2706 | 2724 | |
| 1–10 | 402 | 503 | 624 | 770 | 916 | |
| 10–20 | 14 | 16 | 20 | 27 | 44 | |
| >20 | 10 | 12 | 15 | 22 | 29 | |
| Total | 2998 | 3143 | 3313 | 3525 | 3713 | |
Disclaimer/Publisher’s Note: The statements, opinions and data contained in all publications are solely those of the individual author(s) and contributor(s) and not of MDPI and/or the editor(s). MDPI and/or the editor(s) disclaim responsibility for any injury to people or property resulting from any ideas, methods, instructions or products referred to in the content. |
© 2024 by the authors. Licensee MDPI, Basel, Switzerland. This article is an open access article distributed under the terms and conditions of the Creative Commons Attribution (CC BY) license (https://creativecommons.org/licenses/by/4.0/).
Share and Cite
MDPI and ACS Style
Li, W.; Wang, Z.; Zhou, J.; Pang, Y.; Wang, H. Operation Risk Simulation and Interaction Impact of Stormwater and Sewage Systems Based on Storm Water Management Model. Water 2024, 16, 953. https://doi.org/10.3390/w16070953
AMA Style
Li W, Wang Z, Zhou J, Pang Y, Wang H. Operation Risk Simulation and Interaction Impact of Stormwater and Sewage Systems Based on Storm Water Management Model. Water. 2024; 16(7):953. https://doi.org/10.3390/w16070953
Chicago/Turabian StyleLi, Wentao, Zijian Wang, Jinjun Zhou, Yali Pang, and Hao Wang. 2024. "Operation Risk Simulation and Interaction Impact of Stormwater and Sewage Systems Based on Storm Water Management Model" Water 16, no. 7: 953. https://doi.org/10.3390/w16070953
Note that from the first issue of 2016, this journal uses article numbers instead of page numbers. See further details here.