
Functional Traits Drive the Changes in Diversity and Composition of Benthic Invertebrate Communities in Response to Hydrological Regulation

1
ALPSTREAM—Alpine Stream Research Center, 12030 Ostana, Italy
2
Department of Life Sciences and Systems Biology, University of Turin, Via Accademia Albertina, 13, 10123 Turin, Italy
*
Author to whom correspondence should be addressed.
Water 2024, 16(7), 989; https://doi.org/10.3390/w16070989
Submission received: 6 February 2024
/
Revised: 25 March 2024
/
Accepted: 26 March 2024
/
Published: 29 March 2024
(This article belongs to the Special Issue Managing Impacts on Baseflows in Streams and the Associated Impacts on Ecosystems and Water Quality)
Abstract
:Of all the environmental elements that influence the biological communities of rivers, water flow characteristics are undoubtedly the most important. Unfortunately, natural hydrological characteristics are increasingly threatened by human activities, especially in alpine or high mountain areas where there are numerous hydropower plants. In this study, we analysed the impact of hydrological alterations on the macroinvertebrate community of a lowland river in NW Italy. Specifically, we analysed the macroinvertebrate communities of an unaffected site by comparing them with those of a site subject to hydrological alteration. We adopted an approach that is not only taxonomic but also functional, allowing us to study a component of biodiversity that is generally less known. Our results show that the flow-altered site hosted a benthic community with lower species and functional diversity than the control site. Interestingly, we also detected a number of significant differences between the summer and autumn samples. In particular, examination of community-weighted mean (CWM) trait values reveals significant variation in body size, voltinism, substrate, locomotion, feeding habits and other traits between sites and seasons. The integration of taxonomic and functional approaches provides a comprehensive understanding of how human-induced hydrological variations can affect aquatic biodiversity and ecological functions.
1. Introduction
Rivers are complex ecosystems in which the main environmental factor regulating and shaping all biotopic and biocenotic characteristics is the quantity and characteristics of water flows. The variability of flow velocity, flow type and amount, water column depth and other hydraulic elements make lotic environments unique for their enormous ecological diversity, with the presence of numerous microhabitats that allow the establishment of complex biocenoses characterised by high ecological diversity [1,2].
Unfortunately, streams and rivers have probably been the most altered natural environments in recent decades [3]. Lotic systems have supported the growth of human civilisation around the world since the first cities appeared some 7000 years ago [4], but as a result most of these systems have been negatively affected. The collapse of freshwater biodiversity has multiple causes acting at different scales. At the global scale, climate change plays a key role by disrupting hydrological regimes and increasing water temperatures. At the local scale, increasing anthropogenic impacts are changing the nature of lotic ecosystems [5] in many ways, i.e., from a morphological [6], hydrological [7], biological [8], physicochemical [9] and thermal [10] perspective.
Particularly in recent years, there has been a growing interest in assessing the effects of hydrological variability on stream biota. Indeed, hydrological alterations associated with the presence of water withdrawals, dams, tailraces or artificial tributaries can be important concerns for lotic ecosystems, but this issue has been addressed unevenly, neglecting several important aspects. In the past, many studies have focused on the effects of large dams [11], while the environmental consequences of small dams have often been overlooked. Furthermore, studies on the effects of flow reduction are abundant [12], but information on sudden flow fluctuations is scarce [13,14].
Recently, many studies have focused on the ecological impacts of hydropower generation in mountainous regions [15], with particular emphasis on hydropeaking, i.e., sudden changes in flow regime associated with large discharge fluctuations when water is released from hydropower plants into the lotic system [16,17]. In particular, several studies have been carried out to investigate the effects of hydropeaking on benthic invertebrates [18,19,20,21,22,23,24]. Macroinvertebrates are optimal ecological indicators because they are large and easy to collect [25], they have different resistance to flow [26], they show different sensitivity to pollution [27] and morphological changes in the river [28], they have relatively long life cycles [29] and they play different ecological roles [30]. Ecological functions can be described by a variety of general biological traits that reflect species adaptation to environmental conditions [31]. Feeding strategies are typical traits that reflect species adaptation and could form part of a unified measure across communities of different taxonomic composition [32]. The functional feeding classification of aquatic organisms improves the knowledge of trophic dynamics in streams by simplifying the benthic community into trophic guilds—functional feeding groups (FFGs) [33]. Functional feeding groups can thus be useful in studies focusing on hydrological changes, as they respond differently to changes in flow [34,35,36]. Flow characteristics, together with other environmental characteristics such as water quality, granulometry and bed retention, determine the rate of degradation of coarse particulate organic matter (CPOM) in the river [37,38], a fundamental energetic input for lotic biocoenoses [39]. Morphohydrological alterations shape the distribution of CPOM and consequently affect the functional composition of communities [40]. Unfortunately, as hydrological alterations are mainly localised in alpine areas, where the highest densities of hydropower plants are concentrated, studies on the structural and functional response of macrobenthic communities to this issue have mainly focused on mid- to high-elevation lotic systems [41,42].
The aim of this study was to evaluate changes in the taxonomic and functional composition of macroinvertebrate communities in an Apennine site affected by artificial flow. In particular, we hypothesised that the impacted site would have lower taxonomic and functional diversity than an uninmpacted control site. In addition, we expected that flow alteration would act as an environmental filter, selecting functional traits of benthic macroinvertebrates, which in turn would lead to differences in biological traits, not only by comparing the disturbed site with the natural one but also by assessing whether the effects varied in different seasons.
2. Materials and Methods
2.1. Area of Study
Two sampling sites (Figure 1) were selected along the Orba river (province of Alessandria, NW Italy): S1 Marciazza (44°35′13.36″ N; 8°36′41.79″ E; 264 m asl) and S2 Cerreto (44°35′56.60″ N; 8°36′10.81″ E; 216 m asl).
Both stations are located below the Ortiglieto dam, but they have very different hydrological conditions. Site 1 (Marciazza) has a natural flow, depending mostly on precipitation, while site 2 (Cerreto) experiences high and unpredictable water level variations because it receives tailrace from a hydroelectric plant, so it is subject to unpredictable flow changes due to the presence of the release channel. More information is available in [43], and here we report that hydrological conditions varied rapidly and unpredictably, with increases or decreases in flow (in the range of 2 m3/s) and velocity (from 0.2 to 0.9 m/s) occurring within a few seconds. The control and disturbed sites are located 3 km apart and are comparable in terms of physical and chemical characteristics of the water and land use (Table 1).
Land use was calculated using QGIS 3.14, using Corine Land Cover maps and a 1.5 km buffer and considering the sites as watershed closures. As reported above, the control site is characterised by a natural flow solely dependent on rainfall, while the disturbed site is affected by unpredictable and sudden variations in river discharge, as well as water depth and channel width, due to hydropower production from the dam. Considering that the main environmental features of the two sites are similar, it is likely that hydrological variations may be the key factor influencing the biological differences of the benthic communities between these two sampling sites.
2.2. Macroinvertebrate Sampling and Processing
Data collection was performed in 2018 in two seasons to assess the impact of hydrological alterations in two different environmental conditions (i.e., summer and autumn). It is well known that in low-order, mountainous streams, these two seasons are characterised by different flows, temperatures and energy inputs (e.g., CPOM [44]). Each sampling site was surveyed once per season and randomly collected in a fixed area of 100 m. Quantitative samples of benthic macroinvertebrates were collected using a Surber sampler (20 × 20 cm, 255 µm mesh size), individually preserved in 90% ethanol, labelled and returned to the laboratory. To avoid spatial related issues, Surber samples were taken at least 2 m apart and representative of all microhabitats at the site scale. During the summer, 52 samples were collected from both the control and disturbed sites. Preliminary analysis of the summer data using taxa accumulation curves (see Supplementary Material, Figure S1) indicated that the sampling effort (i.e., 52 samples per site) was sufficient to obtain a representative characterisation of macroinvertebrate community diversity at both sites. Therefore, the total number of samples was reduced to 41 during the autumn campaign. However, the taxa accumulation curves show that the sampling effort was sufficient to obtain a representative community (see Supplementary Material, Figure S1). In the laboratory, all samples were sorted, and macroinvertebrates were counted and identified by species or genus, except for Oligochaeta and early instars of some Trichoptera and Diptera, which were identified by family or subfamily level according to the dichotomous key available for the Italian benthic macroinvertebrate fauna [45,46]. In the data analysis, we considered taxa richness (i.e., the number of taxa collected in each sample) and total abundance (i.e., the number of specimens collected in each sample). To better describe the response of macroinvertebrate communities to hydrological alterations, a functional approach was adopted by selecting 37 individual traits (Table 2) belonging to 6 categories expected to be affected by flow variations [47].
According to the database provided by [48], a fuzzy coding procedure was used to assign each taxon a score ranging from 0 (i.e., no affinity) to 5 (i.e., high affinity) for each selected trait. For those taxa identified at the family level, scores were obtained by calculating the mean value for all genera scores included in that family. To standardise such affinity scores, they were then transformed into frequencies (i.e., 0–1) by dividing each taxon individual score for a particular trait by the sum of the scores for the whole trait category. This allowed us to obtain a taxa X traits matrix that was used to calculate the functional richness (FRic), functional evenness (FEve) and functional dispersion (FDis). FRic is an indicator of the amount of functional space occupied by the community, while FEve indicates the equipartition of abundance distribution of traits in a functional space [48]. Instead, FDis represents the dispersion of taxa in a trait space [49]. Finally, the community-weighted mean (CWM) trait value was calculated, with the R statistical environment, for each selected trait with the following formula [50]:
where pi is the relative abundance of the taxon i in the macroinvertebrate community and traiti is the value (i.e., frequency value in our study) associated with that trait for taxon i. In other words, CWM represents a trait-level indicator describing the distribution of values within each trait for each measured assemblage [50].
CWM = Σpi × traiti
2.3. Statistical Analyses
Compositional changes in macroinvertebrate communities between sites, season and the interaction siteXseason were visually inspected and statistically tested using Non-Metric Multidimensional Scaling (NMDS) and Permutational Analysis of Variance (PERMANOVA), respectively. To this end, all samples were used in this analysis, and the Bray–Curtis dissimilarity index was applied to macroinvertebrate abundances.
The Kruskal–Wallis test for non-normal distribution and Analysis of Variance (ANOVA) in normal distribution were used to assess whether taxonomic (i.e., total taxon richness and total abundance) and functional (i.e., Fric, Feve, Fdis) community metrics, respectively, significantly differed between sites and seasons. Post hoc pairwise comparisons were conducted using the Shaffer–Tukey Procedure (STP) for the Kruskal–Wallis results, considering the need for a probabilities correction. Additionally, significant differences in the community-weighted mean value for each selected functional trait were assessed using the Kruskal–Wallis test, and pairwise comparisons were performed with the STP test.
All analyses were performed in the R statistical environment [51] by using the basic functions and the following packages: FD [52] for calculating potential differences in the functional traits (see Table 2) and CWM trait values, vegan [53] for NMDS and PERMANOVA and ade4 [54] for CA. The significance threshold was set to p < 0.05.
Moreover, to provide a comprehensive characterization of the trait profile of macroinvertebrate communities across sites and seasons, a Correspondence Analysis (CA) was run based only on the functional traits, for which CWM analysis provided significant results. The mean CWM trait value for each selected trait was calculated per site.
3. Results
A total of 35,312 macroinvertebrates belonging to 58 taxa were collected. Among these, five taxa accounted for 68% of the whole community: Hydracarina (18%), Baetis sp. (16%), Leuctra sp. (15%), Hydropsychidae (11%) and Chironomidae (10%). Taxonomic community composition differed for both sampling site (F1141 = 0.047; p < 0.001) and season (F1141 = 0.056; p < 0.001), while the interaction between these two factors was not significant (F1141 = 0.010; p = 0.084) (Figure 2).
Taxon richness was always significantly higher in the control site than in the disturbed site in both seasons, while no statistical differences were observed in the number of taxa from one season to the other within the same site (Figure 3a). Despite the total abundance of macroinvertebrate being generally higher in the control than in the disturbed site, significant differences were found only between the control site in autumn and the disturbed site in summer (Figure 3b). Functional richness varied seasonally, with significant differences only between the control site in autumn and both the control and disturbed sites in summer (Figure 3c). Finally, no significant variations in the functional evenness and functional dispersion were observed between sites and seasons (Figure 3d,e).
When looking at the variation in the community-weighted mean (CWM) trait values between sites and seasons, statistical differences were found for 21 out of 37 single traits. Among the body size traits, CWMs of macroinvertebrates with maximal potential size 0.5–1 cm varied seasonally and were significantly lower in the control site in autumn than control and disturbed sites in summer (Figure 4a). By contrast, the CWM trait value of benthic macroinvertebrates with maximal body size 2–4 cm was generally higher in the disturbed site than the control site, with significant differences only for summer season (Figure 4b).
All the traits associated with the voltinism (i.e., number of cycles per year) showed significant variations between sites and seasons. On average, the CWM trait value for taxa with a number of cycles per year <1 was higher in the disturbed site than the control site, but significant differences were observed only between the control site in autumn and disturbed site in summer (Figure 4c). Very similar results were found for univoltine macroinvertebrates (i.e., number of cycles per year =1; Figure 4d), while the opposite trend was observed for plurivoltine macroinvertebrates (i.e., number of cycles per year >1; Figure 4e).
Among the substrate and locomotion relationship category, disturbed sites had generally higher CWM trait values for surface swimmers than the control sites, despite statistical differences observed only in summer (Figure 5a). The opposite trend was found for water swimmers that were always and significantly higher in the control site compared to the disturbed site (Figure 5b). The community-weighted mean trait value associated with burrower taxa showed significant differences only in summer when it was higher in the disturbed site than the control site (Figure 5c). With respect to temporarily attached macroinvertebrates, the lowest CWM trait value was observed in the control site in summer and was significantly lower than control and disturbed sites in autumn (Figure 5d).
Significant variations in the CWM trait values were observed for all the feeding groups. On average, the CWM values of deposit feeders and shredders varied seasonally and were significantly lower and higher, respectively, in the disturbed site in summer than in the control site in autumn (Figure 5e,f). The community-weighted mean trait values associated with scrapers were always and significantly higher in the control site than disturbed site (Figure 5g), while for filter feeders, statistical differences were evident only between seasons rather than sites (Figure 5h). Although predator piercer macroinvertebrates accounted for a small proportion of the benthic communities, their CWM values were always significantly higher in the control site than disturbed site (Figure 5i). By contrast, the opposite situation was found for predators insofar as the CWM values associated with this feeding habit were always higher in the disturbed site than the control site (Figure 5j).
Among the transversal distribution category, significant differences were observed for 4 out of 7 single traits. In particular, the community-weighted mean trait value of macroinvertebrate taxa preferring the river channel was significantly higher in the control site than the disturbed site but only in summer (Figure 6a). On the contrary, the opposite trend was found for taxa associated with ponds, pools and disconnected arms: their CWM value was generally higher in the disturbed site than the control site despite statistical differences being evident only in summer (Figure 6b). On average, the control site had higher CWM values of macroinvertebrates related to temporary water compared to the disturbed site, with significant differences only in autumn (Figure 6c), while the opposite trend was observed for macroinvertebrates preferring groundwaters (Figure 6d).
With respect to the water velocity, significant differences were found only for macroinvertebrates associated with medium and fast velocity, with a lower CWM trait value in the disturbed site than the control site in autumn (Figure 6e) and seasonal differences (Figure 6f), respectively.
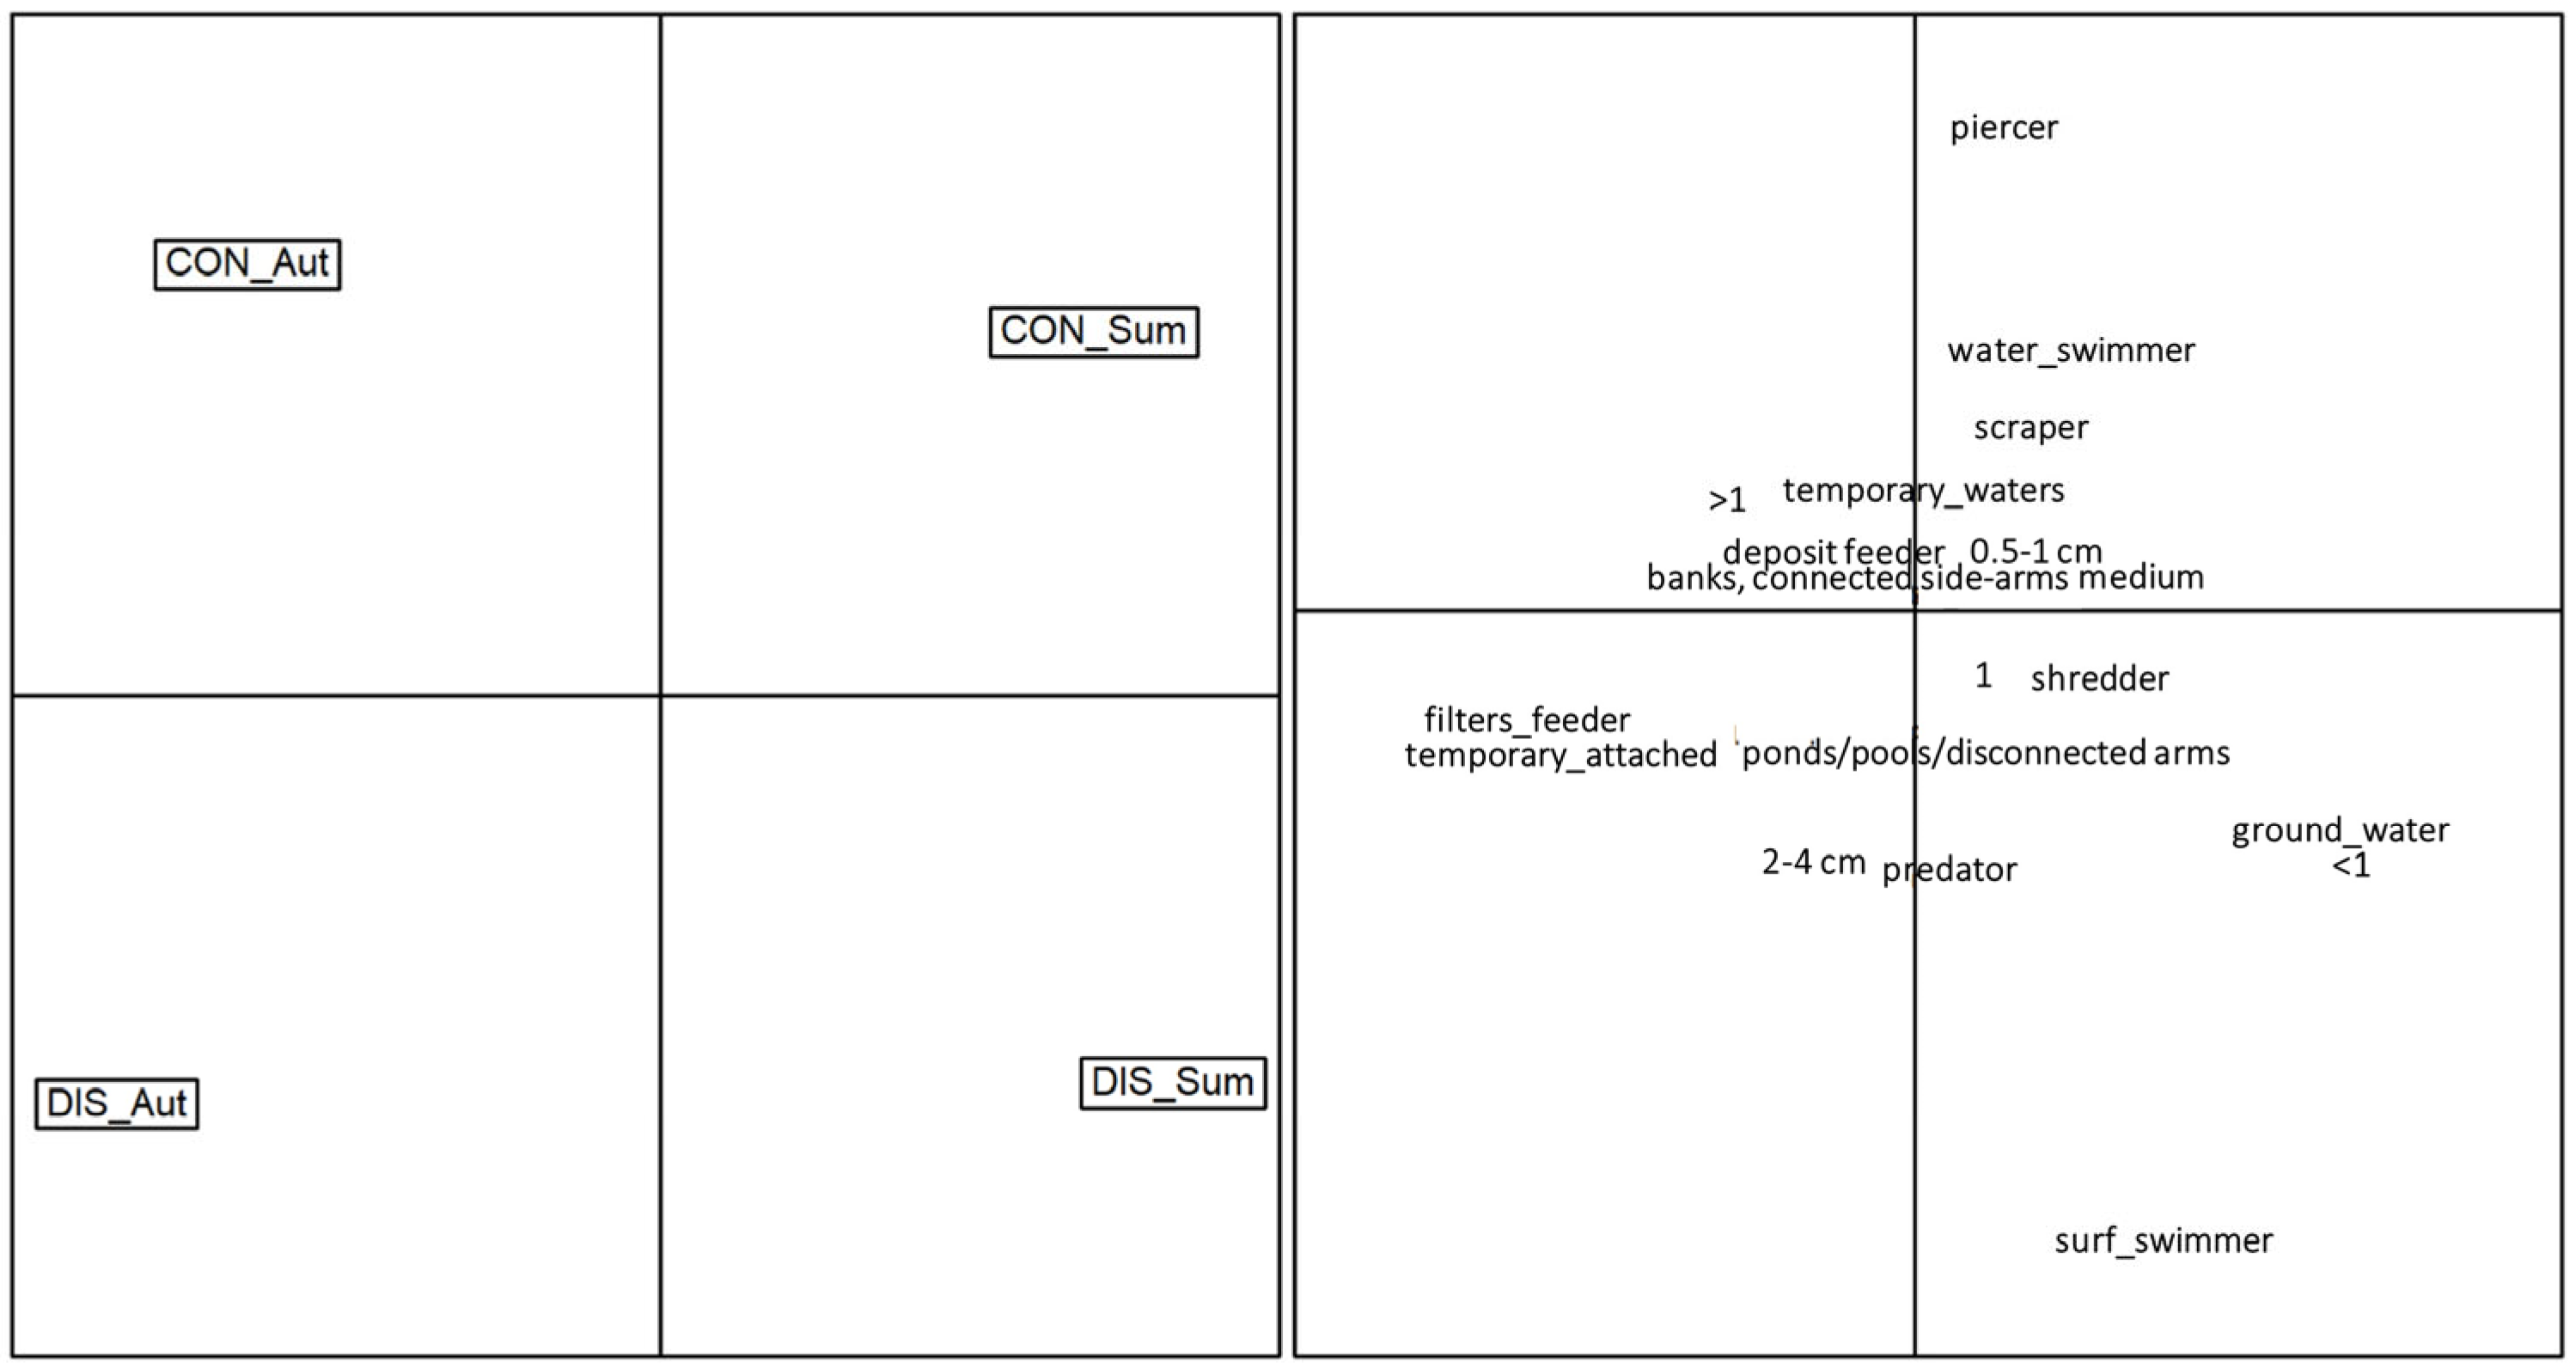
Results of the Correspondence Analysis (Figure 7) depicted a clear separation of the sampling sites based on the functional traits, along with evident seasonal differences. The control site occupied the top half of the graph, with the autumn and summer communities oriented on the top-left and top-right sides, respectively. Macroinvertebrate communities of the control site were mainly composed of piercers, water swimmers, scrapers, plurivoltine taxa and taxa associated with temporary waters. On the contrary, the disturbed site occupied the bottom half of the graph, with the autumn and summer communities oriented on the top-left and top-right sides, respectively. Compared to the control, macroinvertebrate communities in the disturbed sites were mostly composed of surface swimmers, predators, 2–4 cm sized invertebrates, and taxa associated with ponds/pools/disconnected arms.
4. Discussion
The findings of this study shed light on the impact of human-induced hydrological variations in a river ecosystem, in an Apennines area, as assessed through the lens of macroinvertebrate community structure, functional feeding groups and biological traits. A total of 35,312 macroinvertebrates, belonging to 58 taxa, were comprehensively assessed. In particular, some taxa dominated the community, with Hydracarina, Baetis sp., Leuctra sp., Hydropsychidae and Chironomidae together constituting a substantial proportion. We detected significant variation regarding both sampling site and season in the taxonomic community composition. The observed differences in taxon richness and total abundance between the control and disturbed sites highlight the influence of artificial flow modifications on macroinvertebrate communities [55]. Taxa richness and invertebrate abundance were higher in the control than in the disturbed site across seasons, according to the results of Takao et al. (2008) that reported the reduction in diversity with low taxa richness and the predominance of a particular species below the tailrace [56]. Regarding comparisons in taxa richness among seasons, differences within the same site were not evident, while we detected a difference between sites only comparing the control site in autumn and the disturbed site in summer. Autumn was the season with the highest macroinvertebrate number of taxa, as has been reported for other low-order European rivers [57,58].
In terms of functional richness, we observed interesting and significant variations comparing season samplings, with noteworthy differences occurring markedly between the control site in autumn and both control and disturbed sites in summer. The reduction in functional richness may be due to the disappearance of certain taxa with highly specialized traits (e.g., aquatic respiration, clingers, shredders) in the disturbed sites [59,60], indicating a decreased resource availability and a potential ecosystem alteration [61]. However, no significant fluctuations in functional evenness and dispersion were discerned between sites and seasons, indicating a certain degree of stability in the functional structure of the macroinvertebrate community.
Examination of community-weighted mean (CWM) trait values provided further insight into specific traits affected by hydrological regulation [62]. Indeed, the assessment of community-weighted mean (CWM) trait values for 37 individual traits exposed statistically significant differences between sites and seasons for 21 traits. Traits associated with body size, voltinism, substrate, locomotion, feeding habits and transversal distribution showed some variation between sites and seasons [63]. Regarding body size traits, macroinvertebrates with a maximal potential size of 0.5–1.0 cm revealed seasonal variations, with significantly higher CWM trait values in both control and disturbed sites in summer compared to the control site in autumn. It is likely that small-sized species may characterise environments with high instability, as the result of anthropogenic disturbances imposed on the organisms [64].
Analysis of traits associated with voltinism (number of cycles per year) disclosed significant variations between sites and seasons. For example, the richness of the plecopterofauna decreases at the disturbed site compared to the control. In the latter, organisms of the genus Leuctra, known to be among the more tolerant Plecoptera, increase in number as they probably utilise resources and niches vacated by the more sensitive species [47].
Within the substrate and locomotion relationship category, disturbed sites exhibited higher CWM trait values for surface swimmer with statistical differences evident in summer. Conversely, water swimmers consistently displayed higher CWM trait values in the control site, irrespective of season. Notably, burrower taxa as Limoniidae exhibited significant differences only in summer, with higher CWM trait values in the disturbed site compared to the control site. These taxa have a high adaptive capacity. Regarding temporarily attached macroinvertebrates, the lowest CWM trait value was observed in the control site in summer, significantly lower than both control and disturbed sites in autumn.
The study further elucidated variations in CWM trait values for different feeding groups. Deposit feeders and shredders, according to other studies such as [65], exhibited seasonal variations, with significantly lower and higher CWM values, respectively, in the disturbed site during summer compared to the control site in autumn. Scraper-associated trait values were consistently higher in the control site: this group was mainly represented by Heptageniidae, a family of mayflies considered to be sensitive to habitat quality [66]. Filter feeders displayed seasonal rather than site-specific differences. Despite their relatively small proportion in benthic communities, predator piercers’ CWM values were consistently higher in the control site.
In the transversal (i.e., river bank, channel, side arm, etc.) distribution category, significant differences were observed for four out of seven traits. Macroinvertebrate taxa preferring river channels had significantly higher CWM trait values in the control site, while taxa associated with ponds, pools and disconnected arms displayed higher CWM values in the disturbed site, with statistical differences evident in summer [67]. Interestingly, macroinvertebrates related to groundwater displayed higher CWM values in the disturbed site. Considering water velocity preferences, significant differences were identified only for macroinvertebrates associated with medium and fast velocity.
The Correspondence Analysis provided a visual representation of the separation of sampling sites based on functional traits and seasonal dynamics. The control site displayed a community composition dominated by piercers, water swimmers, scrapers and plurivoltine taxa, while the disturbed site exhibited a contrasting pattern, with macroinvertebrate communities mainly composed of surface swimmers, predators and taxa associated with ponds/pools/disconnected arms.
It is important to recognise that some responses, particularly those related to functional traits, may manifest over longer time scales. Therefore, observed changes should be considered as part of an ongoing dynamic process, with the potential for further adjustments in pursuit of a new equilibrium adapted to human-regulated conditions [68].
5. Conclusions
The observed taxonomic composition and abundance of macroinvertebrates provide crucial insights into the ecological consequences of human-induced flow alterations. Functional richness showed seasonal variation, following the dynamic nature of ecosystem response to changing environmental conditions. In particular, the greatest impacts (as evidenced by the comparison between control and disturbed sites) were recorded in summer, when Apennine lotic systems are more fragile because naturally experience low flow conditions and high temperatures. Correspondence Analysis visually represented the segregation of sampling sites based on functional traits, with distinct seasonal patterns. In general, our results are consistent with the notion that functional traits can provide a more integrative perspective on ecosystem responses than taxonomic composition alone. The observed patterns in functional traits and community composition highlight the complexity of hydrological changes in river ecosystems.
So far, data on the effects of hydrological variations have been limited to alpine rivers or in any case to rivers flowing in high- to medium-altitude mountain areas. To the best of our knowledge, this is one of the few studies realised outside this context, as it was carried out in an Apennine area where the environmental conditions are less severe, the water supply is exclusively pluvial and the macrobenthic communities are generally very rich and diversified. In conclusion, this study highlights the multiple effects of hydrological regulation on macroinvertebrate communities in river ecosystems. By integrating taxonomic and functional approaches, we gain a more comprehensive understanding of how dams affect aquatic biodiversity and ecological functions. These findings help to implement informed conservation and management strategies and highlight the need for long-term assessments to capture the full range of ecosystem responses to human-induced hydrological changes.
Supplementary Materials
The following supporting information can be downloaded at: https://www.mdpi.com/article/10.3390/w16070989/s1, Figure S1: Taxa accumulation curves.
Author Contributions
Conceptualization, T.B.; methodology, T.B.; formal analysis, A.M.; writing—original draft preparation, T.B., A.M., F.B. and S.F.; writing—review and editing, T.B., A.M., F.B. and S.F.; supervision, T.B., F.B. and S.F.; funding acquisition, A.M. and F.B. All authors have read and agreed to the published version of the manuscript.
Funding
This research was partly funded by the Italian Ministry of Universities and Research, (MUR) which awarded Anna Marino a PhD scholarship.
Data Availability Statement
The data presented in this study are openly available in Zenodo. https://doi.org/10.5281/zenodo.10889644.
Conflicts of Interest
The authors declare no conflicts of interest. The funders had no role in the design of the study; in the collection, analyses, or interpretation of data; in the writing of the manuscript or in the decision to publish the results.
References
- Gracey, E.O.; Verones, F. Impacts from hydropower production on biodiversity in an LCA framework—Review and recommendations. Int. J. LCA 2016, 21, 412–428. [Google Scholar] [CrossRef]
- Wolf, S.; Esser, V.; Schüttrumpf, H.; Lehmkuhl, F. Influence of 200 years of water resource management on a typical central European river. Does industrialization straighten a river? Environ. Sci. Eur. 2021, 33, 15. [Google Scholar] [CrossRef]
- Allan, J.D.; Castillo, M.M.; Capps, K.A. Stream Ecology: Structure and Function of Running Waters, 3rd ed.; Springer Nature: Dordrecht, The Netherlands, 2021; p. 485. [Google Scholar]
- Meybeck, M. River water quality global ranges, time and space variabilities, proposal for some redefinitions. Int. Ver. Theor. Angew. Limnol. Verh. 1996, 26, 81–96. [Google Scholar] [CrossRef]
- Dudgeon, D. Multiple threats imperil freshwater biodiversity in the Anthropocene. Curr. Biol. 2019, 29, R960–R967. [Google Scholar] [CrossRef] [PubMed]
- Lorenz, A.; Hering, D.; Feld, C.K.; Rolauffs, P. A new method for assessing the impact of hydromorphological degradation on the macroinvertebrate fauna of five German stream types. Hydrobiologia 2004, 516, 107–127. [Google Scholar] [CrossRef]
- Sabater, S.; Tockner, K. Effects of hydrologic alterations on the ecological quality of river ecosystems. In Water Scarcity in the Mediterranean. Perspectives Under Global Change; Sabater, S., Marcelo, D., Eds.; Springer: Berlin/Heidelberg, Germany, 2010; pp. 15–39. [Google Scholar]
- Aquiloni, L.; Martín, M.P.; Gherardi, F.; Diéguez-Uribeondo, J. The North American crayfish Procambarus clarkii is the carrier of the oomycete Aphanomyces astaci in Italy. Biol. Invasions 2011, 13, 359–367. [Google Scholar] [CrossRef]
- Bo, T.; Fenoglio, S. Impacts of a micro-sewage effluent on the biota of a small Apennine creek. J. Freshw. Ecol. 2011, 4, 537–545. [Google Scholar] [CrossRef]
- Roberts, J.J.; Fausch, K.D.; Peterson, D.P.; Hooten, M.B. Fragmentation and thermal risks from climate change interact to affect persistence of native trout in the Colorado River basin. Glob. Chang. Biol. 2013, 19, 1383–1398. [Google Scholar] [CrossRef] [PubMed]
- Guareschi, S.; Laini, A.; Racchetti, E.; Bo, T.; Fenoglio, S.; Bartoli, M. How do hydromorphological constraints and regulated flows govern macroinvertebrate communities along an entire lowland river? Ecohydrology 2014, 7, 366–377. [Google Scholar] [CrossRef]
- Dewson, Z.S.; James, A.B.; Death, R.G. A review of the consequences of decreased flow for instream habitat and macroinvertebrates. J. N. Am. Benthol. Soc. 2007, 26, 401–415. [Google Scholar] [CrossRef]
- Carolli, M.; Vanzo, D.; Siviglia, A.; Zolezzi, G.; Bruno, M.C.; Alfredsen, K. A simple procedure for the assessment of hydropeaking flow alterations applied to several European streams. Aquat. Sci. 2015, 77, 639–653. [Google Scholar] [CrossRef]
- Doretto, A.; Bo, T.; Bona, F.; Apostolo, M.; Bonetto, D.; Fenoglio, S. Effectiveness of artificial floods for benthic community recovery after sediment flushing from a dam. Environ. Monit. Assess 2019, 191, 88. [Google Scholar] [CrossRef] [PubMed]
- Bruno, M.C.; Doretto, A.; Boano, F.; Ridolfi, L.; Fenoglio, S. Role of the hyporheic zone in increasing the resilience of mountain streams progressively shifting from naturally perennial to intermittent systems. Water 2020, 12, 2034. [Google Scholar] [CrossRef]
- Bruno, M.C.; Vallefuoco, F.; Casari, A.; Larsen, S.; Dallafior, V.; Zolezzi, G. Moving waters to mitigate hydropeaking: A case study from the Italian Alps. River. Res. Appl. 2023, 39, 570–587. [Google Scholar] [CrossRef]
- Reindl, R.; Neuner, J.; Schletterer, M. Increased hydropower production and hydropeaking mitigation along the upper Inn River (Tyrol, Austria) with a combination of buffer reservoirs, diversion hydropower plants and retention basins. River Res. Appl. 2023, 39, 602–609. [Google Scholar] [CrossRef]
- Bipa, N.J.; Stradiotti, G.; Righetti, M.; Pisaturo, G.R. Impacts of hydropeaking: A systematic review. Sci. Total Environ. 2023, 912, 169251. [Google Scholar] [CrossRef] [PubMed]
- Leitner, P.; Borgwardt, F.; Birk, S.; Graf, W. Multiple stressor effects on benthic macroinvertebrates in very large European rivers–A typology-based evaluation of faunal responses as a basis for future bioassessment. Sci. Total Environ. 2021, 756, 143472. [Google Scholar] [CrossRef] [PubMed]
- Quadroni, S.; Salmaso, F.; Gentili, G.; Crosa, G.; Espa, P. Response of benthic macroinvertebrates to different hydropower off-stream diversion schemes. Ecohydrology 2021, 14, e2267. [Google Scholar] [CrossRef]
- Salmaso, F.; Servanzi, L.; Crosa, G.; Quadroni, S.; Espa, P. Assessing the impacts of hydropeaking on river benthic macroinvertebrates: A state-of-the-art methodological overview. Environments 2021, 8, 67. [Google Scholar] [CrossRef]
- Schülting, L.; Dossi, F.; Graf, W.; Tonolla, D. Flow amplitude or up-ramping rate? Quantifying single and combined effects on macroinvertebrate drift during hydropeaking simulations, considering sensitive traits. River Res. Appl. 2023, 39, 412–426. [Google Scholar] [CrossRef]
- Smokorowski, K.E. The ups and downs of hydropeaking: A Canadian perspective on the need for, and ecological costs of, peaking hydropower production. Hydrobiologia 2022, 849, 421–441. [Google Scholar] [CrossRef]
- Tonolla, D.; Dossi, F.; Kastenhofer, O.; Doering, M.; Hauer, C.; Graf, W.; Schülting, L. Effects of hydropeaking on drift, stranding and community composition of macroinvertebrates: A field experimental approach in three regulated Swiss rivers. River Res. Appl. 2023, 39, 427–443. [Google Scholar] [CrossRef]
- Tiemann, J.S.; Gillette, D.P.; Wildhaber, M.L.; Edds, D.R. Effects of lowhead dams on riffle-dwelling fishes and macroinvertebrates in a midwestern river. Trans. Am. Fish. Soc. 2004, 133, 705–717. [Google Scholar] [CrossRef]
- Carter, J.L.; Resh, V.H.; Hannaford, M.J. Macroinvertebrates as Biotic Indicators of Environmental Quality. In Methods in Stream Ecology, 3rd ed.; Academic Press: London, UK, 2017; pp. 293–318. [Google Scholar]
- Woodcock, T.S.; Huryn, A.D. The response of macroinvertebrate production to a pollution gradient in a headwater stream. Freshw. Biol. 2007, 52, 177–196. [Google Scholar] [CrossRef]
- Erba, S.; Cazzola, M.; Belfiore, C.; Buffagni, A. Macroinvertebrate metrics responses to morphological alteration in Italian rivers. Hydrobiologia 2020, 847, 2169–2191. [Google Scholar] [CrossRef]
- Verberk, W.C.; Siepel, H.; Esselink, H. Life-history strategies in freshwater macroinvertebrates. Freshw. Biol. 2008, 53, 1722–1738. [Google Scholar] [CrossRef]
- Merritt, R.W.; Cummins, K.W.; Berg, M.B. Trophic relationships of macroinvertebrates. In Methods in Stream Ecology; Academic Press: Cambridge, MA, USA, 2017; Volume 1, pp. 413–433. [Google Scholar]
- Townsend, C.R.; Hildrew, A.G. Species traits in relation to habitat templet for river systems. Freshw. Biol. 1994, 31, 265–275. [Google Scholar] [CrossRef]
- Statzner, B.; Hildrew, A.G.; Resh, V.H. Species traits and environmental constraints: Entomological research and the history of ecological theory. Annu. Rev. Entomol. 2001, 46, 291–316. [Google Scholar] [CrossRef] [PubMed]
- Cummins, K.W. Invertebrates. In Rivers Handbook; Blackwell Scientific: Oxford, UK, 1995; pp. 234–250. [Google Scholar]
- Englund, G.; Malmqvist, B. Effects of flow regulations, habitat area and isolation on the macroinvertebrates fauna of rapids in north Swedish Rivers. River Res. Appl. 1996, 12, 433–445. [Google Scholar] [CrossRef]
- Fleituch, T. Structure and functional Organization of benthic Invertebrates in a Regulated Stream. Int. Rev. Hydrobiol. 2003, 88, 332–344. [Google Scholar] [CrossRef]
- Merritt, R.W.; Fenoglio, S.; Cummins, K.W. Promoting a functional macroinvertebrate approach in the biomonitoring of Italian lotic systems. J. Limnol. 2017, 76, 5–8. [Google Scholar] [CrossRef]
- Minshall, G.W.; Thomas, S.A.; Newbold, J.D.; Monaghan, M.T.; Cushing, C.E. Physical factors influencing fine organic particle transport and deposition in streams. J. N. Am. Benthol. Soc. 2000, 19, 1–16. [Google Scholar] [CrossRef]
- Bo, T.; Cammarata, M.; López-Rodríguez, M.J.; De Figueroa, J.M.T.; Baltieri, M.; Varese, P.; Fenoglio, S. The influence of water quality and macroinvertebrate colonization on the breakdown process of native and exotic leaf types in sub-alpine stream. J. Freshw. Ecol. 2014, 29, 159–169. [Google Scholar] [CrossRef]
- Erdozain, M.; Kidd, K.; Kreutzweiser, D.; Sibley, P. Increased reliance of stream macroinvertebrates on terrestrial food sources linked to forest management intensity. Ecol. Appl. 2019, 29, e01889. [Google Scholar] [CrossRef]
- Vallania, A.; Corigliano, M.D.C. The effect of regulation caused by a dam on the distribution of the functional feeding groups of the benthos in the sub basin of the Grande River (San Luis, Argentina). Environ. Monit. Assess. 2007, 124, 201–209. [Google Scholar] [CrossRef]
- Cereghino, R.; Cugny, P.; Lavandier, P. Influence of intermittent hydropeaking on the longitudinal zonation patterns of benthic invertebrates in a mountain stream. Int. Rev. Hydrobiol. 2002, 87, 47–60. [Google Scholar] [CrossRef]
- Meile, T.; Boillat, J.L.; Schleiss, A. Hydropeaking indicators for characterization of the upper-rhone river in Switzerland. Aquat. Sci. 2011, 73, 171–182. [Google Scholar] [CrossRef]
- Bo, T.; Cammarata, M.; Candiotto, A.; Fenoglio, S.; López-Rodríguez, M.J.; Tierno de Figueroa, J.M.; Malacarne, G. Feeding habits of Padogobius bonelli (Bonaparte, 1846) (Osteichthyes, Gobiidae): The importance of fish dimensions and hydrological conditions. Ital. J. Zool. 2011, 78, 390–397. [Google Scholar] [CrossRef]
- Fenoglio, S.; Bo, T.; Cammarata, M.; López-Rodríguez, M.J.; Tierno De Figueroa, J.M. Seasonal variation of allochthonous and autochthonous energy inputs in an alpine stream. J. Limnol. 2015, 74, 272–277. [Google Scholar] [CrossRef]
- Campaioli, S.; Ghetti, P.F.; Minelli, A.; Ruffo, S. Manuale per il Riconoscimento dei Macroinvertebrati Delle Acque Dolci Italiane (Vol. I); Museo di Storia Naturale di Trento: Trento, Italy, 1994; p. 357. [Google Scholar]
- Campaioli, S.; Ghetti, P.F.; Minelli, A.; Ruffo, S. Manuale per il Riconoscimento dei Macroinvertebrati Delle Acque Dolci Italiane (Vol. II); Museo di Storia Naturale di Trento: Trento, Italy, 1994; p. 120. [Google Scholar]
- Tachet, H.; Bournaud, M.; Richoux, P.; Usseglio-Polatera, P. Invertébrés d’Eau Douce: Systématique, Biologie, Écologie; CNRS Editions: Paris, France, 2002; p. 588. [Google Scholar]
- Villéger, S.; Mason, N.W.; Mouillot, D. New multidimensional functional diversity indices for a multifaceted framework in functional ecology. Ecology 2008, 89, 2290–2301. [Google Scholar] [CrossRef]
- Laliberté, E.; Legendre, P. A distance-based framework for measuring functional diversity from multiple traits. Ecology 2010, 91, 299–305. [Google Scholar] [CrossRef] [PubMed]
- Garnier, E.; Cortez, J.; Billès, G.; Navas, M.-L.; Roumet, C.; Debussche, M.; Laurent, G.; Blanchard, A.; Aubry, D.; Bellmann, A.; et al. Plant functional markers capture ecosystem properties during secondary succession. Ecology 2004, 85, 2630–2637. [Google Scholar] [CrossRef]
- R Core Team. R: A Language and Environment for Statistical Computing; R Foundation for Statistical Computing: Vienna, Austria, 2021. [Google Scholar]
- Laliberté, E.; Legendre, P.; Shipley, B.; Laliberté, M.E. Package ‘FD’. Measuring Functional Diversity from Multiple Traits, and Other Tools for Functional Ecology; R Package Version 1.0-12. 2014. Available online: https://CRAN.R-project.org/package=FD (accessed on 1 October 2023).
- Oksanen, J.; Blanchet, F.G.; Kindt, R.; Legendre, P.; Minchin, P.R.; O’Hara, R.B.; Simpson, G.L.; Solymos, P.; Stevens, M.H.; Wagner, H. Vegan: Community Ecology Package, R Package Version 2.2-1. 2015. Available online: http://CRAN.Rproject.org/package=vegan (accessed on 1 October 2023).
- Dray, S.; Siberchicot, M.A. Package ‘ade4’; Université de Lyon: Lyon, France, 2020. [Google Scholar]
- Reid, A.J.; Carlson, A.K.; Creed, I.F.; Eliason, E.J.; Gell, P.A.; Johnson, P.T.J.; Kidd, K.A.; MacCormack, T.J.; Olden, J.D.; Ormerod, S.J.; et al. Emerging threats and persistent conservation challenges for freshwater biodiversity. Biol. Rev. 2019, 94, 849–873. [Google Scholar] [CrossRef] [PubMed]
- Takao, A.; Kawaguchi, Y.; Minagawa, T.; Kayaba, Y.; Morimoto, Y. The relationships between benthic macroinvertebrates and biotic and abiotic environmental characteristics downstream of the Yahagi dam, central Japan, and the state change caused by inflow from a tributary. River. Res. Applic. 2008, 24, 580–597. [Google Scholar] [CrossRef]
- Laini, A.; Viaroli, P.; Bolpagni, R.; Cancellario, T.; Racchetti, E.; Guareschi, S. Taxonomic and functional responses of benthic macroinvertebrate communities to hydrological and water quality variations in a heavily regulated river. Water 2019, 11, 1478. [Google Scholar] [CrossRef]
- Fornaroli, R.; White, J.C.; Boggero, A.; Laini, A. Spatial and temporal patterns of macroinvertebrate assemblages in the River Po Catchment (Northern Italy). Water 2020, 12, 2452. [Google Scholar] [CrossRef]
- Ding, N.; Yang, W.; Zhou, Y.; Gonzalez-Bergonzoni, I.; Zhang, J.; Chen, K.; Vidal, N.; Jeppesen, E.; Liu, Z.; Wang, B. Different responses of functional traits and diversity of stream macroinvertebrates to environmental and spatial factors in the Xishuangbanna watershed of the upper Mekong River Basin, China. Sci. Total Environ. 2017, 574, 288–299. [Google Scholar] [CrossRef] [PubMed]
- Chen, K.; Rajper, A.R.; Hughes, R.M.; Olson, J.R.; Wei, H.; Wang, B. Incorporating functional traits to enhance multimetric index performance and assess land use gradients. Sci. Total Environ. 2019, 691, 1005–1015. [Google Scholar] [CrossRef]
- Mason, N.W.H.; Mouillot, D.; Lee, W.G.; Wilson, J.B. Functional richness, functional evenness and functional divergence: The primary components of functional diversity. Oikos 2005, 111, 112–118. [Google Scholar] [CrossRef]
- Leiva, M.; Marchese, M.; Lorenz, G.; Diodato, L. Functional diversity of benthic macroinvertebrates regarding hydrological and land use disturbances in a heavily impaired lowland river. Limnologica 2022, 92, 125940. [Google Scholar] [CrossRef]
- Usseglio-Polatera, P.; Bournaud, P.M.; Richoux, H. Tachet. Biological and ecological traits of benthic freshwater macroinvertebrates: Relationships and definition of groups with similar traits. Freshw. Biol. 2000, 43, 175–205. [Google Scholar] [CrossRef]
- Mouillot, S.; Spatharis, S.; Reizopoulou, T.; Laugier, L.; Sabetta, A.; Basset, T.; Chi, T. Alternatives to taxonomic-based approaches to assess changes in transitional water communities. Aquat. Conserv. Mar. Freshw. Ecosyst. 2006, 16, 469–482. [Google Scholar] [CrossRef]
- Rabení, C.F.; Doisy, K.E.; Zweig, L.D. Stream invertebrate community functional responses to deposited sediment. Aquat. Sci. 2005, 67, 395–402. [Google Scholar] [CrossRef]
- Yap, N.I.R.; Kamarudin, K.R.; Rehan, A.M.; Badrulhisham, N.S.; Zakaria, M.Z.; Kemalok, J. Aquatic Insects as Bio-Indicators of Water Quality–A Study on Sungai Kawal, Johor National Park of Endau-Rompin, Peninsular Malaysia. In IOP Conference Series: Earth and Environmental Science; IOP Publishing: Bristol, UK, 2021; Volume 736, No. 2, p. 012072. [Google Scholar]
- Céréghino, R.; Oertli, B.; Bazzanti, M.; Coccia, C.; Compin, A.; Biggs, J.; Bressi, N.; Grillas, P.; Hull, A.; Kalettka, T.; et al. Biological traits of European pond macroinvertebrates. Hydrobiologia 2012, 689, 51–61. [Google Scholar] [CrossRef]
- Owusu, A.; Mul, M.; Strauch, M.; van der Zaag, P.; Volk, M.; Slinger, J. The clam and the dam: A Bayesian belief network approach to environmental flow assessment in a data scarce region. Sci. Total Environ. 2022, 810, 151315. [Google Scholar] [CrossRef]
Figure 1.
Location of sampling sites (S1 in Marciazza, S2 in Cerreto) and of the tailrace.
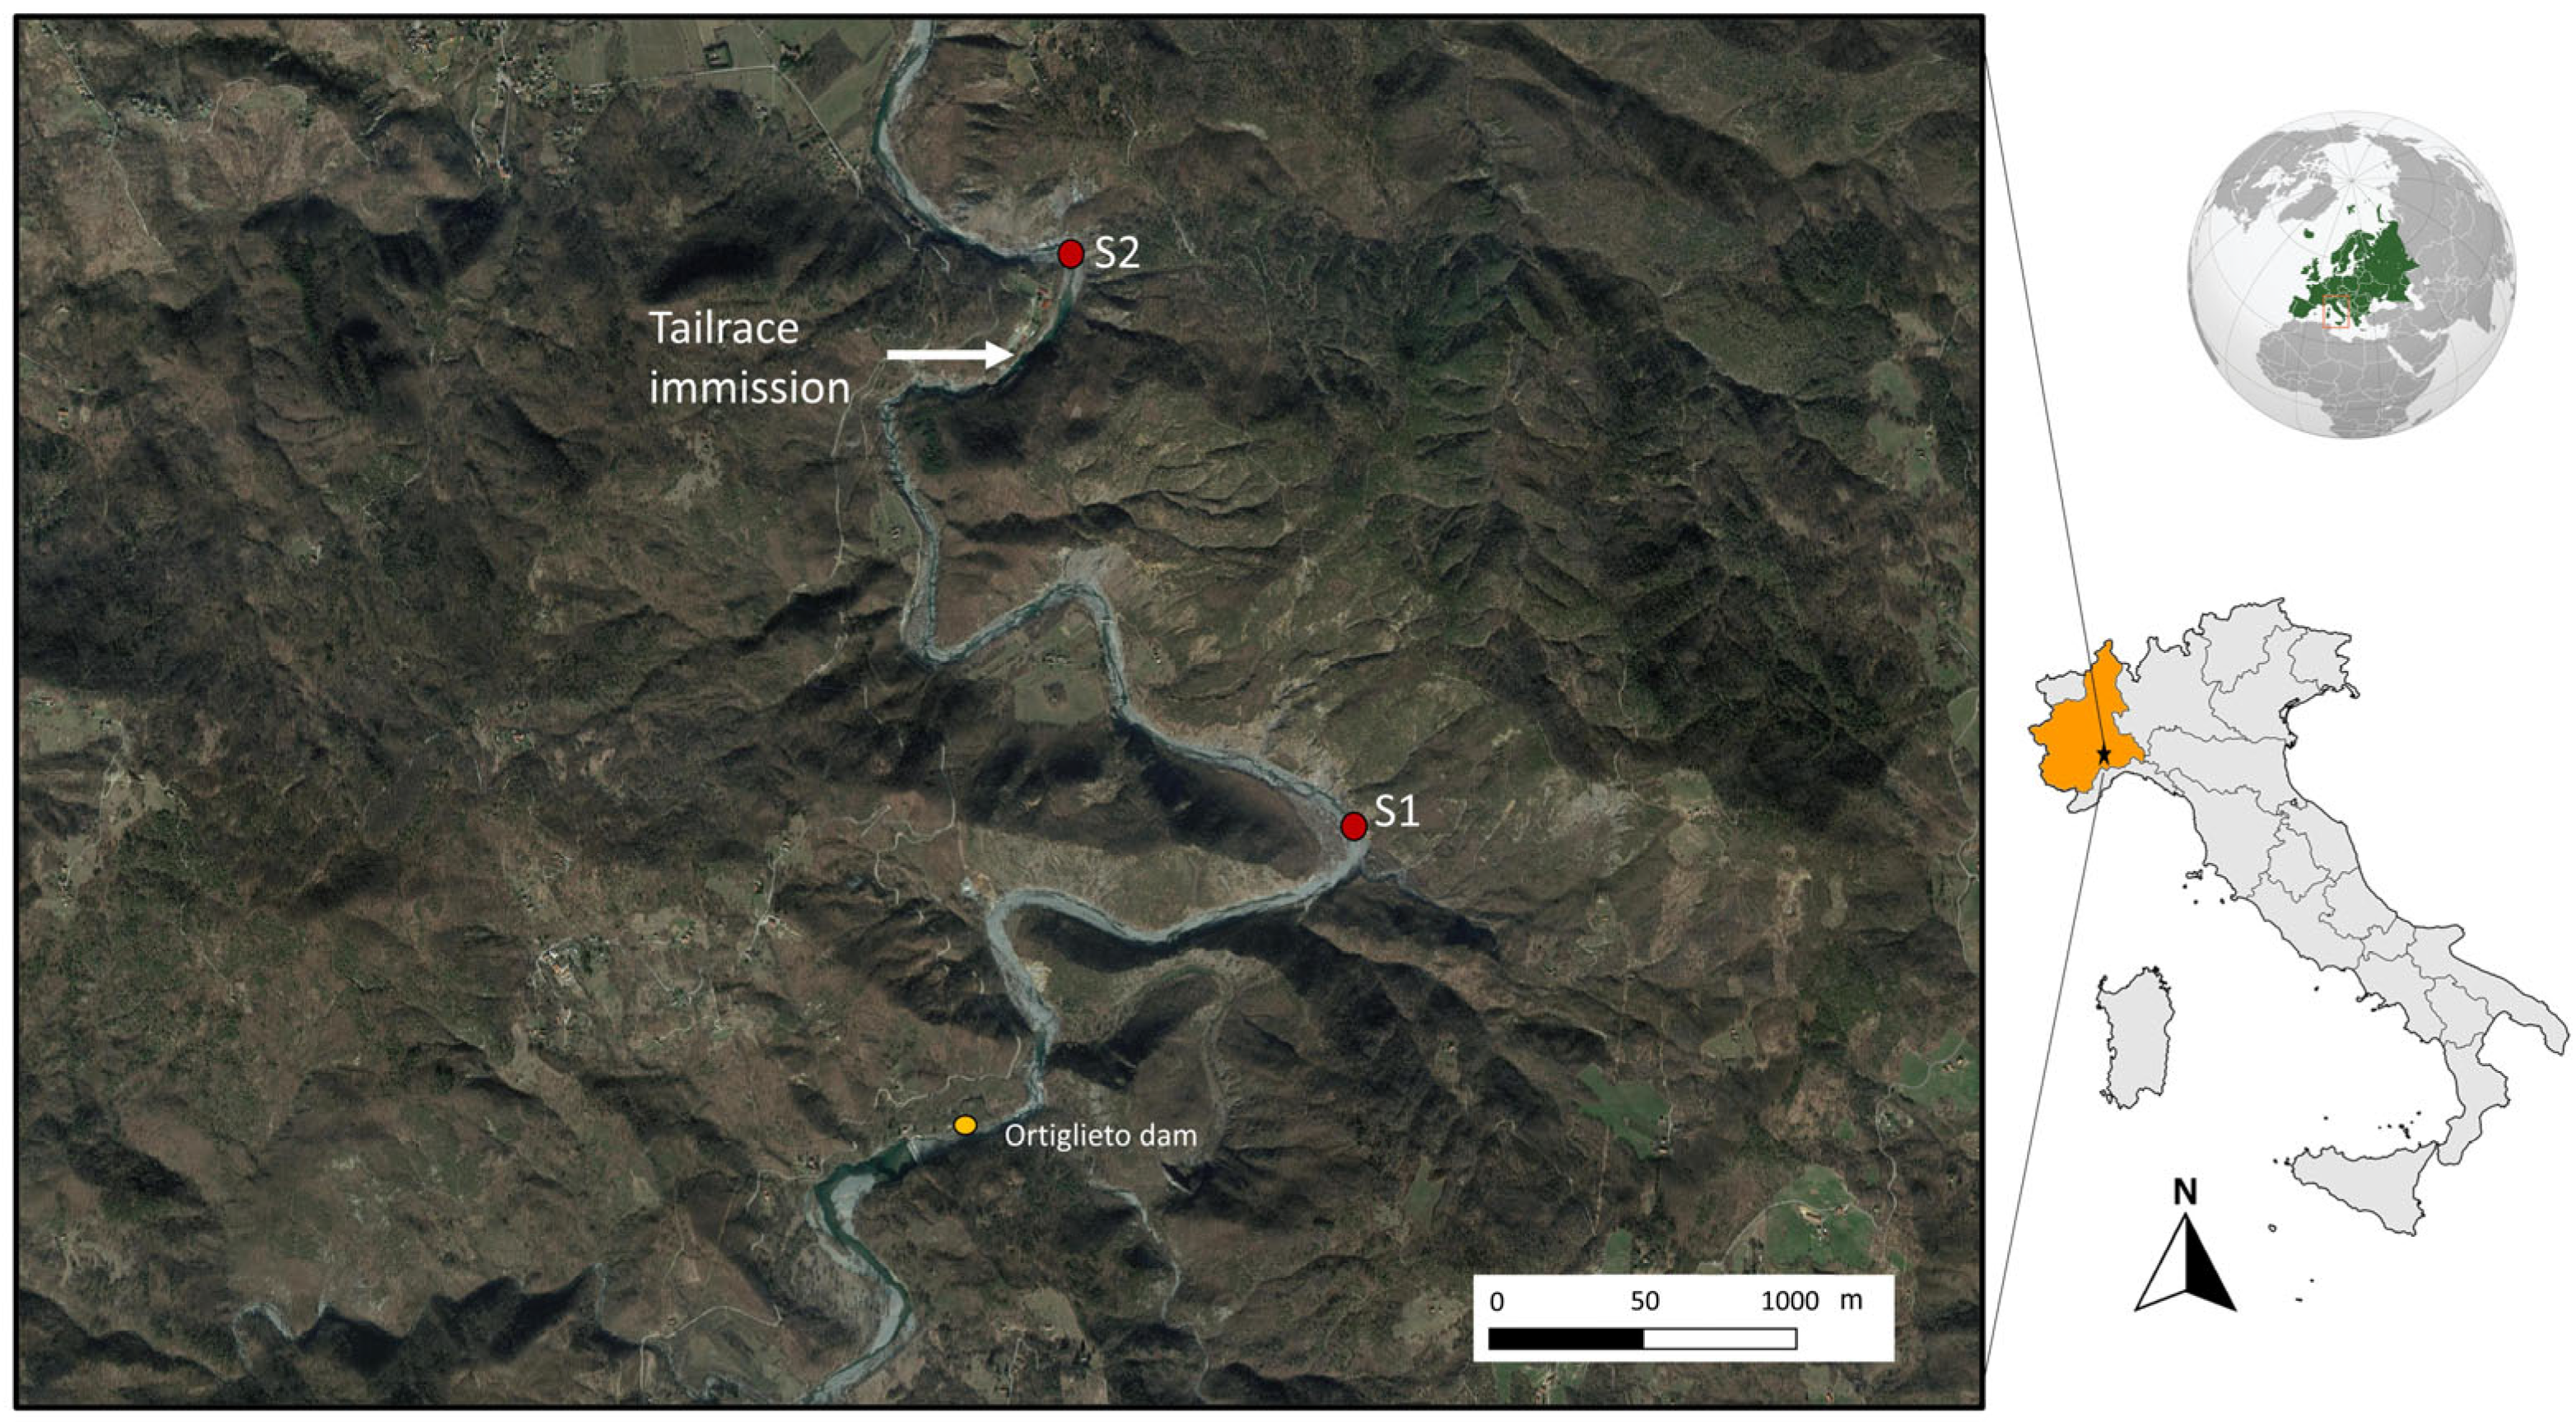
Figure 2.
NMDS ordination plot of benthic macroinvertebrate communities according to the first two NMDS axes (dotted lines). Symbols indicate the sampling season (i.e., autumn, summer), while colours indicate the sampling site (i.e., control, disturbed).
Figure 2.
NMDS ordination plot of benthic macroinvertebrate communities according to the first two NMDS axes (dotted lines). Symbols indicate the sampling season (i.e., autumn, summer), while colours indicate the sampling site (i.e., control, disturbed).
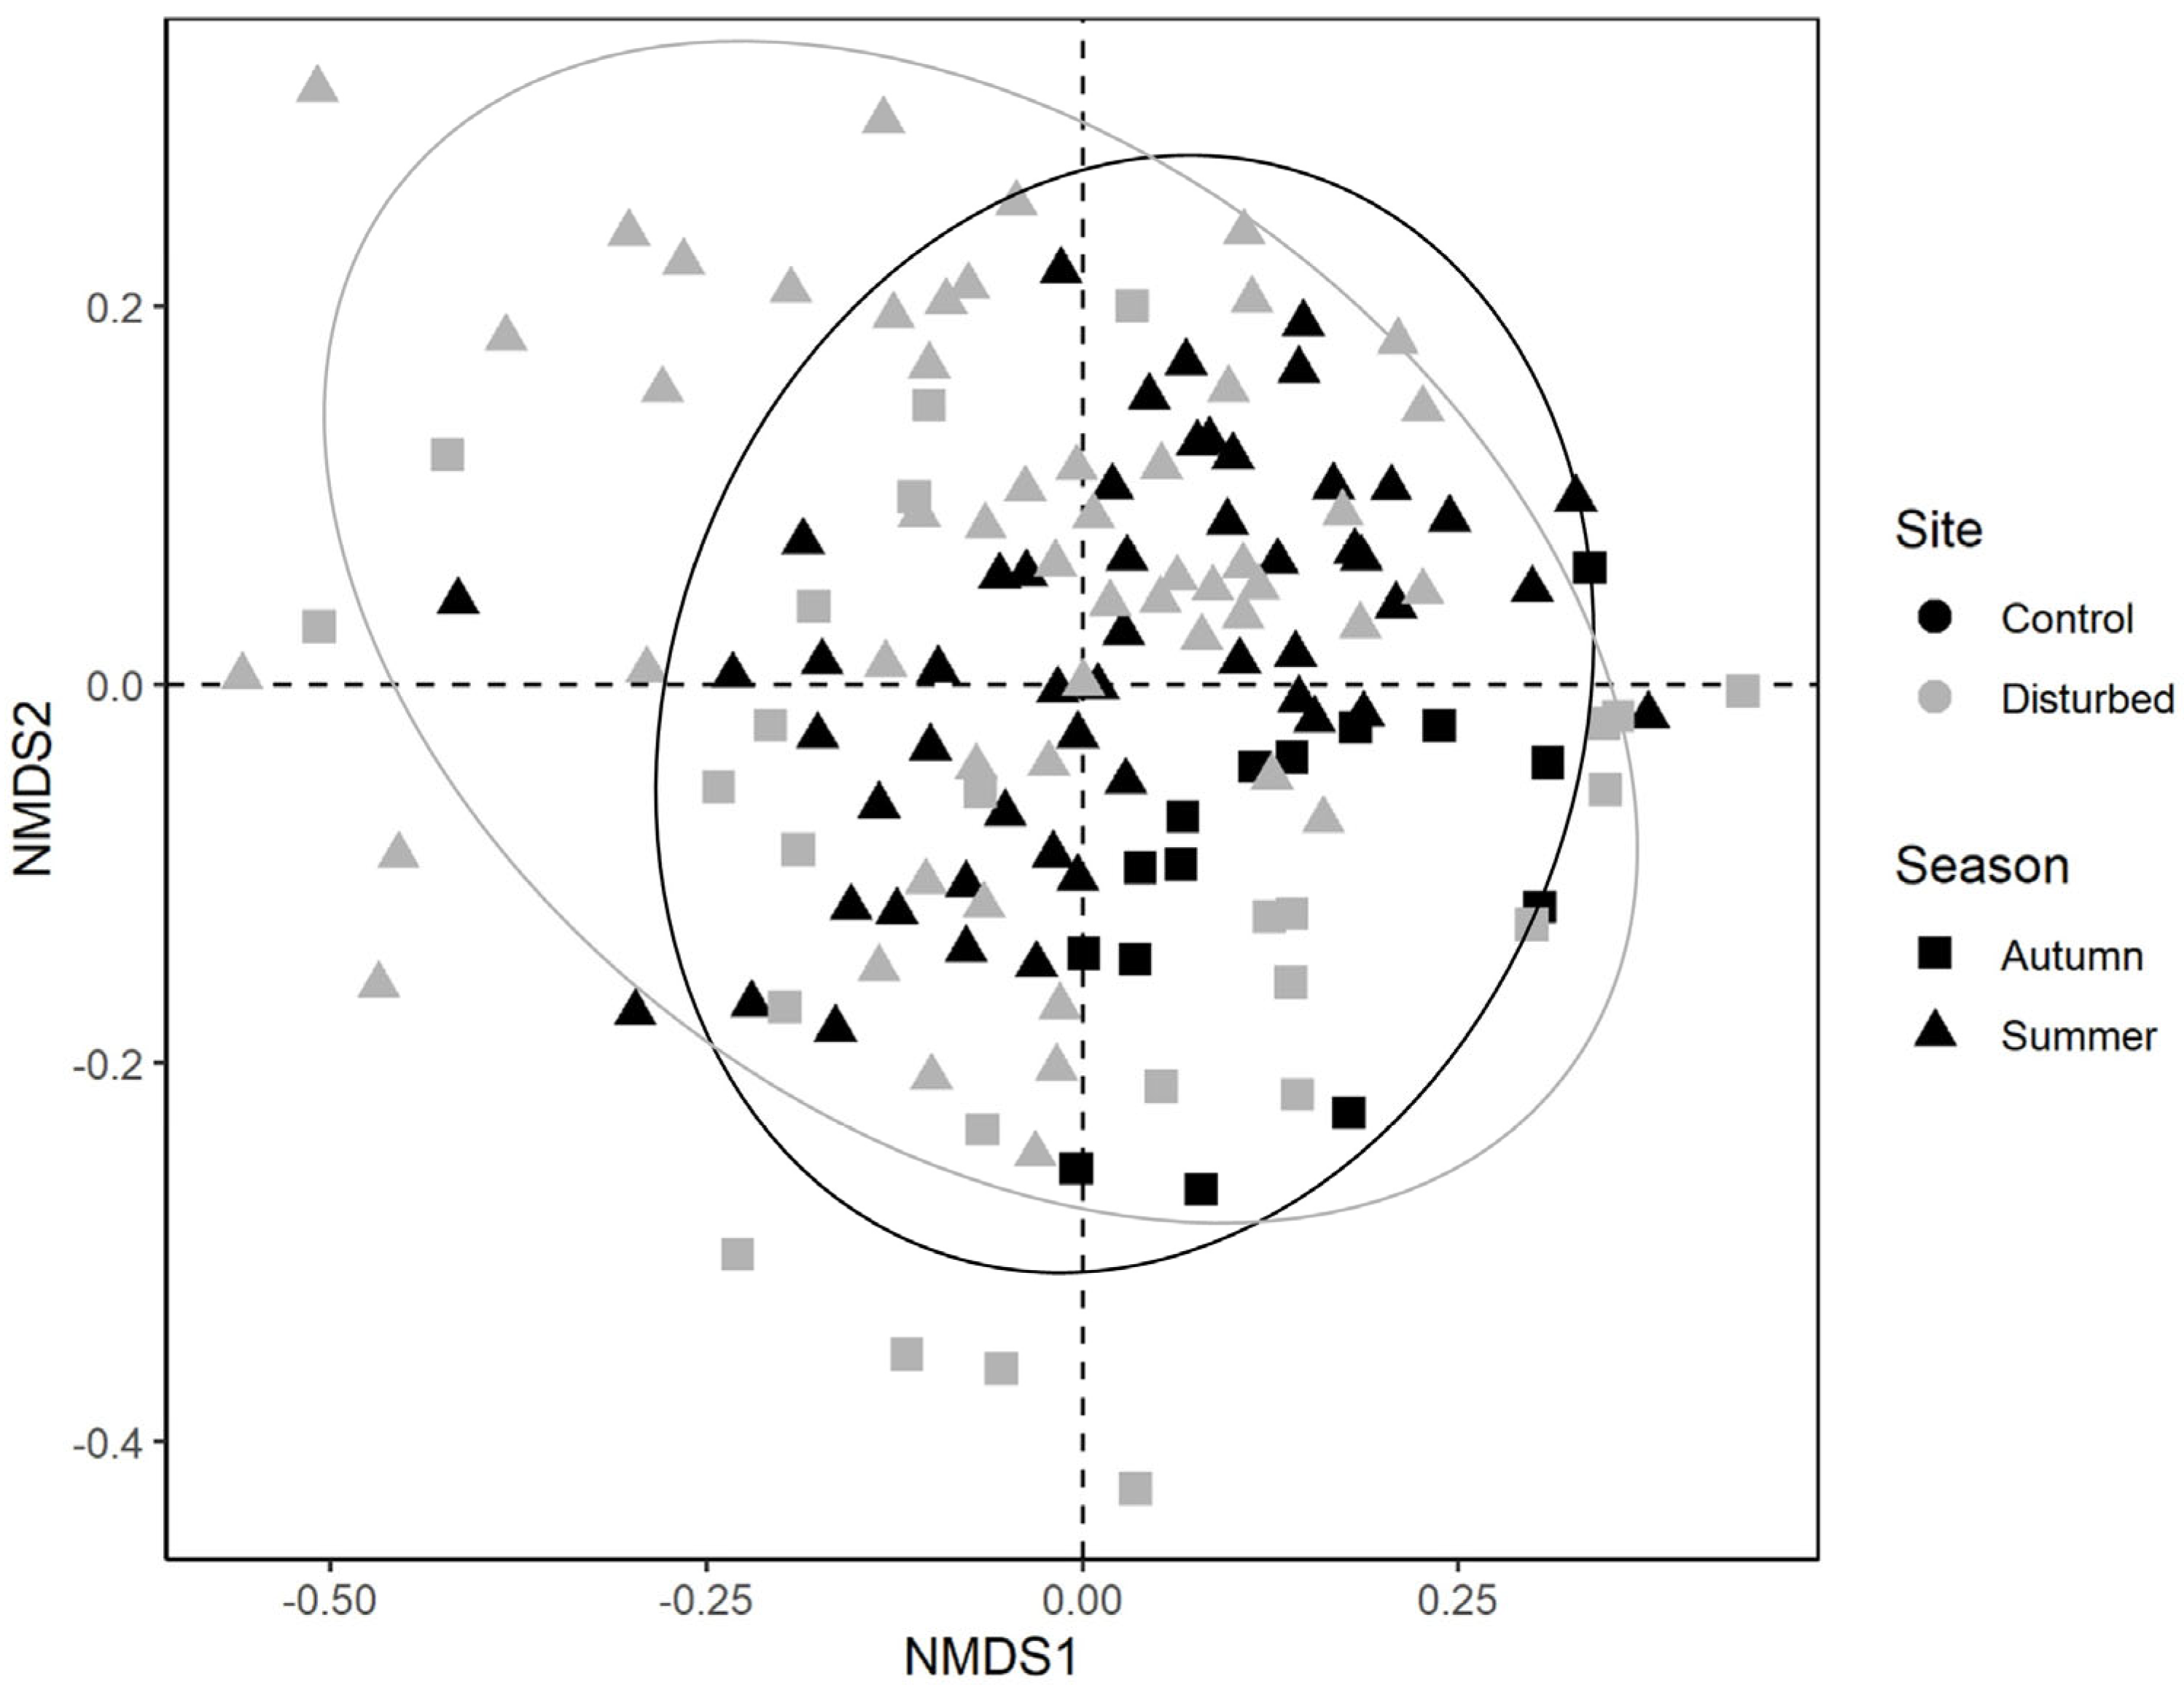
Figure 3.
Boxplots illustrate the variation in: (a) total taxa richness, (b) total abundance of macroinvertebrates, (c) functional richness, (d) functional evenness and (e) functional dispersion between sites (control and disturbed) and seasons (autumn and summer). The black line indicates the median value, while lower and upper box edges indicate the first and third quartiles, respectively. Vertical lines represent ± 1.5 interquartile distances, while dots represent observations that fall outside this range. Letters above boxes indicate significant differences based on pairwise comparisons.
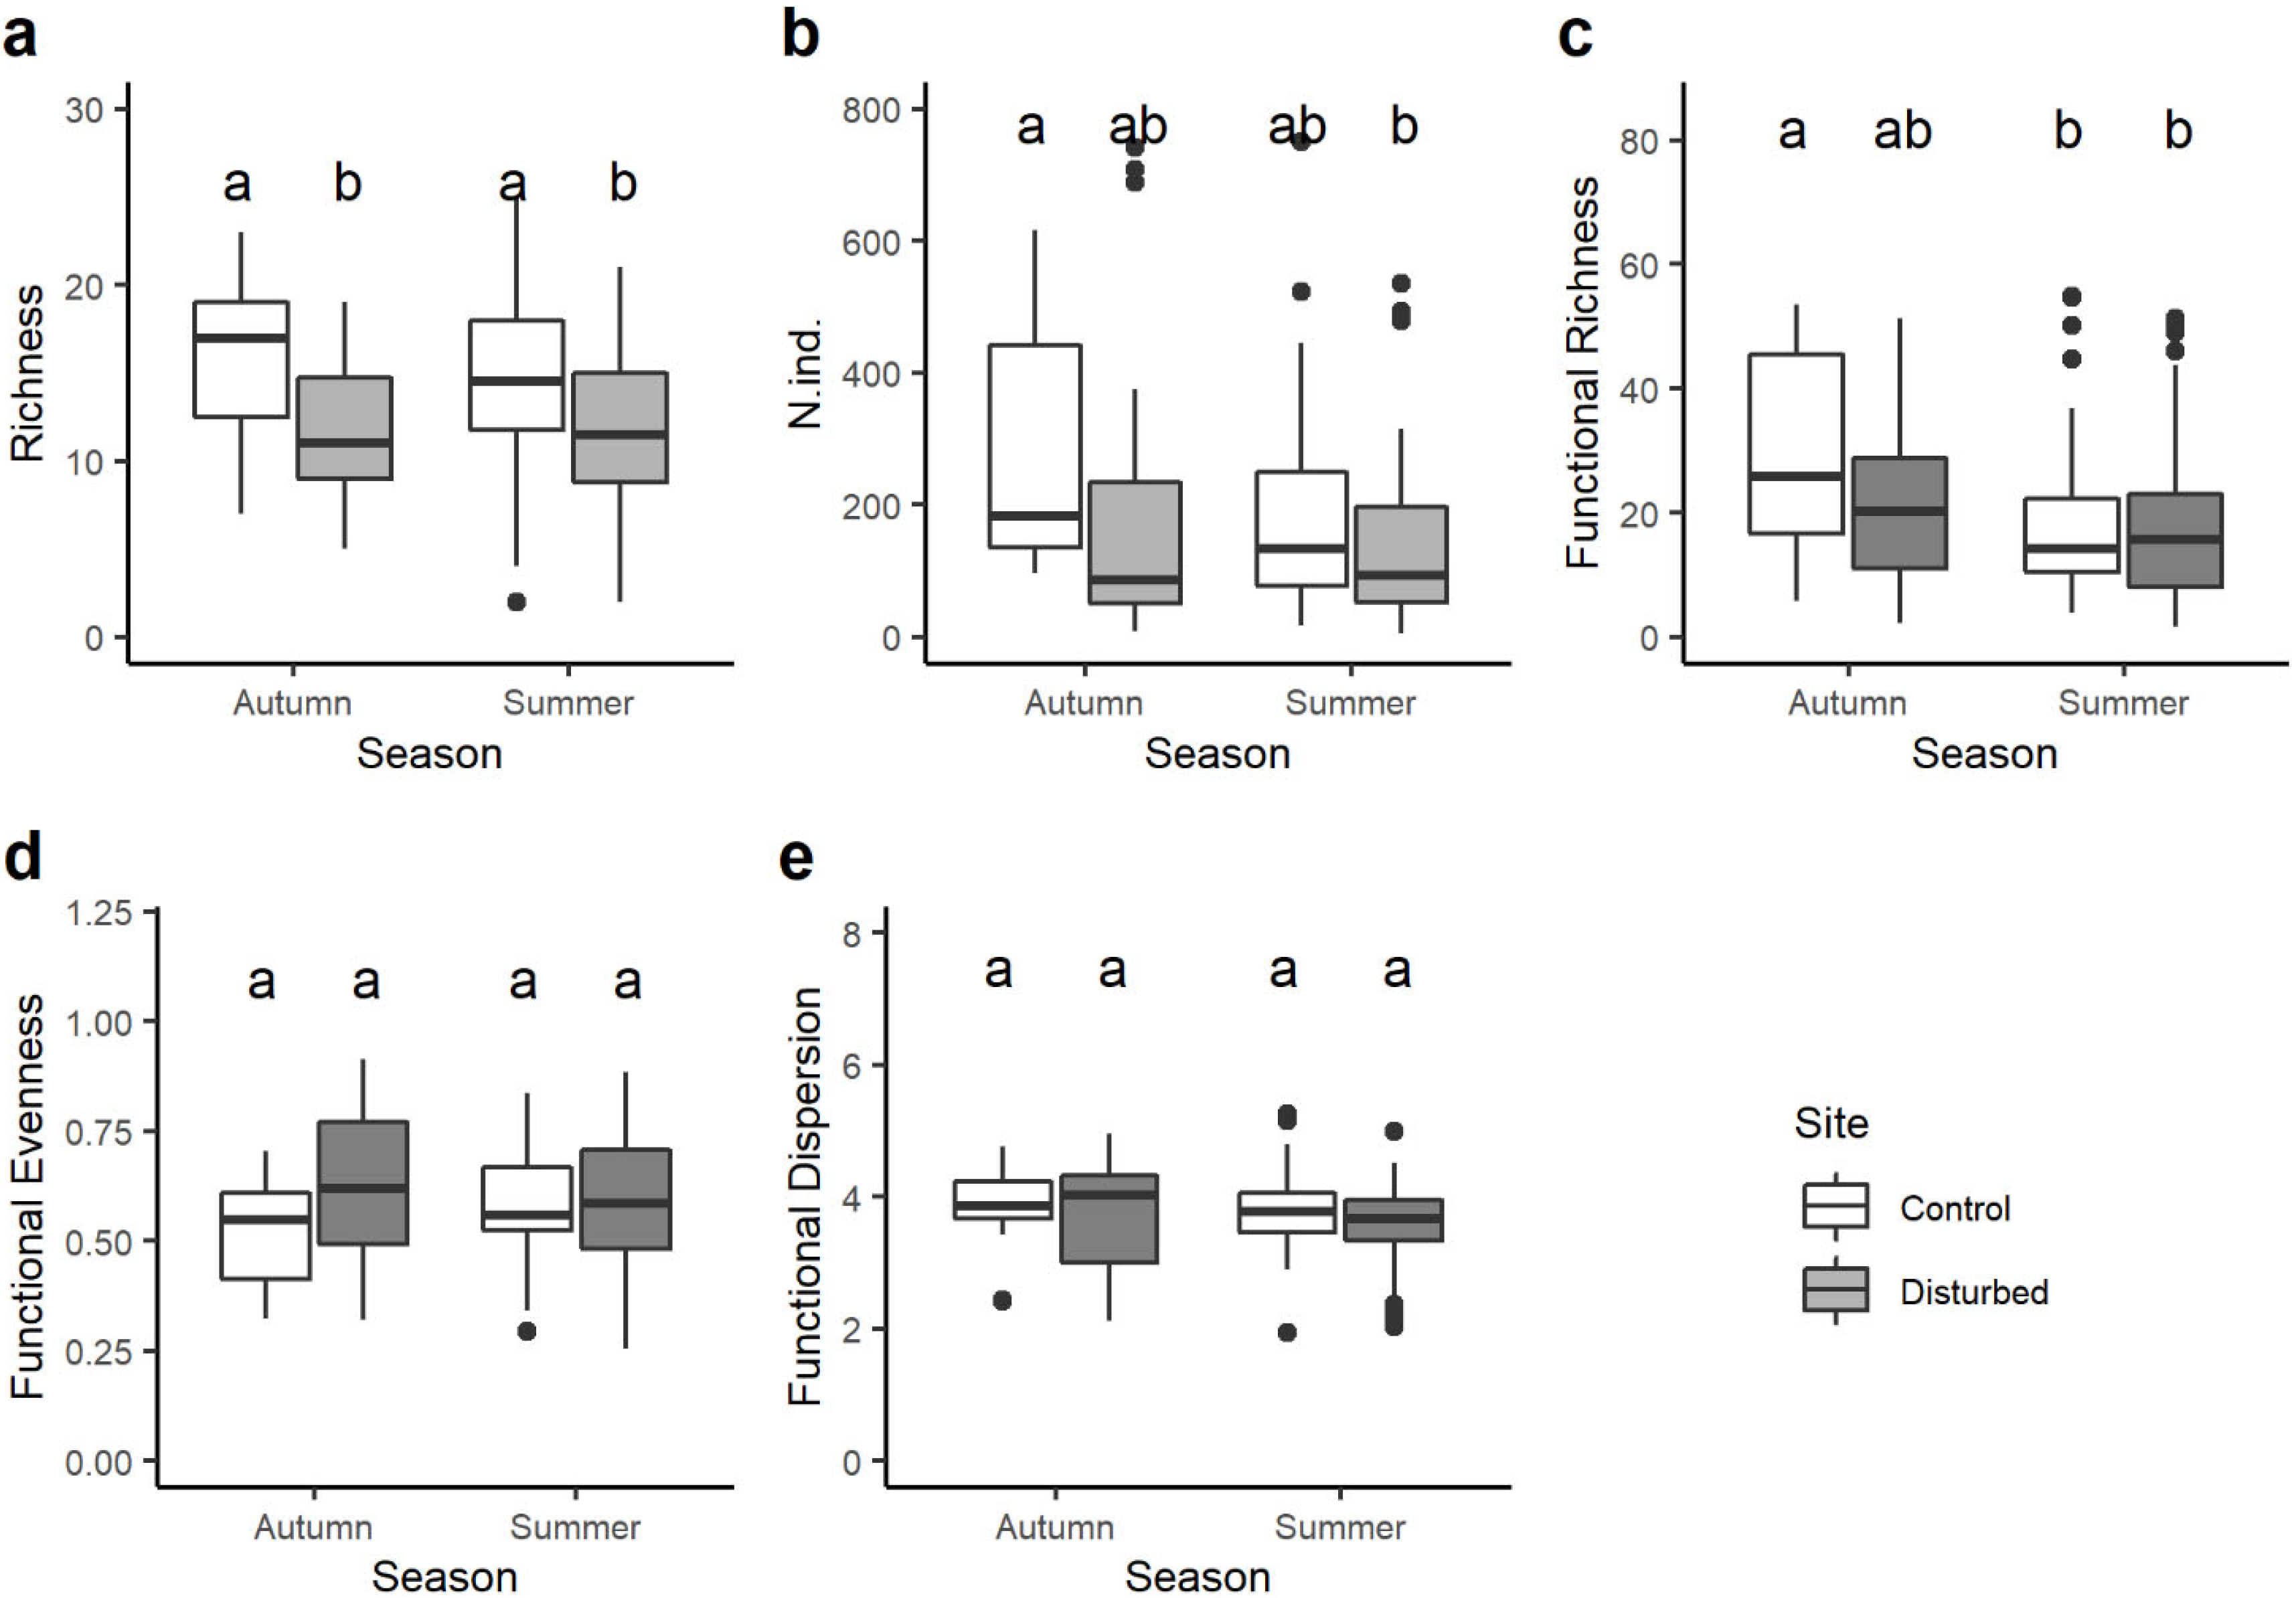
Figure 4.
Boxplots illustrate the variation in the community-weighted mean (CWM) trait value for: (a) maximal body size 0.5–1 cm, (b) maximal body size 2–4 cm, (c) potential number of cycles per year <1, (d) potential number of cycles per year =1, (e) potential number of cycles per year >1. The black line indicates the median value, while lower and upper box edges indicate the first and third quartiles, respectively. Vertical lines represent ± 1.5 interquartile distances, while dots represent observations that fall outside this range. Letters above boxes indicate significant differences based on pairwise comparisons.
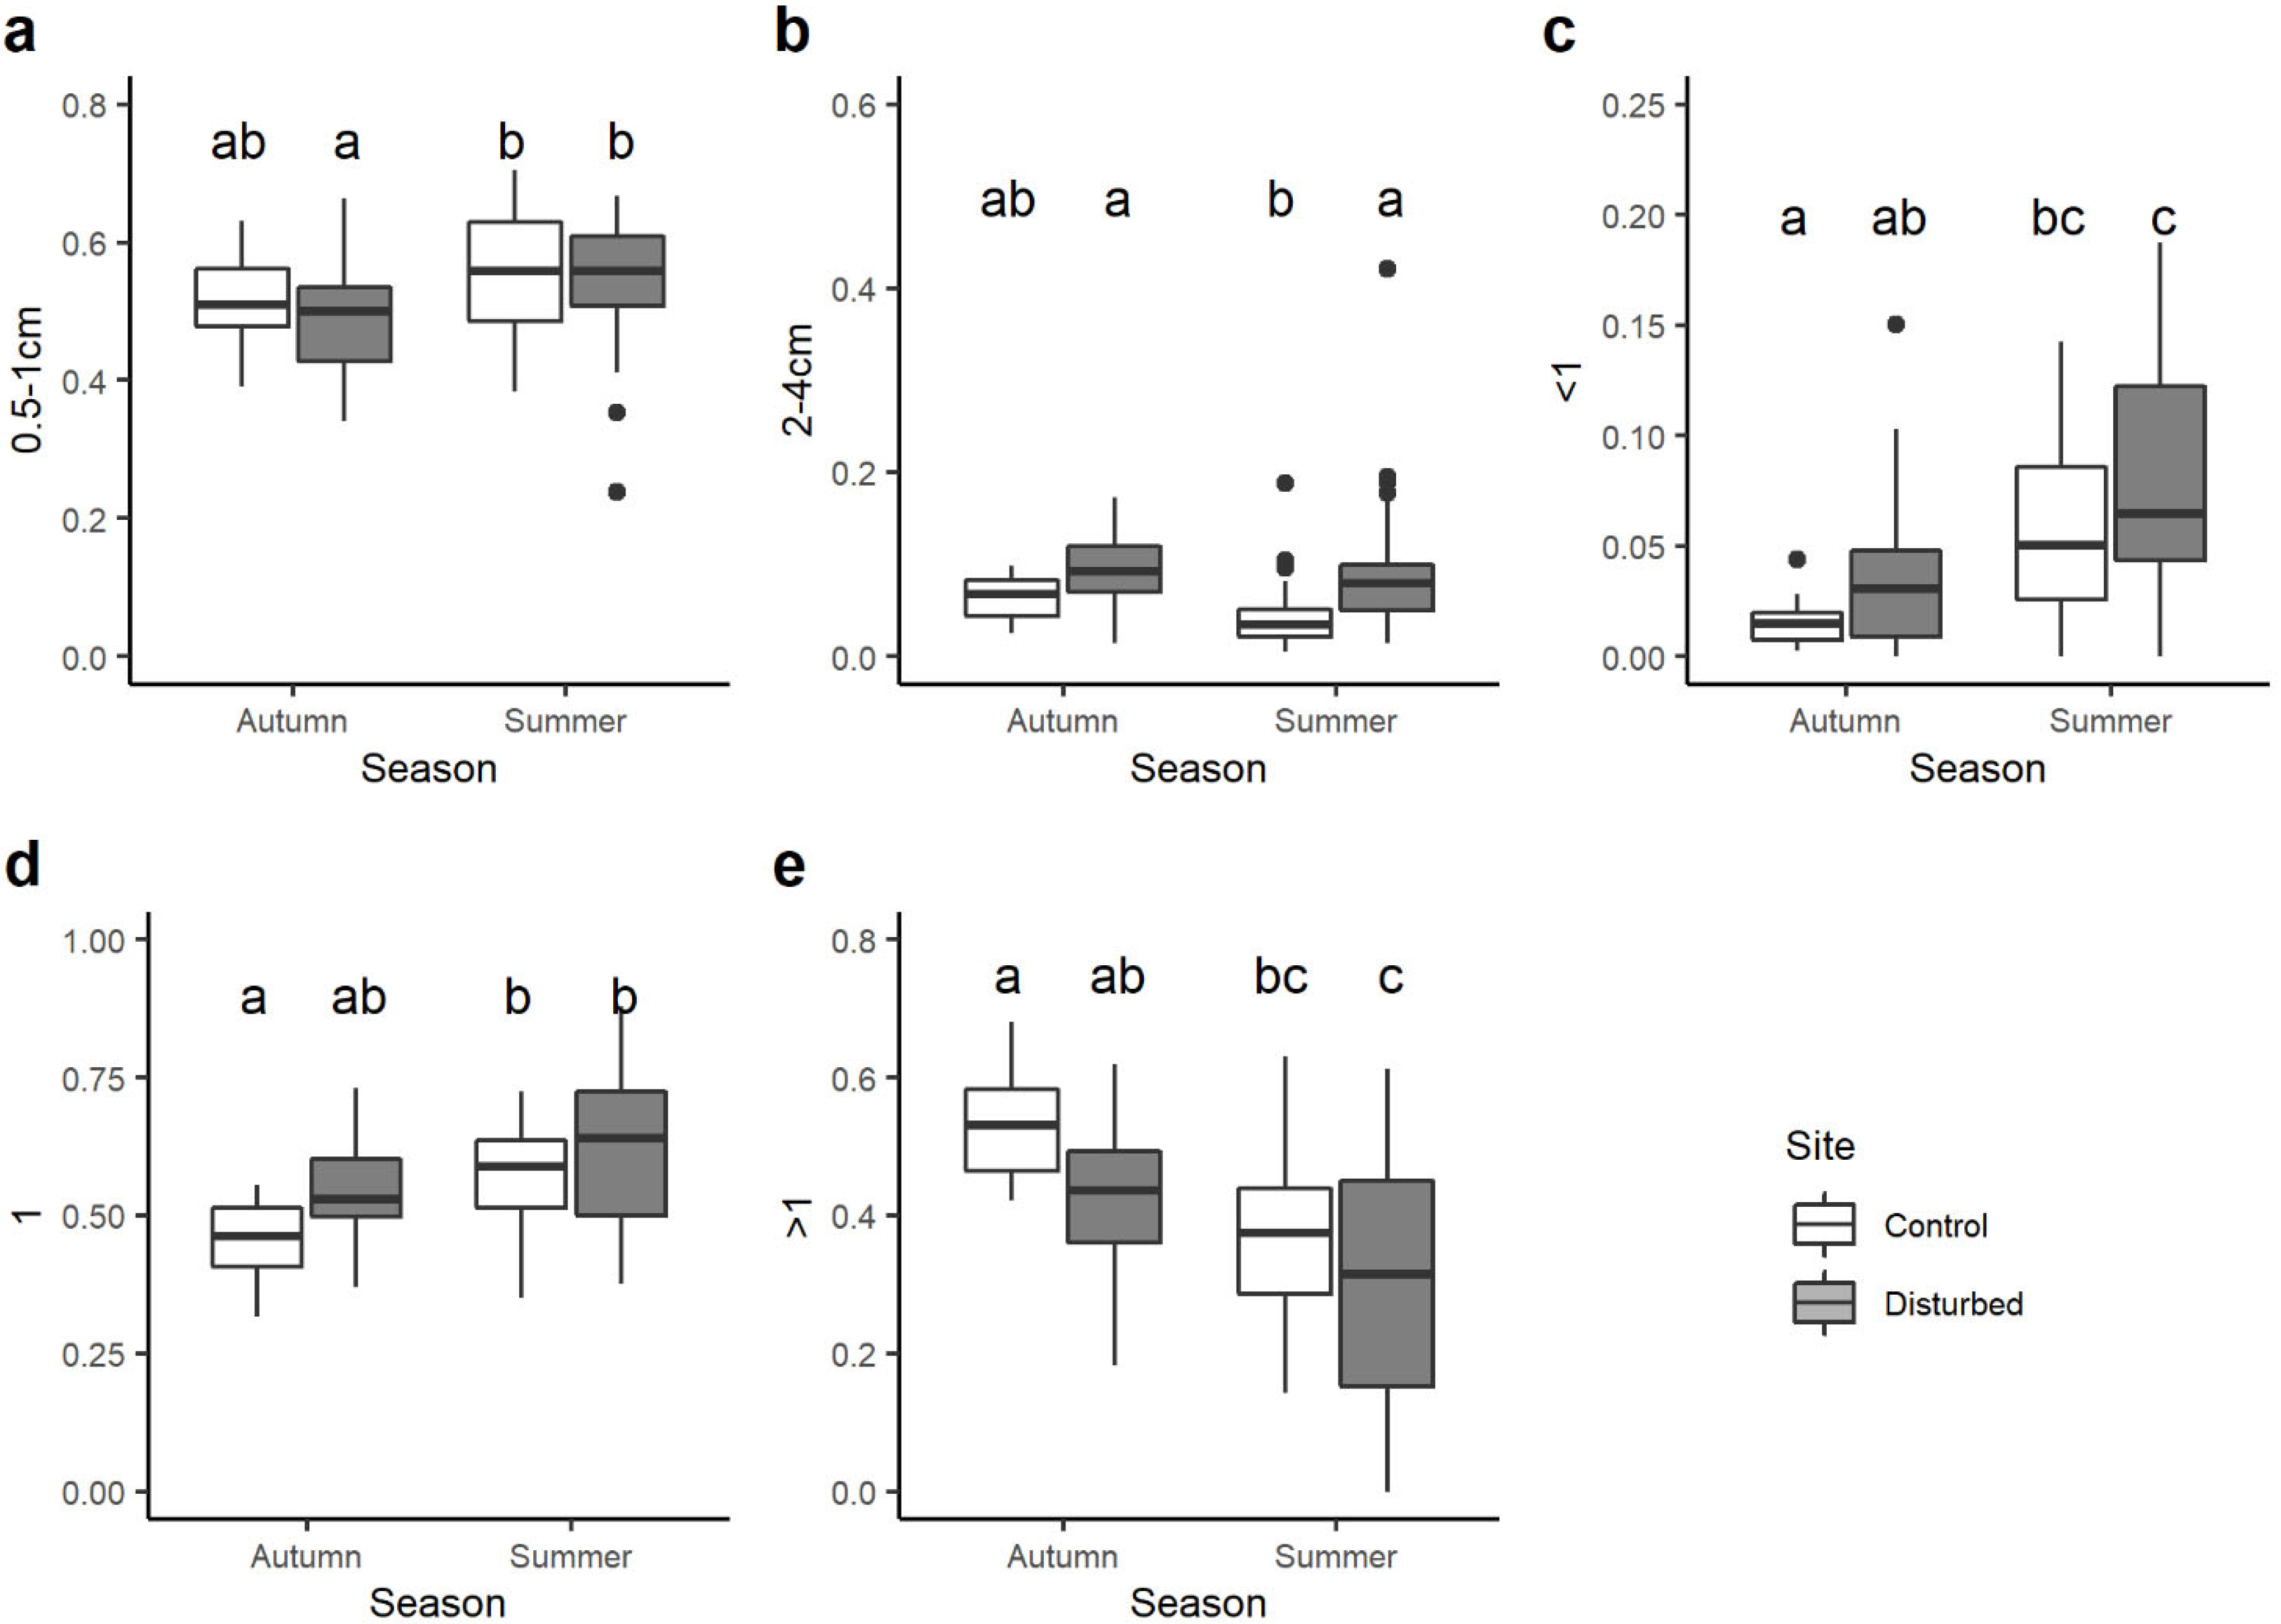
Figure 5.
Boxplots illustrate the variation in the community-weighted mean (CWM) trait value for the substrate and locomotion category: (a) surface swimmer, (b) water swimmer, (c) burrower, (d) temporarily attached and feeding habits: (e) deposit feeder, (f) shredder, (g) scraper, (h) filter feeder, (i) piercer, (j) predator. The black line indicates the median value, while lower and upper box edges indicate the first and third quartiles, respectively. Vertical lines represent ± 1.5 interquartile distances, while dots represent observations that fall outside this range. Letters above boxes indicate significant differences based on pairwise comparisons.

Figure 6.
Boxplots illustrate the variation in the community-weighted mean (CWM) trait value for the transversal distribution category: (a) river channel, (b) ponds/pools/disconnected arms, (c) temporary waters, (d) groundwaters and water velocity preferendum category: (e) medium, (f) fast. The black line indicates the median value, while lower and upper box edges indicate the first and third quartiles, respectively. Vertical lines represent ± 1.5 interquartile distances, while dots represent observations that fall outside this range. The letters above boxes indicate significant differences based on pairwise comparisons.
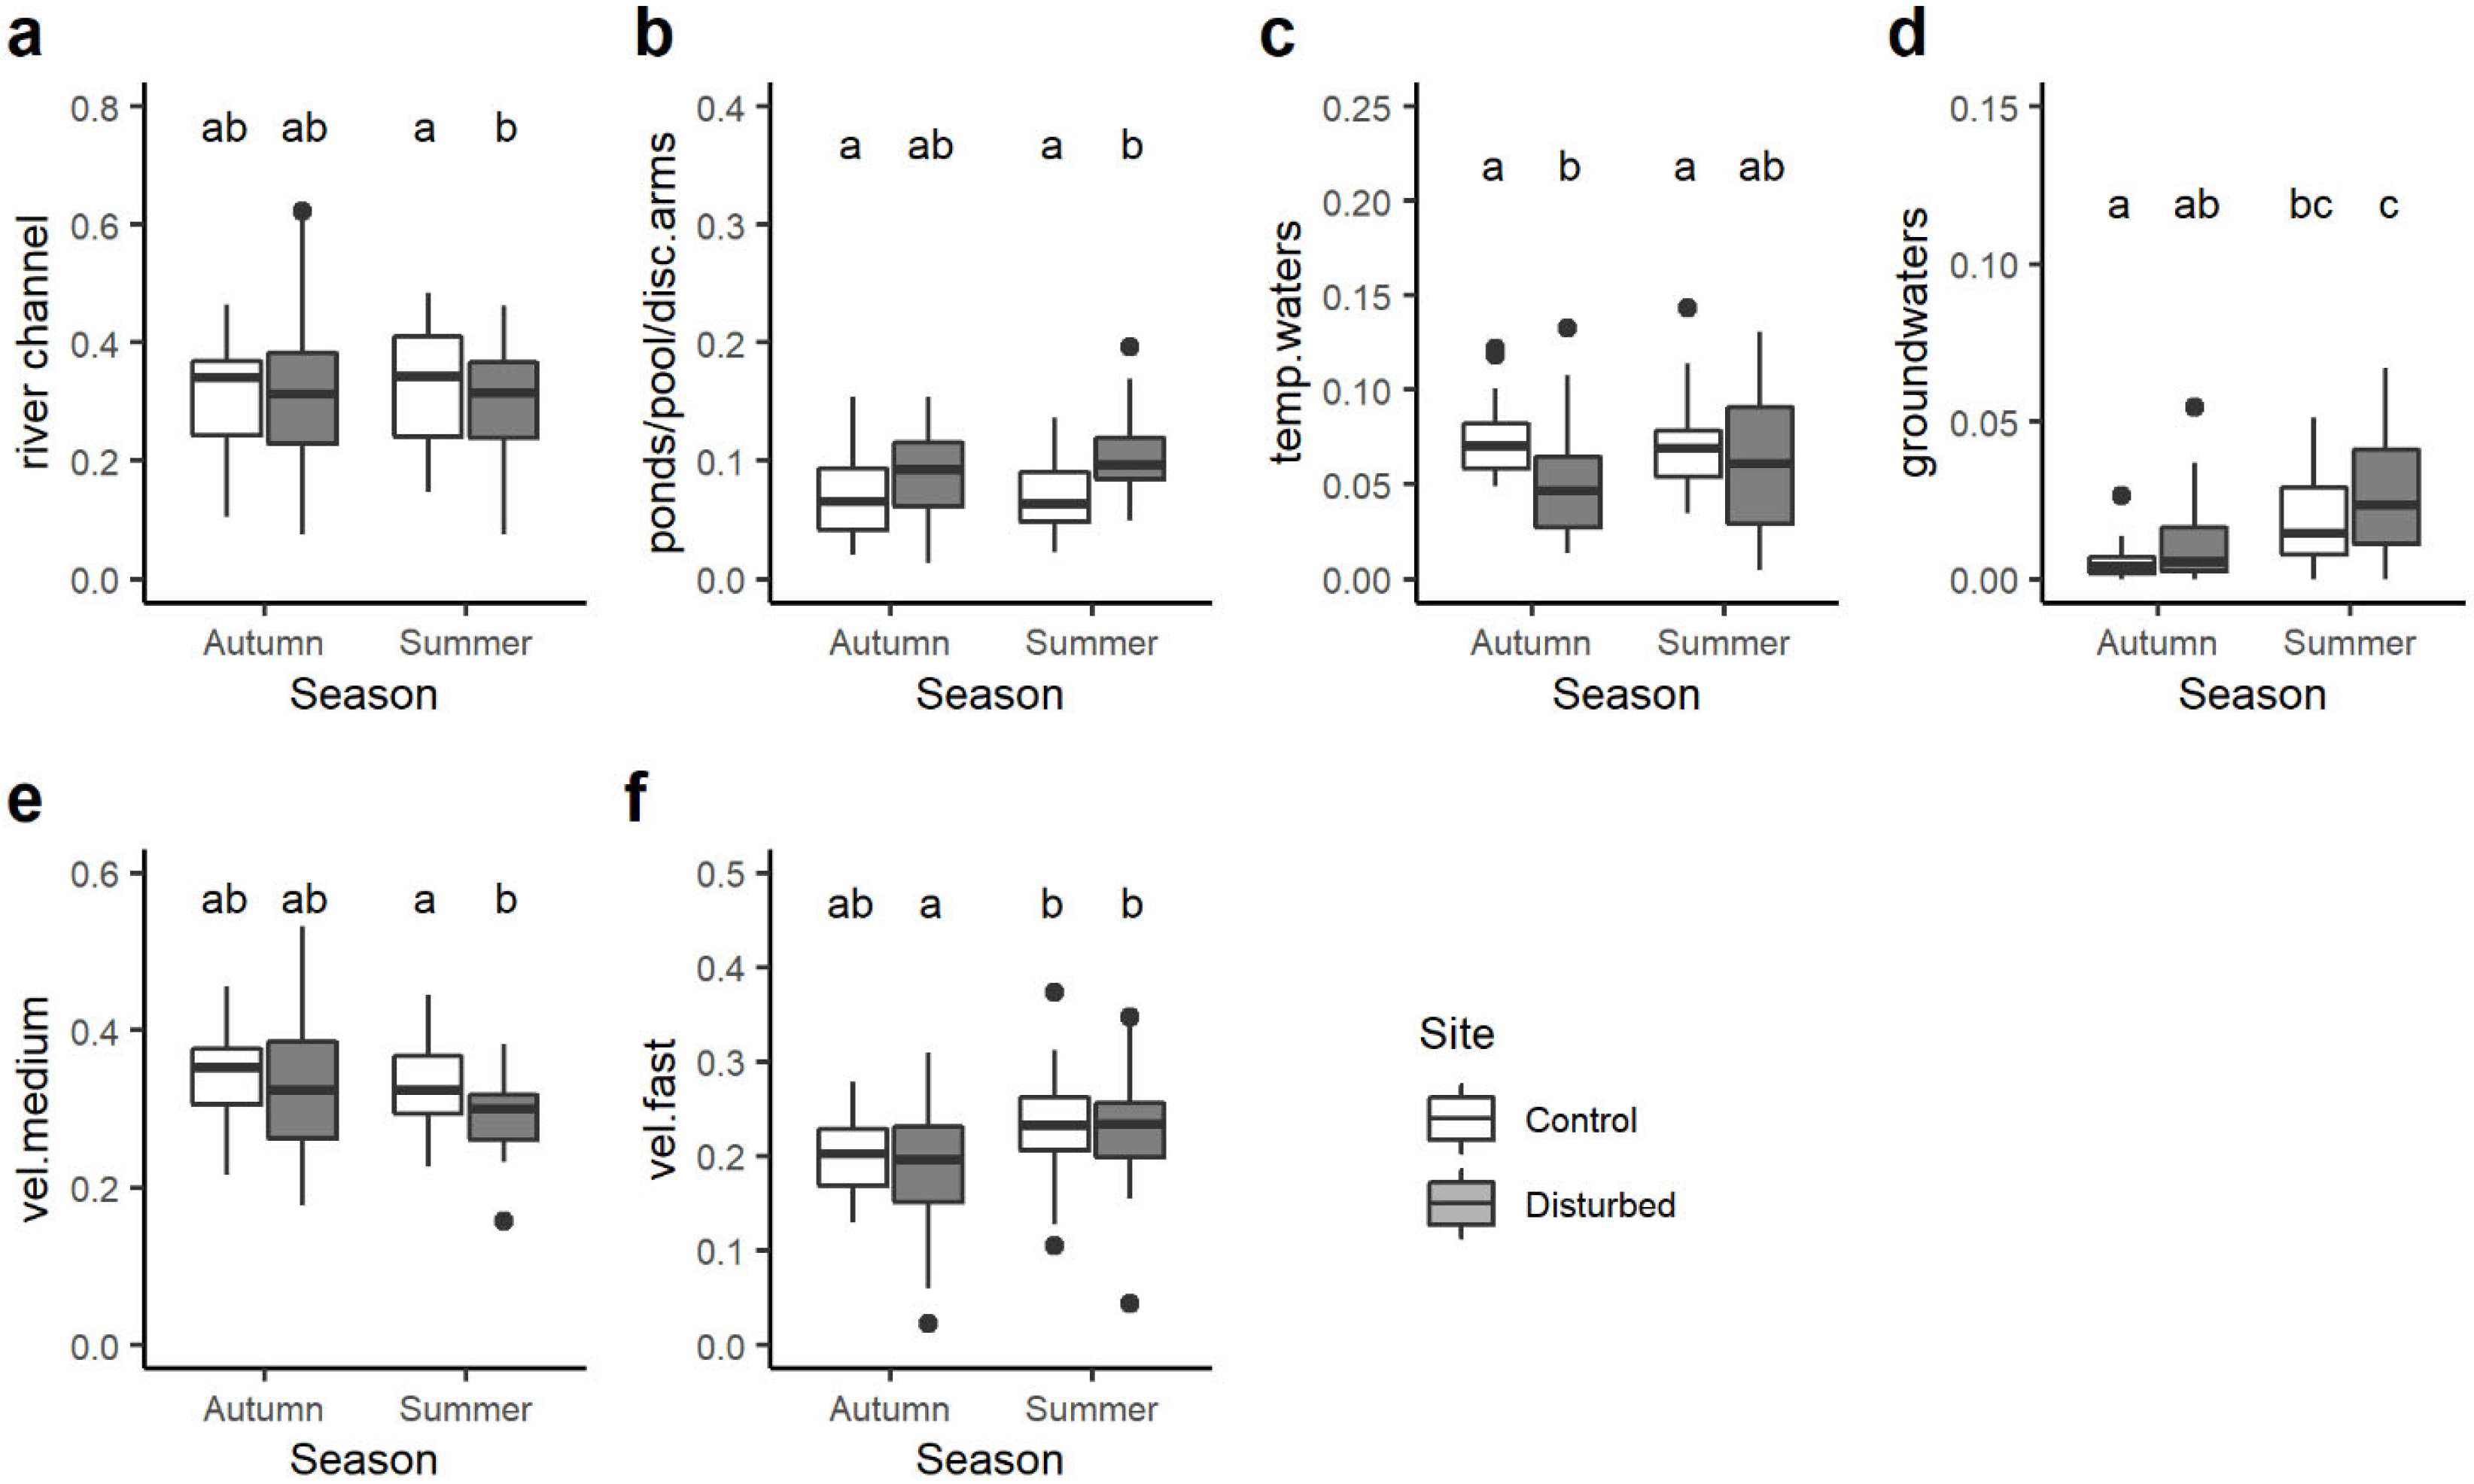
Figure 7.
Ordination of the macroinvertebrate communities according to the first two axes of the Correspondence Analysis performed on the functional matrix (CWM trait values). The left panel illustrates the position in the multivariate space of the four combinations siteXseason: CON_Aut = control site in autumn, CON_Sum = control site in summer, DIS_Aut = disturbed site in autumn, DIS_Sum = disturbed site in summer. The right panel illustrates the position in the multivariate space of each single trait.

Table 1.
Physical and chemical parameters of water (mean ± SD) and land uses (%) for the sampling sites. N.T. = non-toxic.
Table 1.
Physical and chemical parameters of water (mean ± SD) and land uses (%) for the sampling sites. N.T. = non-toxic.
| Parameter | Control Site | Disturbed Site |
|---|---|---|
| Conductivity (µS/cm) | 185 ± 37.4 | 170 ± 21.8 |
| pH | 7.41 ± 0.5 | 7.50 ± 0.2 |
| BOD5 (mg/L) | 2.50 ± 0.2 | 3.00 ± 0.2 |
| COD (mg/L) | 6.30 ± 0.1 | 7.60 ± 0.1 |
| Total phosphorous (mg/L) mg P/L | <0.05 | <0.05 |
| Ammonia nitrogen (mg/L) mg N/L | <0.05 | <0.05 |
| Daphnia magna (acute toxicity) | N.T. | N.T. |
| Vibrio fischeri (acute toxicity) | N.T. | N.T. |
| % Natural areas | 62% | 71% |
| % Agricultural areas | 26% | 23% |
| % Urbanized areas | 12% | 6% |
Table 2.
Functional traits and their category selected in this study [46].
Table 2.
Functional traits and their category selected in this study [46].
| Category | Trait |
|---|---|
| Maximal potential body size | ≤0.25 cm |
| 0.25–0.5 cm | |
| 0.5–1 cm | |
| 1–2 cm | |
| 2–4 cm | |
| 4–8 cm | |
| 8 cm | |
| Potential number of cycles per year | <1 |
| 1 | |
| >1 | |
| Locomotion and substrate relation | Flier |
| surface swimmer | |
| full water swimmer | |
| crawler | |
| burrower | |
| interstitial | |
| temporarily attached | |
| permanently attached | |
| Feeding habits | absorber |
| deposit feeder | |
| shredder | |
| scraper | |
| filter-feeder | |
| piercer | |
| predator | |
| parasite | |
| Transversal distribution | river channel |
| banks, connected side-arms | |
| ponds, pools, disconnected side-arms | |
| marshes, peat bogs | |
| temporary waters | |
| lakes | |
| groundwaters | |
| Current velocity (preferendum) | null |
| slow | |
| medium | |
| fast |
Disclaimer/Publisher’s Note: The statements, opinions and data contained in all publications are solely those of the individual author(s) and contributor(s) and not of MDPI and/or the editor(s). MDPI and/or the editor(s) disclaim responsibility for any injury to people or property resulting from any ideas, methods, instructions or products referred to in the content. |
© 2024 by the authors. Licensee MDPI, Basel, Switzerland. This article is an open access article distributed under the terms and conditions of the Creative Commons Attribution (CC BY) license (https://creativecommons.org/licenses/by/4.0/).
Share and Cite
MDPI and ACS Style
Marino, A.; Bona, F.; Fenoglio, S.; Bo, T. Functional Traits Drive the Changes in Diversity and Composition of Benthic Invertebrate Communities in Response to Hydrological Regulation. Water 2024, 16, 989. https://doi.org/10.3390/w16070989
AMA Style
Marino A, Bona F, Fenoglio S, Bo T. Functional Traits Drive the Changes in Diversity and Composition of Benthic Invertebrate Communities in Response to Hydrological Regulation. Water. 2024; 16(7):989. https://doi.org/10.3390/w16070989
Chicago/Turabian StyleMarino, Anna, Francesca Bona, Stefano Fenoglio, and Tiziano Bo. 2024. "Functional Traits Drive the Changes in Diversity and Composition of Benthic Invertebrate Communities in Response to Hydrological Regulation" Water 16, no. 7: 989. https://doi.org/10.3390/w16070989
Note that from the first issue of 2016, this journal uses article numbers instead of page numbers. See further details here.