
Reconstruction of Past Water Levels in Data-Deficient Karst Springs

1
School of Continuing Education, Jinan Engineering Polytechnic, Jinan 250200, China
2
School of Environment, Beijing Normal University, Beijing 100875, China
3
Beijing Mentougou District Water Authority, Beijing 102300, China
4
Jiangsu Hover Wei Peng Information Technology Co., Ltd., Zhenjiang 212004, China
5
College of Water Sciences, Beijing Normal University, Beijing 100875, China
*
Authors to whom correspondence should be addressed.
Water 2024, 16(8), 1150; https://doi.org/10.3390/w16081150
Submission received: 9 March 2024
/
Revised: 16 April 2024
/
Accepted: 17 April 2024
/
Published: 18 April 2024
(This article belongs to the Section Hydrogeology)
Abstract
:Karst aquifers are crucial for providing fresh water worldwide but are also incredibly sensitive to human impact and climate change. This study aims to reconstruct the historical water levels of karst springs, despite the lack of data. By combining collected data, we have created a detailed numerical model to understand the complex behavior of karst aquifers. Our research reveals significant drops in the water levels at Longtan Spring, mainly due to the overuse of groundwater and inadequate water recharge, which is critical for the success of the Springs Resurgence project. We have also mapped out historical groundwater levels and identified the necessary conditions to get the spring flowing again. The model proved to be reliable during its calibration from 2000 to 2007, with an average Nash–Sutcliffe efficiency coefficient of 0.52 for the monitoring wells. For the period from 1960 to 2019, our model showed a strong correlation coefficient of over 0.97 when compared with data from the GRACE satellite mission, demonstrating its high accuracy. The approach we have taken in this study provides a feasible way to figure out historical water levels in karst springs, which is vital for protecting these essential fresh water sources. This work will provide a strong basis for policies to restore the spring.
1. Introduction
Karst formations provide 25% of the global freshwater supply [1]. These regions, including southwest Guangxi, China [2], as well as Florida in the USA [3], rely heavily on karst aquifers for drinking water, agriculture, and ecosystems. Despite their importance, these resources face threats from overuse and climate change, which lower the natural water recharge and can cause geological hazards. These threats are worsened by extreme weather events.
The hidden and complex nature of karst systems makes them hard to monitor and assess [4], particularly in remote and harsh environments [5,6]. Limited data make effective water management difficult [7,8]. Traditional monitoring like drilling and surveys [9,10,11] are expensive and limited in scope, and chemical and isotope analyses need a lot of field and lab work [12,13]. New technologies [14,15] like remote sensing, satellites, and drones are becoming helpful for collecting data in these areas [16]. Projects like GRACE have shown how satellite data can help us understand groundwater levels [17,18], and data-driven methods [19,20,21,22,23] are useful when data are scarce. However, monitoring karst aquifers, especially in mountainous areas, remains challenging. Better monitoring and international cooperation are needed to know more about these important water sources.
At the same time, numerical models like MODFLOW [24] have been crucial for understanding historical groundwater and spring discharge [25,26,27,28]. These models have helped with hydrological reconstructions and resource management worldwide [15,29,30], but their success depends on accurate assumptions and data. Ongoing data collection and model refinement are the key to improving our understanding and management of karst resources. After intense management, we can protect these systems from overuse and pollution and preserve them for the future.
Since 2018, the Chinese government has promoted the concept of an ecological civilization underscoring the importance of a harmonious coexistence between humanity and nature. The push for an ecological civilization has led to stricter groundwater management. The Tanzhe Temple in the Jing-Jin-Ji Region, with its historical significance, has seen its associated spring, Longtan Spring, dwindle and close [31]. The Springs Resurgence initiative aims to protect and sustainably use this spring. In the context of data limitations, delineating the recharge mechanisms and the intrinsic characteristics of the spring’s source represents a significant analytical challenge. Thus, the objectives of this study include (1) to formulate a hydrogeological conceptual model; (2) to construct and validate a numerical model for the karst aquifer using the data at hand; and (3) to deduce the conditions required to restore historical groundwater levels and facilitate the spring’s resurgence. This work will provide a strong basis for policies to restore the spring.
2. Study Area and Methods
2.1. Study Area
The study focuses on an area within Beijing City, located in the Jing-Jin-Ji region (see Figure 1a,b). The Tanzhe Temple, established in the inaugural year of the Yongjia era during Emperor Sima Chi’s reign in AD 307, boasts a heritage spanning over 1700 years. After the founding of the People’s Republic of China, this ancient site was transformed into a public park. About two kilometers northeast of the temple lies Longtan Spring. This spring is historically significant, having once added to the temple’s allure. Currently, the spring faces the threat of drying out. Historical accounts show that extensive water withdrawal has led to a consistent drop in local groundwater levels, causing the spring to run dry in May and June of 1981, as reported by [31].
The study area, part of the Jing-Jin-Ji region, features a terrain that slopes from the higher elevations of the northwestern Taihang Mountains down to the southeastern plains. To the west, we find a range of medium to low mountains with heights varying from 40 to 1000 m. These gradually give way to rolling hills and smaller mountains, leading to the east’s flat plains, where the gradient varies from 1‰ to 3‰. The region experiences a warm temperate climate with semi-humid to semi-arid conditions and is influenced by the continental monsoon, bringing distinct seasonal changes. The average annual temperature is about 11.7 °C. Historically, temperatures have peaked at 42.6 degrees Celsius and dipped to −27.4 °C. Rainfall patterns, according to the Beijing Meteorological Bureau’s data from 1960 to 2019 (as shown in Figure 2), show that the area receives an average annual precipitation of 568.86 mm. Most of this rain falls between June and September, making up 60 to 80 percent of the annual rainfall. Notably, the period from 1999 to 2007 was exceptionally dry, with the annual average precipitation dropping to just 449.8 mm.
Within the Haihe River Basin, the study area’s hydrology is closely linked to the Yongding River system. This river, flowing through Beijing’s western parts, is pivotal for recharging ground water in these regions [32,33]. Originating from the Guanting Reservoir and snaking through the Yongding River Gorge, it reaches the plains near Sanjiadian, depicted in Figure 2. The river exemplifies the water scarcity challenges in northern China, with a significant decrease in surface runoff noted over the past decades. From 2001 to 2018, the natural runoff has fallen by 47% compared to the 1961–2000 period, a change potentially linked to climate variations, increased human water use, and interception by upstream reservoirs.
Yushanshan Spring, a key water source in the region, is primarily fed by the underlying karst aquifers (Figure 1b). Previous studies [34,35,36,37] highlight the Yongding River’s crucial role in the spring’s recharge and identifies the Jiulong Mountain–Xiangyu syncline as a secondary recharge path. Recent ecological water replenishment efforts along the river’s course, including high-volume pulse discharge experiments, aim to enhance river conditions, while ongoing restoration projects focus on vegetation recovery and sustainable water use. The relationship between Yongding River flows and Yushanshan Spring levels is intricate, influenced by climate, human activities, and geology. A comprehensive study incorporating these factors is vital for accurate predictions and effective management of these water resources [34,35,36,37].
In the Xishan region, Figure 3 shows that the karstic fissure water recharge is mainly in Junzhuang and Lujiatan [38]. In Junzhuang, rain and river infiltration are the main contributors, while Lujiatan depends on precipitation and nearby river seepage. Yongding River’s surface water also significantly recharges the karst in both locales. In limestone areas, the karst water is refreshed by both rain and river infiltration. Northwest of Lujiatan, impermeable shales direct the subsurface flows towards the area, supported by runoff into karst fissures, promoting infiltration. The water table slopes from the high western areas to the lower east. Water moves slowly through Junzhuang’s dense fracture network, whereas near Tanzhe Temple, it travels faster southeastward, directed by the Babao Mountain fault towards Sijiqing, leading to quicker groundwater turnover than in Junzhuang. Groundwater discharge includes lateral outflows to plains and human extraction.
2.2. Model Description
The study area is outlined with distinct boundaries as shown in Figure 3, based on previous studies [31,38]. The northern and southern edges are modeled as the no-flow boundary, while some western sections are set as flow boundaries, and certain eastern parts are defined as known-head boundaries. The model’s primary concern is the karst aquifer system, which benefits from direct rain infiltration in regions where limestone is at the surface. However, the recharge of the aquifer beneath the limestone is limited by overlying layers that are less permeable. Adjacent to the Yongding River fault, surface water further recharges the karst aquifer. In the Yushan Mountain area, the groundwater naturally emerges as springs. The groundwater system here is in a state of dynamic imbalance, exhibiting uneven flow properties in different directions. This has led to the development of a conceptual model that is diverse in characteristics, directionally dependent, three-dimensional, non-steady-state, and completely saturated.
This study presents an improved groundwater flow model, NGFLOW (Nest-based Groundwater Flow system), developed from a model that integrates surface and groundwater [39]. NGFLOW, advancing the polygonal finite difference method, works in unison with Geographic Information System (GIS) technology. The grid is typically partitioned in equal distances throughout the study area. NGFLOW uses OpenMP for parallel processing, boosting computational speed by using the multiple processors and cores available in computers.
Spring discharge is primarily regulated by the elevation of the outlets, which serve as initial boundary conditions. The formula for spring flow, in line with Darcy’s law, combines horizontal and vertical flow components. Springs are considered descending if the horizontal component prevails and ascending if otherwise. The model also examines the link between groundwater evaporation and the depth of the water table, employing both exponential and power functions and considering the effect of rock type on evaporation. This continuous function definition enables the model to estimate evaporation more precisely from the water table.
2.3. Data Preparation
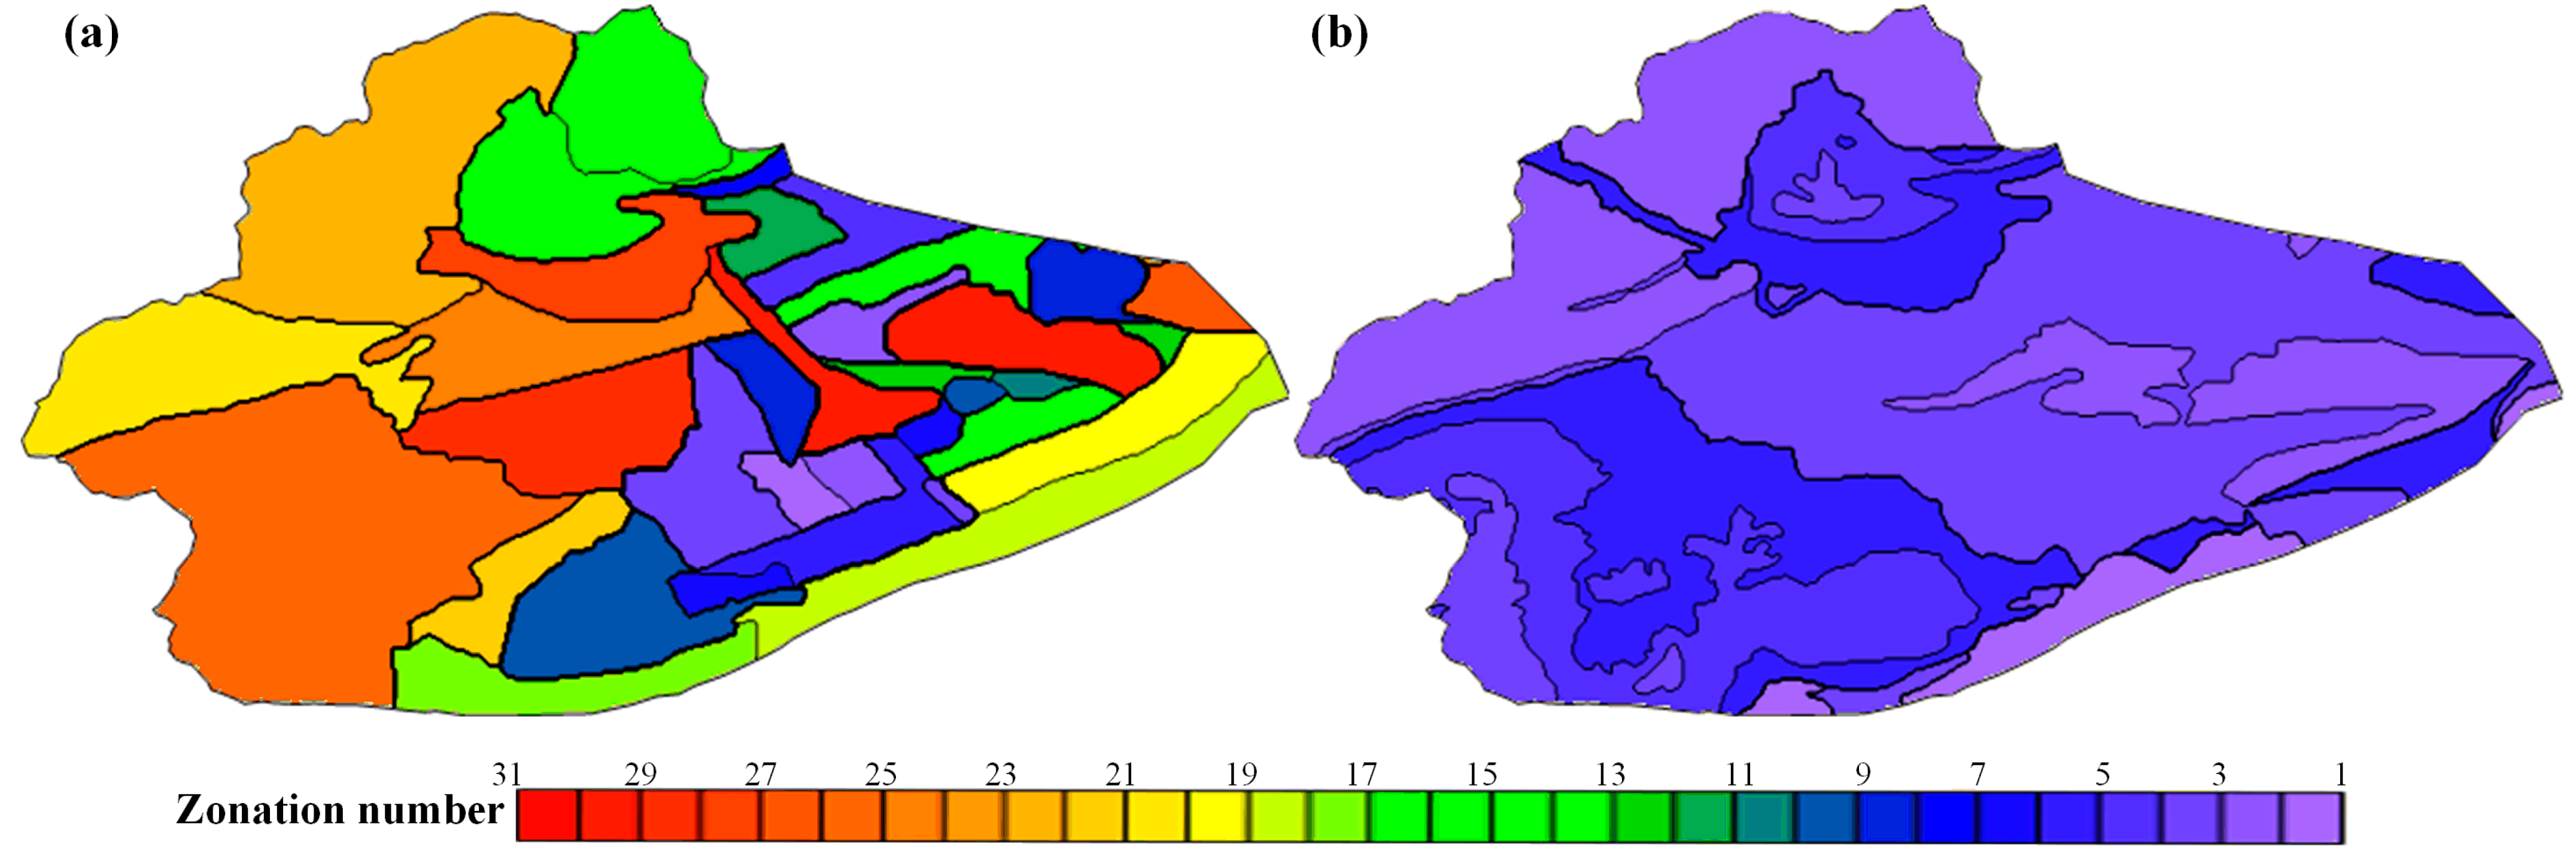
The foundational data for this study, detailed in Table 1, encompass borehole records, precipitation figures, groundwater extraction volumes, observatory well readings, streamflow statistics, and groundwater storage measurements. We account for the karst system’s variability by incorporating diverse permeability values into our model, acknowledging the differing degrees of karst development and their impact on the flow of groundwater. Such detailed parameterization is crucial for accurately representing the intricate hydrological behaviors of the karst aquifer system. As a result, this improves the reliability of our groundwater flow predictions and supports more effective management of these resources within the area under investigation. In our model, the permeability coefficient is divided into 30 distinct levels. Each level is assigned parameters that reflect the degree of karst development observed, as depicted in Figure 4a.
Rainfall infiltration recharge is a critical component of the groundwater system in our study area. We have analyzed rainfall data spanning from 2000 to 2013, gathered from the Yanchi, Datai, Shangweidian, and Sanjiadian stations, which is displayed in Figure 1. These data show that the heaviest rainfall typically occurs between July and September. The infiltration coefficient—which determines how much rainwater replenishes the groundwater—is affected by a variety of factors. These include the amount of rainfall, the type of rock in the unsaturated zone, and the depth to the groundwater table. These factors vary across the region, as shown in Figure 4b. According to existing research, the infiltration coefficient ranges from 10% to 25%. For the purposes of our study, we have divided the area into six zones, each defined by these infiltration values.
Our dataset from observation wells is invaluable for an in-depth understanding of the groundwater trends within the study area. We have collected and analyzed data from five bedrock groundwater level observation wells, labeled O1 to O5, as shown in Figure 1. These wells indicate a uniform decline in groundwater levels, with monthly depletion rates of 0.11, 0.06, 0.11, 0.17, and 0.16 m, respectively, between 2000 and 2007. Our model identifies infiltration from the Yongding River as the main source of recharge, with variations captured in the runoff data presented in Figure 2.
Delving into the groundwater fluctuations of Yuquanshan Spring, located on the eastern margin, and functioning as a fractured rock aquifer well, we have consulted a wide range of literature and historical records [31,32,38]. These span from 1960 to 2019 and indicate that the spring’s water level remained relatively stable, hovering around the 40 m mark until 1996. From 1996 to 2011, the area saw a significant drop, with water levels falling from 35 m to an alarming 15 m. However, from 2011 to 2016, there was a period of fluctuation with some recovery, which continued into a steady increase in groundwater levels from 2016 to 2019. Establishing the initial hydraulic head distribution is crucial for accurate numerical groundwater modeling. Our baseline water-level distribution is grounded on previous studies [31], providing the necessary hydrological framework for our simulations.
2.4. Model Development
We divided the study area into a grid network of 79,835 nodes, each 100 m by 100 m, to establish a detailed analysis framework. The model’s calibration phase ran from January 2000 to December 2007, broken down into monthly steps for a total of 96 time steps. This phase aimed to align the model with observed groundwater levels from five key wells.
To estimate parameters, we first applied an initial zonation according to the area’s stratigraphic and lithologic details. We then set preliminary parameter limits using data from pump tests, lithological studies, aquifer properties, contour maps of equal potential, and groundwater head patterns. The maximum drawdowns observed in the wells served as benchmarks to fine-tune the hydrogeological parameters. This calibration uses diverse data to ensure that the model’s parameters reflect the actual geological and hydrological conditions of the region. Such detailed calibration is vital to create a predictive model that can guide the sustainable management of local water resources. After calibration, we identified key parameters such as the planar permeability coefficient, storage coefficient, and recharge rates. The results are listed in Table 2. The rainfall infiltration recharge rates for Zones 1 to 6 were determined to be 0.06, 0.09, 0.11, 0.13, 0.15, and 0.18, respectively.
Figure 5 compares the observed and simulated groundwater levels at the five wells. Across all wells during the calibration period, the average correlation coefficient was above 0.61, indicating a strong match between the model and the real-world data. The NSE (Nash–Sutcliffe efficiency) coefficient is employed to assess the effectiveness of the developed groundwater flow model. The NSE for the wells (O1, O2, O3, O4, and O5) were recorded at 0.48, 051, 0.71, 0.20, and 0.71 with a mean of 0.52, respectively, reflecting a good fit with the observed data.
Our model’s statistical analysis estimates that the average annual rainfall infiltration recharge is about 447.8 million m3. In addition, we calculated the average annual recharge from the Yongding River’s infiltration to be approximately 355.0 million m3. Conversely, the yearly average for water extraction and boundary drainage flow is 957.8 million m3, leading to an annual deficit of 155.0 million m3.
Considering the dynamics of recharge, runoff, and discharge specific to our study area, we have outlined zones of recharge–runoff–discharge, as shown in Figure 6. This strategic zoning is crucial for understanding the spatial differences in groundwater movements. It lays the foundation for developing groundwater management strategies that are sustainable, supporting the findings of [40,41].
3. Results and Discussion
3.1. Reconstructed Groundwater Level Changes
The primary goal of our research was to reconstruct the historical groundwater levels near Longtan Spring. To achieve this, we used both forward and backward modeling to create a comprehensive record of groundwater levels for Longtan Spring, covering the period from 1960 to 2019. Relying on a continuous dataset from this period, which includes precipitation and water levels from Yuquanshan Spring, we divided the modeling into two phases—2008 to 2019 and 1999 to 1960—to allow for precise simulations. This approach yielded a continuous historical record of groundwater levels for observation wells O1 to O5 and captured the variations in groundwater dynamics over the studied period, as shown in Figure 7.
Longtan Spring, located in the Lujiatan karst area, has shown a decreasing flow pattern over time. The recharge for Yuquanshan’s springs includes water from Lujiatan’s karst aquifers, ecological infiltration from the Yongding River, karstic inputs from Junzhuang, and rainfall infiltration. The observed decrease in groundwater levels at Yuquanshan indirectly reflects the downward trend at Longtan Spring. Our study’s findings illuminate the historical and contemporary fluctuations of groundwater levels in the region, providing crucial insights into the hydrogeological processes at play. The strong correlation coefficients from the calibration and reconstruction phases confirm the model’s reliability, arming policymakers with a dependable resource for the wise stewardship and preservation of springs of significant cultural and ecological importance.
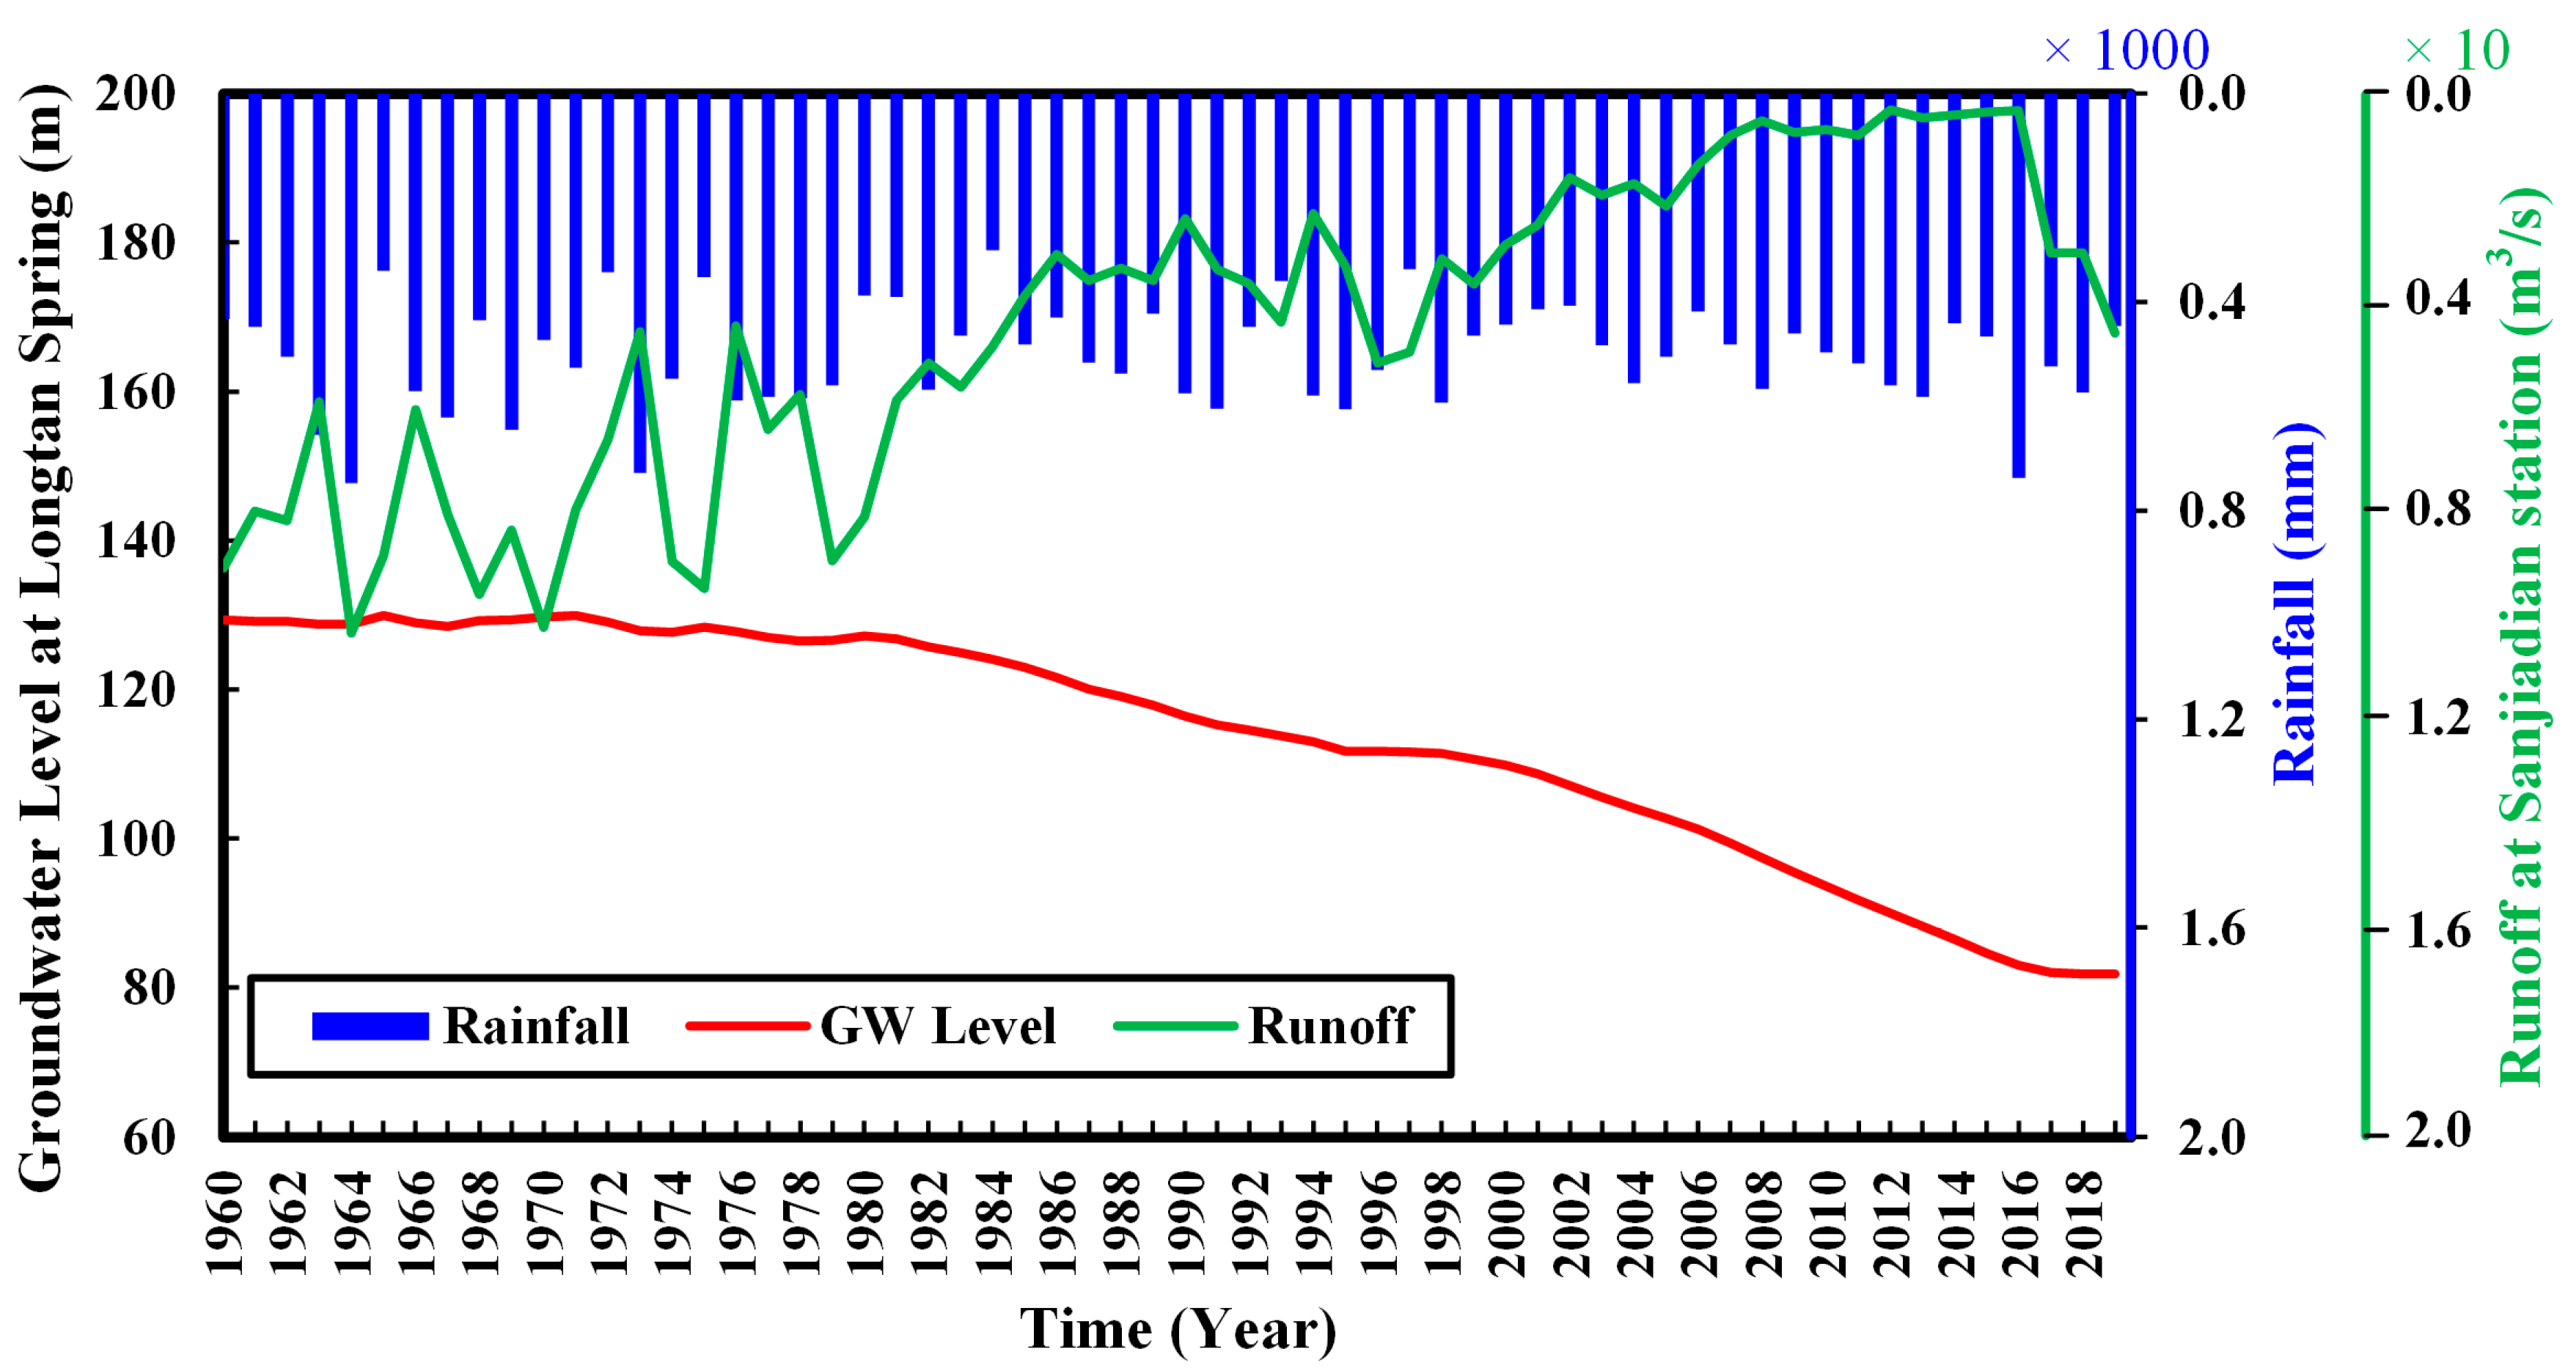
Figure 8 showcases a color map illustrating groundwater levels for select years: 1960, 1980, 2000, and 2019. The visual indicates that the Yongding River fault notably affects the flow direction and the hydraulic conductivity within the Ordovician aquifer system. We have noticed a strong link between the groundwater levels at Longtan Spring and several hydrological factors. These include neighboring groundwater from Yuquan Mountain, local rainfall trends, and infiltration recharge from the Yongding River. The simulated contour map of groundwater levels at the close of 2019, shown in Figure 9, demonstrates that the area’s hydrodynamics have remained largely unchanged since 2000.
3.2. Verification of Model Results
Our simulation provides a detailed longitudinal analysis of the changes in groundwater levels within the region, shedding light on the complex interactions among hydrological elements that affect Longtan Spring. However, limitations in the observational data pose challenges for confirming the accuracy of these reconstructed levels. Building on the work of [18], who refined groundwater storage estimates using GRACE/GRACE-FO satellite data, we integrated these measurements near Longtan Spring to enhance our analysis.
The resulting groundwater level reconstruction for Longtan Spring, covering the years 1960 to 2019 and illustrated in Figure 10, correlates closely with the trends in groundwater storage changes, with a correlation coefficient exceeding 0.95. We determined that the critical water level for Longtan Spring’s revival is 135.65 m above sea level. Notably, the decline or interruption of spring flow at Longtan is primarily due to a decrease in regional groundwater levels in the Xishan area.
3.3. Establishment of a Management Tool
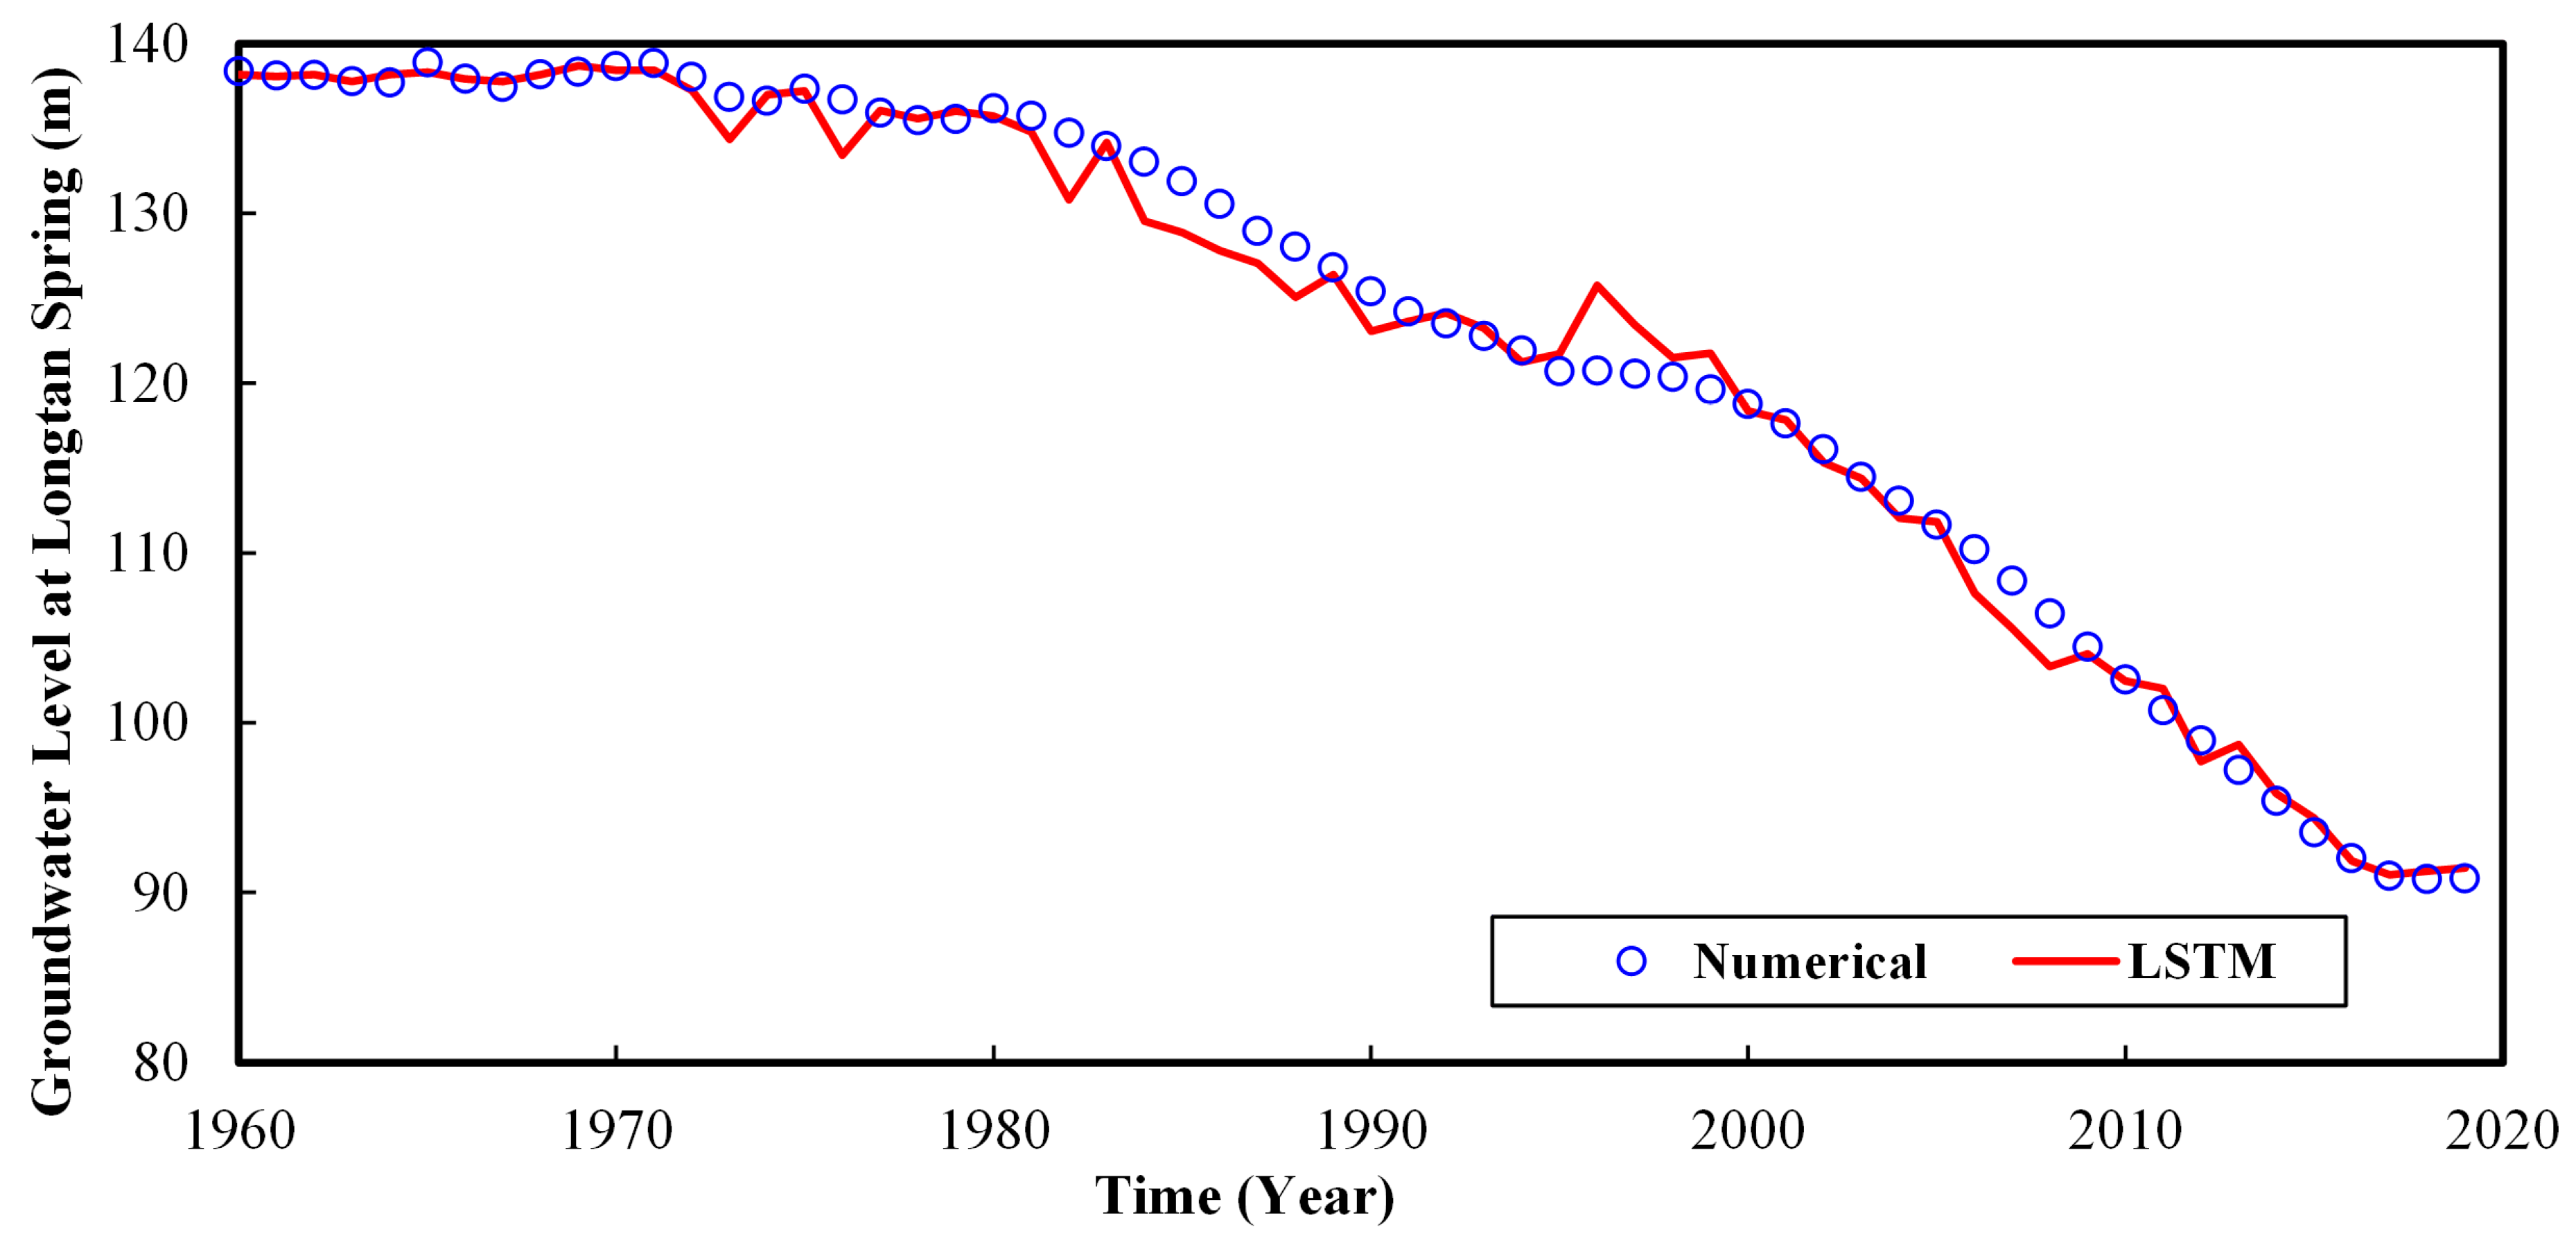
To improve the groundwater management at Longtan Spring, a model is required that can quickly predict groundwater levels, considering various influences. Because numerical modeling is complex and requires specialized knowledge, we are using a simpler alternative model that is still effective for management. Earlier studies in the Beijing Plain [42] tested three data-driven models: the Autoregressive Integrated Moving Average (ARIMA), a Back-Propagation Artificial Neural Network (BP-ANN), and Long Short-Term Memory (LSTM). The LSTM model proved to be the best for predicting monthly changes. So, we are using the LSTM model in this study to track groundwater levels at Longtan Spring, influenced by rain, river water, and the nearby groundwater level at Yutan Spring. We used the model to look at many scenarios with different infiltration from the rain and river. We set rain infiltration at 0, 2, 3, 6, 8, 10, 13, 16, and 20 mm/day and river flow per unit length at 0, 1, 2, 3, 4, 5, 6, 7, 8, and 9 m3/d-m. The numerical model’s results feed into the input of the LSTM model. We compared the groundwater levels predicted by numerical model and LSTM model at Longtan Spring. The results, shown in Figure 11, match almost perfectly, with a correlation of over 0.99. This shows that our model is a reliable tool for managing groundwater.
3.4. Limitation of the Study
The reconstruction of the spring-water-level data in this study relies on a numerical model of groundwater flow, built upon what we know about the karst aquifer in the study area. Therefore, how well we understand the karst aquifer affects the simulation’s reliability. Many parts of the study area are mountainous, with a severe shortage of observation wells for tracking groundwater levels in karst aquifers. This shortage limits our model’s capacity to accurately pinpoint hydrogeological parameters. Additionally, the complex geological conditions of the region mean there is some uncertainty about the hydrogeological structure and parameters in the study area. This includes uncertainties about the karst aquifer’s height, thickness, and how easily water can move through it, as well as how water moves between the karst aquifer and the aquifers above it. Finally, by treating the karst medium as having a uniform permeability, the study introduces errors when trying to model the varied and complex channels within the karst system.
4. Conclusions
Despite the scarcity of data, exploring the origins and characteristics of the spring’s water is a significant challenge. Our study has developed a numerical model that delineates the groundwater flow within the karst aquifer system. Utilizing geological investigation and time-variant water-level data, we have carefully calibrated the model to back-calculate historical groundwater levels near Longtan Spring. Persistent declines in Longtan Spring’s water levels suggest a regional groundwater decrease. Key inflows identified include Lujiatan karst water, Yongding River ecological water infiltration, Junzhuang karst water inputs, and direct rainwater infiltration. Our model tracks groundwater levels from 1960 to 2019, showing strong correlations (above 0.61 from 2000 to 2007) with data from five wells. Estimates for Longtan Spring’s levels (1960–2019) closely match (correlation over 0.97) observed groundwater storage changes, indicating risk to the Tanzhesi spring below 135.65 m. Excessive use of groundwater and insufficient water recharge lead to a regional decline in groundwater levels. Longtan Spring’s recent reduced flow or inactivity is mainly due to lower groundwater levels in the Xishan area.
It is important to highlight that the unseen karst aquifer calls for in-depth study, particularly its height, width, how easily water flows through it, and how it connects with the rocks around it; therefore, more research is fundamentally necessary. Our research offers a practical way to figure out past water levels in karst springs, despite limited data, which is crucial for protecting these important water sources.
Author Contributions
Conceptualization, C.W., D.S. and L.H.; methodology, C.W., D.S., Y.Z. and L.H.; software, Y.Z. and L.H.; validation, C.W., Y.Z. and L.H.; formal analysis, C.W., J.L. and N.Z.; investigation, J.L.; resources, D.S.; writing—original draft preparation, C.W., Y.Z. and L.H.; writing—review and editing, D.S., Y.Z. and L.H.; visualization, J.L.; supervision, Y.Z. and L.H.; project administration, L.H.; funding acquisition, L.H. All authors have read and agreed to the published version of the manuscript.
Funding
This research was funded by Tsinghua University-Ningxia Yinchuan Joint Research Institute of Digital Water Management with the Internet of Water, grant number SKL-IOW-2023TC2307, and the National Natural Science Foundation Project of China, grant number U2167211.
Data Availability Statement
No specific datasets have been developed for this contribution.
Conflicts of Interest
Author Yanwei Zhang was employed by the company Jiangsu Hover Wei Peng Information Technology Co., Ltd. The remaining authors declare that the research was conducted in the absence of any commercial or financial relationships that could be construed as a potential conflict of interest.
References
- Stevanović, Z. Karst waters in potable water supply: A global scale overview. Environ. Earth Sci. 2019, 78, 662. [Google Scholar] [CrossRef]
- Li, Z.W.; Xu, X.L.; Liu, M.X.; Li, X.Z.; Zhang, R.F.; Wang, K.L.; Xu, C.H. State-space prediction of spring discharge in a karst catchment in southwest China. J. Hydrol. 2017, 549, 264–276. [Google Scholar] [CrossRef]
- Scott, T.M. Florida’s springs in jeopardy. Geotimes 2002, 47, 16–20. [Google Scholar]
- Stevanović, S.D.; Krstić, J.N.; Stojanović, B.T.; Paunović, D.Đ.; Dimitrijević, D.S.; Veličković, J.M.; Stanković, N.J. Monitoring of drinking water from the karst springs of the Ljuberadja-Ni water supply system (Serbia). SN Appl. Sci. 2020, 2, 1847. [Google Scholar] [CrossRef]
- Olarinoye, T.; Gleeson, T.; Marx, V.; Seeger, S.; Adinehvand, R.; Allocca, V.; Andreo, B.; Apaéstegui, J.; Apolit, C.; Arfib, B.; et al. Global karst springs hydrograph dataset for research and management of the world’s fastest-flowing groundwater. Sci. Data 2020, 7, 59. [Google Scholar] [CrossRef] [PubMed]
- Benischke, R. Review: Advances in the methodology and application of tracing in karst aquifers. Hydrogeol. J. 2021, 29, 67–88. [Google Scholar] [CrossRef]
- Nerantzaki, S.D.; Nikolaidis, N.P. The response of three Mediterranean karst springs to drought and the impact of climate change. J. Hydrol. 2020, 591, 125296. [Google Scholar] [CrossRef]
- Fiorillo, F.; Leone, G.; Pagnozzi, M.; Esposito, L. Long-term trends in karst spring discharge and relation to climate factors and changes. Hydrogeol. J. 2021, 29, 347–377. [Google Scholar] [CrossRef]
- Kovács, A.; Perrochet, P.; László, K.; Jeannin, P.Y. A quantitative method for the characterisation of karst aquifers based on spring hydrograph analysis. J. Hydrol. 2005, 303, 152–164. [Google Scholar] [CrossRef]
- Filippini, M.; Squarzoni, G.; Waele, J.; Fiorucci, A.; Vigna, B.; Grillo, B.; Riva, A.; Rossetti, S.; Zini, L.; Giacomo, G.; et al. Differentiated spring behavior under changing hydrological conditions in an alpine karst aquifer. J. Hydrol. 2018, 556, 572–584. [Google Scholar] [CrossRef]
- Yang, M.; Yaquian, J.A.; Annable, M.D.; Jawitz, J.W. Karst conduit contribution to spring discharge and aquifer cross-sectional area. J. Hydrol. 2019, 578, 124037. [Google Scholar] [CrossRef]
- Moore, P.J.; Martin, J.B.; Screaton, E.J. Geochemical and statistical evidence of recharge, mixing, and controls on spring discharge in an eogenetic karst aquifer. J. Hydrol. 2009, 376, 443–455. [Google Scholar] [CrossRef]
- Pratama, A.D.; Dwiputra, D.S.; Nurkholis, A.; Haryono, E.; Cahyadi, A.; Agniy, R.F.; Adji, T.N. Factors affecting hydrochemistry of karst springs and their relationship to aquifer development. Environ. Process. 2021, 8, 1379–1413. [Google Scholar] [CrossRef]
- Knöll, P.; Zirlewagen, J.; Scheytt, T. Using radar-based quantitative precipitation data with coupled soil- and groundwater balance models for stream flow simulation in a karst area. J. Hydrol. 2020, 586, 124884. [Google Scholar] [CrossRef]
- Al-Halbouni, D.; Watson, R.; Holohan, E.; Meyer, R.; Polom, U.; Dos Santos, F.M.D.; Comas, X.; Alrshdan, H.; Krawczyk, C.; Dahm, T. Dynamics of hydrological and geomorphological processes in evaporite karst at the eastern Dead Sea—A multidisciplinary study. Hydrol. Earth Syst. Sci. 2021, 25, 3351–3395. [Google Scholar] [CrossRef]
- Sen, Z. General modeling of karst spring hydrographs and development of a dimensionless karstic hydrograph concept. Hydrogeol. J. 2020, 28, 549–559. [Google Scholar] [CrossRef]
- Hartmann, A.; Baker, A. Modelling karst vadose zone hydrology and its relevance for paleoclimate reconstruction. Earth-Sci. Rev. 2017, 172, 178–192. [Google Scholar] [CrossRef]
- Sun, J.C.; Hu, L.T.; Chen, F.; Sun, K.N.; Yu, L.L.; Liu, X. Downscaling simulation of groundwater storage in the Beijing, Tianjin, and Hebei regions of China based on GRACE data. Remote Sens. 2023, 15, 1490. [Google Scholar] [CrossRef]
- Mangiarotti, S.; Zhang, Y.; Leblanc, M. Chaos theory applied to the modelling of karst springs: First results from univariate time series. Hydrogeol. J. 2019, 27, 2027–2043. [Google Scholar] [CrossRef]
- Hu, C.H.; Hao, Y.H.; Yeh, T.C.J.; Pang, B.; Wu, Z.N. Simulation of spring flows from a karst aquifer with an artificial neural network. Hydrol. Process. 2008, 22, 596–604. [Google Scholar] [CrossRef]
- Nhu, V.H.; Rahmati, O.; Falah, F.; Shojaei, S.; AI-Ansari, N.; Shahabi, H.; Shirzadi, A.; Górski, K.; Nguyen, H.; Bin Ahmad, B. Mapping of groundwater spring potential in karst aquifer system using novel ensemble bivariate and multivariate models. Water 2020, 12, 985. [Google Scholar] [CrossRef]
- Song, X.H.; Hao, H.Q.; Liu, W.Q.; Wang, Q.; An, L.X.; Yeh, T.C.J.; Hao, Y.H. Spatial-temporal behavior of precipitation driven karst spring discharge in a mountain terrain. J. Hydrol. 2022, 612, 128116. [Google Scholar] [CrossRef]
- Basu, B.; Morrissey, P.; Gill, L. Application of nonlinear time series and machine learning algorithms for forecasting groundwater flooding in a lowland karst area. Water Resour. Res. 2022, 58, e2021WR029576. [Google Scholar] [CrossRef]
- Sepúlveda, N.; Tiedeman, C.R.; O’Reilly, A.M.; Davis, J.B.; Patrick, B. Groundwater Flow and Water Budget in the Surficial and Floridan Aquifer Systems in East-Central Florida; U.S. Geological Survey Scientific Investigations Report 2012–5161; U.S. Geological Survey: Reston, VI, USA, 2012; 214p.
- Eisenlohr, L.; Kiraly, L.; Bouzelboudjen, M.; Rossier, Y. Numerical simulation as a tool for checking the interpretation of karst spring hydrographs. J. Hydrol. 1997, 193, 306–315. [Google Scholar] [CrossRef]
- Birk, S.; Liedl, R.; Sauter, M. Karst spring responses examined by process-based modeling. Ground Water 2006, 44, 832–836. [Google Scholar] [CrossRef] [PubMed]
- Geyer, T.; Birk, S.; Liedl, R.; Sauter, M. Quantification of temporal distribution of recharge in karst systems from spring hydrographs. J. Hydrol. 2008, 348, 452–463. [Google Scholar] [CrossRef]
- Butscher, C.; Huggenberger, P. Intrinsic vulnerability assessment in karst areas: A numerical modeling approach. Water Resour. Res. 2008, 44, 2007WR006277. [Google Scholar] [CrossRef]
- Scanlon, B.R.; Mace, R.E.; Barrett, M.B.; Smith, B. Can we simulate regional groundwater flow in a karst system using equivalent porous media models? Case study, Barton Springs Edwards aquifer, USA. J. Hydrol. 2003, 276, 137–158. [Google Scholar] [CrossRef]
- Fleury, P.; Ladouche, B.; Conroux, Y.; Jourde, H.; Dörfliger, N. Modelling the hydrologic functions of a karst aquifer under active water management–the Lez spring. J. Hydrol. 2009, 365, 235–243. [Google Scholar] [CrossRef]
- Beijing Institute of Geology; Beijing Institute of Geo-Environment Monitoring. Monograph on the Springs in the Beijing Area; Geological Publishing House: Beijing, China, 2022. (In Chinese) [Google Scholar]
- Sun, K.N.; Hu, L.T.; Guo, J.L.; Yang, Z.Q.; Zhai, Y.Z.; Zhang, S.Q. Enhancing the understanding of hydrological responses induced by ecological water replenishment using improved machine learning models: A case study in the Yongding River. Sci. Total Environ. 2021, 768, 145489. [Google Scholar] [CrossRef]
- Sun, K.N.; Hu, L.T.; Sun, J.C.; Zhai, Y.Z.; Zhang, S.Q.; Cao, X.Y. Quantifying the contribution of ecological water replenishment on aquifer recovery using a refined groundwater model. Sci. Total Environ. 2023, 857, 159216. [Google Scholar] [CrossRef]
- Wang, L.J.; Zhang, Y.Q.; Gong, H.L.; Yang, G.Q.; Liu, J.R.; Sun, Y. A study on recovery condition of Yuquanshan spring in Beijing. Hydrogeol. Eng. Geol. 2016, 43, 22–28, (In Chinese with English Abstract). [Google Scholar]
- Qin, D.J.; Sun, J.; Guo, Y.; Liu, L.; Mohammed, H.; Wang, D.D.; Liu, W.C. Impacts of Yongding River on the Xishan karst aquifer and Yuquan spring in Beijing, China. J. Eng. Geol. 2019, 27, 162–169, (In Chinese with English Abstract). [Google Scholar]
- Shen, Y.Y.; Guo, G.X.; Ou, Z.L.; Xin, B.D.; Nan, Y.H.; Wang, L.Y.; Wang, S.F.; Liu, J.R. Recovery scheme of Yuquanshan spring in Beijing. South-North Water Transf. Water Sci. Technol. 2021, 19, 645–655, (In Chinese with English Abstract). [Google Scholar]
- Li, G.H.; Pan, X.Y.; Li, B.H.; Yang, Y.; Yang, M.Y.; Zhang, D.; OUYang, Y. Study on the Ecological Replenishment of Yongding River (Beijing Section) to Yuquan Mountain Spring in Autumn. J. China Hydrol. 2023, 43, 30–34, (In Chinese with English Abstract). [Google Scholar]
- Zhao, C.H.; Liang, Y.P.; Wang, W.T.; Tang, C.L.; Shen, H.Y. Discussion on the characteristics of karst water systems in the Xishan area of Beijing. Carsologica Sin. 2017, 36, 641–647, (In Chinese with English Abstract). [Google Scholar]
- Hu, L.; Wang, Z.J.; Tian, W.; Zhao, J.S. Coupled surface water–groundwater model and its application in the arid Shiyang River basin, China. Hydrol. Process. 2010, 23, 2033–2044. [Google Scholar] [CrossRef]
- Civita, M.V. An improved method for delineating source protection zones for karst springs based on analysis of recession curve data. Hydrogeol. J. 2008, 16, 855–869. [Google Scholar] [CrossRef]
- Daher, W.; Pistre, S.; Kneppers, A.; Najem, W. Karst and artificial recharge: Theoretical and practical problems: A preliminary approach to artificial recharge assessment. J. Hydrol. 2011, 408, 189–202. [Google Scholar] [CrossRef]
- Sun, J.C.; Hu, L.T.; Li, D.D.; Sun, K.N.; Yang, Z.Q. Data-driven models for accurate groundwater level prediction and their practical significance in groundwater management. J. Hydrol. 2022, 608, 127630. [Google Scholar] [CrossRef]
Figure 1.
Map of the study area. (a) The study area; (b) the cross-sectional line along AA′.
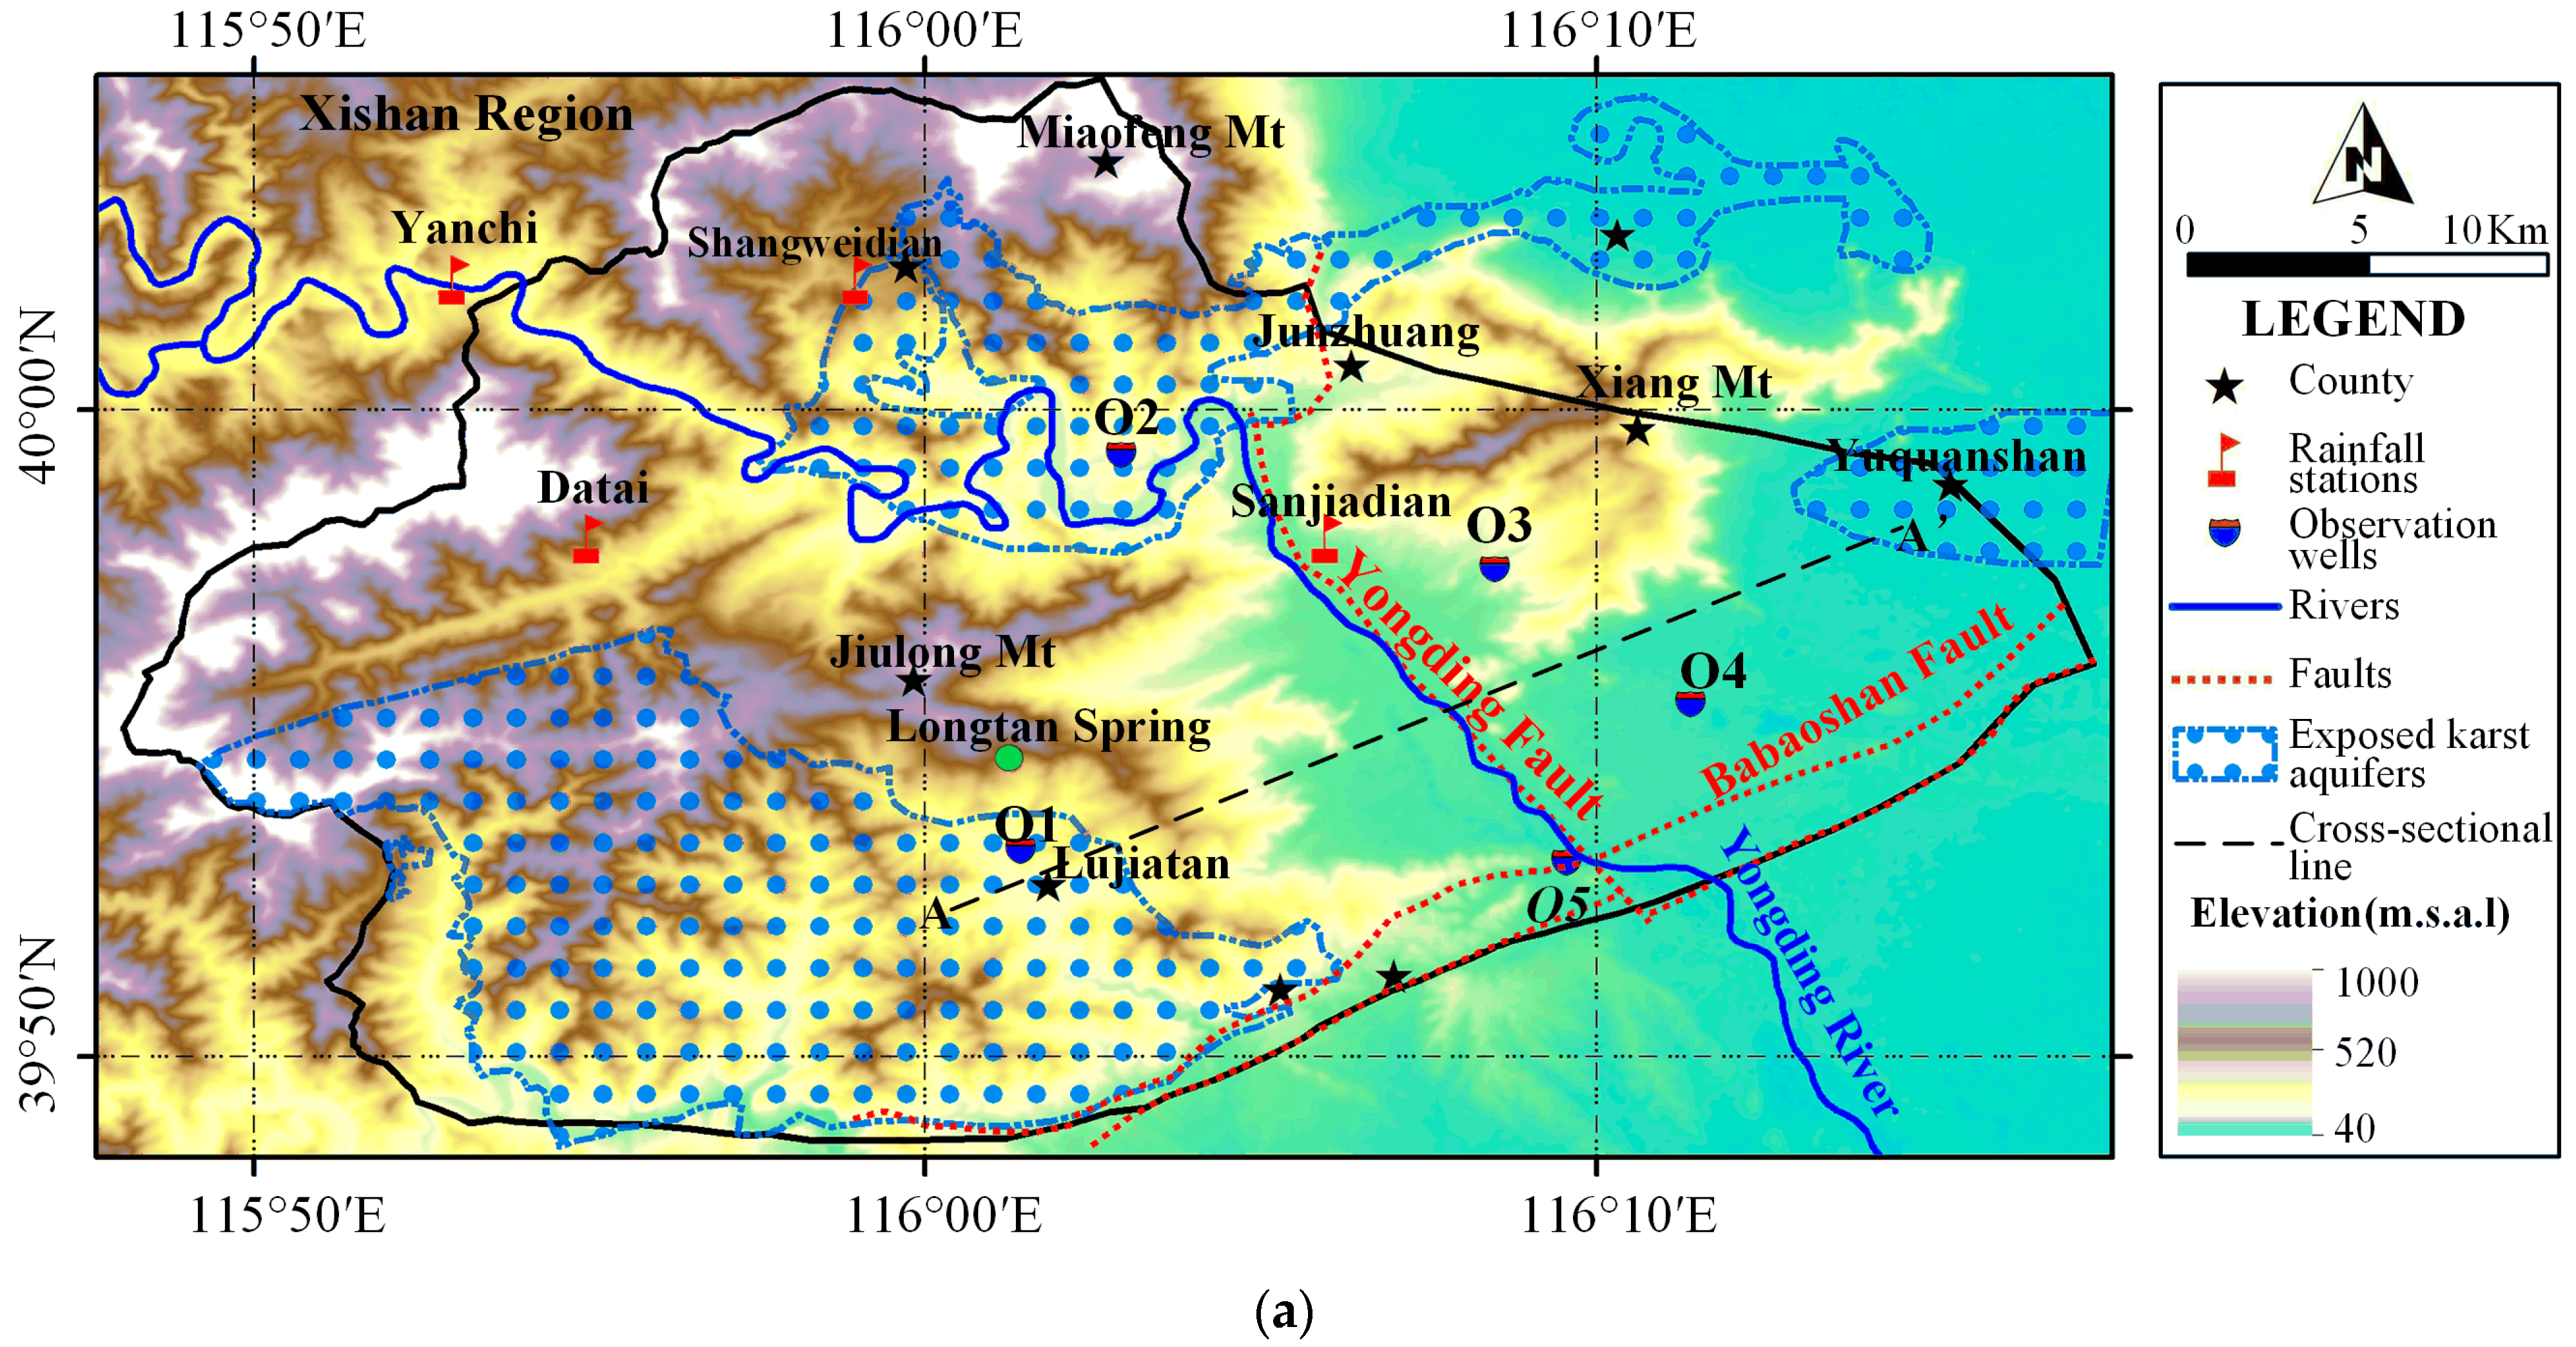
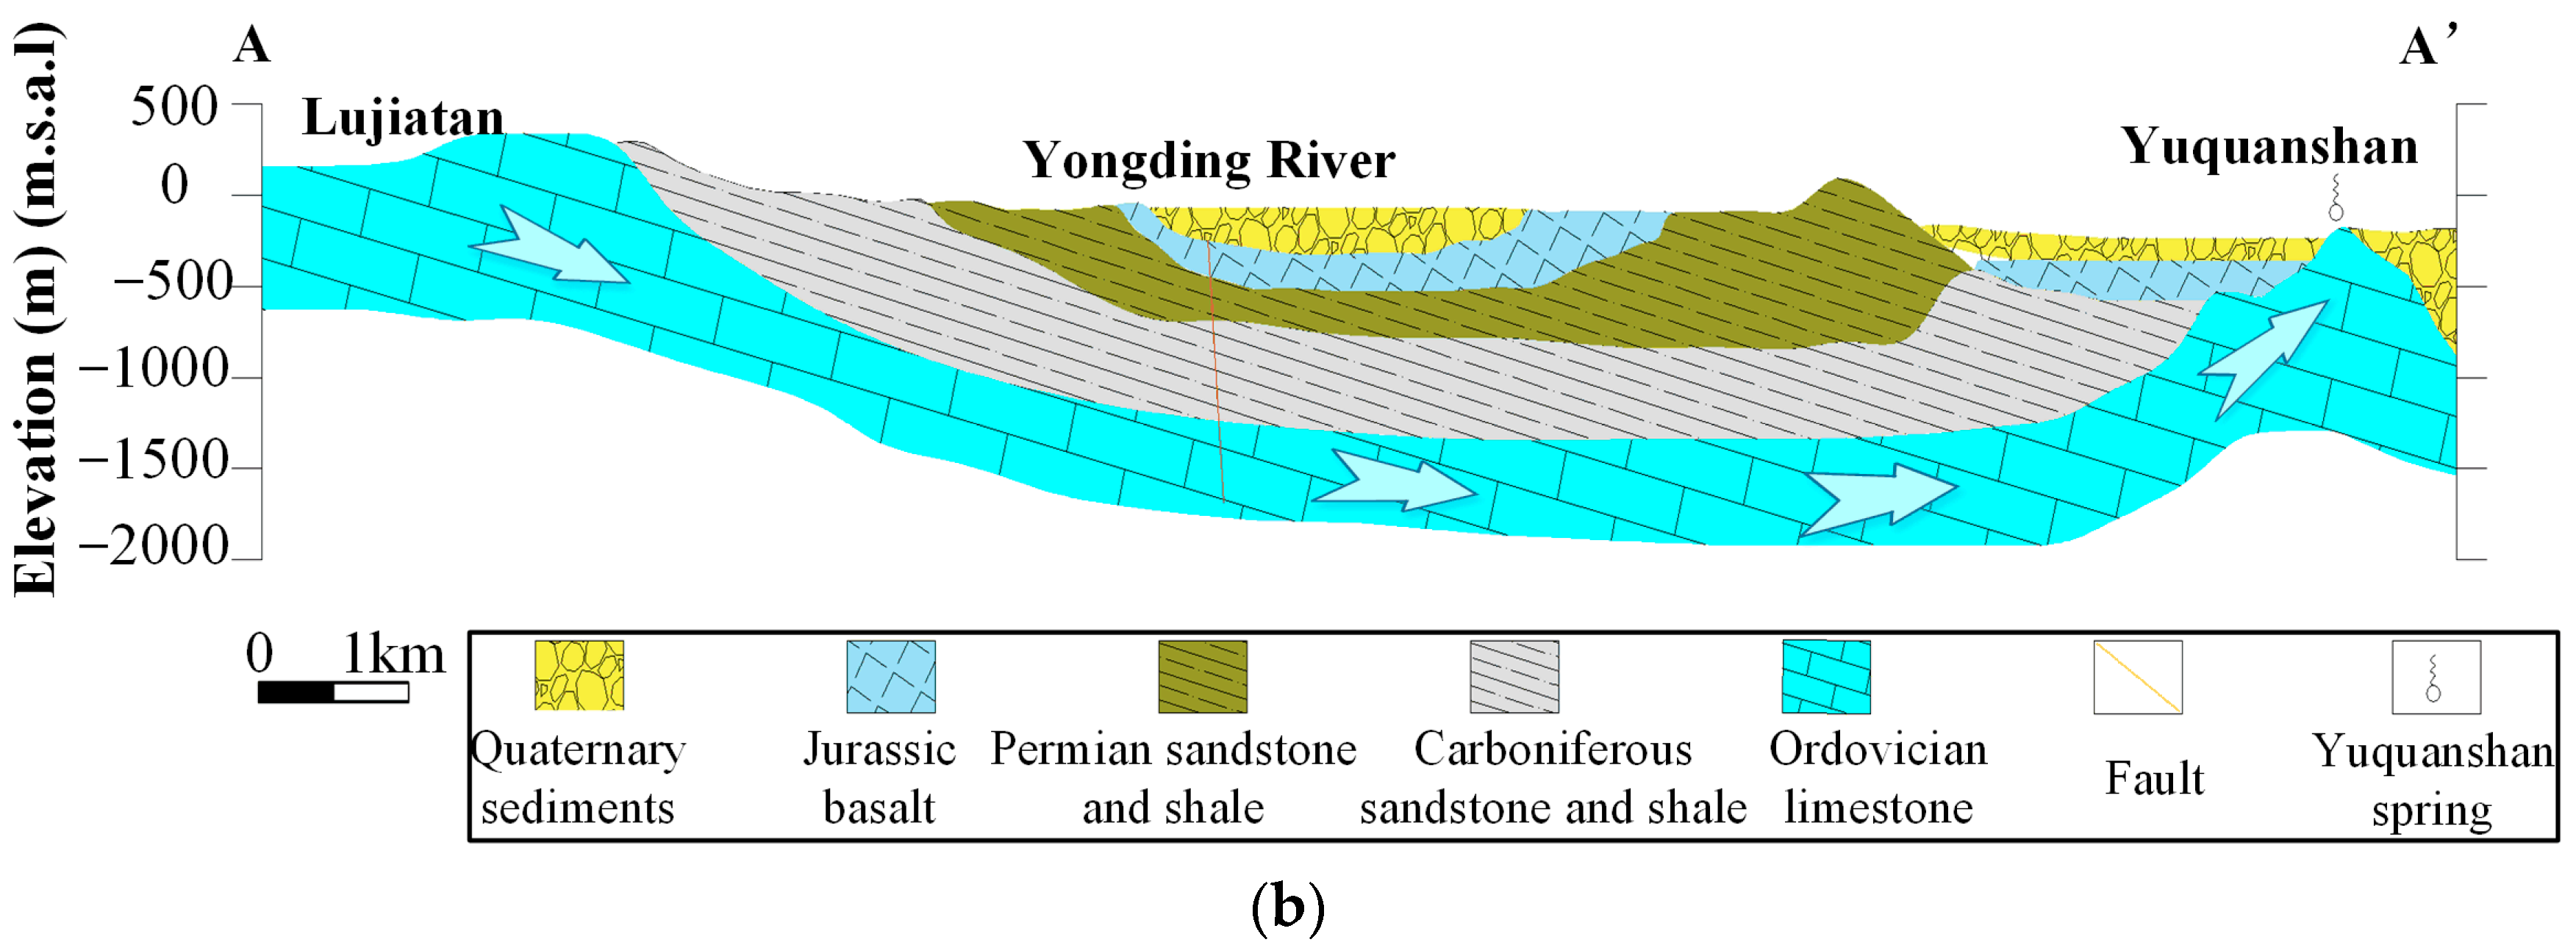
Figure 2.
Monthly changes of rainfall and runoff at Sanjiadian station from 1960 to 2019.
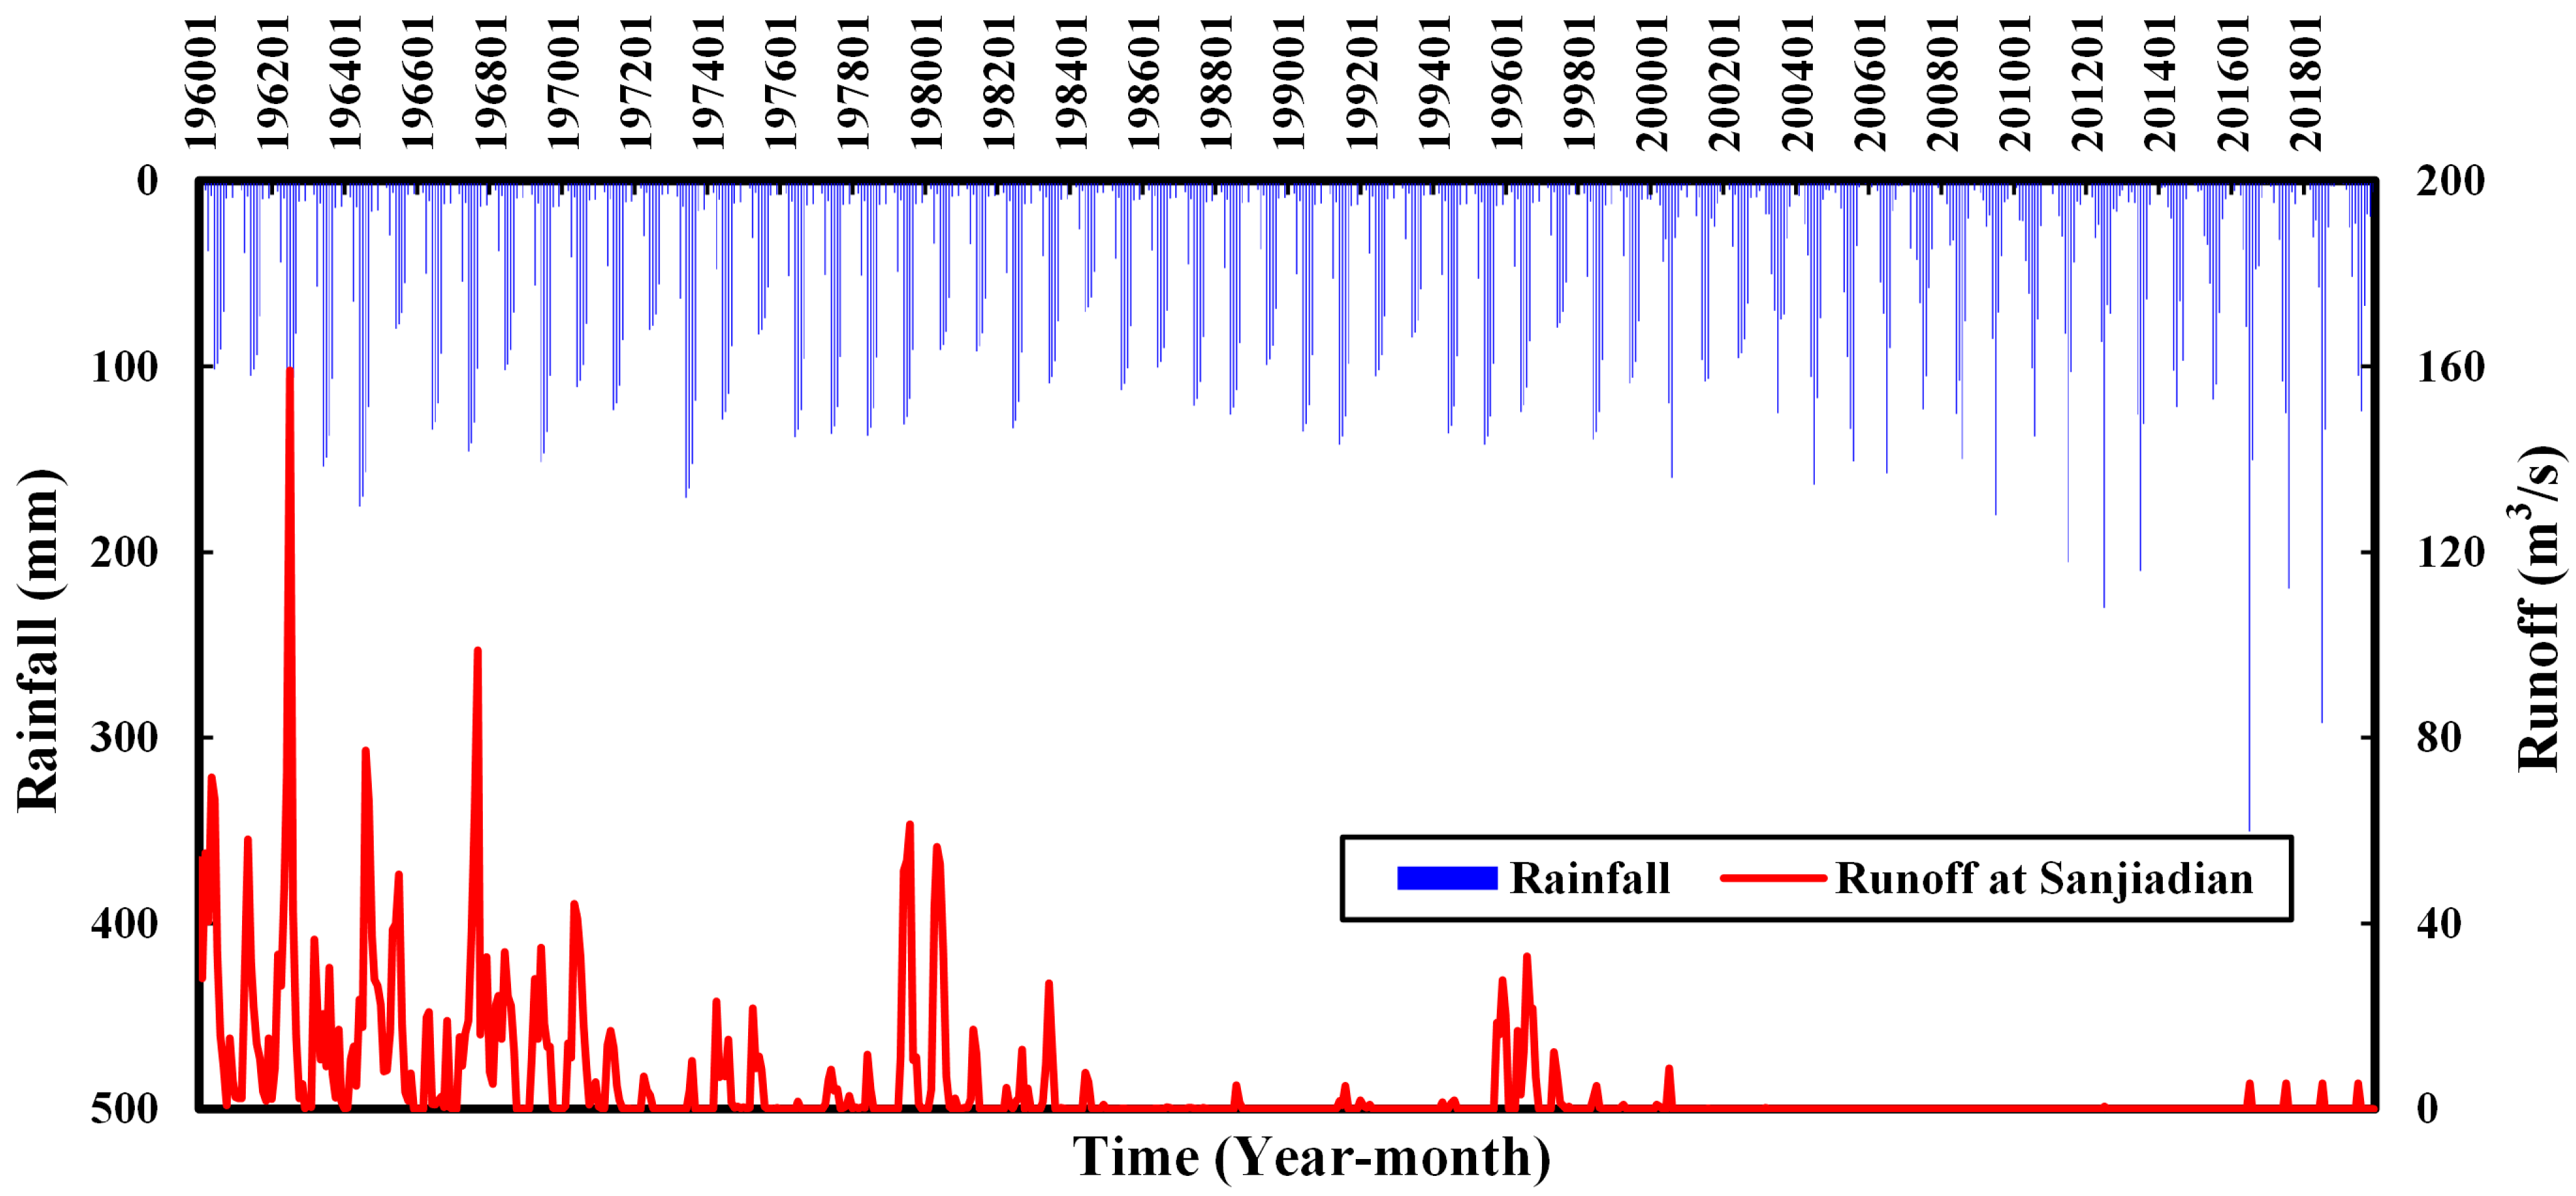
Figure 3.
Surface elevation map of the karst aquifer in the study area (Bd. represents boundary conditions).
Figure 3.
Surface elevation map of the karst aquifer in the study area (Bd. represents boundary conditions).

Figure 4.
Hydrogeological parameter zonation maps: (a) hydraulic conductivity zones; (b) rainfall infiltration coefficient zones.
Figure 4.
Hydrogeological parameter zonation maps: (a) hydraulic conductivity zones; (b) rainfall infiltration coefficient zones.

Figure 5.
Comparison of observed and simulated groundwater levels from 2000 to 2007 in five observation wells.
Figure 5.
Comparison of observed and simulated groundwater levels from 2000 to 2007 in five observation wells.
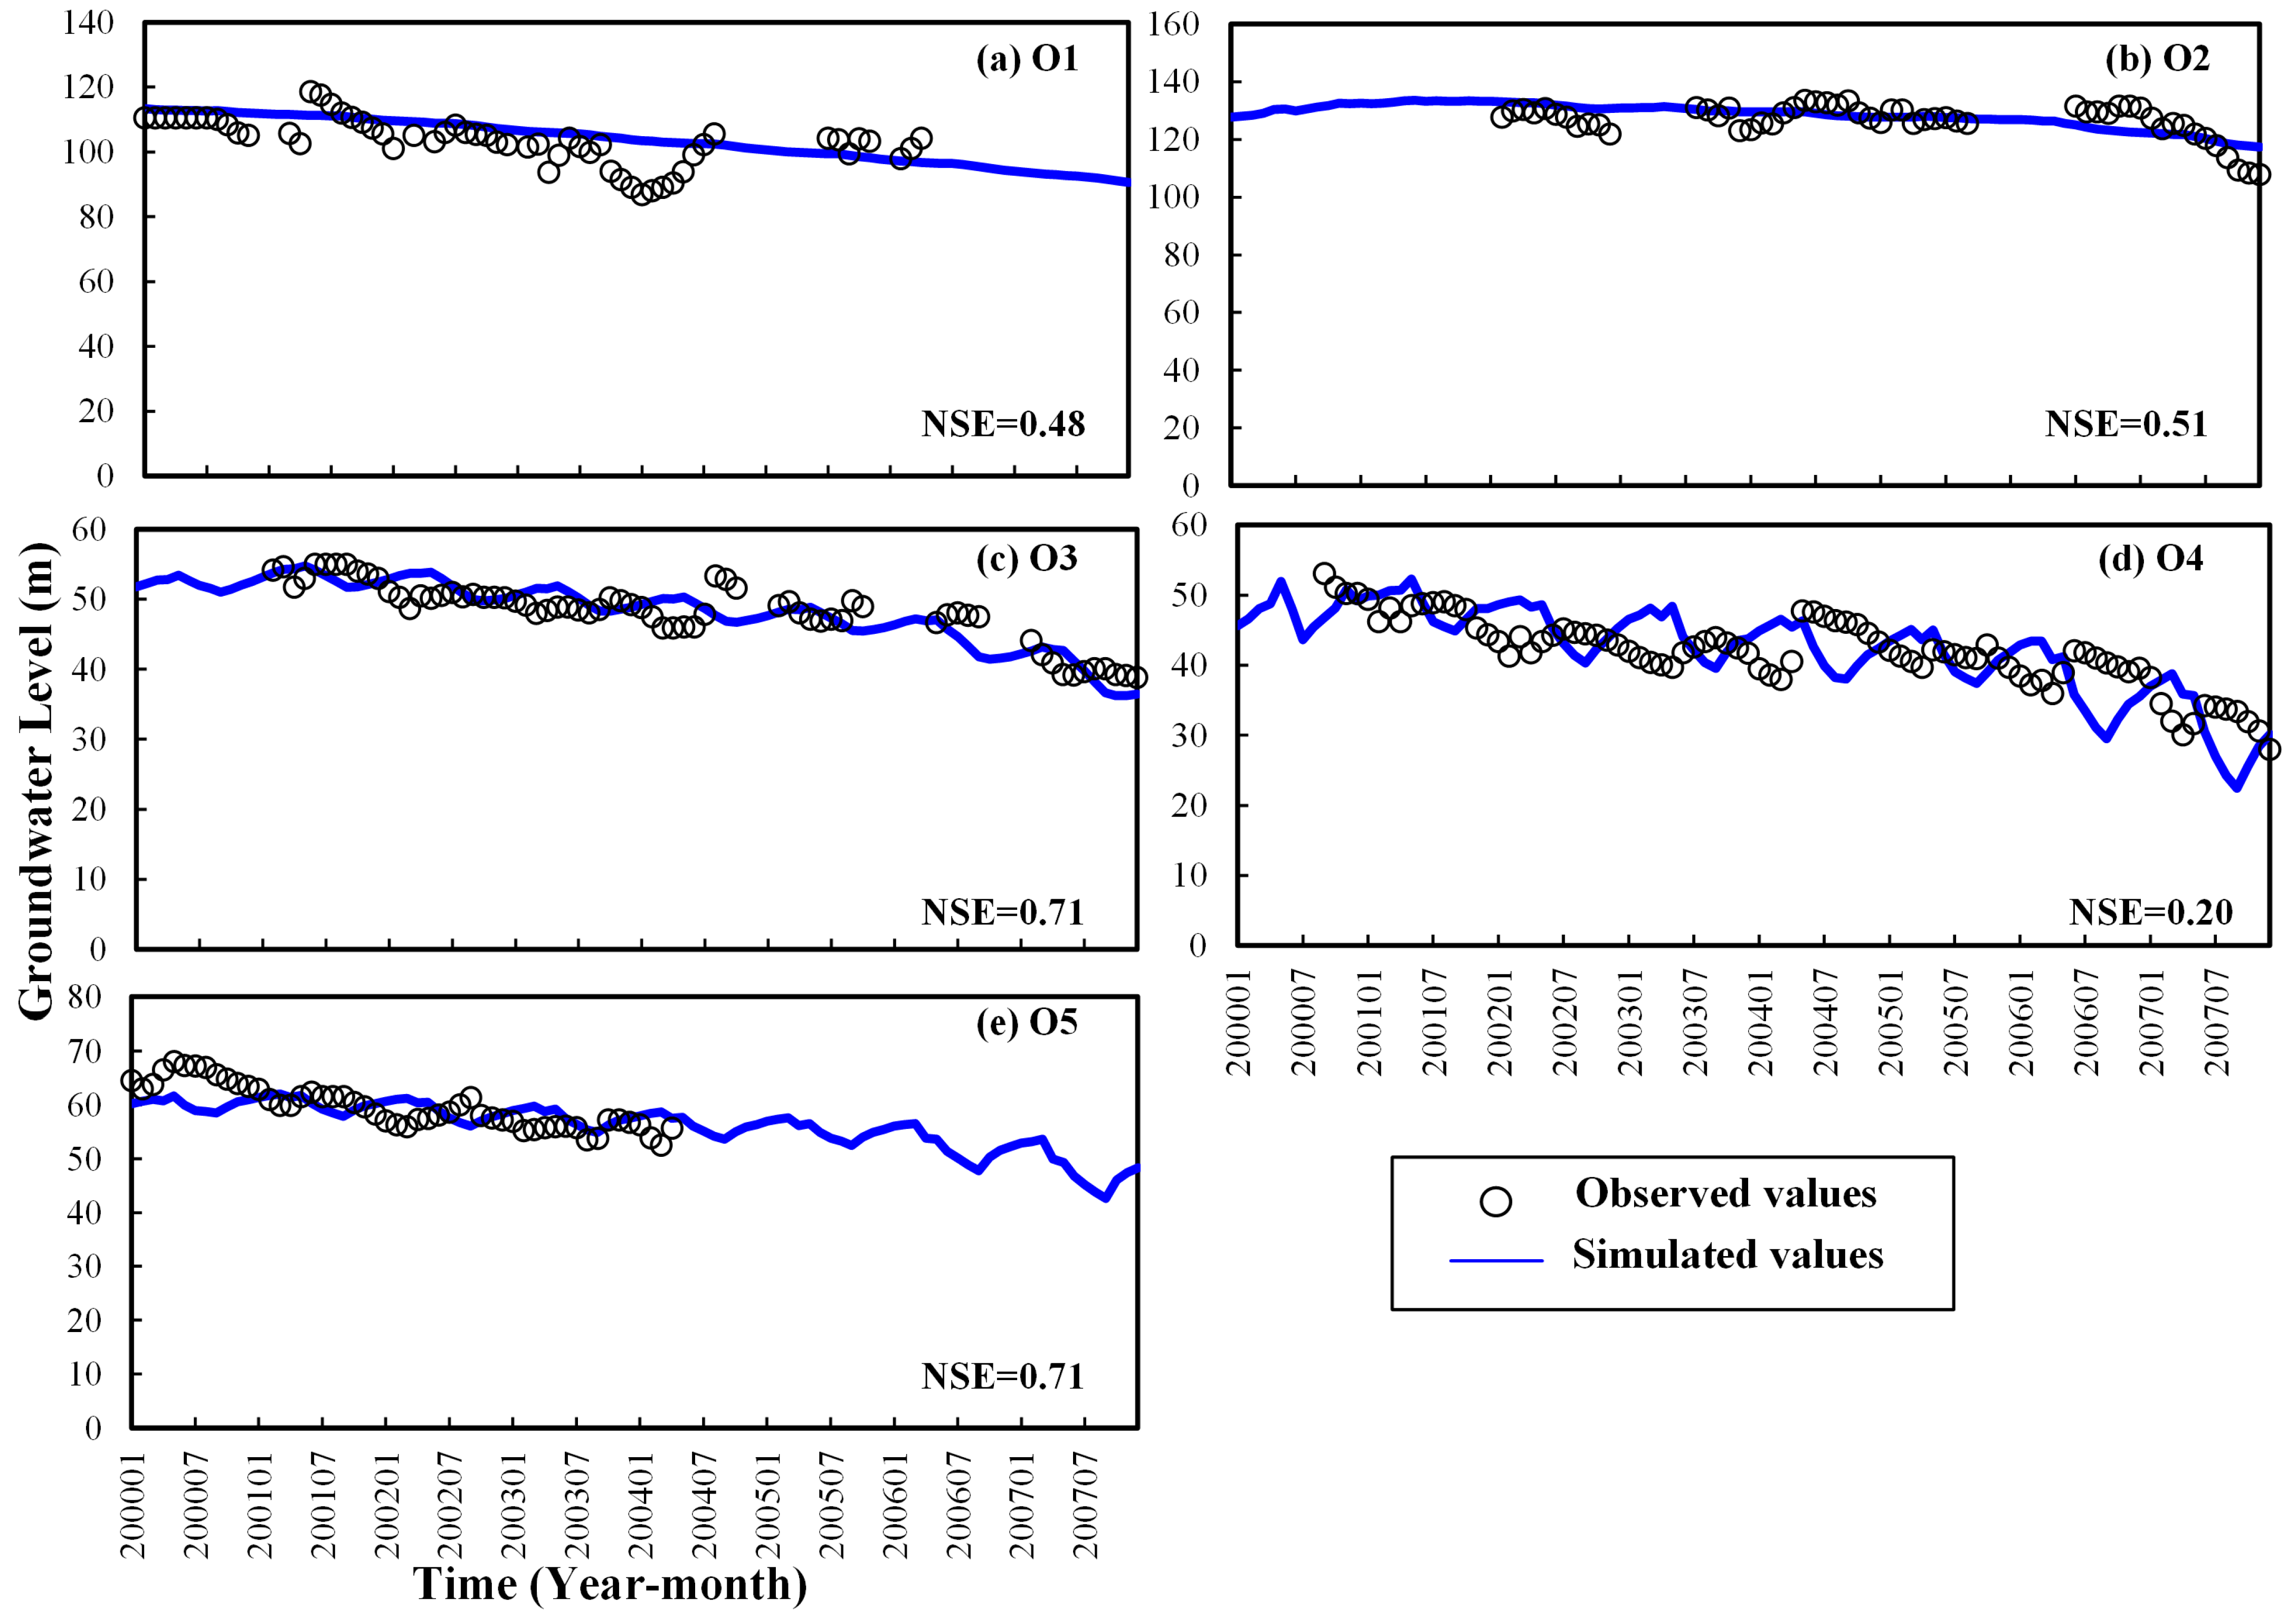
Figure 6.
Spatial zonation of recharge, runoff, and discharge within the groundwater system of the study area.
Figure 6.
Spatial zonation of recharge, runoff, and discharge within the groundwater system of the study area.
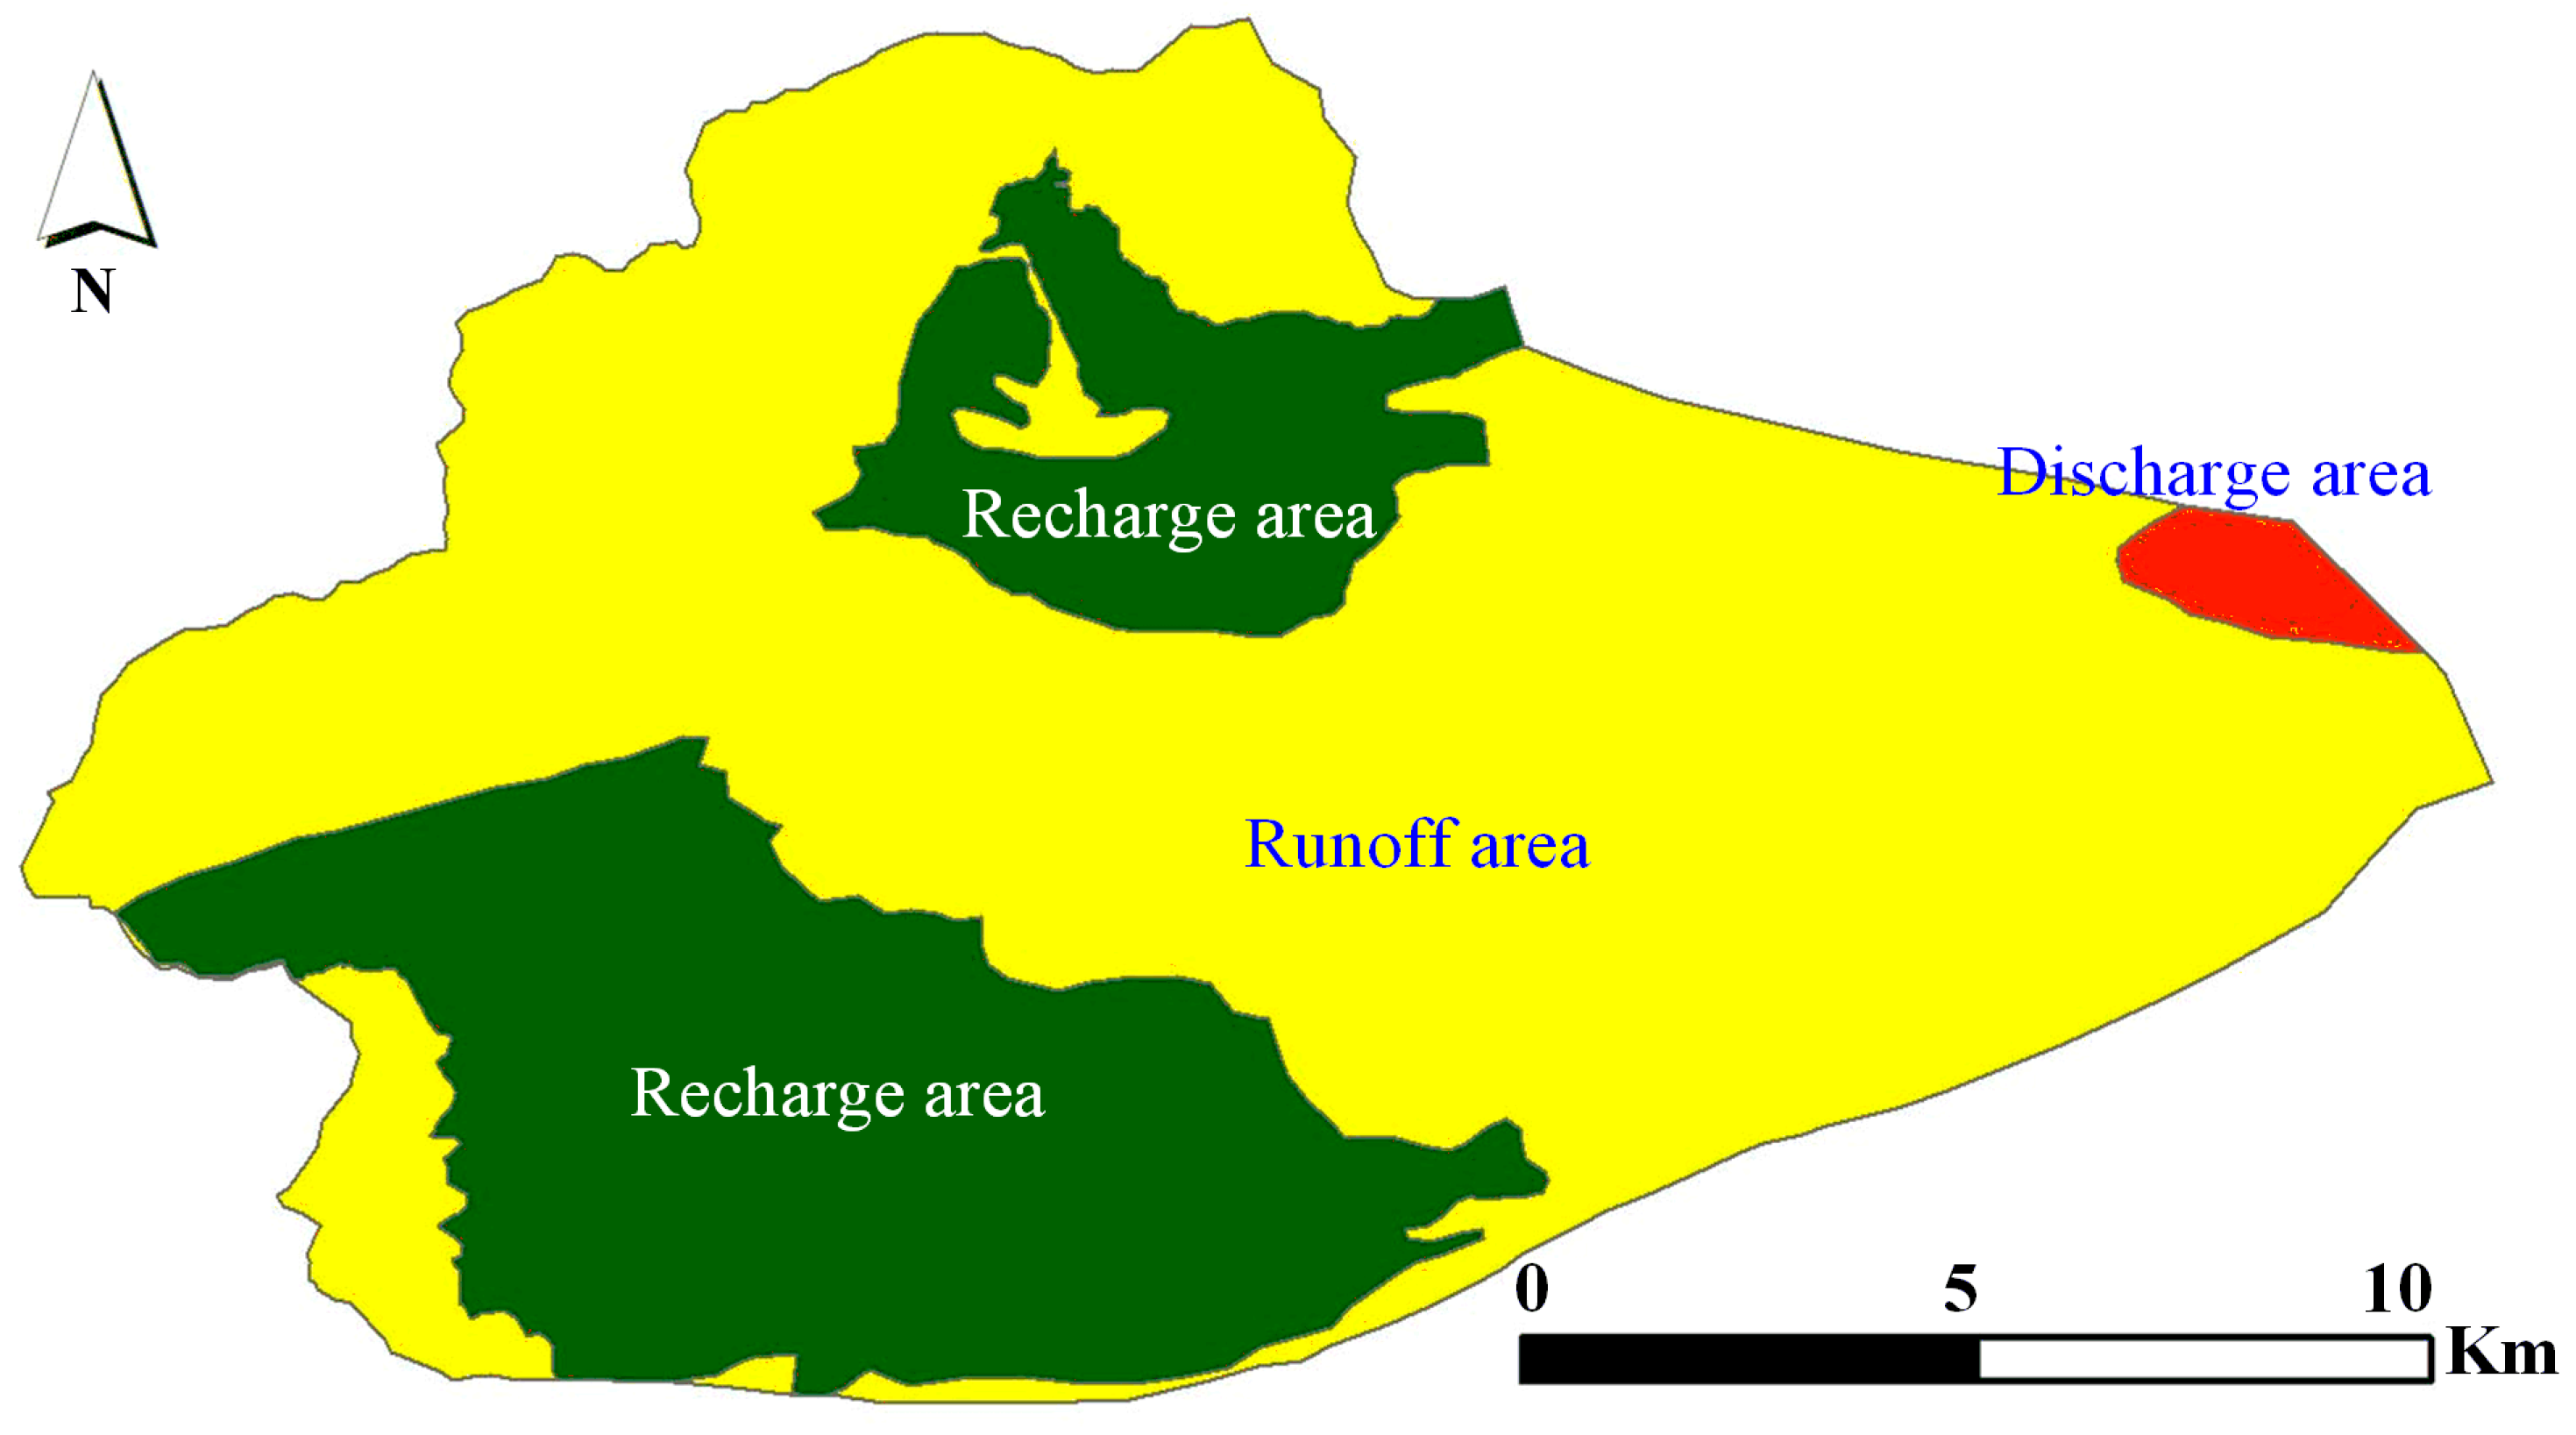
Figure 7.
Change of reconstructed groundwater levels for five observation wells during the period from 1960 to 2019.
Figure 7.
Change of reconstructed groundwater levels for five observation wells during the period from 1960 to 2019.

Figure 8.
Temporal color maps of groundwater levels in the study area for the end of years 1960 (a), 1980 (b), 2000 (c), and 2019 (d).
Figure 8.
Temporal color maps of groundwater levels in the study area for the end of years 1960 (a), 1980 (b), 2000 (c), and 2019 (d).
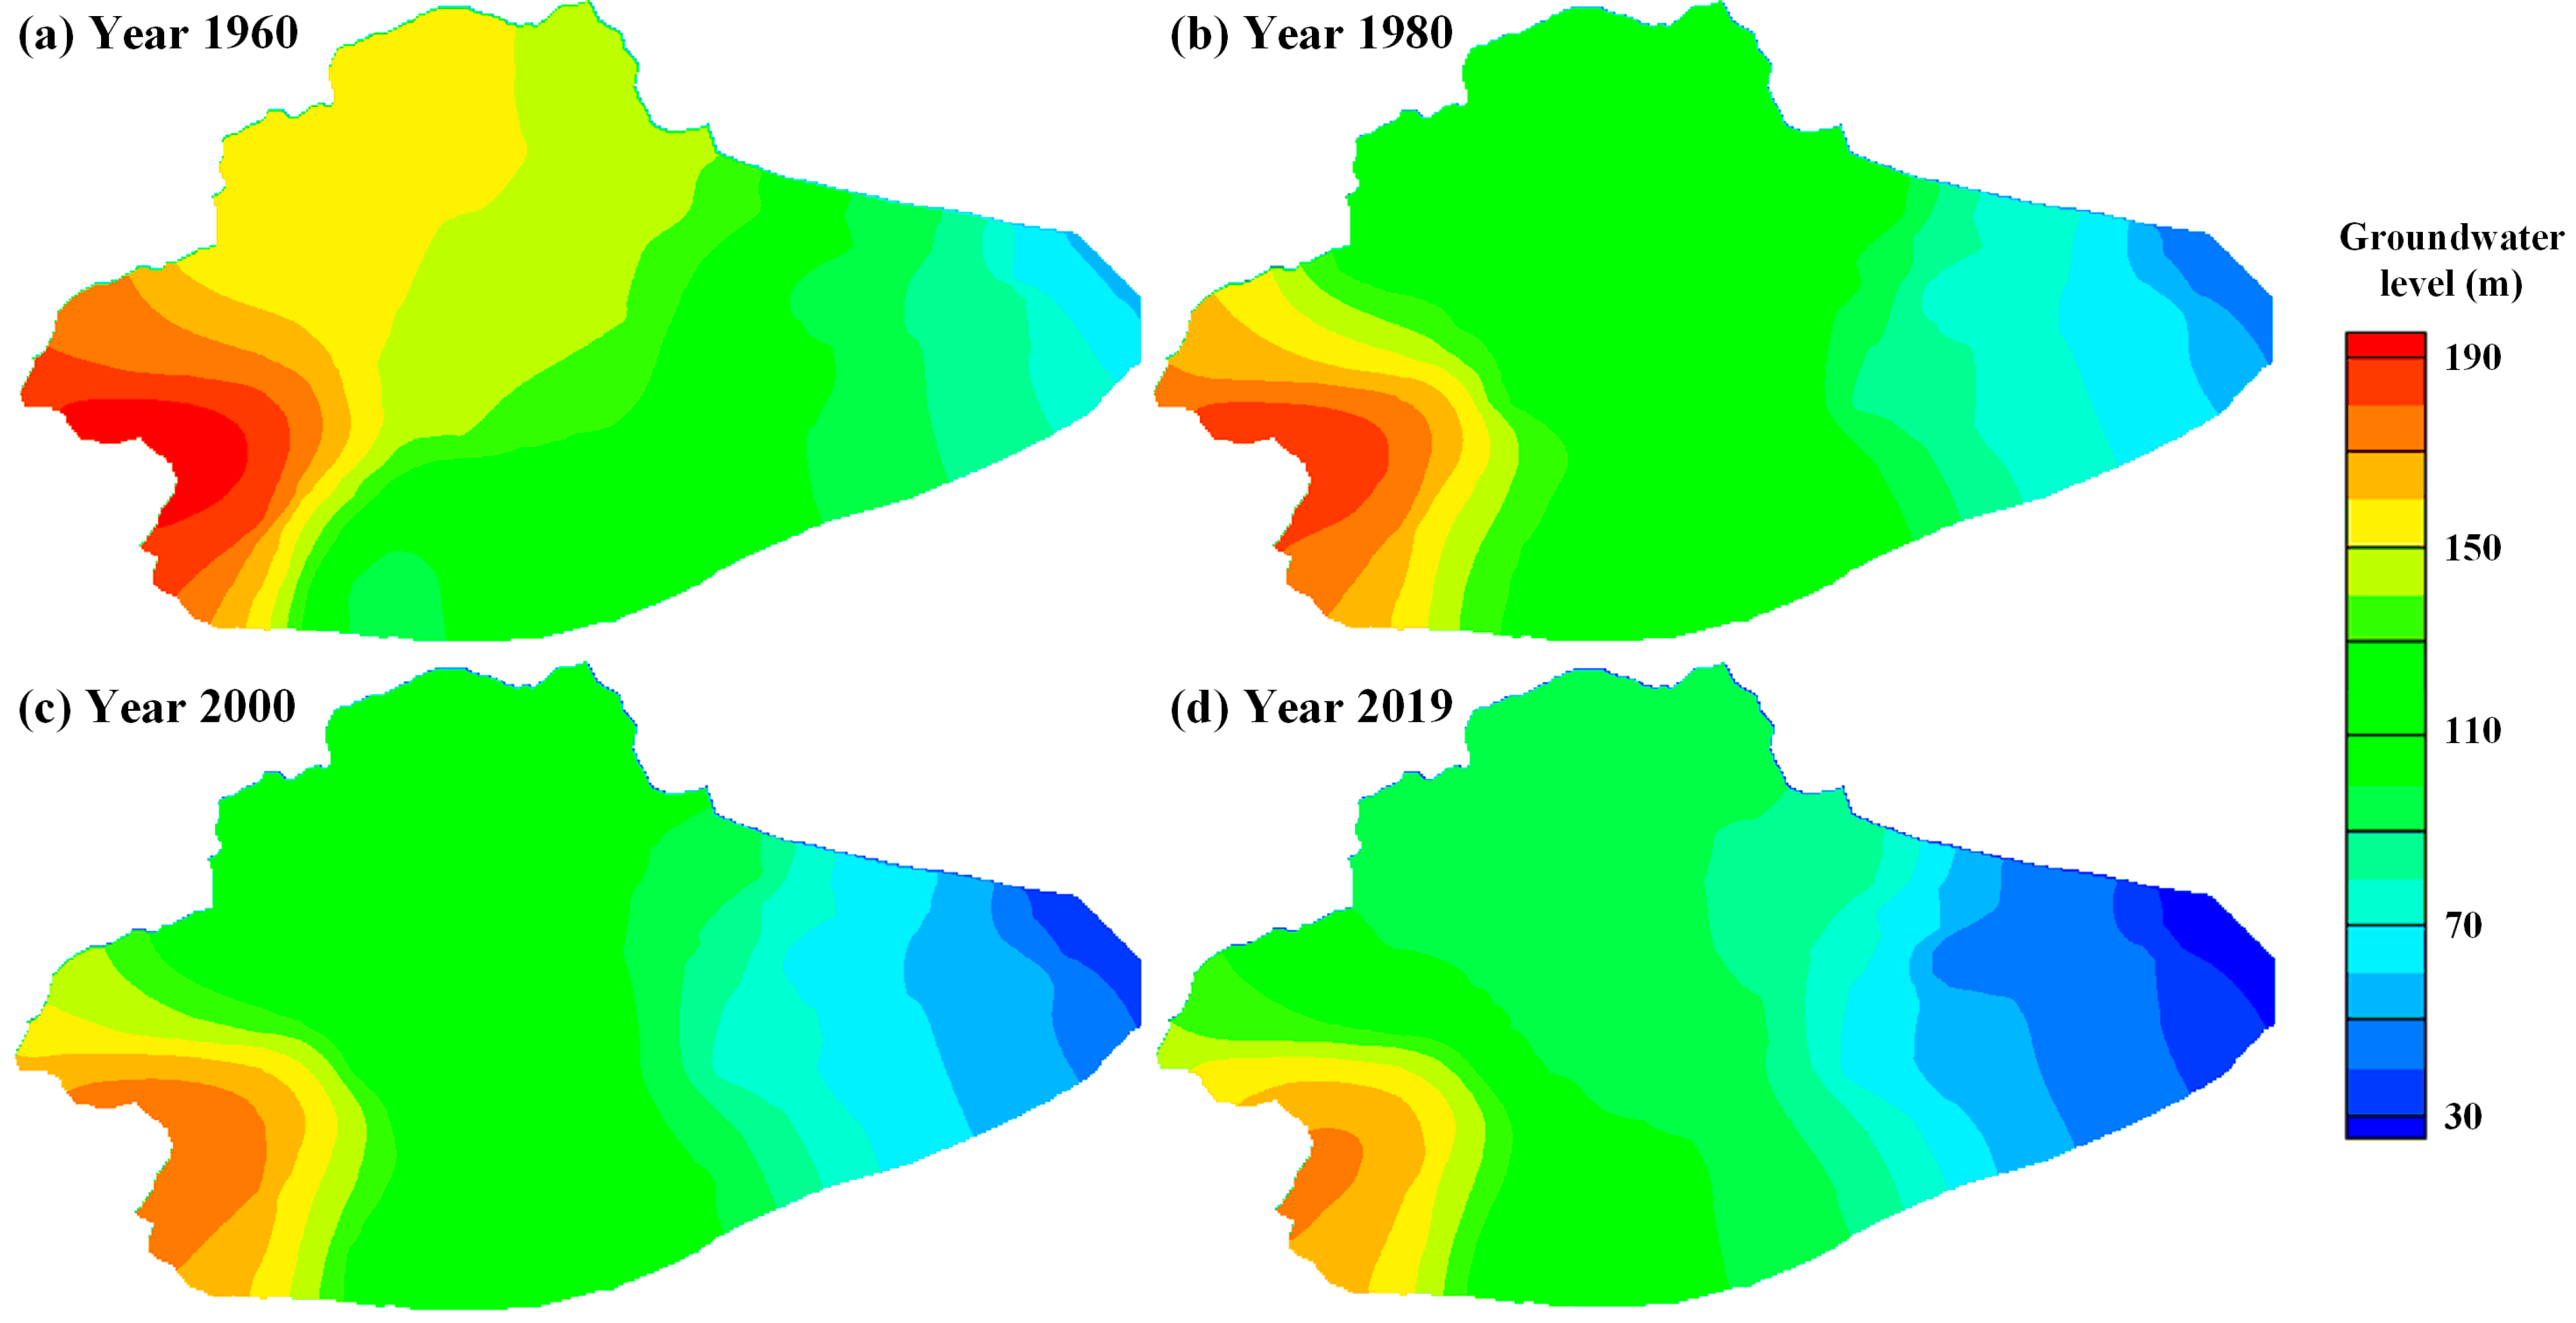
Figure 9.
Annual variations in groundwater level at Longtan Spring, with corresponding rainfall and runoff at Sanjiandian station from 1960 to 2019.
Figure 9.
Annual variations in groundwater level at Longtan Spring, with corresponding rainfall and runoff at Sanjiandian station from 1960 to 2019.

Figure 10.
Comparative analysis of the reconstructed groundwater levels at Longtan Spring and in groundwater storage changes (GWSCs) for the corresponding grid pixel [18] from 2003 to 2019.
Figure 10.
Comparative analysis of the reconstructed groundwater levels at Longtan Spring and in groundwater storage changes (GWSCs) for the corresponding grid pixel [18] from 2003 to 2019.
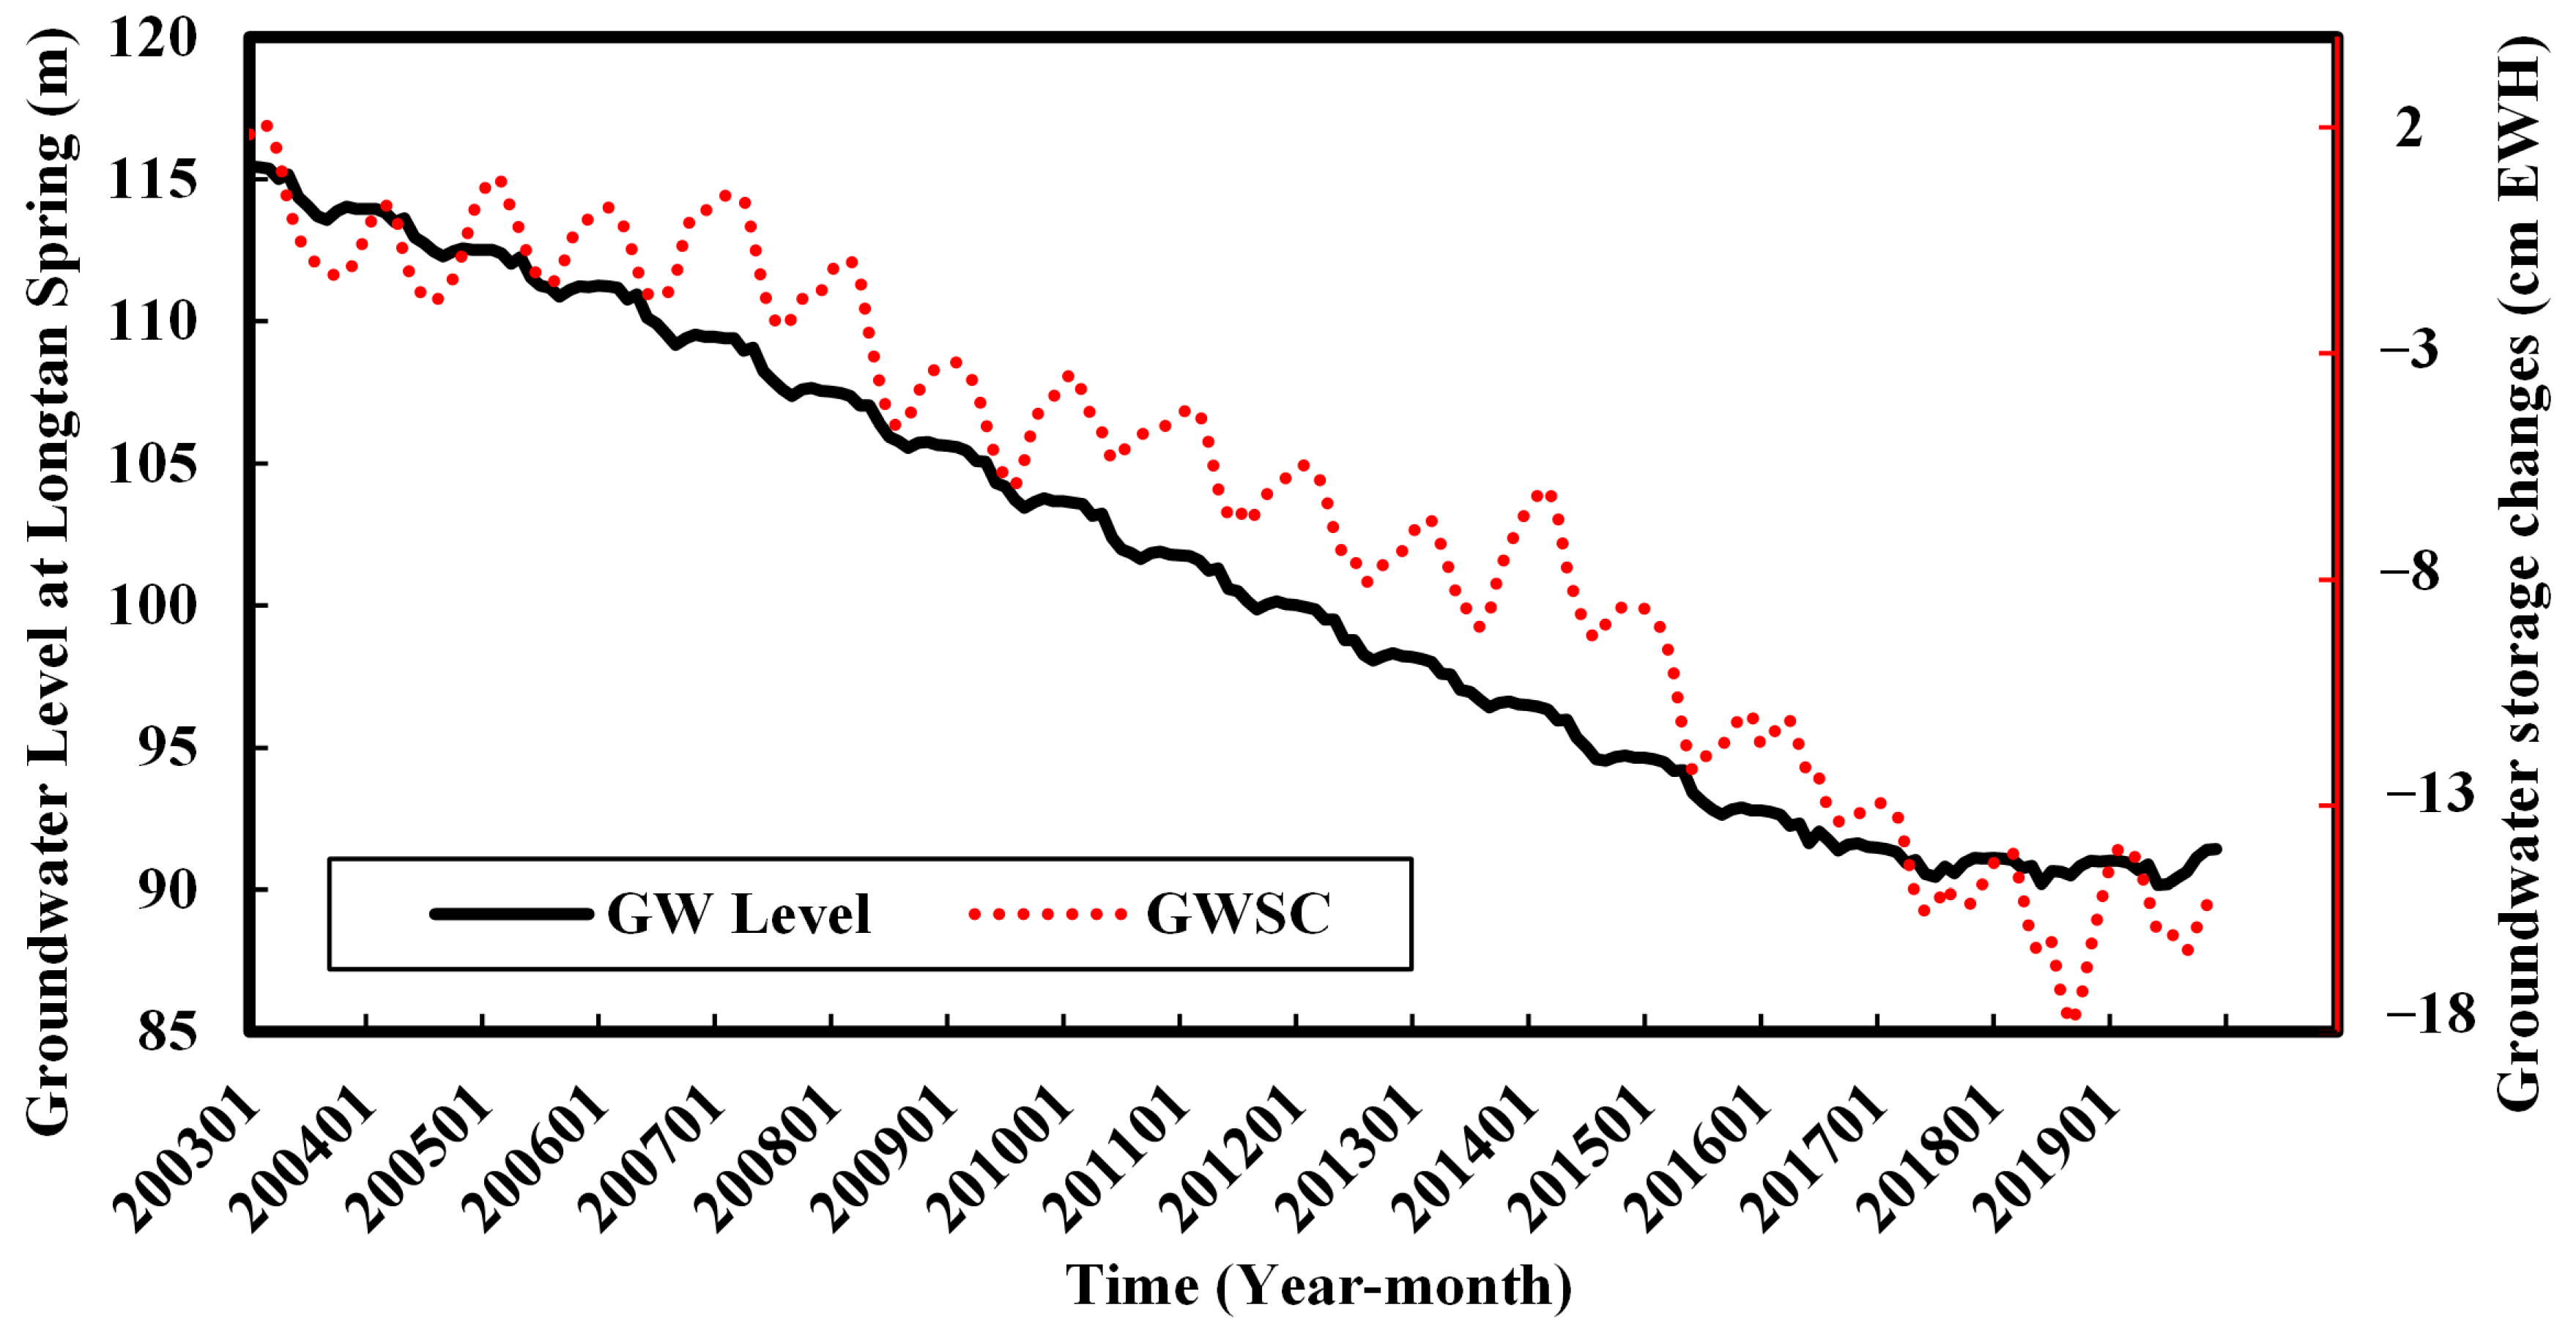
Figure 11.
Comparison of simulated groundwater level at Longtan Spring from the numerical model and LSTM model.
Figure 11.
Comparison of simulated groundwater level at Longtan Spring from the numerical model and LSTM model.


Table 1.
List of the key data used in this study.
| Data Types | Data Description | Data Sources |
|---|---|---|
| Borehole logging and karst aquifer information | 10 wells | Open reports from Beijing Institute of Geology |
| Rainfall | 5 stations, 1956–2019 | China Meteorological Administration |
| Groundwater withdrawal | The whole area, 2000–2007 | Open reports from Beijing Water Authority |
| Observations | 5 wells, 2000–2007 1 well, 1960–2019 | Open reports from Beijing Institute of Geology |
| Streamflow | Sanjiadian station, 1956–2019 | Open reports from Beijing Water Authority |
| Groundwater storage | The whole area at the spatial resolution of 5 km, 2003–2019 | [18] |
Table 2.
List of major hydrogeology parameters used in the study.
| Zone Number | Hydraulic Conductivities (m/d) | Storativity (m−1) | Specific Yield (Dimensionless) | Zone Number | Hydraulic Conductivities (m/d) | Storativity (m−1) | Specific Yield (Dimensionless) |
|---|---|---|---|---|---|---|---|
| 1 | 0.20 | 0.000003 | 0.05 | 16 | 5.00 | 0.00005 | 0.15 |
| 2 | 0.20 | 0.000008 | 0.05 | 17 | 2.50 | 0.00008 | 0.15 |
| 3 | 0.50 | 0.000003 | 0.05 | 18 | 3.00 | 0.000004 | 0.15 |
| 4 | 0.30 | 0.000005 | 0.05 | 19 | 4.00 | 0.00001 | 0.15 |
| 5 | 1.00 | 0.000005 | 0.10 | 20 | 0.50 | 0.000004 | 0.20 |
| 6 | 5.00 | 0.000008 | 0.10 | 21 | 2.00 | 0.000008 | 0.20 |
| 7 | 0.50 | 0.000008 | 0.10 | 22 | 5.00 | 0.000009 | 0.20 |
| 8 | 0.50 | 0.000009 | 0.10 | 23 | 7.50 | 0.000005 | 0.21 |
| 9 | 10.00 | 0.000015 | 0.10 | 24 | 5.00 | 0.00005 | 0.21 |
| 10 | 2.00 | 0.000005 | 0.10 | 25 | 0.50 | 0.00005 | 0.21 |
| 11 | 2.00 | 0.000008 | 0.10 | 26 | 9.00 | 0.000003 | 0.22 |
| 12 | 1.50 | 0.000008 | 0.15 | 27 | 15.00 | 0.00002 | 0.23 |
| 13 | 2.50 | 0.000008 | 0.15 | 28 | 5.00 | 0.000008 | 0.26 |
| 14 | 2.50 | 0.00001 | 0.15 | 29 | 15.00 | 0.000008 | 0.27 |
| 15 | 5.00 | 0.00002 | 0.15 | 30 | 20.00 | 0.000007 | 0.28 |
Disclaimer/Publisher’s Note: The statements, opinions and data contained in all publications are solely those of the individual author(s) and contributor(s) and not of MDPI and/or the editor(s). MDPI and/or the editor(s) disclaim responsibility for any injury to people or property resulting from any ideas, methods, instructions or products referred to in the content. |
© 2024 by the authors. Licensee MDPI, Basel, Switzerland. This article is an open access article distributed under the terms and conditions of the Creative Commons Attribution (CC BY) license (https://creativecommons.org/licenses/by/4.0/).
Share and Cite
MDPI and ACS Style
Wen, C.; Li, J.; Sun, D.; Zhang, Y.; Zhao, N.; Hu, L. Reconstruction of Past Water Levels in Data-Deficient Karst Springs. Water 2024, 16, 1150. https://doi.org/10.3390/w16081150
AMA Style
Wen C, Li J, Sun D, Zhang Y, Zhao N, Hu L. Reconstruction of Past Water Levels in Data-Deficient Karst Springs. Water. 2024; 16(8):1150. https://doi.org/10.3390/w16081150
Chicago/Turabian StyleWen, Chunyan, Jizhen Li, Dandan Sun, Yanwei Zhang, Naifeng Zhao, and Litang Hu. 2024. "Reconstruction of Past Water Levels in Data-Deficient Karst Springs" Water 16, no. 8: 1150. https://doi.org/10.3390/w16081150
Note that from the first issue of 2016, this journal uses article numbers instead of page numbers. See further details here.