Article

Temporal Changes in Water and Sediment Discharges: Impacts of Climate Change and Human Activities in the Red River Basin (1958–2021) with Projections up to 2100

by
Quang Hao Nguyen
1,2,* and
Vinh Ngoc Tran
3
1
Laboratory of Environmental Sciences and Climate Change, Institute for Computational Science and Artificial Intelligence, Van Lang University, Ho Chi Minh City 70000, Vietnam
2
Faculty of Environment, School of Technology, Van Lang University, Ho Chi Minh City 70000, Vietnam
3
Department of Civil and Environmental Engineering, University of Michigan, Ann Arbor, MI 48109, USA
*
Author to whom correspondence should be addressed.
Water 2024, 16(8), 1155; https://doi.org/10.3390/w16081155
Submission received: 22 February 2024 / Revised: 11 April 2024 / Accepted: 16 April 2024 / Published: 19 April 2024

Abstract

:
The present study examined temporal variations in water and sediment discharges in the Red River basin from 1958 to 2021 resulting from climate change and anthropogenic factors, with projections extended to 2100. The 64-year observational period was divided into five distinct stages: 1958–1971 (Stage I: natural conditions); 1972–1988 (Stage II: onset of human activities); 1989–2010 (Stage III: post Hoa Binh dam construction); 2011–2016 (Stage IV: series of new dam constructions); and 2017–2021 (Stage V: combined effects of human activities and climate change). Attribution analysis revealed that human activities accounted for 62% and 92% of the dramatic declines in sediment loads in Stages III and IV, respectively. Projection results of fluvial sediment loads over an approximate 150-year timeframe (1958–2100) indicate an overriding impact from human activities. Climate change projections based on four scenarios (−5%, +5%, +10%, and +15% change per year) suggest associated decreases or increases in river flows. This study predicts that projected 21st century increases in river flow attributable to climate change will offset up to eight percent of the human-induced sediment load deficit.

1. Introduction

The world’s major rivers transport a disproportionately high percentage of the global terrestrial sediment load. This sediment transport has historically enabled the formation of and continues to be critical to sustaining the expansive deltas inhabited by millions of people [1]. Sediment loads play a significant role in shaping river morphology, affecting water quality, and determining the longevity of fragile geomorphic features like coastal deltas [2]. However, climate change and anthropogenic activities are exerting immense pressure on most large-scale river systems, engendering unprecedented alterations to hydrology, ecosystems, and fluvial sediment discharges [3,4]. As many major rivers empty into the great deltas of the world, the survival of these landforms depends intrinsically on upstream fluvial sediment supply. Consequently, over 70% of major deltas worldwide now face severe threats from natural drivers like sea level rise, subsidence, and intensifying storms, alongside human impacts like dam construction and land use change [5]. Specifically, disruptions to sediment supply from damming and land use changes can profoundly transform vulnerable deltaic coastal landscapes [6]. Recent analyses reveal historically significant changes in riverine processes (water and sediment fluxes) impacting 24% and 40% of the world’s large rivers, respectively, with notably declining sediment and water fluxes seen across major Asian rivers attributed to anthropogenic activities and climate change [7]. Quantifying the relative impacts of climatic and human drivers on global river systems is therefore essential amidst the unprecedented alterations occurring to fluvial water and sediment flows worldwide.
The research question at hand centers on comparing the relative impacts of climate change and anthropogenic activities on fluvial sediment loads. Quantifying the proportional contributions of natural drivers (encompassing climate change) and human interventions to riverine sediment transfer to coastal zones is critical yet requires consistent longitudinal analyses, given the lack of future sediment load measurements. Despite the significance of this issue, existing studies have predominantly focused on anthropogenic factors, especially dam construction, as the primary culprits underlying declining trends in fluvial sediment loads [8,9,10,11,12]. However, the influence of climate change on river sediment fluxes has not received due attention. Presently, our knowledge of how the interplay between climate change and human activities will shape sediment discharge in the upcoming decades remains constrained for numerous major global rivers. Robust quantitative assessments of both climatic and anthropogenic influences are essential for developing efficient basin-scale catchment strategies.
The Red River constitutes the second largest river in Vietnam and plays a vital role economically, culturally, and politically. With an estimated 110 × 106 tons of sediment load per annum, the Red River has been previously ranked among the top eight globally [2,13], cementing its status as one of Asia’s most prominent rivers. Since the 1930s, dozens of dams have emerged across the Red River’s watershed. In December 1988, Vietnam unveiled the Hoa Binh dam, then the country’s largest hydroelectric facility and one of Southeast Asia’s most substantial plants with a 1920 MW generating capacity. This record was later surpassed by the Son La dam, currently the largest hydroelectric installation in Southeast Asia, which became operational in December 2010. While several studies [11,13,14,15] have identified additional drivers impacting water and sediment flows in the Red River, few studies [10,12,16] have sought to quantify the relative influence of these factors in the post-Hoa Binh and Son La era, the focus of the present study.
To quantify the relative impacts of natural drivers, encompassing climate change, and anthropogenic activities on fluvial sediment transfers to the coast via the Red River system, this study implements a comprehensive approach utilizing long-term observations and projections to the end of the 21st century. Specifically, we develop an analytical framework for data analysis based on the methodological framework employed by Ranasinghe et al. [3]. Initially, updated measurements are presented of water and sediment discharges from the fluvial system into the receiving Tonkin Gulf. The investigation then proceeds to analyze precipitation trends over recent decades using climate data from ten (10) stations situated throughout the Red River basin in Vietnam (~1960–2021), spanning upstream to downstream locales. Next, a systematic, quantitative analysis of sediment load variations at the basin scale examines changes driven by both human activities and climate. Additionally, sediment load projections are modeled through 2100 under scenarios accounting for potential rainfall fluctuations, including decreases and increases. The overarching objective is to improve scientific understanding of the respective roles of anthropogenic activities versus natural drivers in shaping major river water and sediment transport processes. By furnishing evidence-based guidelines to inform global river management, this research aims to support sustainable decision-making and practices in river basin and coastal zone management.

2. Methods

2.1. Study Area

The Red River system (Figure 1), located at an average elevation of 2000 m in the Yunnan province mountains in China [15], is the second largest river system in Vietnam after the Mekong and has a highly complex hydrological network. The Red River’s total length is approximately 1126 km, running from its source in China to the Tonkin Gulf in Vietnam and creating the second largest delta in Vietnam, the Red River Delta, which is 150 km wide and covers an area of 14,500 km2 [17]. Upstream from the delta, the main branch of the Red River (also known as the Yuan or Red River) is composed of two significant tributaries, namely the Da and Lo Rivers. The Red River system’s total catchment area is about 169,000 km2, distributed among Vietnam (51.3%), China (48%), and Laos (0.7%) [18]. Specifically, the three main drainage basins are 57.2 × 10³ km2 for the main channel Red River (with 21% located in Vietnam), 51.3 × 10³ km2 (52% in Vietnam) for the Da River, and 34.6 × 10³ km2 (64% in Vietnam) for the Lo River [15].
The hydrological conditions of the Red River represent a subtropical monsoon, characterized by high discharges in the period (from June to September) and low discharges (from October to April). The Da River contributes the most to the Red River’s discharge among the three main tributaries; the levels for the Red River (main channel) and the Lo River are similar to one another [19].
The Red River basin is well known for its high population and agricultural production, particularly in the Red River Delta, which accounts for around 23% of the population and 56% of the rice products in Vietnam [18]. Water resources in the study area are predominantly utilized for agricultural irrigation, domestic supplies (drinking water), transportation, and hydropower generation. Anthropogenic activities are responsible for up to 60% of the water flow and sediment load, resulting in changes in water quality and sediment loading amounts [20]. Since the 1930s, a number of small dams and reservoirs have been built and operated along the Red River basin from upstream (in China) to downstream (in Vietnam). Particularly since the 1970s, several large hydropower dams have been constructed for various purposes including irrigation, hydropower generation, flood protection, and water supply/navigation (Figure 1 and Table 1). These developments around the Red River system have led to reports of declining accumulated sediment and changes in river flows [10,11,21]. This has led to a significant need to understand the anthropogenic influences on the river basin to develop better management policies in the future [22].

2.2. Data Analysis

Long-term measurements of daily water discharge and suspended sediment concentration observed at the Son Tay hydrological gauging station (Figure 1), 1958–2021, were obtained from MONRE (the Vietnam Ministry of Natural Resources and Environment). The monthly sediment loads were calculated by multiplying the sediment concentrations by the water discharges. Additionally, daily rainfall data were collected at ten climatic stations), situated along the Red River basin in Vietnam, spanning from upstream to downstream (Figure 1, and Table A1).
The common approach to developing rating curves for rivers involves establishing the empirical relationship between sediment load (S − 106 ton/month) and water discharge (Q − 106 m3/month) [1,3,23,24,25]. The general form of a power function is as follows:
S = aQb
where ‘a’ and ‘b’ are the coefficients to be estimated through statistical methods. To assess the significance of the results, a paired two-sample t-test was conducted at a 95% confidence interval for the means.
To understand the relative importance of the factors influencing the decline of sediment discharges and identifying significant changing points during the 64-year observation period, we differentiate and quantify their impacts based on linear regression analysis. Accordingly, this approach detects linear trends and change rates for sediment load and water discharge, as well as for water discharge and precipitation. In the first stage (period) where other factors (such as human activities) are ignored, there will be a close regression relationship between annual precipitation and water discharge for the entire catchment, as illustrated at the Son Tay station. This regression equation can be used to predict precipitation-based annual water discharges for subsequent stages. The difference between predicted and measured values reflects the impact of human activities and/or climate change.
There are four scenarios predicting the sediment load in the Red River system until 2100. These predictions are based on the rates of changes in precipitation measured throughout the entire Red River basin from approximately 1960 to the present, taking into account climate change projections provided by the Intergovernmental Panel on Climate Change (IPCC) for the Asia region.

3. Results and Discussion

3.1. Water Discharge and Sediment Load from 1958 to 2021

The total water and sediment discharges of the Red River system into the Tonkin Gulf were calculated using measurements taken at the Son Tay station, as shown in Figure 2. Over the 64-year study period, the annual sediment load significantly decreased by 90%, while water discharge remained relatively stable, declining by 12.8%.
In particular, the sediment load increased slightly by 3.6%, from 107 × 106 ton/yr during the period 1958–1971 to 111 × 106 ton/yr during the period 1972–1988, while water discharge slightly decreased by 1.5%, from 108,463 × 106 m3/yr to 106,884 × 106 m3/yr. However, during the following period 1989–2008, the situation was reversed, with sediment load decreasing dramatically by 59.6%, while river flow slightly increased by 1.9%. This decrease in sediment load was mainly associated with the operation of the Hoa Binh dam (HB), well documented in pioneer studies such as Le et al. [14], Dang et al. [13], Vinh et al. [15], and Nguyen et al. [10,11]. During the most recent period 2009–2021, which coincided with the operation of all the large dams, all riverine processes (such as sediment and river discharges) decreased by 78.9% and 18.2%, respectively, compared to the previous period. Clearly, it is evident that human activities, particularly the construction and operation of dams, have a significant impact on the riverine processes of the Red River system.
Besides the influence of dams and reservoirs, deforestation (or afforestation) also significantly impacts the riverine processes within a catchment. Particularly, in the upper part of the Red River basin (Yunnan Province, China), the forest cover decreased from about 60% in the 1950s to 24.2% by 1990. Similarly, severe deforestation was observed in the upper reaches of the Red River basin in Vietnam, where the percentage of forest cover plummeted from 95% in 1943 to 17% in 1991 [20]. Notably, forest cover degradation was dramatic in the past and reached its peak in the 1990s, following the adoption of the “Doi Moi reforms” (renovation) policies in Vietnam. This degradation was a major factor contributing to the changes in riverine processes within the Red River basin [26].
To determine the contribution of human activities related to dam construction and operation and climatic changes in terms of precipitation, we conducted a detailed analysis of the 64-year observation period. Figure 3 shows sediment rating curves for five distinct time periods: 1958–1971, 1972–1988, 1989–2010, 2011–2016, and 2017–2021. Particularly, I the period from the 1950s to the beginning of the 1970s, suspended sediment loads in the Red River system were primarily influenced by natural conditions (e.g., river discharge). This was followed by an increasing impact of human activities, including dam construction (e.g., Hoa Binh), deforestation, and changes in land use, persisting until the end of the 1980s. Since the early 1990s, dam operation has significantly influenced the sediment loads in the Red River system. Notably, the period from the early 1990s to the end of the 2000s was affected by the Hoa Binh dam, while the subsequent period from the end of the 2000s onward to 2016 was influenced by the construction and operation of a series of new dams in both China and Vietnam. As of 2017, no further dams were planned or under construction in the river system.
Table 2 presents the detailed statistical analysis for water discharges and sediment loads. We utilized sediment rating curves, which establish empirical relationships between sediment load and water discharge at the Son Tay measurement station, to investigate the underlying physical drivers governing the fluvial sediment transport regime. Remarkably, during Stage I (1958–1971), the sediment load projected by the rating curves exhibited the highest correlation (R2 = 0.926) with the observed sediment load (Table 2). This indicates that Stage I can be characterized as a water-discharge-controlled Stage (or a natural condition Stage) with minimal human influences such as dam construction and operation. As suggested by Ranasinghe et al. [3], we can utilize the Stage I rating curves to estimate sediment loads during the subsequent four Stages, in the absence of significant human influences.

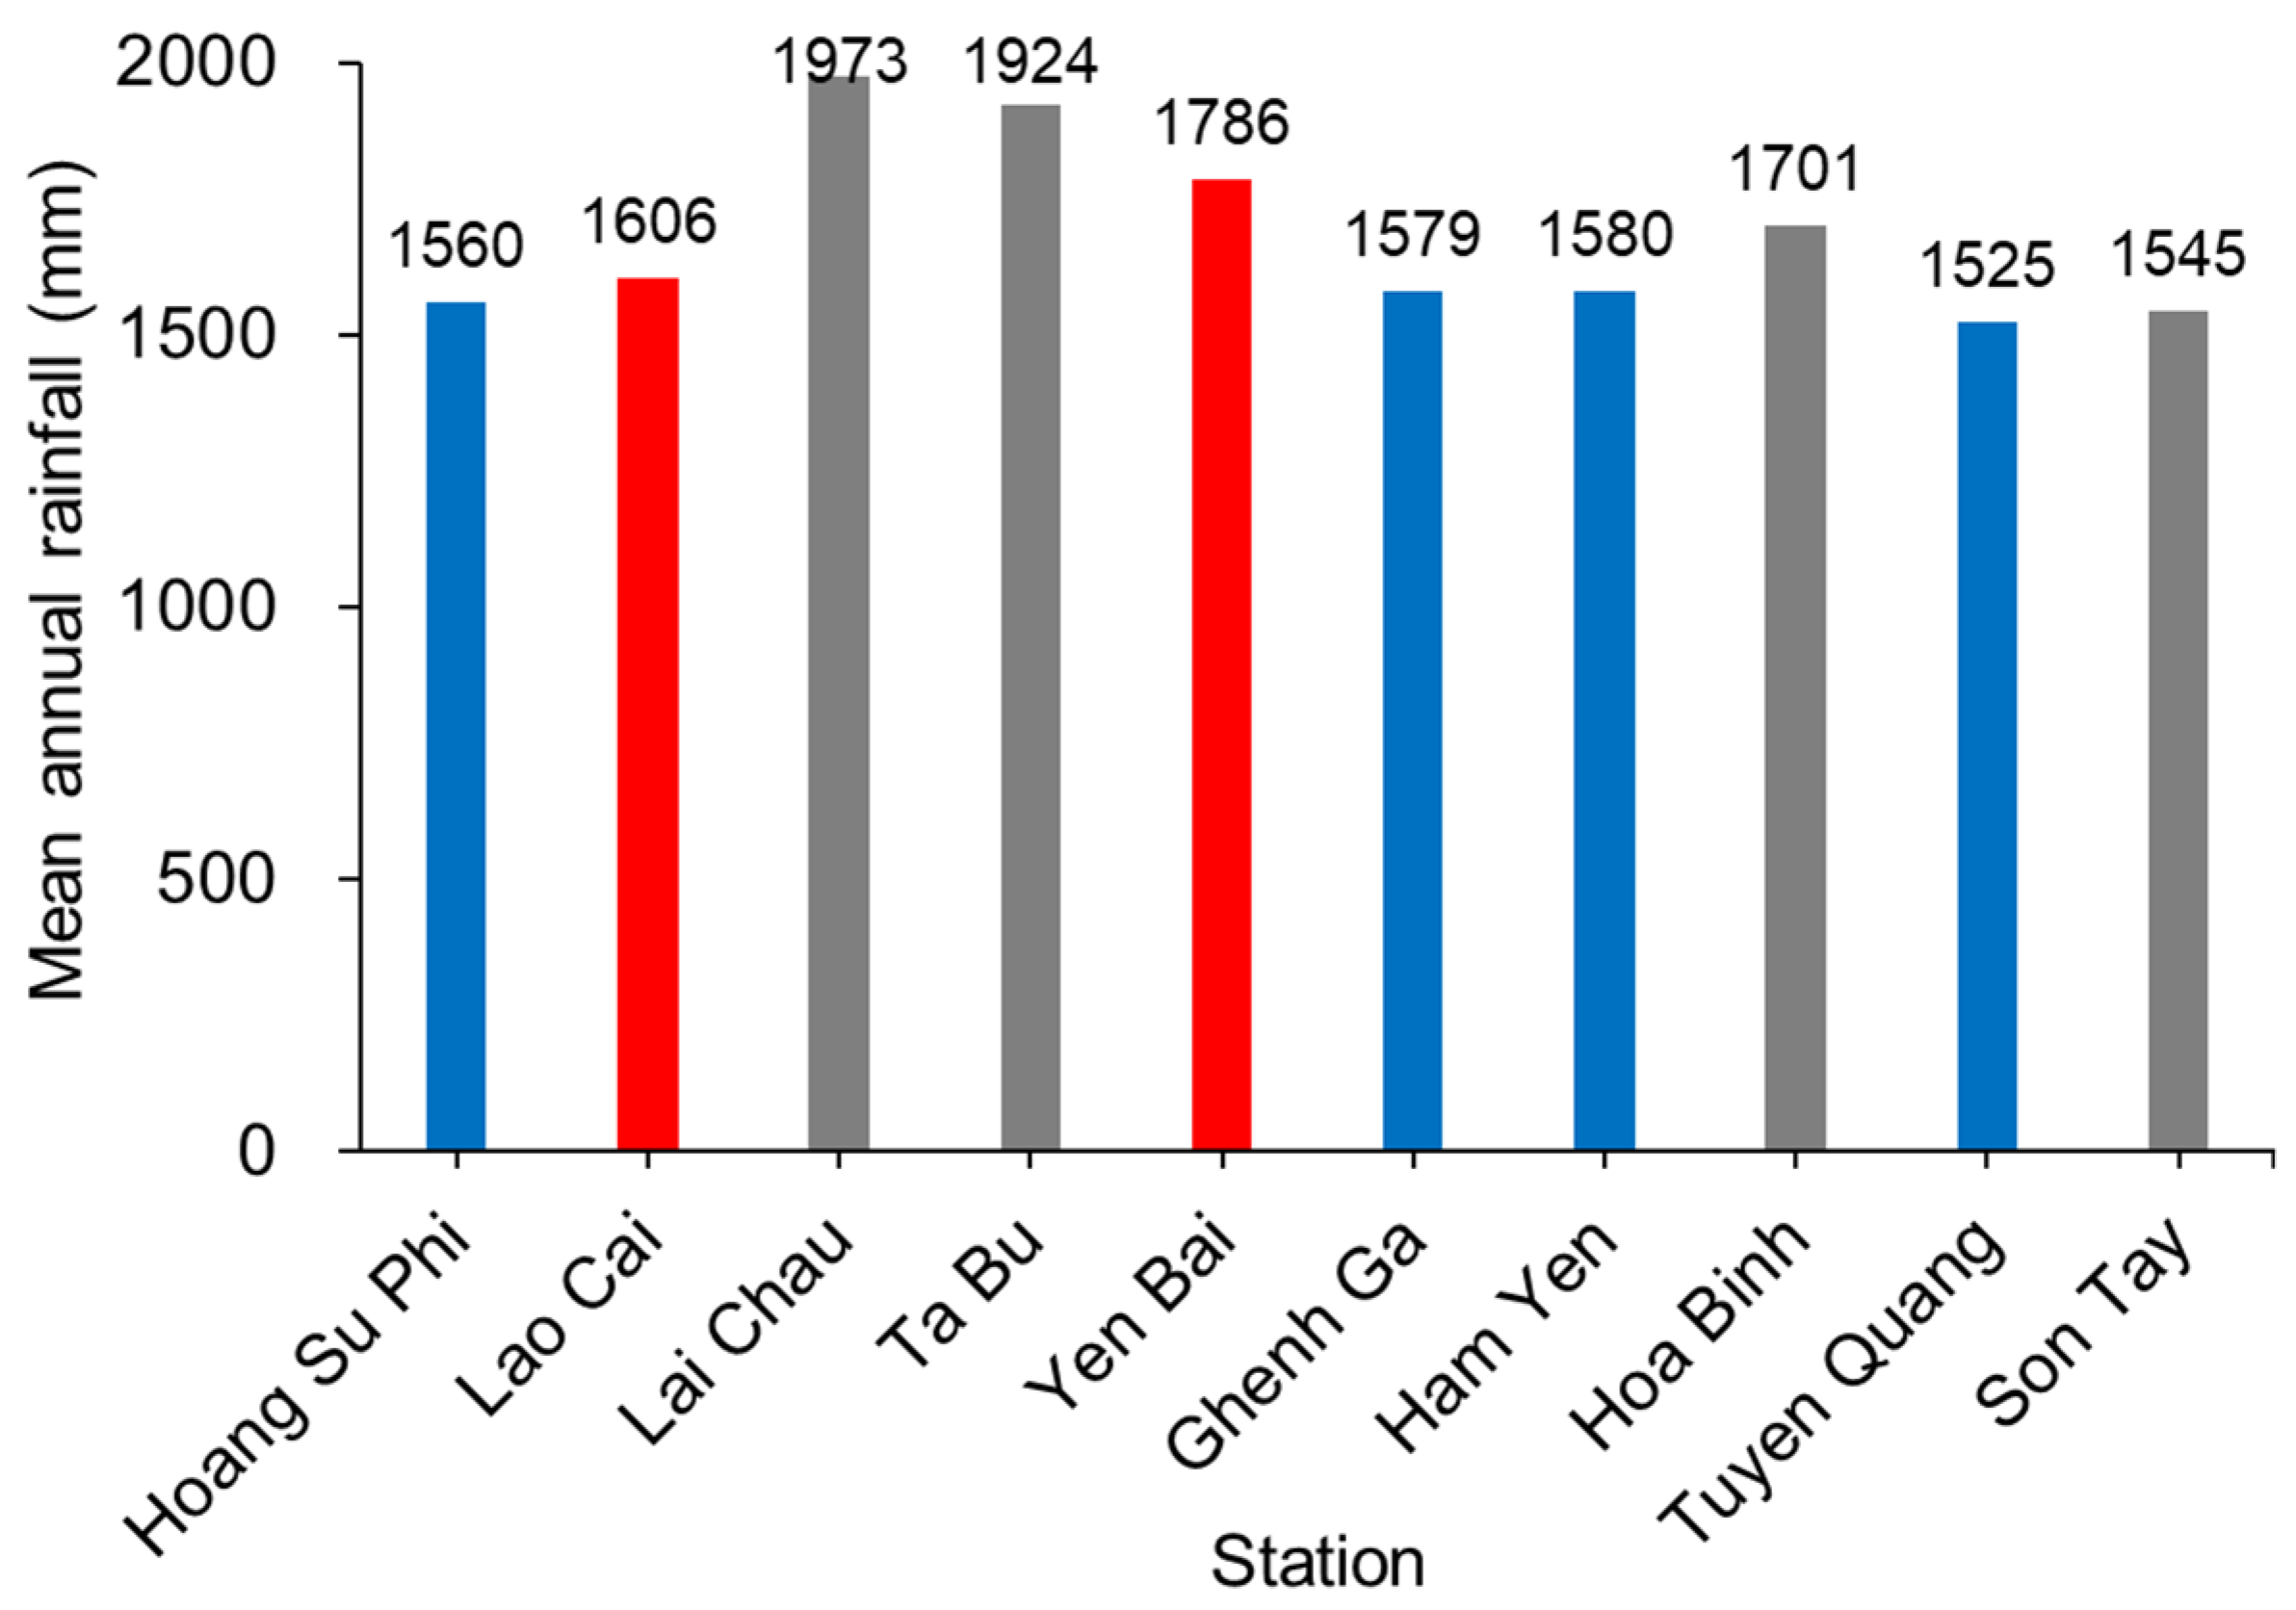
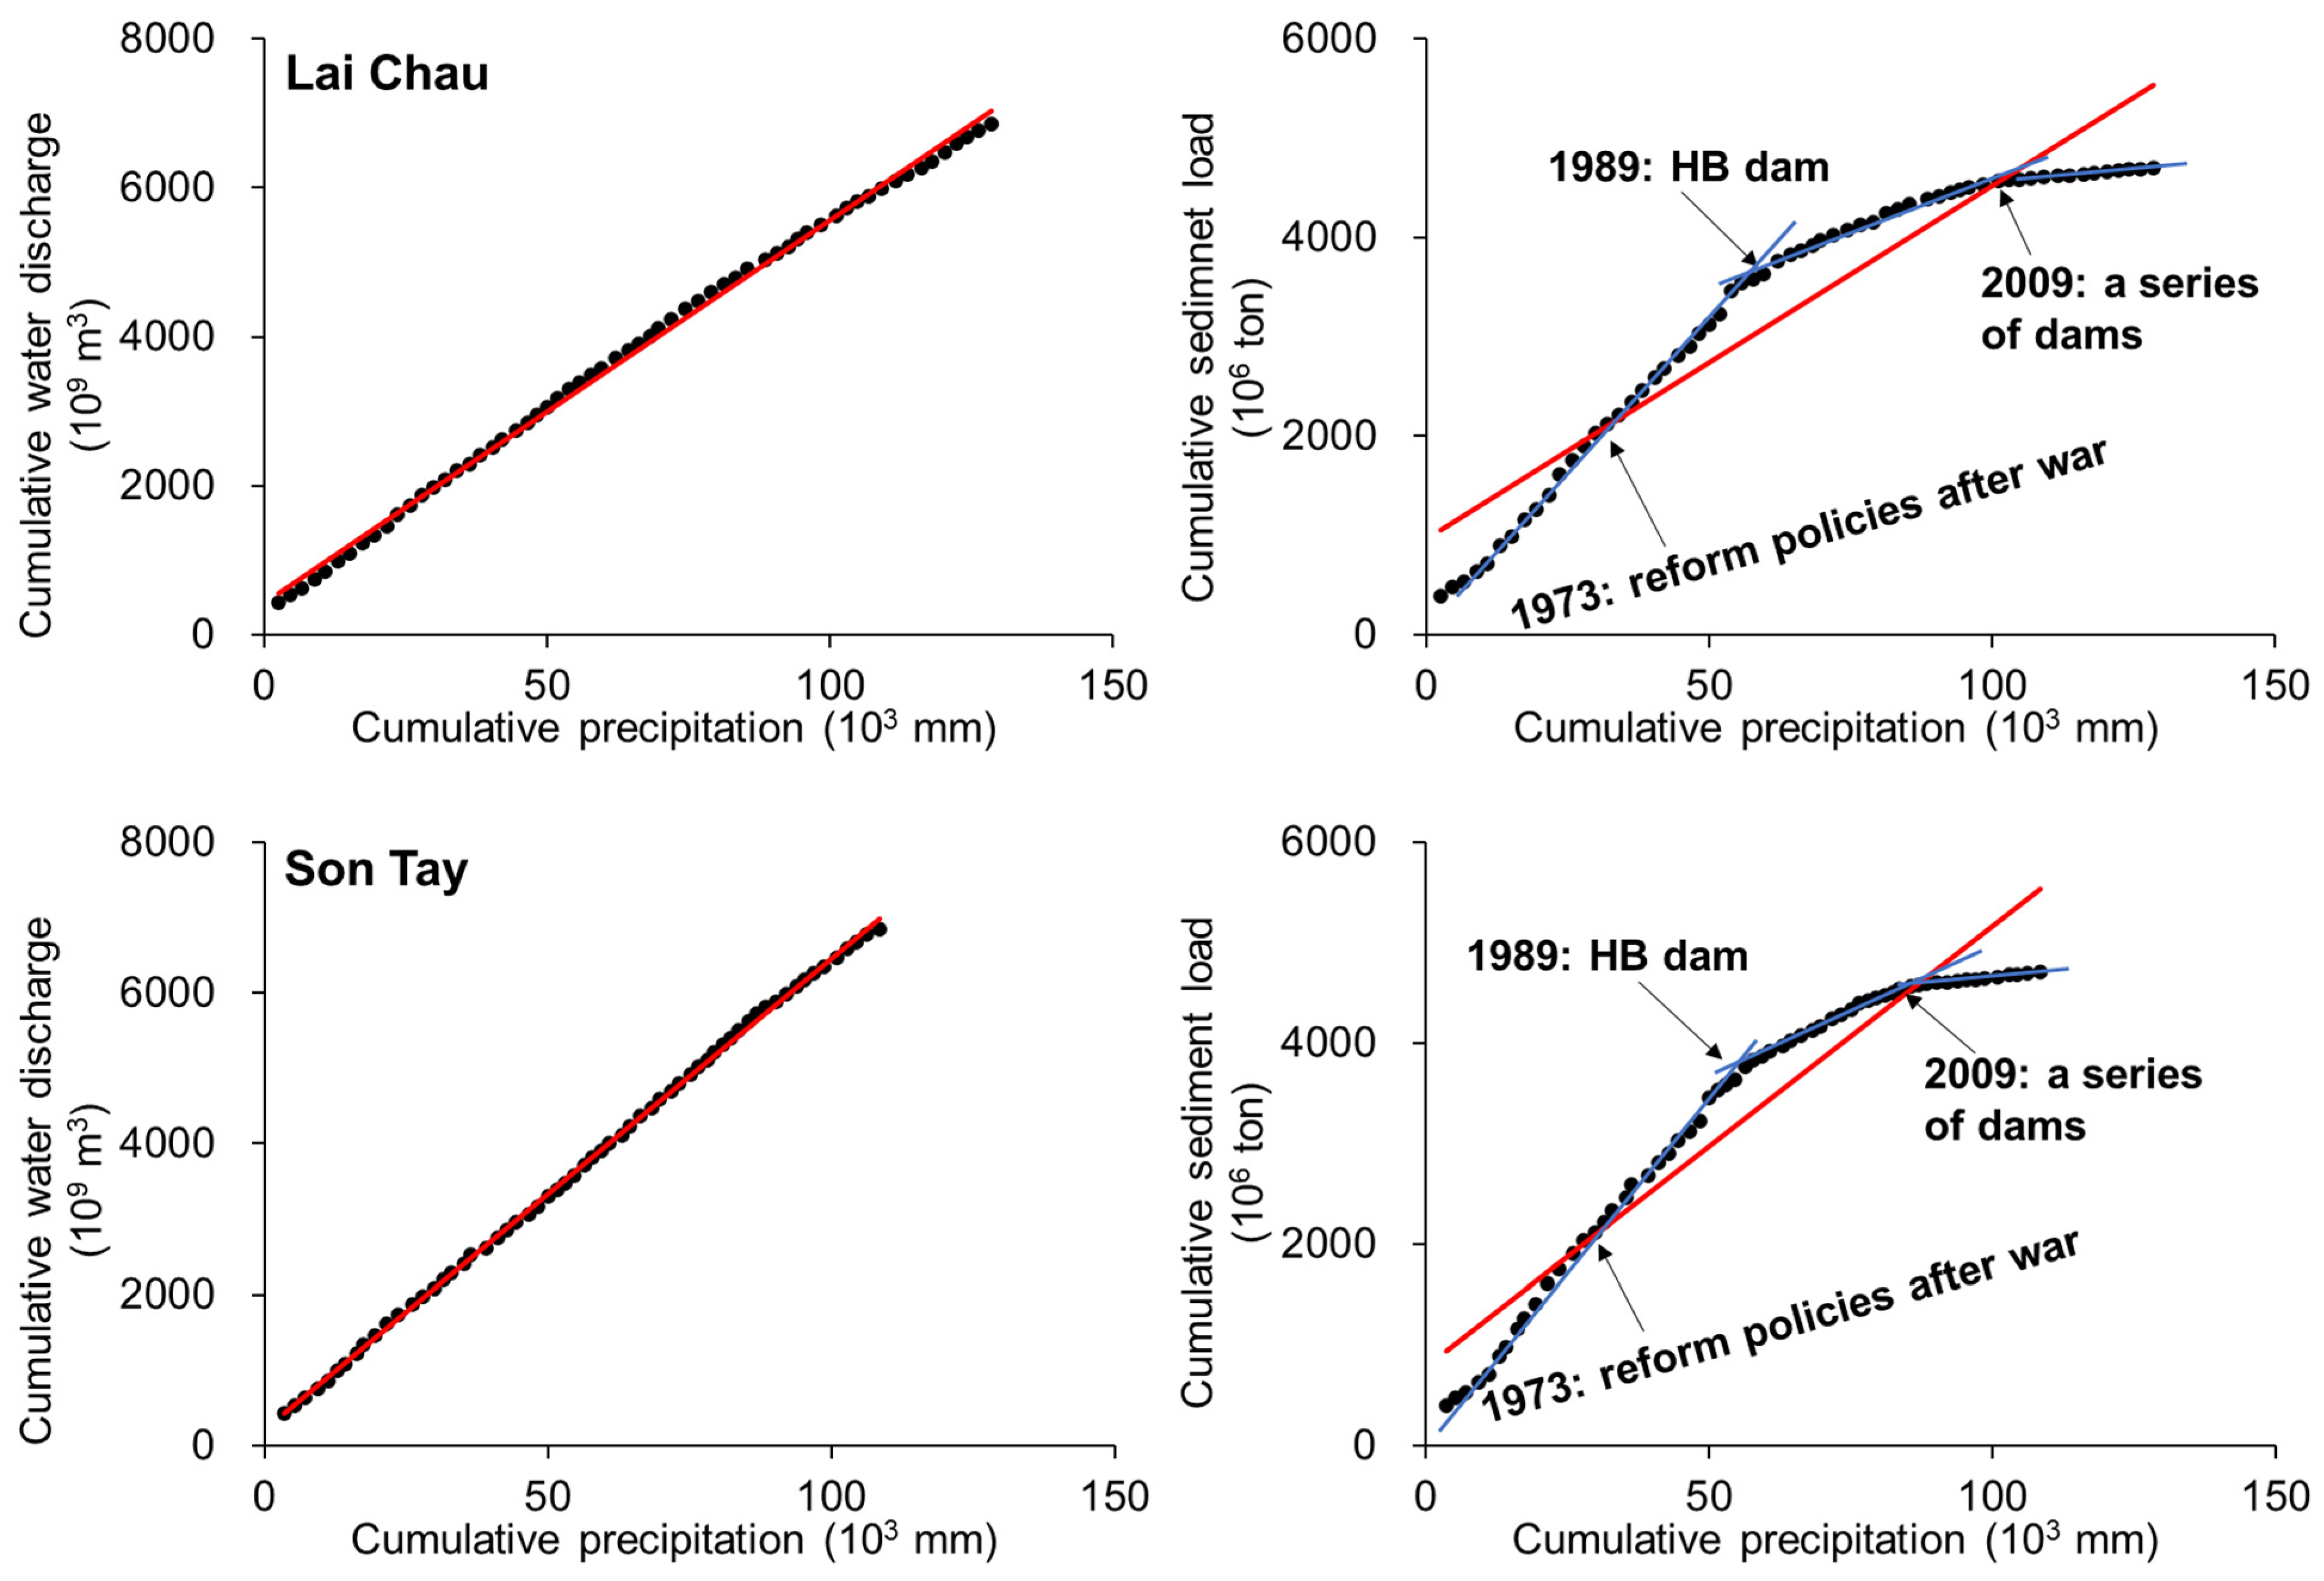
3.2. Trend Analysis for Precipitation and Its Relationships to Water and Sediment Discharges

Since precipitation is one of the most influential factors affecting river flow, a critical component in rainfall–runoff relationships, we analyzed the changes in daily rainfall observed at ten stations along the Red River basin, from the upper reaches to the lower reaches within Vietnam’s territory. To gain insight into the trend of changes, we paid special attention to the latest decade (2011–2021) and compared its rate of change to the previous five decades (~1960s to 2010). Accordingly, the average annual rainfall at the selected stations could be divided into two periods, before and after the year 2010. Then, we will use the rate of changes in rainfall (during the latest decade, 2011–2021) to simulate further changes in water discharge and sediment load until the end of this century, 2100.
According to Figure 4, the mean annual precipitation varied among the stations, ranging from a low of 1525 mm for station Tuyen Quang (Lo River) to a high of 1973 mm for station Lai Chau (Da River), with an overall mean of 1593 mm. It is evident that the upper reaches of the Da River (Lai Chau and Ta Bu stations) received significantly higher precipitation compared to the others, which suggests that the Da River, one of the three main tributaries of the Red River, receives more rainfall and therefore contributes more to the water discharge than the other two tributaries, the Red River (main channel) and the Lo River (Figure 4). This observation is understandable considering the larger watershed area of the Da River (57,285 km2) compared to the Red (12,000 km2) and the Lo River (10,104 km2). This finding is consistent with the conclusion of Le et al. [14] and Nguyen et al. [11] that the Da River plays a major role in the river system, accounting for 53–57% of the total discharge.
Details of the precipitation changes at the ten climatic stations, including the rate of change during the latest decade (2011–2021), are illustrated in Figure 5. A consistent trend in rainfall patterns was observed among the ten stations from approximately 1960 to 2021. The period from May to October constitutes the primary rainy season in the Red River basin, contributing about 82% of the total rainfall, with nearly 51% occurring in just three months: June, July, and August.
When comparing the amount of rainfall in the latest decade (2011–2021) with the previous four decades, a noticeable contradiction emerges between the Lo and Da tributaries. The upper reaches (Hoang Su Phi and Ham Yen) of the Lo River exhibit a decreasing trend in precipitation during the latest decade, while an increasing trend is observed in the lower reaches (Ghenh Ga and Tuyen Quang). In contrast, an increasing trend is found in the upper reaches (Lai Chau) of the Da tributary, while the rate of rainfall decreases in the downstream area (Ta Bu and Hoa Binh). A similar behavior is observed in the main channel (Red River), where rainfall tends to increase at the upper stream and decrease downstream.
In particular, increases and decreases in the annual mean mostly occur during the main rainy season, varying from slight to significant depending on the station. For instance, the mean annual rainfall at the Lao Cai station has been increasing at a rate of +1.0% per year, whereas the rates of increase at the Lai Chau and Son Tay stations are much higher, at +13.7% and +12.0% per year, respectively. The most severe decrease in rainfall is observed at Hoang Su Phi (−5.8%/yr) and Ham Yen (−6.3%/yr) stations located in the upper reaches of the Lo River (Figure 1). Meanwhile, the lower reaches of the Red and Da River show decreasing rates of −4.2%/yr (Yen Bai) and −7.5%/yr (Hoa Binh).
Based on the data from the ten meteorological stations, the mean annual rainfall has increased, on average, by +10.6% per year in the latest decade in the entire Red River basin, compared with the previous four decades. It is noteworthy that this percentage was calculated based on the assumption that the contributions of the Red and Lo Rivers are equal (21.5% each) to the river system, while the Da River contributes 57%, as calculated by Le et al. [14]. Our study’s findings exhibit similarities with the simulated results observed in the Pearl River basin in China, which is located in the upper reach of the Red River system to the north. In both cases, there has been a +10% increase in rainfall since the 2010s [3].
It is important to stress that the overall increasing trend of precipitation in the upper reaches of the Red River system during the latest decade (2011–2021) is consistent with the recent variations (a slightly increasing trend) in water discharge measured at the Son Tay station (Figure 2 and Table 2). The rainfall during the post-rainy season (from September to January of the following year) has increased slightly (compared to previous decades, see Figure 5), indicating a shift in the rainfall pattern. Additionally, rainfall in the pre-rainy season (from April to June) shows inconsistency. However, the rainfall during the transitional period (February to April) appears relatively stable across the ten stations (see Figure 5). These observations suggest that climate change has become more apparent in recent years.
The impact of climate change on the water and sediment discharges in the Red River system is primarily caused by changes in precipitation patterns. Figure 6 illustrates the correlation between cumulative precipitation and cumulative water discharge, as well as the correlation between cumulative precipitation and cumulative sediment load, within the Red River system. The diagram provides an example from both the upper reach station (Lai Chau on the Da River) and the lower reach station (Son Tay, located at the confluence of the three major tributaries). A similar trend is observed between the two representative stations, indicating a good agreement between the data observed from the upper and lower reaches of the river system.
Before 1972, the cumulative precipitation and water discharge were well correlated, and a significant relationship was observed between cumulative precipitation and cumulative sediment load at both the Lai Chau and Son Tay stations. The right panel of Figure 6 shows four distinct temporal changes marked by abrupt points in 1973, 1989, and 2009, which were mainly caused by human activities. For example, economic reform policies (the Doi Moi reforms) were implemented soon after the Vietnam war in the northern country, leading to the significant changes since the 1973.
Prior to 1988, cumulative precipitation and sediment load were strongly correlated, and precipitation and sediment load had a significant relationship. However, when the Hoa Binh reservoir was constructed in 1988 and began its operation, the sediment load decreased significantly. Since the end of the 2000s, the sediment regime has entered the second significant decreasing Stage, associated with the use of a series of new dams (see Table 1).

3.3. Quantifying the Anthropogenic and Climatic Contributions between 1958 and 2021

To quantify the influence of climate change on water discharge and sediment load variations, as analyzed above, Stage I (1958–1971) was used as the benchmark period and considered a water-discharge-controlled Stage, also called the natural Stage. Therefore, human activity during the baseline period was assumed to be negligible. Following this assumption, the suspended sediment loads, simulated using the Stage I rating curves combined with measured river flows during Stages I–V, were compared with the observed ones (see Figure 7). The sediment load estimates in subsequent stages (II–V), therefore, were based on the sediment rating curve established during the initial period (Stage I). Any anomaly in the simulated sediment loads compared to those observed is primarily indicative of unnatural impact.
A small difference of about 3.5% between the simulated and measured sediment load was found (Figure 7). During Stage II (1972–1988), measured values slightly exceeded the predicted sediment load of the Red River basin, with an ultimate observed increase of 17% in suspended sediment supply to the sea. This could be caused by changes in land use in the upper reaches due to Vietnamese economic reform policies since the end of the war in the northern part of Vietnam in 1973 (Hung and Larson, 2014; Nguyen et al., 2023a), which resulted in much of the area cleared and repurposed for agricultural production. Also, the Hoa Binh dam was constructed in this period (1979–1988) and had a significant impact on the environment because of largescale excavation work in the dam site, quarry site, and relocation of roads, etc. Thus, such activities caused a slight increase in sediment load but slight reduction in waterflow, as seen in Table 2. Clearly, the operation of Thac Ba dam since 1972 did not cause much effect on the sediment load in the river, since its upstream watershed (6170 km2) is much smaller than the Hoa Binh dam (57,285 km2). In other words, human impacts became significant since the end of the second Stage [10,11].
During Stage III (1989–2010), however, the observed sediment load dramatically reduced compared to the simulated sediment load (33.8%, Figure 7), with the suspended sediment supply to the sea decreasing approximately 62% compared to Stage I. The main cause for this decline in sediment load of the river was associated with the operation of the Hoa Binh mega dam in the Da tributary (indicated in Figure 1). Also, the ‘Doi Moi reforms’ significantly altered land cover and land use in the upper reaches of the Red River basin, suggesting a major factor in the changes observed in riverine processes [14].
During Stage IV (2011–2016), a series of new dams started their operations; the sediment load decreased further compared to predicted sediment load, resulting in a massive 92% decrease in fluvial sediment supply to the coast compared to Stage I. During Stage V (2017–2021), the simulated sediment load from natural sources alone was significantly higher than the measured load, which decreased by about 91% compared to Stage I. Both mean water discharge and sediment load slightly increased in the period (Table 2). Clearly, the increase in water discharges was associated with the increase in precipitation (Figure 5). This suggests that climate change plays a major role in the alterations of riverine processes in recent years. In other words, both natural factors, e.g., climate change, and human activities contribute to the sediment load in the Red River system.

3.4. Sediment Loads Projected to 2100

We conducted simulations to predict the corresponding increase or decrease in river flow, based on the above analysis of precipitation rates over the latest decade compared to the previous four decades at ten climatic stations, spanning from upper to lower reaches of the river basin. Table 3 describes the simulated scenarios for sediment load prediction up to 2100. Since precipitation rates have shown varying increasing and decreasing trends at the ten stations, both upstream and downstream, over the last decade, we have developed four corresponding scenarios to the year 2100, with intervals of approximately 5%.
In this study, we conducted projections of river flows beyond 2021 using four different scenarios, as outlined in Table 3. Consequently, we estimated the sediment load based on the projected runoff for the entire Red River system until the end of the century (2100). Following the approach proposed by [3] for the Pearl River in China, which is situated in the upper reach of the Red River basin, the maximum expected increase by 2100 is 10%. However, upon analyzing observations from the Lai Chau and Ghenh Ga stations, we identified an actual increase of approximately 13.7% and 14.9% per year, respectively. Consequently, in consideration of a high-end scenario, we used a 15% increase in our calculations. It is important to emphasize that in Asia, particularly in the Red River basin, the Intergovernmental Panel on Climate Change [14,27] predicts an annual mean rainfall increase ranging from 5 to 10%, with projections exceeding 10% by the 2080s. This implies that our proposed scenarios (Table 3) are reliable and based on observed evidence in the Red River basin.
Employing the rating curve obtained for Stage V, we computed the suspended sediment supply for the period between 2022 and 2100. We proceeded with the hypothesis that no additional significant human interventions would occur in this extensively engineered river system. The resulting suspended sediment discharge to the sea by the Red River system, considering the impact of climate change only beyond 2021, is depicted in Figure 8 (red dots).
Generally, Figure 8 clearly illustrates the significant disparity between the potential scenario under natural forces alone and the cumulative impact of human activities up to the present day. This comparison assumes no significant human interventions, whether positive or negative, will occur throughout the remainder of the 21st century. The figure indicates a notable 90% reduction in sediment discharge to the coast under human-induced impacts from 1958 to 2021 (Figure 2 and Table 2).
For the scenario of a −5% decrease per year in river flow, the projected climate-change-driven decrease will be at a rate of −0.2165 × 10⁶ ton/yr, while the projected human-combined climatic change decrease will be at a rate of −0.0414 × 10⁶ ton/yr (Figure 8, top left panel). Under the scenario of a +5% increase per year in river flow, the projected climate-change-driven decrease will be at a rate of +0.417 × 10⁶ ton/yr, while the projected human-combined climatic change decrease will be at a rate of +0.0697 × 10⁶ ton/yr (Figure 8, top right panel). When river flow increases by +10% per year, the natural condition only and human-combined with climate-change-driven will increase by +1.1917 × 10⁶ ton/yr and +0.184 × 10⁶ ton/yr, respectively. Under the highest-end scenario of a +15% increase per year in river flow (Figure 8, bottom right panel), the natural condition only and human-combined with climate-change-driven will increase by +2.6023 × 10⁶ ton/yr and +0.3689 × 10⁶ ton/yr, respectively. Notably, the projected climate-change-driven increase in river flow (+5%, +10%, and +15%) during the 21st century will only compensate for 0.2%, 3%, and 8% of the deficit by 2100.
Based on the analysis conducted in the case of the Red River system, it appears that human impacts are likely to have a greater influence than climate change on the sediment discharge to the sea in other rivers worldwide subjected to extensive engineering [3,16]. The findings from this study underscore the significance of human interventions, such as dam construction and operation, as major drivers affecting sediment transport in these engineered river systems. While climate change is undoubtedly an important factor, the results suggest that human activities play a more dominant role in shaping fluvial sediment supply dynamics. These observations highlight the importance of considering and managing human impacts on river systems to effectively preserve and sustain coastal environments.

4. Conclusions

The present study focused on examining the contributions of climate change and anthropogenic activities to alterations in water discharge and sediment loads within the Red River basin. The analysis demonstrated that fluvial sediment delivery from the Red River system into the adjoining Tonkin Gulf coastline plunged by 90% between 1958 and 2021, predominantly attributable to human interventions like land use changes and dam installations.
The 64-year time series of sediment load measurements at Son Tay station was delineated into five discrete phases. Generally, the impacts of both climate change and anthropogenic factors on the fluvial system exhibited temporal increases, especially regarding anthropogenic impacts. Specifically, sediment load estimates derived from rating curves showed the highest correlation with observed water discharge (R2 = 0.926) during the inaugural phase (1958–1971), indicating minimal human disturbance. Hence, Stage I was utilized as a benchmark reflecting the natural state with discharge-regulated sediment transport. However, since the conclusion of Stage II (1972–1988), human activities have profoundly disrupted the Red River’s intrinsic sediment transport processes. More recently in Stage V (2017–2021), climate change has assumed greater significance, eliciting noticeable increases in both water and sediment flows compared to prior periods.
Climate change projections encompass four scenarios of river flow alterations by −5%/yr, +5%/yr, +10%/yr, and +15%/yr. These percentages were selected based on long-term precipitation analysis (~1960–2021), utilizing data from ten climatic stations in the upper and lower Red River system. Findings indicate that even under the most extreme modeled scenario (+15%/yr increase), compensatory sediment loads will offset merely 8% of system-wide deficits by the 21st century’s conclusion, assuming anthropogenic impacts persist at current levels. As evidenced in the Red River basin, the dominance of human activities over climatic factors is likely prevalent among other heavily engineered global rivers, with respect to coastal sediment provisions. Ultimately, the results underscore the importance of accounting for watershed effects, particularly anthropogenic interventions, within coastal management and planning initiatives. In light of the insights derived from this study, we propose conducting further research employing detailed and comprehensive numerical simulations, aiming to quantitatively estimate the precise extent of sediment changes, taking into account significant factors including both human activities and climate change.

Author Contributions

Q.H.N.: Conceptualization, Methodology, Data curation, Writing—Original draft preparation, Editing final draft. V.N.T.: Methodology, Data curation, Editing final draft. All authors have read and agreed to the published version of the manuscript.

Funding

This research received no specific grant from any funding agency in the public, commercial, or not-for-profit sectors.

Data Availability Statement

The field observation data including suspended sediment concentration and water discharge data are available upon request by contact with the corresponding author ([email protected]/[email protected]).

Conflicts of Interest

The authors have no relevant financial or non-financial interests to disclose.

Appendix A

Table A1. Daily rainfall data collected at ten climatic stations, as shown in Figure 1.
StationPeriodSource
1-Hoang Su Phi (Lo River)1961–2021MONRE
2-Lao Cai (Red River)1960–2021
3-Lai Chau (Da River)1961–2021
4-Ta Bu (Da River)1957–2021
5-Yen Bai (Red River)1960–2021
6-Ghenh Ga (Lo River)1971–2021
7-Ham Yen (Lo River)1960–2021
8-Hoa Binh (Da River)1956–2021
9-Tuyen Quang (Lo River)1960–2021
10-Son Tay (Confluence of three main tributaries)1960–2021
Note: The Vietnam Ministry of Natural Resources and Environment (MONRE).

References

  1. Darby, S.E.; Hackney, C.R.; Leyland, J.; Kummu, M.; Lauri, H.; Parsons, D.R.; Best, J.L.; Nicholas, A.P.; Aalto, R. Fluvial sediment supply to a mega-delta reduced by shifting tropical-cyclone activity. Nature 2016, 539, 276–279. [Google Scholar] [CrossRef] [PubMed]
  2. Sok, T.; Oeurng, C.; Kaing, V.; Sauvage, S.; Kondolf, G.M.; Sánchez-Pérez, J.M. Assessment of suspended sediment load variability in the Tonle Sap and Lower Mekong Rivers, Cambodia. Catena 2021, 202, 105291. [Google Scholar] [CrossRef]
  3. Ranasinghe, R.; Wu, C.S.; Conallin, J.; Duong, T.M.; Anthony, E.J. Disentangling the relative impacts of climate change and human activities on fluvial sediment supply to the coast by the world’s large rivers: Pearl River Basin, China. Sci. Rep. 2019, 9, 9236. [Google Scholar] [CrossRef] [PubMed]
  4. Zhao, Y.; Zou, X.; Gao, J.; Xu, X.; Wang, C.; Tang, D.; Wang, T.; Wu, X. Quantifying the anthropogenic and climatic contributions to changes in water discharge and sediment load into the sea: A case study of the Yangtze River, China. Sci. Total Environ. 2015, 536, 803–812. [Google Scholar] [CrossRef] [PubMed]
  5. Allison, M.A.; Nittrouer, C.A.; Ogston, A.S.; Mullarney, J.C.; Nguyen, T.T. Sedimentation and survival of the Mekong Delta: A case study of decreased sediment supply and accelerating rates of relative sea level rise. Oceanography 2017, 30, 98–109. [Google Scholar] [CrossRef]
  6. Nienhuis, J.H.; Ashton, A.D.; Edmonds, D.A.; Hoitink, A.; Kettner, A.J.; Rowland, J.C.; Törnqvist, T.E. Global-scale human impact on delta morphology has led to net land area gain. Nature 2020, 577, 514–518. [Google Scholar] [CrossRef]
  7. Li, L.; Ni, J.; Chang, F.; Yue, Y.; Frolova, N.; Magritsky, D.; Borthwick, A.G.; Ciais, P.; Wang, Y.; Zheng, C. Global trends in water and sediment fluxes of the world’s large rivers. Sci. Bull. 2020, 65, 62–69. [Google Scholar] [CrossRef] [PubMed]
  8. Zhao, G.; Mu, X.; Jiao, J.; Gao, P.; Sun, W.; Li, E.; Wei, Y.; Huang, J. Assessing response of sediment load variation to climate change and human activities with six different approaches. Sci. Total Environ. 2018, 639, 773–784. [Google Scholar] [CrossRef]
  9. Hu, J.; Zhao, G.; Mu, X.; Tian, P.; Gao, P.; Sun, W. Quantifying the impacts of human activities on runoff and sediment load changes in a Loess Plateau catchment, China. J. Soils Sediments 2019, 19, 3866–3880. [Google Scholar] [CrossRef]
  10. Quang, N.H.; Thang, H.N.; Van An, N.; Luan, N.T. Delta lobe development in response to changing fluvial sediment supply by the second largest river in Vietnam. Catena 2023, 231, 107314. [Google Scholar] [CrossRef]
  11. Quang, N.H.; Loc, H.H.; Park, E. Characterizing sediment load variability in the red river system using empirical orthogonal function analysis: Implications for water resources management in data poor regions. J. Hydrol. 2023, 624, 129891. [Google Scholar] [CrossRef]
  12. Quang, N.H.; Viet, T.Q. Long-term analysis of sediment load changes in the Red River system (Vietnam) due to dam-reservoirs. J. Hydro-Environ. Res. 2023, 51, 48–66. [Google Scholar] [CrossRef]
  13. Dang, T.H.; Coynel, A.; Orange, D.; Blanc, G.; Etcheber, H.; Le, L.A. Long-term monitoring (1960–2008) of the river-sediment transport in the Red River Watershed (Vietnam): Temporal variability and dam-reservoir impact. Sci. Total Environ. 2010, 408, 4654–4664. [Google Scholar] [CrossRef]
  14. Le, T.P.Q.; Garnier, J.; Gilles, B.; Sylvain, T.; Van Minh, C. The changing flow regime and sediment load of the Red River, Viet Nam. J. Hydrol. 2007, 334, 199–214. [Google Scholar] [CrossRef]
  15. Vinh, V.D.; Ouillon, S.; Thanh, T.D.; Chu, L. Impact of the Hoa Binh dam (Vietnam) on water and sediment budgets in the Red River basin and delta. Hydrol. Earth Syst. Sci. 2014, 18, 3987–4005. [Google Scholar] [CrossRef]
  16. Wei, X.; Sauvage, S.; Ouillon, S.; Le, T.P.Q.; Orange, D.; Herrmann, M.; Sanchez-Perez, J.-M. A modelling-based assessment of suspended sediment transport related to new damming in the Red River basin from 2000 to 2013. Catena 2021, 197, 104958. [Google Scholar] [CrossRef]
  17. Luu, T.N.M.; Garnier, J.; Billen, G.; Orange, D.; Némery, J.; Le, T.P.Q.; Tran, H.T.; Le, L.A. Hydrological regime and water budget of the Red River Delta (Northern Vietnam). J. Asian Earth Sci. 2010, 37, 219–228. [Google Scholar] [CrossRef]
  18. Pham, H.V.; Torresan, S.; Critto, A.; Marcomini, A. Alteration of freshwater ecosystem services under global change–A review focusing on the Po River basin (Italy) and the Red River basin (Vietnam). Sci. Total Environ. 2019, 652, 1347–1365. [Google Scholar] [CrossRef] [PubMed]
  19. Le, T.P.Q.; Gilles, B.; Garnier, J.; Sylvain, T.; Denis, R.; Anh, N.X.; Van Minh, C. Nutrient (N, P, Si) transfers in the subtropical Red River system (China and Vietnam): Modelling and budget of nutrient sources and sinks. J. Asian Earth Sci. 2010, 37, 259–274. [Google Scholar] [CrossRef]
  20. Wang, J.; Ishidaira, H.; Xu, Z. Effects of climate change and human activities on inflow into the Hoabinh Reservoir in the Red River basin. Procedia Environ. Sci. 2012, 13, 1688–1698. [Google Scholar] [CrossRef]
  21. Nguyen Hao, Q.; Takewaka, S. Historical reconstruction of shoreline evolution at the Nam Dinh Coast, Vietnam. Coast. Eng. J. 2023, 65, 3–20. [Google Scholar] [CrossRef]
  22. Li, Y.; Fang, L.; Yuanzhu, W.; Mi, W.; Ji, L.; Guixiang, Z.; Yang, P.; Chen, Z.; Bi, Y. Anthropogenic activities accelerated the evolution of river trophic status. Ecol. Indic. 2022, 136, 108584. [Google Scholar] [CrossRef]
  23. Walling, D.; Russell, M.; Hodgkinson, R.; Zhang, Y. Establishing sediment budgets for two small lowland agricultural catchments in the UK. Catena 2002, 47, 323–353. [Google Scholar] [CrossRef]
  24. Xu, K.; Chen, Z.; Zhao, Y.; Wang, Z.; Zhang, J.; Hayashi, S.; Murakami, S.; Watanabe, M. Simulated sediment flux during 1998 big-flood of the Yangtze (Changjiang) River, China. J. Hydrol. 2005, 313, 221–233. [Google Scholar] [CrossRef]
  25. Warrick, J.A. Trend analyses with river sediment rating curves. Hydrol. Process. 2015, 29, 936–949. [Google Scholar] [CrossRef]
  26. Meyfroidt, P.; Lambin, E.F. The causes of the reforestation in Vietnam. Land Use Policy 2008, 25, 182–197. [Google Scholar] [CrossRef]
  27. Kripalani, R.; Oh, J.; Chaudhari, H. Response of the East Asian summer monsoon to doubled atmospheric CO 2: Coupled climate model simulations and projections under IPCC AR4. Theor. Appl. Climatol. 2007, 87, 1–28. [Google Scholar] [CrossRef]
Figure 1. The location of the Red River basin and the nine large reservoirs are as follows: NS-Nansha, MS-Madushan, TQ-Tuyen Quang, TB-Thac Ba, HB-Hoa Binh, SL-Son La, HQ-Huoi Quang, BC-Ban Chat, and LC-Lai Chau. Ten climatic stations located in the upper reaches of the three main tributaries: Hoang Su Phi (1), Ham Yen (7), Ghenh Ga (6), and Tuyen Quang (9) on the Lo River; Lao Cai (2) and Yen Bai (5) on the Red River (main channel); and Lai Chau (3), Ta Bu (4), Hoa Binh (8) on the Da River; as well as the Son Tay (10, ST) hydrological gauging and climatic station (red triangle). The monitoring of sediment exiting the upstream reservoirs is conducted at the Son Tay station, which is situated immediately downstream of the nine large dam-reservoirs.
Water 16 01155 g001
Figure 2. Inter-annual variation in sediment load and water discharge by the Red River system observed at the Son Tay hydrological gauging station in the period 1958–2021. Nine large dams have been built, and under their operations since the 1970s (dashed lines). The names of dams are referred to Figure 1 and Table A1.
Water 16 01155 g002
Figure 3. Sediment rating curves in five different periods of time.
Water 16 01155 g003
Figure 4. The long-term (~1960–2021) behavior of precipitation at ten climatic stations, situated along the Red River basin in Vietnam, spanning from upstream to downstream (see Figure 1). The colors grey, red, and blue represent the stations on the Da, Red (main channel), and Lo Rivers, respectively.
Water 16 01155 g004
Figure 5. Rate of precipitation in the last four decades (~1960–2010) and the latest decade (2011–2021) at the ten climatic stations (see Figure 1). Panels (ac) represent the Lo, main channel (Red), and Da Rivers, respectively. Error bars represent standard deviation (dashed lines).
Water 16 01155 g005aWater 16 01155 g005b
Figure 6. Cumulative precipitation compared to water discharge (left panel) and sediment load (right panel) in the Red River basin at example stations in the upper reach (Lai Chau) and lower reach (Son Tay). The red lines represent the linear trend for the entire period (~1960–2021), while the blue lines represent the linear trend of sub-periods.
Water 16 01155 g006
Figure 7. Comparison between monthly cumulative sediment loads predicted using the Stage I rating curves and observed sediment loads in the Red River system during the five different Stages. Compared to the simulated sediment load, the measured load was higher in Stages I and II. A dramatic decrease, however, was observed in the measured load from Stage III onwards, becoming even more severe up to Stage V.
Water 16 01155 g007
Figure 8. The fluvial sediment supply by the Red River system to the sea projected to 2100 under the combined effect of natural (including climate change) and anthropogenic sources (red dots) and under natural forcing only, including climate change (black circles). Four scenarios applied for the river flow with a decrease of −5% and an increase of +5, +10, and +15 per year.
Water 16 01155 g008
Table 1. Nine large dams with reservoirs have been built since the 1970s and are currently operational within the Red River system in both Vietnam and China (Nguyen and Viet, 2023).
DamConstructed Period (mo/yr)Upstream Watershed (km2)Volume (km3)
TB (Thac Ba)Jan. 1964–Oct. 197161702.49
HB (Hoa Binh)Dec. 1979–Dec. 198857,2859.45
TQ (Tuyen Quang)Dec. 2002–Jun. 200813602.24
NS (Nansha-China)Jun. 2006–Dec. 20082630.26
MS (Madushan-China)Jan. 2008–Dec. 20100.55
SL (Son La)Dec. 2005–Dec. 201043,7609.26
BC (Ban Chat)Jan. 2006–Feb. 201320172.13
HQ (Huoi Quang)Jan. 2006–Dec. 201529300.18
LC (Lai Chau)Jan. 2011–Dec. 201626,0001.21
Note: Dams with capacity greater than 0.1 km3, considered as large ones in this study.
Table 2. Parameters of the fitted rating curve (a, b) and inferential statistical metrics (r2, p) in five different Stages: I (1958–1971), II (1972–1988), III (1989–2010), IV (2011–2016), and IV (2017–2021).
Sources of ChangesStageParametersMean
abr2pWater Discharge (106 m3/mo)Sediment Load (106 ton/mo)
Natural conditionI (1958–1971)7 × 10−81.97890.926<0.00019632.79.60
Significant land use changes II (1972–1988)3 × 10−82.08560.807<0.00019137.89.64
Hoa Binh dam III (1989–2010)2 × 10−82.01310.719<0.00018816.83.82
Previous dams and a series of new onesIV (2011–2016)5 × 10−71.5640.809<0.00017506.30.73
All the dams and climate changeV (2017–2021)6 × 10−71.57270.800<0.00018401.61.01
Table 3. Scenarios of the prediction for the sediment load in the Red River system to 2100.
No.ScenariosRate of River Flow (%)Sources/Note
1Decrease −5Estimated in this study
2Increase+5Estimated in this study
3Increase+10Estimated in this study, and the Pearl River basin (China), the upper reach of the Red River
4Increase+15Estimated in this study
Disclaimer/Publisher’s Note: The statements, opinions and data contained in all publications are solely those of the individual author(s) and contributor(s) and not of MDPI and/or the editor(s). MDPI and/or the editor(s) disclaim responsibility for any injury to people or property resulting from any ideas, methods, instructions or products referred to in the content.

