
A Framework for Assessing Food Baskets Based on Water and Carbon Footprints


1
Department of Water Engineering, Faculty of Agriculture Technology (Aburaihan), College of Agriculture and Natural Resources, University of Tehran, Tehran 33916-53755, Iran
2
School of Energy Engineering and Sustainable Resources, College of Interdisciplinary Science and Technologies, University of Tehran, Tehran 14174-66191, Iran
3
Department of Community Nutrition, School of Nutritional Sciences and Dietetics, Tehran University of Medical Sciences (TUMS), Tehran 14176-13151, Iran
4
Department of Environmental Conservation, College of Natural Sciences, University of Massachusetts, Amherst, MA 01003, USA
*
Author to whom correspondence should be addressed.
Water 2024, 16(9), 1196; https://doi.org/10.3390/w16091196
Submission received: 9 March 2024
/
Revised: 14 April 2024
/
Accepted: 15 April 2024
/
Published: 23 April 2024
(This article belongs to the Section Water Use and Scarcity)
Abstract
:The composition of food baskets can significantly influence the water consumption rate and society’s environmental impact. This study evaluates the sustainability of Iran’s food and nutrition security by evaluating five food baskets using water and carbon-footprint indices. These food baskets are the common Iranian food basket (CIFB), the vegetarian food basket (VFB), the Ministry of Health desired food basket (MHDFB), the Swiss Society for Nutrition food basket (SSNFB), and the Mediterranean food basket (MFB). This study also examines the role of Iran’s agricultural sector under the Paris Climate Change Agreement (COP21). The TOPSIS multi-criteria decision-making method was used to identify the most desirable food basket. The results of this study show that the VFB could be the most desirable alternative to the CIFB. Replacing the CIFB with the VFB causes a 10% and 21% lower water and carbon footprint, respectively. From a 30-year perspective (around 2050), choosing the VFB would reduce the blue water footprint by 19.7 BCM and the gray water footprint by 3.6 BCM compared to the CIFB. According to the provisions of COP21 regarding Iran’s voluntary program to reduce greenhouse gas emissions, the agricultural sector will be one of the sources of greenhouse gas emissions that will face an upward trend. Hence, to adhere to this voluntary commitment, these emissions should be reduced by changing the CIFB to the VFB or reducing emissions in other sectors, such as industry. Choosing the VFB can reduce 10.7 million tons of CO2 emissions, which can be a significant step for the agricultural sector in Iran in reducing greenhouse gas emissions. Overall, considering the characteristics of farm products (water and carbon footprints) in Iran, a country located in a semi-arid climate, the VFB is recommended.
1. Introduction
Agriculture has a long history as a food production support for human nutrition and is critical in influencing the environment. Global agricultural systems with the goal of food production account for 19–29% of greenhouse gas emissions [1], 70% of water resources consumption [2], and 38% of land use [3]. Meeting the future demand for food is a significant challenge for current food production systems. To achieve the goal of providing adequate food, increasing the cultivation area, and enhancing crop productivity have always been proposed as critical solutions. Still, the direct and indirect effects of providing sufficient food on the environment have been neglected [4]. Evidence shows that livestock production is a chief factor in deforestation, biodiversity loss, and land degradation [5]. The production and consumption of these products are an integral part of people’s lives and need careful planning. Assessing the type of food consumed and its share in the food basket can be used to reduce harmful environmental effects. Appraising water and carbon footprint indices can examine the impact of agricultural production on the environment [6]. Water footprint refers to the volume of freshwater used directly or indirectly for various purposes [7]. Water footprint has been proposed as a link between water resources and the use of multiple goods [8]. Carbon footprint refers to the total amount of carbon dioxide and other greenhouse gases (GHGs) emitted during the product life cycle [9]. Awareness of agricultural products and, consequently, household food basket impacts on water resources and the environment, which can lead to the formation of a policy framework at the macro level of a country. This framework can provide detailed planning to achieve sustainable food and nutrition security.
The research conducted in recent years has emphasized the importance of the community food basket in the proper water and food governance [10,11]. One of the early research studies focusing on lifestyle impact on the environment is the study conducted by Friel et al. [12]. They pointed out that a vegetarian diet is preferable to meat-based meals because, in the food baskets, where meat is a priority, a lot of pressure is put on the biodiversity and ecology of animals and can affect the consumer’s health. This research was conducted solely based on qualitative information, such as the impact of meat consumption on environmental degradation, without utilizing indicators such as the ecological footprint. Van Dooren et al. [13], examined various food baskets’ nutritional values and environmental impacts through two greenhouse gas emissions and land occupancy criteria. The results revealed that the Mediterranean diet, compared to other diets that contain meat, milk, and extras, such as snacks, sweets, pastries, and beverages, is generally the health-focused option with a high sustainability score. Since agriculture and, consequently, the food production systems have the largest share of water consumption, the impact of the food production systems on the environment will not be possible without considering water consumption. Naja et al. [14], in addition to the amount of water consumed in the Lebanese–Mediterranean food basket, measured the amount of carbon and energy associated with their food basket and compared it with other protein-based and Western baskets. The results showed that the amount of water, energy, and carbon consumption in the Lebanese–Mediterranean food basket was lower than in different food baskets.
In research on food and nutrition security in Iran, various aspects of food and nutrition security have been studied. In a recent study [15], the role of population, energy intake, and changes in food consumption patterns in the carbon footprint of Iranian society was examined. The results indicated an inappropriate dietary pattern in Iran, leading to a 1.6-fold increase in carbon footprint between 1961 and 2019. A study using the Iranian dietary data in 2001 assessed the impact of the Iranian community’s diet on the environment. The results emphasized the significant impact of the diet on the environment and showed that a diet focused primarily on animal-based foods poses a risk to health and the environment [16]. Another study presented a dietary basket using a linear programming method to reduce the water footprint, carbon footprint, and cost while increasing the nutrient-rich food index [17].
Furthermore, a review study emphasized the need for Iranians to shift to a sustainable diet by increasing the consumption of grains, vegetables, and dairy products while reducing the intake of red meat, bread, eggs, and fats [18]. In studies on the effect of targeting subsidies on food and nutrition security of households [19], the impact of the COVID-19 pandemic on food and nutrition security in families [20], and the study of agricultural mechanization in food and nutrition security [21], the technical and social dimensions of food and nutrition security in Iran have been taken into account. These include considering the inclusion of technology in farm mechanization and achieving self-sufficiency in the production of strategic products like wheat (technical dimensions), as well as issues such as water bankruptcy, declining investment interest in the production sector, and the costs of land ownership (social dimensions). In these studies [18,19,20,21], the scale was either at the family level or at the level of the environmental aspects of the food basket, and the impact on ensuring sustainable food and nutrition security has not been considered. In research on food and nutrition security in Iran, the environmental aspects that can pave the way for sustainable food and nutrition security have been left behind. Given the link between food and nutrition security and environmental issues, predicting the future of sustainable food and nutrition security in Iran as a country located in the Middle East and North Africa region (MENA) region and its alignment with Iran’s voluntary program in the Paris Climate Change Agreement (COP21) is also significant [22].
This study aims to identify the most desirable food basket that causes sustainable food and nutrition security in Iran. Accordingly, for the first time, using the carbon footprint index, greenhouse gas emissions of Iran’s agricultural sector in 2030 were quantitatively examined. In this study, in addition to studying and predicting the sustainability of food and nutrition security in Iran, the impact of food and nutrition security on the trend of Iran’s water resources withdrawal and greenhouse gas production in the agricultural sector is also investigated.
2. Materials and Methods
2.1. Data and Research Process
In the first step, information and data related to these food baskets’ compositions were collected (Figure 1). For the common Iranian food basket, the per capita consumption of each ingredient should be calculated. In this regard, the required data on products’ attributes, agricultural production systems, and cultivation information were collected from the statistics provided by the Ministry of Agricultural-Jihad [23]. Then, in the next step, each food basket’s impact on the environment and water resources was quantitatively evaluated by collecting the data needed to calculate the water and carbon footprints. After comparing the water and carbon footprints of food baskets, using the TOPSIS multi-criteria decision-making method, the most desirable food basket was determined. Afterward, the sustainability of food and nutrition was predicted by considering Iran’s population horizon in 2030 and 2050. Finally, greenhouse gas production in Iran’s agricultural sector was discussed under the Paris Climate Change Agreement (COP21). Figure 1 shows the research process.
Food Baskets
The food pattern of society is derived from people’s consumption habits and manifests itself as a food basket. In this study, five food baskets are examined (Table 1), including A: the vegetarian food basket (VFB) [24], B: the Ministry of Health desired food basket (MHDFB) [25], C: the Swiss Society for Nutrition food basket (SSNFB) [24], D: the Mediterranean food basket (MFB) [26], and E: the common Iranian food basket (CIFB), which reflects the present food pattern of the Iranian people. This food basket was determined through per capita food consumption in 2019 using Equation (9). Different weights for food consumption are included in each of the mentioned food baskets (Table 1). Therefore, selecting each of these food baskets is expected to have different environmental consequences. According to Table 1, in the CIFB, bread and grains have the highest consumption share (114 kg/capita/year), while the oils and fats (other) group have the lowest share (36 kg/capita/year). In the MHDFB, the consumption share of bread and grains has reached the highest share at 155.1 kg/capita/year, and other food groups like fruits and vegetables also play a more prominent role in providing the food basket. In the VFB, the consumption of dairy products has been reduced to zero, with a major emphasis on vegetable consumption (246.3 kg/capita/year). In the SSNFB, there is a significant increase in dairy consumption (120.4 kg/capita/year), while the consumption of bread and grains has decreased and is even lower than other food baskets (45.2 kg/capita/year). In the MFB, there is a major emphasis on vegetable (269 kg/capita/year) and fruit (175 kg/capita/year) consumption, with an emphasis on dairy in this food basket as well (71 kg/capita/year).
where is agricultural and livestock products which are produced in Iran (ton) [23], is the amount of imported agricultural and livestock products to Iran (ton) [27], is the amount of exporting agricultural and livestock products from Iran (ton) [27], is food is needed for feeding livestock and poultry (ton) [28], is product losses during planting, harvesting, and distribution (ton) [23] and is the population of the country in the considered year (million people) [28]. Table 1 shows the common Iranian and proposed food baskets regarding per capita consumption.
2.2. Quantitative Impact Assessment of the Food Baskets on Water Resources and the Environment
2.2.1. Water Footprint
The world’s freshwater resources are increasingly threatened by increased water abstraction for various purposes and the pollution that follows [29,30]. Therefore, by using indicators, water consumption and product pollution can be quantified to manage them better. One of these indicators, which accounts for direct and indirect water use in a good production process, is the water footprint indicator [31]. Three types of water footprints have been defined in the literature: blue, green, and gray water footprints. The blue water footprint refers to the volume of water provided to the plant from surface or groundwater sources through irrigation. The green water footprint is the volume of water in the form of moisture in the soil that plants uptake. Finally, the gray water footprint is the volume of contaminated water that must be treated for reuse [32]. This study used two blue water and gray water footprints because, in recent years, local farmers in Iran have turned to irrigated cultivation. Since crop productivity and economic benefits of this method are more than rainfed cultivation [33], this has caused Iran’s irrigated cultivation level to reach 86.5% and 51.8% in horticultural and agronomical productions, respectively [23]. It is also noteworthy that a green water footprint is a positive indicator, which means that the higher the green water footprint, the less pressure on water resources. In contrast, increasing the volume of blue and gray water footprints means more pressure on water resources. Therefore, the green water footprint is ignored.
- Water Footprint of Agricultural Products
- Blue Water Footprint
The volume of water used for plant growth and harvest is used to calculate a crop’s water footprint. Determining the blue water footprint can be considered an important indicator in agricultural water management [34]. This indicator has been used to better manage agricultural water resources in various studies in arid regions [35,36]. In this study, instead of using the evapotranspiration parameter that has been used to calculate the water footprint [37], the Gross Irrigation Water Requirement (GIWR) parameter was used. This parameter considers irrigation efficiency when calculating the water footprint (Equation (1)). The advantage of considering the GIWR parameter is that the final water footprint value is more realistic. This means that under the same climatic conditions, impacts of field management and type of irrigation systems are considered in the crop’s water footprint. Therefore, by developing an equation for the blue water footprint, which is closer to the reality of plant water consumption, the blue water footprint index is calculated from the following equation:
where is the blue water footprint (m3·ton−1), is the gross irrigation water requirement (m3·ha−1), and is the crop yield (kg·ha−1). The gross irrigation water requirement is calculated using Equation (2) [38].
where is the net irrigation water requirement (mm), and is irrigation efficiency. According to [39], total irrigation efficiency for horticultural and agronomical productions was assumed to be 39% and 49%, respectively. The reference method for calculating the net irrigation water requirement is presented in Supplementary Materials.
- Gray Water Footprint
The gray water footprint is an indicator that covers both the environmental and water resources aspects of production. Given the importance of pollution management in agriculture, the footprint of graywater has been investigated in various studies [40,41]. In the agricultural sector, chemical fertilizers are primary sources of water pollution. Therefore, nitrogen and phosphorus fertilizers have been studied as the most important chemical fertilizers. Information on the average application of nitrogen and phosphorus fertilizers was obtained from the Ministry of Agricultural-Jihad [23]. The method of calculating the gray water footprint is based on the method presented by [42,43]. In this study, the maximum permissible concentrations of nitrate and phosphate in terms of phosphorus () are considered equal to 10 mg·L−1 and 50 mg·L−1, respectively [44]. Therefore, the effect of the agricultural sector pollutant sources (fertilizers) on water resources is identified by evaluating the gray water footprint. The equation used to calculate the gray water footprint is presented as follows [45].
where is the leaching coefficient which was calculated based on the framework presented by [46], is the usage rate of nitrogen or phosphorus fertilizer (kg·ha−1) [23] and is the crop yield in irrigated cultivation (kg·ha−1) [23].
- 2.
- Water Footprint of Animal products
The water footprint value of livestock products equals the total volume of water used for livestock breeding. The amount of water consumed by an animal consists of three components, including water for drinking (), cleanliness of the animal housing (), and the forage water footprint (), and its amount depends on various conditions such as environmental conditions and farm system (traditional or modern), type of ration used, farm management, and climatic conditions of the animal’s growing environment. Factors encompassing environmental conditions and farm system (traditional or modern), type of forage, farm management, and climatic conditions of the animal growing environment can impressively influence the volume of consumed water. With this explanation, the animal’s water footprint () is calculated as follows (Equation (4)) [30]:
The livestock forage water footprint consists of two main parts. The first is the water used to combine the feed ( in m3·year−1), and the second is the forage water footprint ( in m3·ton−1). The following equation shows the method for calculating the livestock-production water footprint [30].
where is the amount of consumed forage in a year (ton·year−1), and is the weight of a carcass in the slaughterhouse or the weight of livestock and poultry products such as milk and eggs (ton).
Given the high share of other protein sources, such as white meat and eggs in food baskets, it is also essential to study this type of animal production’s water footprint. Calculations of water footprints of poultry products are the same as those of other livestock. Regarding the fish-meat water footprint, the values obtained by Yuan et al. [47] were used. In this study, the farmed-fish water footprint was evaluated using the Von Bertalanffy growth model [48], and these values were used.
2.2.2. Carbon Footprint
- Agricultural Production Carbon Footprint
Greenhouse gas emissions will change the available water resources in the long term. Agriculture as a source of greenhouse gas emissions, with chemical fertilizers, energy, and fossil fuels, can have a significant impact on the climate, water resources, and the environment. Therefore, to quantify and better understand the impact of agriculture on greenhouse gas emissions, an index called the carbon footprint can be used. In this research, the framework presented by [49] has been used to calculate the carbon footprint of the agricultural sector. The carbon footprint of a product () is defined as Equation (6).
where is emission during crop life span (kg·ha−1), is emission during crop life span (kg·ha−1), is emission during crop life span (kg·ha−1), and , and are the global warming potential (GWP) values, which according to [50] are equal to 1, 298 and 25, respectively. is the yield of crop (kg·ha−1). The emission parameter calculation is presented in Supplementary Materials.
- 2.
- Animal production Carbon Footprint
The carbon footprint content of animal products () (kg CO2-eq.kg−1) consists of four sections [51]:
where is the animal forage carbon footprint (kg CO2-eq·kg−1), is the carbon footprint from farm management (kg CO2-eq·kg−1), is the carbon footprint of methane emissions from enteric fermentation (kg CO2-eq·kg−1) and is the carbon footprint of manure treatment (kg CO2-eq·kg−1). Assuming the production conditions of aquaculture products are the same, the values mentioned in the research of [52] were used as the carbon footprint of fish meat. The calculation of parameters in Equation (7) is presented in Supplementary Materials.
In the final step, the carbon footprint of each unit of livestock product () (kg·CO2·kg−1) is calculated using Equation (8).
where denotes the animal carbon footprint (kgCO2), and is the produced product (kg).
2.3. TOPSIS Multi-Criteria Decision-Making Method
Multi-criteria decision-making (MCDM) is a topic that deals with the decision-making process in the presence of different and sometimes contradictory criteria [53]. Solving decision models can either determine the absolute best answer or choose an option closest to the solution (ideal option). In this study, the best answer is a food basket that ensures food and nutrition security and environmental sustainability. In this regard, according to the various criteria that exist in this study to determine the optimal food basket (i.e., blue water footprint, gray water footprint, and carbon footprint), there is a requirement to choose the best option (one of the considered food baskets) through multi-criteria decision-making methods. One of these approaches is the TOPSIS ranking method. This method, introduced by Hwang and Yoon (2011) [54], has been widely used as the most famous multi-criteria decision-making method in water resources and environmental studies [55]. In the study by Radmehr et al. (2022) [56], the TOPSIS model was utilized to determine the best option for agricultural water management in an extensive irrigation network. Studies on evaluating environmental carrying capacity [57], ranking risk in water distribution networks [58], and assessing the potential of groundwater [59] have also emphasized the high performance of this model. The TOPSIS technique can be used for ranking and comparing different options, selecting the best choice, and determining the distances between options and grouping them. One of the advantages of this method is that the criteria or indicators used for comparison can have different measurement units and positive and negative natures [60]. In other words, negative and positive indicators can be combined in this technique. In the TOPSIS method, the distance of each option from the ideal solution is considered. The option is selected with the minimum distance from the positive ideal solution and the maximum distance from the negative ideal. In other words, the ideal solution has the highest benefit and the lowest cost, while the non-ideal solution incurs the highest cost and yields the lowest benefit [61]. The computation method is presented in Supplementary Materials.
3. Results
3.1. Evaluation of Studied Food Baskets from the Perspective of the Blue Water Footprint
Appraising and identifying the water footprints of food basket ingredients can be considered a criterion for quantifying the impact of agriculture and food production on available freshwater resources. Therefore, the water footprints of the five food baskets considered in this study were compared (Figure 2 and Figure 3). In these diagrams, the water footprint of food baskets is determined based on Iran’s current population (84.9 million people). The effect of food consumption or food groups from a macro perspective can be examined from two dimensions. The first is the water footprint of a product unit, and the second is the amount of food consumed. In other words, the high water footprint for each unit of a food item and its high share in the food basket creates a synergy that multiplies its impact on water resources. On the other hand, there is also a different situation. For instance, among the studied food baskets, the fruits and vegetables food groups have the highest consumption share (Table 1), while their water footprint is not the highest among other food groups (Figure 2A and Figure 3A) since the water footprint in each food item is low. The consumption of bread and cereals in the CIFB (as a food basket with a high water footprint) is 114 (kg·year−1), and the amount is 70 (kg·year−1) for the VFB (Table 1). The difference of 44 kg in this food group’s consumption causes the CIFB to withdraw 11.5 billion cubic meters (BCM) more water than the VFB (Figure 2A). In the VFB, the per capita consumption of fruits and vegetables is 163.2 (kg·year−1) more than in the CIFB (Table 1). Nevertheless, the VFB has only a 7.3 BCM higher blue water footprint than the CIFB (Figure 2A). Accordingly, a simultaneous review of food’s water footprint and the amount consumed can indicate the food basket’s effect on water resources. The weight of a food cannot show the impact of the food basket on water resources individually. The blue water-footprint analysis results show that the SSNFB selection for Iran’s current population required 50.9 BCM of surface and groundwater resources, the lowest amount among the studied food baskets (Figure 2B). In contrast, selecting the CIFB by devoting a 60.8 BCM blue water footprint will put the highest pressure on Iran’s water resources (Figure 2). Also, the blue water footprint of the MHDFB, the VFB, and the MFB are 59.4 BCM, 56.3 BCM, and 60.2 BCM, respectively (Figure 2B). This indicates that the CIFB is less desirable than the other four food baskets. Overall, since the blue water footprint is lowest in the SSNFB, the priority is to change the common food basket for the SSNFB.
3.2. Evaluation of Studied Food Baskets from the Perspective of the Gray Water Footprint
In addition to indicating the volume of water that should be used to treat polluted water [43], the gray water footprint is an environmental indicator that can also illustrate a decrease in water quality. Therefore, a food basket with a lower gray water footprint than other food baskets has priority in selection. The CIFB, the MHDFB, the VFB, the SSNFB, and the MFB have gray water footprints equal to 3.2, 3, 1.6, 2.4, and 2.7 BCM, respectively (Figure 3B). According to Figure 3A, the food group of meat, eggs, legumes, and nuts has the largest share in the production of the gray water footprint (except the VFB). In the MHDFB, the contribution of this food group to the gray water footprint production is more than others and results in a 1.4 BCM gray water footprint. Therefore, according to Figure 3B, the VFB has been introduced as the best food basket because it causes less environmental pollution and impact on water resources. The cause of this issue is that in the VFB, animal products such as eggs and various types of meat (with a high gray water footprint) are eliminated, and the focus is on fruit and vegetable consumption.
3.3. Evaluation of Studied Food Baskets from the Perspective of the Carbon Footprint
The carbon footprint as an environmental indicator can quantify the effects of food baskets on greenhouse gas emissions. Therefore, the carbon footprint index can be a meaningful criterion in determining the best food basket. Our examination revealed that the Swiss Society’s for Nutrition food basket with a carbon footprint equal to 27 (million tons CO2·year−1) has the lowest carbon footprint value among the studied food baskets (Figure 4). The CIFB, with a carbon footprint of 46.7 (million tons CO2·year−1), is the most undesirable food basket. Other food baskets, including the MHDFB, Vegetarian, and MFBs, have carbon footprints equal to 41, 37, and 33 (million tons CO2·year−1), respectively (Figure 4). The change from the CIFB to other food baskets decreases the produced carbon footprint, which is a reduction for the food basket of the Swiss Society for Nutrition of 19.7 (million tons CO2·year−1), which is more than others. As can be seen in Figure 4, considering the high consumption of bread and cereals in the two MHDFB and CIFB food baskets has led to the allocation of 50.6% and 61% of carbon emissions to these food groups (equivalent to 20.7 and 28.5 million tons CO2. year−1, respectively).
Nevertheless, carbon emissions were distributed among other food groups in the other three food baskets, with a reduced concentration of bread and cereal consumption (Figure 4). For instance, in the SSNFB, the emphasis is mainly on consuming fruits, vegetables, and dairy products, while the production of these food groups leads to 12.4 (million tons of CO2·year−1). Therefore, increasing the share of fruits, vegetables, and dairy products in food baskets and reducing the consumption of bread and cereals (primarily wheat and barley in the Iranian food basket) can significantly reduce the carbon footprint. As choosing a food basket with a lower carbon footprint is preferable, the SSNFB, which has the lowest carbon footprint, can be considered a suitable option for an Iranian food basket.
3.4. Selection of the Most Desirable Food Basket Using the TOPSIS Method
On the one hand, according to the existence of different indicators (blue and gray water footprints and carbon footprint) for evaluating the studied food baskets and, on the other hand, the various results obtained from their evaluation, a desirable food basket from the perspective of the studied indicators should be selected as the ideal option. At this stage, the TOPSIS decision-making method is used. To apply the TOPSIS method to determine the most desirable food basket for Iranian society, three decision criteria, including blue water footprint, gray water footprint, and carbon footprint with an equal weight of 0.33, and five options encompassing the CIFB, MHDFB, VFB, SSNFB, and MFB are considered. The results showed that the VFB, with the highest preference coefficient (CL = 0.701), is the priority for food basket selection for the Iranian community (Table 2). Therefore, according to the TOPSIS results, choosing the VFB can lead to sustainable food and nutrition security in Iran. This food basket is recommended for planning sustainable food and nutrition security in Iran.
3.5. Predicting Water and Carbon Footprints of Food Baskets Based on Demographic Scenarios
3.5.1. Evaluating the Trend in, and Effects of, the Desired Food Basket (VFB) and CIFB on Water Resources from the Perspective of the Water Footprint in 2030 and 2050
Given the increase in Iran’s population and the growing need for food, predicting food baskets’ water and carbon footprints can provide a worthy perspective on sustainable food and nutrition security. To predict the sustainability of Iran’s food and nutrition security, the water and carbon footprints of the two CIFB and VFB (desirable food baskets) for the population of Iran are predicted and compared in the years 2030 and 2050. Predictions indicate that in 2030 and 2050, Iran’s population will increase by 15 and 19 million people, respectively, compared to 2021 [62]. Therefore, predicting sustainable food and nutrition security status for the future population will be crucial.
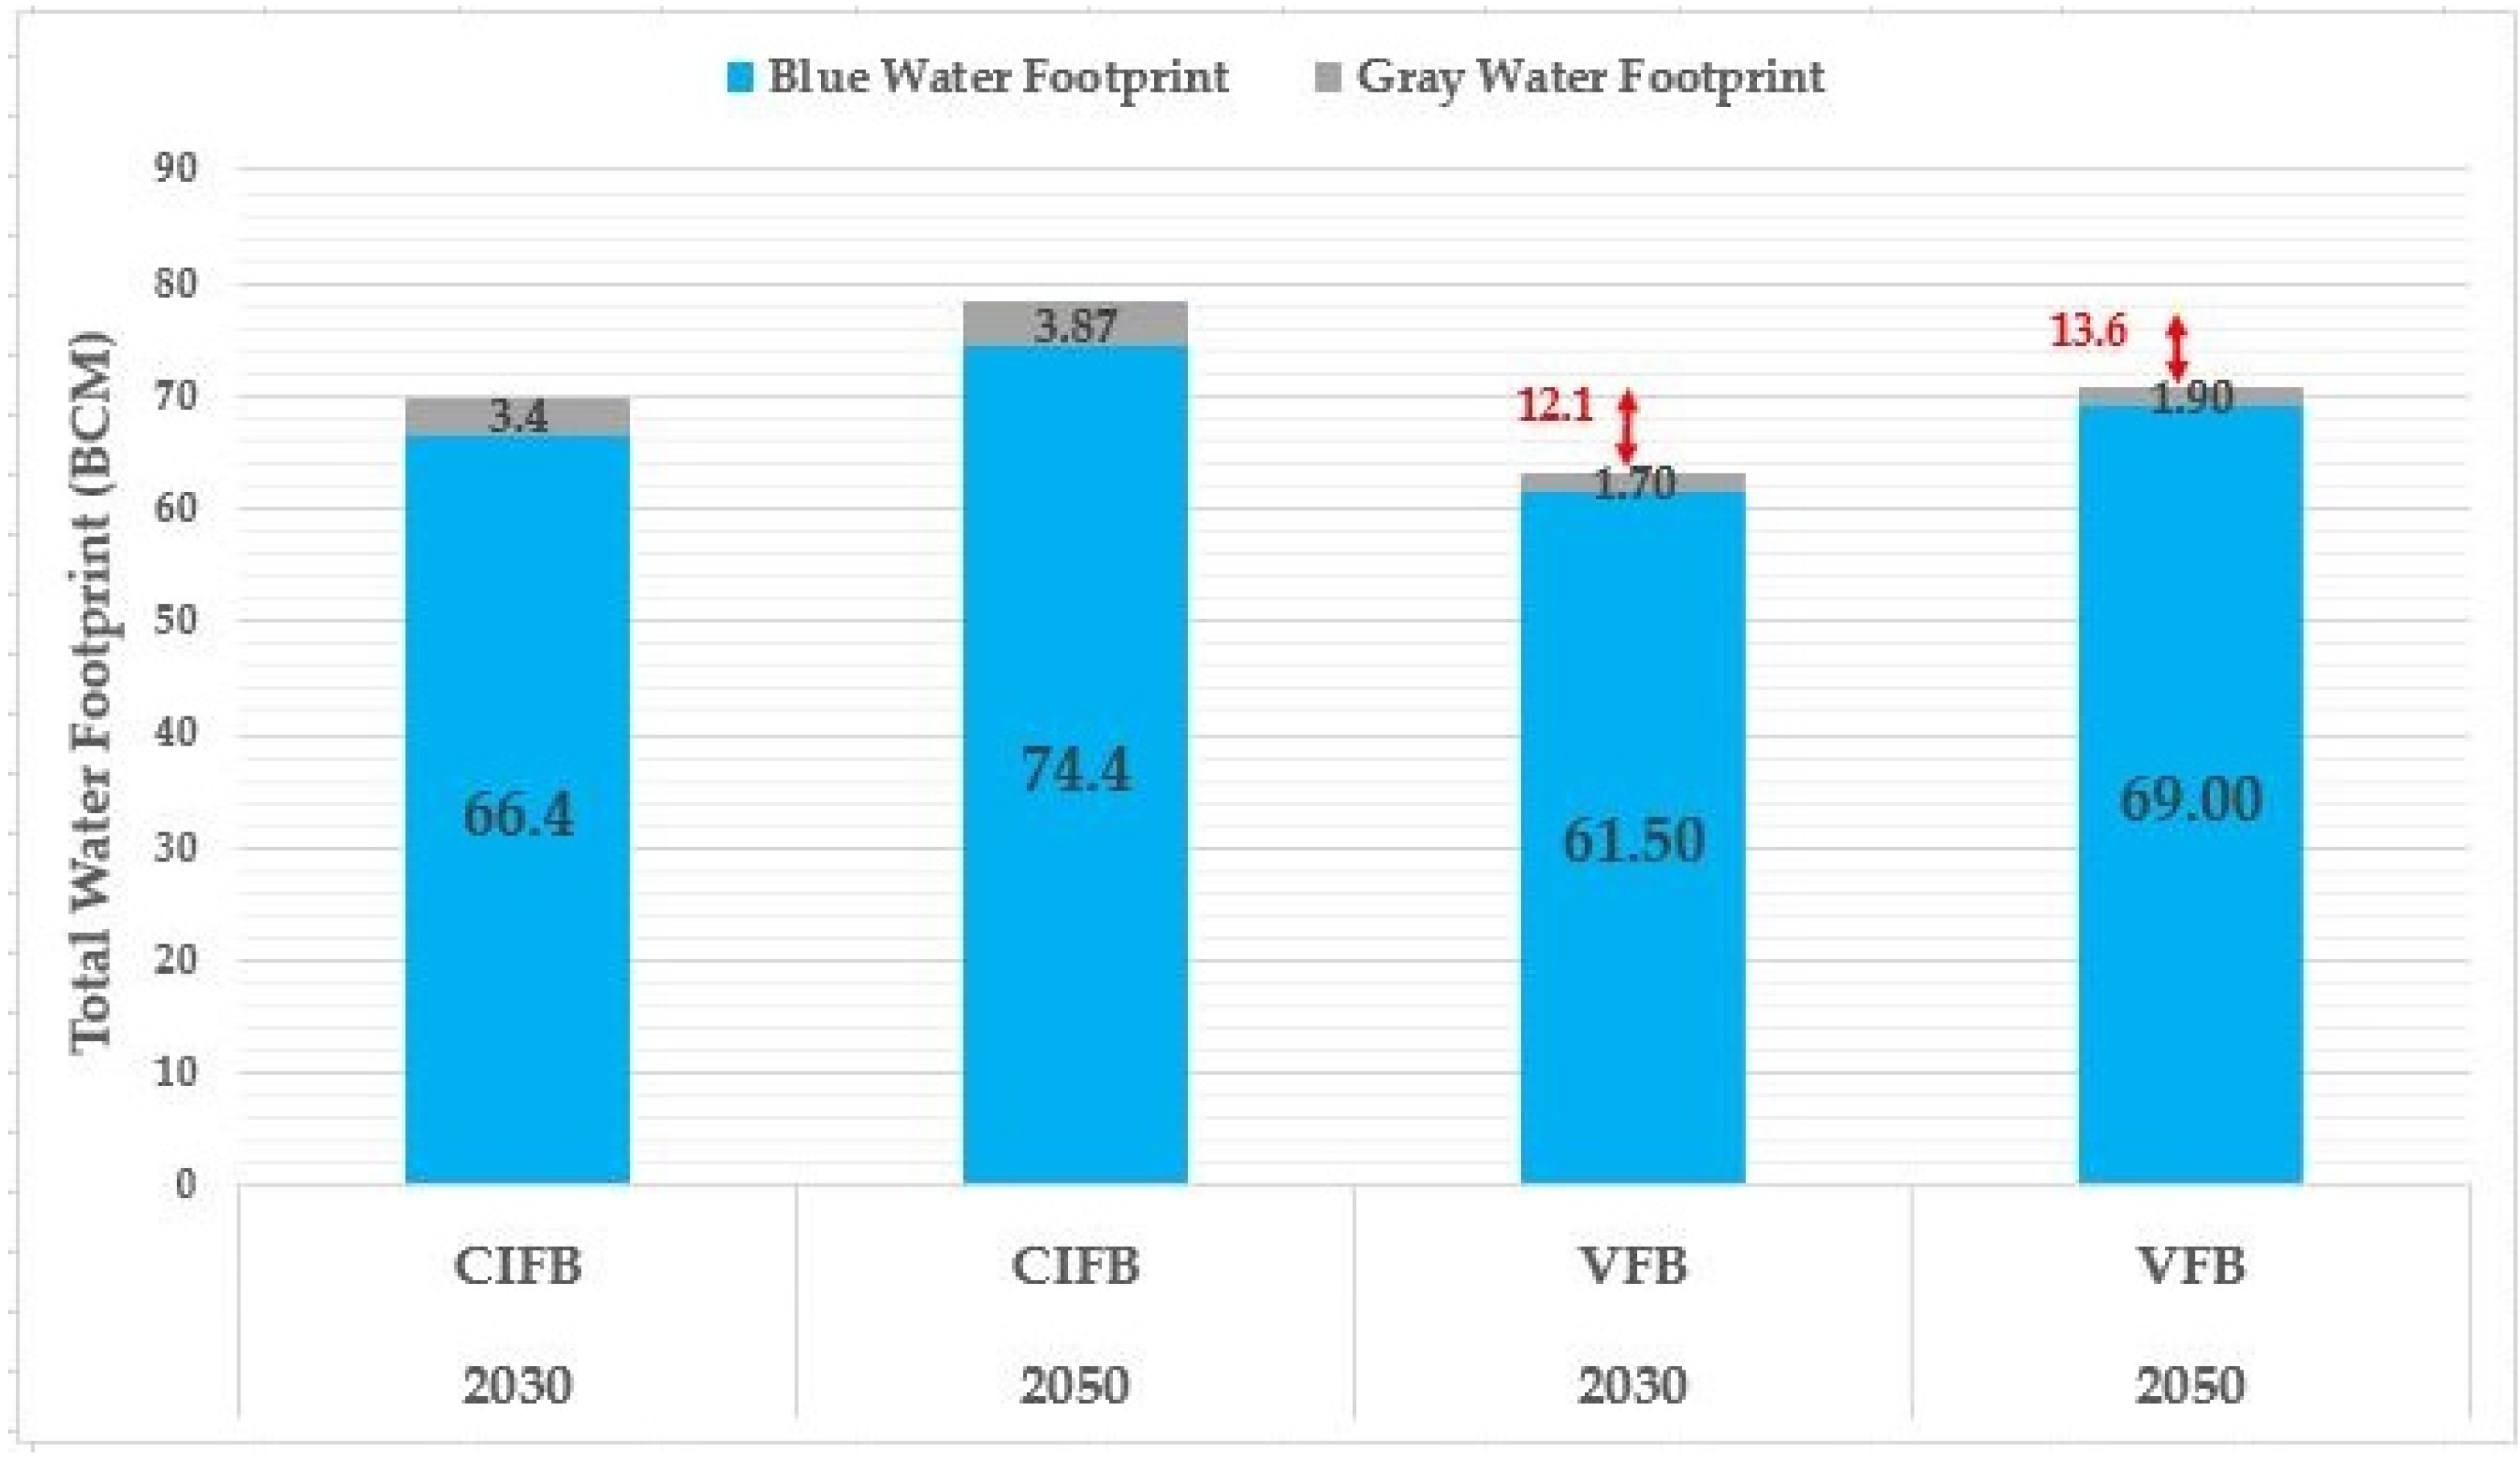
According to Figure 5, the selection of the VFB for the time horizons can significantly diminish the agricultural sector’s pressure on water resources and the environment of Iran. Replacing the VFB with the CIFB will reduce the farm water footprint for 2030 and 2050 by 63.3 and 70.9 BCM, respectively, compared to the common Iranian basket. Therefore, choosing the VFB can reduce the severity of Iran’s water scarcity in the coming years. According to the Ministry of Energy report, programmable water resources for agriculture are 62 BCM·year−1 [63]. A study conducted by Soltani et al. (2019) predicted that the amount of programmable agricultural water for 2030 and 2050 would equal 70 and 66 BCM, respectively [63].
According to Table 3, selecting the CIFB in 2021 and considering the time horizons will cause water stress in Iran. However, the food basket of the Swiss Society for Nutrition alone in 2050 cannot provide food and nutrition security in Iran. As specified in the previous sections, all water needs for crop production are assumed to be met through surface and groundwater resources. If rainfed (green water) production is considered, the amount of this water stress and the shortage will be reduced. However, by 2030, only the selection of the VFB can guarantee the sufficiency of agricultural water resources. By selecting the VFB and enhancing the share of rainfed production and import of farm products with a high water footprint, the expansion of conserved water resources can be increased, and the water balance of food production (presented in Table 3) can be positive. According to previous research [64,65,66,67,68], it is worth noting that different parts of Iran will face a decrease in precipitation and an increase in temperature during the future time horizons. Thus, shifting to the VFB can also be a practical step towards adapting to climate change.
3.5.2. Evaluating the Trend in, and Effects of, the Desired Food Basket (VFB) and CIFB on Water Resources from the Perspective of the Carbon Footprint in 2030 and 2050
Increasing the carbon footprint of a food basket means producing more carbon and accelerating climate change. Therefore, determining the agricultural sector’s carbon footprint can indicate this sector’s contribution to producing greenhouse gas emissions and climatic consequences. Continuing the present food consumption trend, which means selecting the CIFB, the share of Iran’s agricultural activities in CO2 production will reach 51 and 57.2 million tons of CO2 by 2030 and 2050, respectively. By selecting the VFB, the food basket’s carbon footprint will decrease by 10.7 million tons of CO2 in 2030, compared with the CIFB. Meanwhile, this abatement will reach 12 million tons of CO2 by 2050 (Figure 6). Since 1992, the International Climate Change Summit has been established in Rio de Janeiro, Brazil, where member countries have discussed climate change and its control and management mechanisms. At the 21st Summit in Paris, France, in 2015 (COP21), Iran followed the agreement and supported international efforts to reduce greenhouse gas emissions and implement adaptation measures [22].
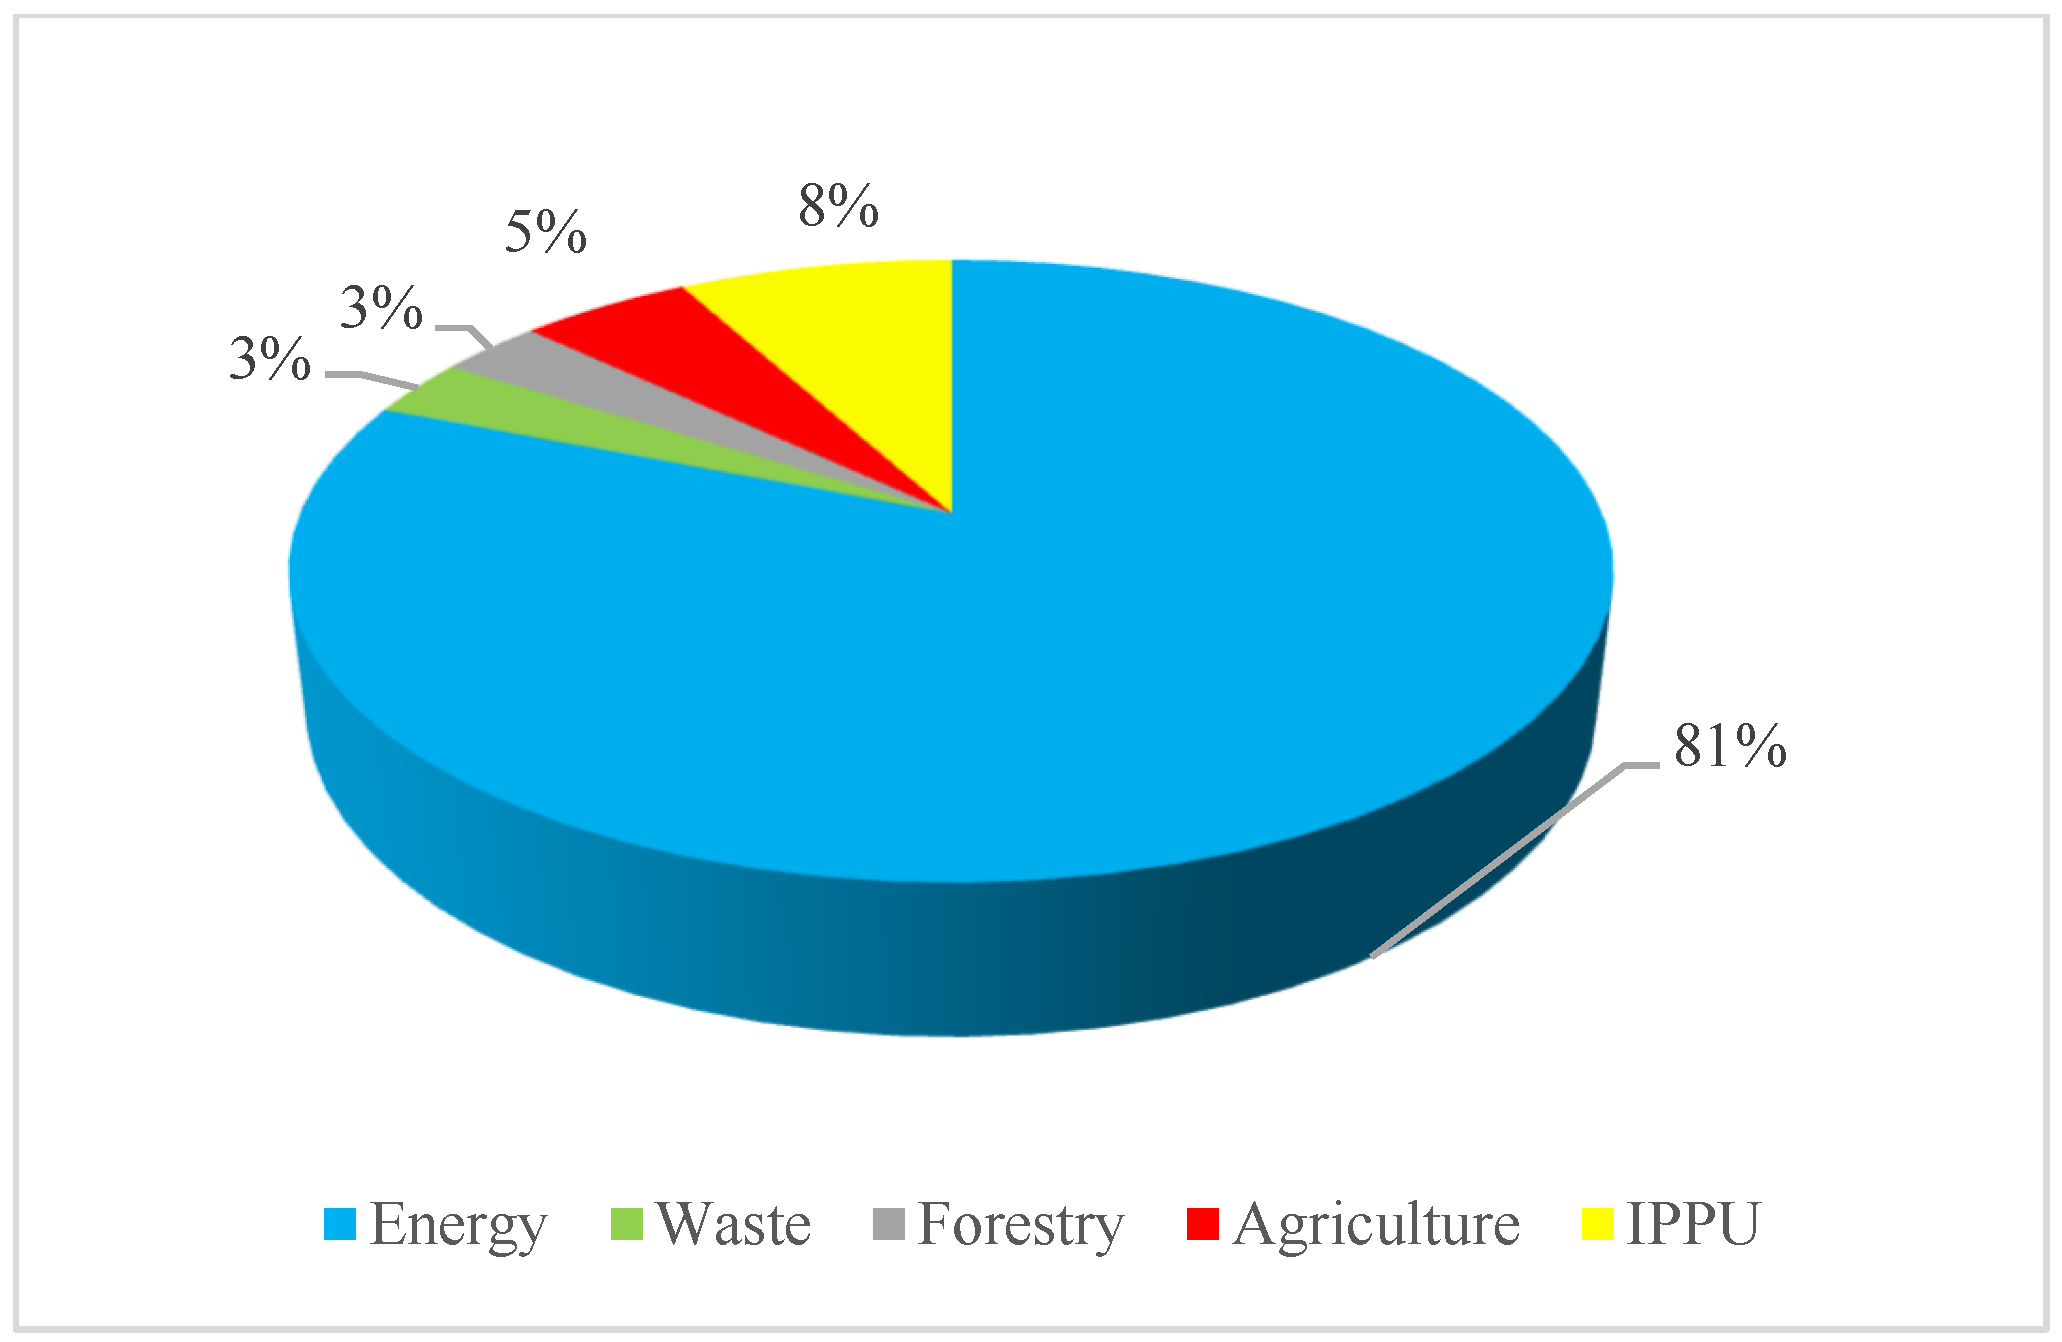
Under the agreement, Iran has announced that it will voluntarily reduce 4% of its conventional greenhouse gas emissions by 2030. According to Iran’s third report under the United Nations Framework Convention on Climate Change (UNFCCC), Iran’s total CO2 equivalent emitted from all pollution sources was approximately 832,043 Gg in 2010 [69]. As shown in Figure 7, the share of CO2 equivalent production in the agricultural sector is five percent of total CO2 production, equivalent to 44.9 million tons of CO2 [69]. Therefore, if Iran wants to implement an equivalent four-percent voluntary reduction in CO2 in the agricultural sector with regards to the COP21 agreement, it must decrease its equivalent agricultural CO2 production to 43.1 million tons by 2030. Based on the results obtained from this study, the trend for the carbon footprint and, consequently, CO2 production in the agricultural sector is upward. By changing the CIFB to the VFB, CO2 production in the agricultural sector could be on a declining path and reach 40.3 and 45.2 million tons in 2030 and 2050, respectively (Figure 6). Therefore, the VFB could facilitate Iran’s movement to reach an agreement to reduce carbon emissions.
According to the results of the food baskets’ water-footprint evaluation and the TOPSIS method, the VFB generally helps Iran achieve sustainable food and nutrition security more than other studied food baskets. Therefore, introducing solutions to reduce the VFB’s carbon footprint is more important than for other food baskets. A detailed survey of the factors affecting the carbon footprint (Equations (S4)–(S11) in Supplementary Materials) found that the most influential parameters in a product’s final carbon footprint are the amount of applied nitrogen fertilizer and the final productivity of the product. In the equation used to calculate the final carbon footprint (Equation (6)), the global warming potential number for nitrogen was 298, about 12 and 298 times more than the equivalent number for methane and carbon dioxide. Hence, reducing nitrogen emissions can significantly detract from the final carbon footprint from other greenhouse gases. One of the most effective methods to reduce nitrogen emissions and, ultimately, the carbon footprint of agricultural products, is by using diversified cropping systems [70]. In this study, other methods, such as using pulse products (N2 stabilizer in soil) in crop rotation or enhancing soil carbon sequestration, were also mentioned.
Gan et al. (2014) showed that pulse plants (such as lentils) in wheat rotation could reduce CO2 emissions by up to 28% [71]. Also, in research conducted by Wang et al. (2020), it was found that by subtracting the nitrogen fertilizer application, there is a potential to reduce 62% of the carbon footprint in each unit of area or production by 19.5% [72]. Therefore, meeting the plant’s nutrient needs through other fertilizers can significantly reduce the final product’s carbon footprint. From the perspective of increasing the yield of agricultural products and thus reducing the final carbon footprint, various approaches are emphasized, such as tillage methods of agricultural lands (such as [73]), the effect of superabsorbent (such as [74]), and the selection of high-yield plant varieties [75]. Therefore, by adopting the methods mentioned for decreasing the carbon footprint and using the benefits of the VFB in terms of water-resource saving, the carbon footprint of this food basket can be reduced, and the desirability of the VFB can be increased more than ever. Given the importance of sustainable food and nutrition security provision, reducing more than 10 million tons of CO2 emissions in the agricultural sector by 2030 is possible by changing the CIFB to the VFB. It is worth noting that the agreed 4% reduction in the total reduction in CO2 emissions in the five sectors of polluting sources (Figure 7), in addition to the stated methods for reducing the carbon footprint of the agricultural sector and shift towards green and smart agriculture, means that the possibility of compensating for increased CO2 production in the farming sector exists in other pollutant sources, such as industry.
4. Discussion
Quality of life is an important indicator of development, and it depends on various factors such as nutrition, food, and food and nutrition security. Establishing food and nutrition security can reduce the quality of life if it poses a risk to environmental elements. This study uses blue- and gray-water footprints and carbon footprint indicators to examine the impacts of five different food baskets on Iran’s water resources. The results of this study can be recommended for areas with conditions similar to Iran’s in terms of climate and agricultural production systems. As a result, the optimal food basket for Iranian society can be considered desirable for MENA countries to establish sustainable food and nutrition security. The food baskets’ water-footprint assessment results showed that the SSNFB, with a 50.8 BCM blue and 2.4 BCM gray water footprint, results in 17% less pressure on Iran’s water resources and the environment than the CIFB. On average, the carbon footprint indicator-studied food baskets could decrease the CIFB’s carbon footprint by 19%, while this reduction is 42% for the SSNFB. Because the VFB has the lowest gray water footprint among the studied food baskets (1.6 BCM), there is a conflict between the desirability of food baskets and the choice of food. To solve this challenge, the TOPSIS multi-criteria decision-making method is used, and finally, the VFB with Cl = 0.702 was identified as the best alternative to the CIFB.
This study examines the potential of replacing several diverse and internationally acceptable food baskets with the CIFB ones. Most studies aiming to provide a desirable food basket for Iran have used a limited number [16,18,76]. According to the results of this research, the VFB food basket was introduced as a desirable food basket in which the consumption of dairy and other animal-derived foods is zero. However, for example, in a recent study [17], it was mentioned that a food basket resulting from an optimization model with various constraints, such as environmental and nutritional factors, could be proposed as a substitute for the current food basket, where dairy is an essential component. Additionally, in another study [18], dairy was identified as a critical food for achieving a desirable food basket in Iran. Various studies show animal-derived products like milk as environmentally undesirable food products [77]. The results of the current study suggest a VFB (without animal-derived foods), which is more realistic. The current research indicates that dairy is one of the food groups significantly impacting the environment (Figure 2, Figure 3 and Figure 4). For instance, in the SSNFB, dairy consumption accounts for 22.2% of the food basket (Table 1). This amount has led to a blue and gray water footprint of 9 BCM and 0.5 BCM, respectively (Figure 2 and Figure 3) (higher than all the food baskets examined). These values are zero for the VFB. Additionally, dairy consumption in this food basket (SSNFB) produces 6 million tons of CO2·year−1, with the VFB excluded from this amount (Figure 4).
The findings of this study align with the necessity of changing the CIFB, as seen in recent studies like [16,18], to protect the environment. Therefore, transitioning to the VFB in countries similar to Iran in terms of climate, production system, and culture (primarily the countries in MENA) is recommended for environmental conservation.
Various studies have reviewed different methods of reducing water and carbon footprints. These measures can be categorized into technical and non-technical approaches.
Regarding non-technical approaches, in countries located in dry and semi-dry regions (such as Iran), water–land management and the prioritization of agricultural production [78,79] and the development of rainfed agriculture [80] have been discussed for reducing the water footprint, as well as organic farming [81] and applying plant protection [81] for reducing the carbon footprint. In the technical approach, to reduce the water footprint, improving irrigation systems [82], using various mulches [82], and reducing carbon footprint, techniques to increase energy consumption efficiency [83] and the implementation of smart farming [84] have been mentioned. Therefore, there are opportunities to enhance the appeal of the VFB as a preferred choice by reducing the environmental impacts of agricultural products.
5. Conclusions
The water resources situation in dry and semi-dry regions, especially in the Middle East, will create numerous challenges in the near future, threatening the well-being of millions. A practical plan for better resource management can help prevent humanitarian crises [85]. Another important aspect of this research is forecasting and analyzing Iran’s food and nutrition security sustainability in 2030 and 2050. At this stage, the water and carbon footprints of the VFB (as the most desirable food basket) are compared with the CIFB. Results show that selecting the VFB and replacing this basket with the CIFB could diminish the agricultural sector’s water footprint by 6.5 and 7.3 BCM by 2030 and 2050, respectively, compared to the situation if the common basket of Iranians had been selected. Examining the participation of Iran’s agricultural sector in the COP21 program, the carbon footprint indicator showed that if the VFB is chosen in 2030, the farming sector’s carbon footprint will reach 40.3 million tons of CO2 equivalent. Therefore, Iran can reach its voluntary amount (fewer than 43.1 million tons of CO2) with this amount. However, if the common food basket is adopted, this number will reach 51 million tons of CO2 equivalent.
Finally, it was proposed that through management strategies, the carbon footprint of the VFB in the agricultural sector can be reduced, and this saving could offset excess emissions in other sectors, such as industry. On the one hand, given the importance of establishing sustainable food and nutrition security in countries facing water stress, and on the other hand, the achievement of facilitator goals in environmental protection, such as Iran’s voluntary participation in the COP21 international agreement, the necessary infrastructure to start changing the eating habits of the people (common food basket) to the desired food basket (VFB) should be created by coordination among national and international organizations and institutions. Therefore, export and import policies should consider environmental aspects such as the water footprint of goods. Using new techniques and methods, water consumption and the carbon production of agricultural products in the production chain stage should be reduced to decrease the environmental impacts of the VFB more than over.
Supplementary Materials
The following supporting information can be downloaded at: https://www.mdpi.com/article/10.3390/w16091196/s1, Net Irrigation water requirement, Farm products Carbon Footprint, Animal products Carbon Footprint, TOPSIS method calculation and Table S1: Constant parameters in carbon footprint calculations. Refs. [54,86,87,88,89,90,91,92,93,94,95] are cited in Supplementary Materials.
Author Contributions
Conceptualization, A.M.; methodology, S.J., A.M., H.Y. and T.O.R.; investigation, H.P. and H.Y.; writing—original draft preparation, H.P., S.J. and A.M.; review and editing, T.O.R. All authors have read and agreed to the published version of the manuscript.
Funding
This research was funded by the Iran Water Resources Management Company, grant number 99/S/019.
Data Availability Statement
The data presented in this study are available on request from the corresponding author.
Conflicts of Interest
The authors declare no conflict of interest.
References
- Vermeulen, S.J.; Campbell, B.M.; Ingram, J.S.I. Climate Change and Food Systems. Annu. Rev. Environ. Resour. 2012, 37, 195–222. [Google Scholar] [CrossRef]
- Gheewala, S.H.; Silalertruksa, T.; Nilsalab, P.; Mungkung, R.; Perret, S.R.; Chaiyawannakarn, N. Water Footprint and Impact of Water Consumption for Food, Feed, Fuel Crops Production in Thailand. Water 2014, 6, 1698–1718. [Google Scholar] [CrossRef]
- Foley, J.A.; Ramankutty, N.; Brauman, K.A.; Cassidy, E.S.; Gerber, J.S.; Johnston, M.; Mueller, N.D.; O’Connell, C.; Ray, D.K.; West, P.C.; et al. Solutions for a Cultivated Planet. Nature 2011, 478, 337–342. [Google Scholar] [CrossRef] [PubMed]
- Flachsbarth, I.; Willaarts, B.; Xie, H.; Pitois, G.; Mueller, N.D.; Ringler, C.; Garrido, A. The Role of Latin America’s Land and Water Resources for Global Food Security: Environmental Trade-Offs of Future Food Production Pathways. PLoS ONE 2015, 10, e0116733. [Google Scholar] [CrossRef] [PubMed]
- ElFetyany, M.; Farag, H.; Abd El Ghany, S.H. Assessment of National Water Footprint versus Water Availability—Case Study for Egypt. Alex. Eng. J. 2021, 60, 3577–3585. [Google Scholar] [CrossRef]
- Galli, A.; Wiedmann, T.; Ercin, E.; Knoblauch, D.; Ewing, B.; Giljum, S. Integrating Ecological, Carbon and Water Footprint into a “Footprint Family” of Indicators: Definition and Role in Tracking Human Pressure on the Planet. Ecol. Indic. 2012, 16, 100–112. [Google Scholar] [CrossRef]
- Zhai, Y.; Tan, X.; Ma, X.; An, M.; Zhao, Q.; Shen, X.; Hong, J. Water Footprint Analysis of Wheat Production. Ecol. Indic. 2019, 102, 95–102. [Google Scholar] [CrossRef]
- Hoekstra, A.Y. A Critique on the Water-Scarcity Weighted Water Footprint in LCA. Ecol. Indic. 2016, 66, 564–573. [Google Scholar] [CrossRef]
- Lombardi, M.; Laiola, E.; Tricase, C.; Rana, R. Assessing the Urban Carbon Footprint: An Overview. Environ. Impact Assess. Rev. 2017, 66, 43–52. [Google Scholar] [CrossRef]
- Aleksandrowicz, L.; Green, R.; Joy, E.J.M.; Harris, F.; Hillier, J.; Vetter, S.H.; Smith, P.; Kulkarni, B.; Dangour, A.D.; Haines, A. Environmental Impacts of Dietary Shifts in India: A Modelling Study Using Nationally-Representative Data. Environ. Int. 2019, 126, 207–215. [Google Scholar] [CrossRef]
- Bahn, R.; EL Labban, S.; Hwalla, N. Impacts of Shifting to Healthier Food Consumption Patterns on Environmental Sustainability in MENA Countries. Sustain. Sci. 2019, 14, 1131–1146. [Google Scholar] [CrossRef]
- Friel, S.; Barosh, L.J.; Lawrence, M. Towards Healthy and Sustainable Food Consumption: An Australian Case Study. Public Health Nutr. 2014, 17, 1156–1166. [Google Scholar] [CrossRef] [PubMed]
- Van Dooren, C.; Marinussen, M.; Blonk, H.; Aiking, H.; Vellinga, P. Exploring Dietary Guidelines Based on Ecological and Nutritional Values: A Comparison of Six Dietary Patterns. Food Policy 2014, 44, 36–46. [Google Scholar] [CrossRef]
- Naja, F.; Jomaa, L.; Itani, L.; Zidek, J.; El Labban, S.; Sibai, A.M.; Hwalla, N. Environmental Footprints of Food Consumption and Dietary Patterns among Lebanese Adults: A Cross-Sectional Study. Nutr. J. 2018, 17, 85. [Google Scholar] [CrossRef] [PubMed]
- Bashiri, B.; Zehtabvar, M.; Gavrilova, O.; Vilu, R. Change in the Carbon Footprint of Iranians’ Food Consumption from 1961 to 2019: A Decomposition Analysis of Drivers. Agron. Res. 2023, 21, 428–438. [Google Scholar] [CrossRef]
- Sobhani, S.R.; Arzhang, P.; Soltani, E.; Soltani, A. Proposed Diets for Sustainable Agriculture and Food Security in Iran. Sustain. Prod. Consum. 2022, 32, 755–764. [Google Scholar] [CrossRef]
- Eini-Zinab, H.; Sobhani, S.R.; Rezazadeh, A. Designing a Healthy, Low-Cost and Environmentally Sustainable Food Basket: An Optimisation Study. Public Health Nutr. 2021, 24, 1952–1961. [Google Scholar] [CrossRef] [PubMed]
- Sobhani, S.R.; Omidvar, N.; Abdollahi, Z.; Al Jawaldeh, A. Shifting to a Sustainable Dietary Pattern in Iranian Population: Current Evidence and Future Directions. Front. Nutr. 2021, 8, 789692. [Google Scholar] [CrossRef] [PubMed]
- Hosseini, S.S.; Pakravan Charvadeh, M.R.; Salami, H.; Flora, C. The Impact of the Targeted Subsidies Policy on Household Food Security in Urban Areas in Iran. Cities 2017, 63, 110–117. [Google Scholar] [CrossRef]
- Pakravan-Charvadeh, M.R.; Khan, H.A.; Flora, C. Spatial Analysis of Food Security in Iran: Associated Factors and Governmental Support Policies. J. Public Health Policy 2020, 41, 351–374. [Google Scholar] [CrossRef]
- Emami, M.; Almassi, M.; Bakhoda, H.; Kalantari, I. Agricultural Mechanization, a Key to Food Security in Developing Countries: Strategy Formulating for Iran. Agric. Food Secur. 2018, 7, 24. [Google Scholar] [CrossRef]
- Zandi, F.; Amanollahi, J.; Poorhashemi, S.A.; Panahi, M. Paris Climate Changes Agreement 2015 Operational Requirements and Legal Restrictions of Joining Iran. Ekoloji 2019, 28, 275–282. [Google Scholar]
- Iran’s Ministry of Agriculture Jihad: Tehran, Iran. IMAJ. Available online: https://www.maj.ir (accessed on 15 March 2021).
- Chen, C.; Chaudhary, A.; Mathys, A. Dietary Change Scenarios and Implications for Environmental, Nutrition, Human Health and Economic Dimensions of Food Sustainability. Nutrients 2019, 11, 856. [Google Scholar] [CrossRef] [PubMed]
- Salehi, F.; Abdollahi, Z.; Abdollahi, M. Good Food Basket for the Iranian Community. Minist. Health Med. Educ. 2013, 1, 6–10. [Google Scholar]
- Sáez-Almendros, S.; Obrador, B.; Bach-Faig, A.; Serra-Majem, L. Environmental Footprints of Mediterranean versus Western Dietary Patterns: Beyond the Health Benefits of the Mediterranean Diet. Environ. Health A Glob. Access Sci. Source 2013, 12, 118. [Google Scholar] [CrossRef]
- Islamic Republic of Iran Customs Administration. IRICA. Available online: https://irica.ir/ (accessed on 8 January 2021).
- Statistical Centre of Iran. AMAR. Available online: https://old.sci.org.ir/english (accessed on 7 March 2021).
- Komijani, M.; Shamabadi, N.S.; Shahin, K.; Eghbalpour, F.; Tahsili, M.R.; Bahram, M. Heavy Metal Pollution Promotes Antibiotic Resistance Potential in the Aquatic Environment. Environ. Pollut. 2021, 274, 116569. [Google Scholar] [CrossRef]
- Mekonnen, M.M.; Hoekstra, A.Y. A Global Assessment of the Water Footprint of Farm Animal Products. Ecosystems 2012, 15, 401–415. [Google Scholar] [CrossRef]
- Damkjaer, S.; Taylor, R. The Measurement of Water Scarcity: Defining a Meaningful Indicator. Ambio 2017, 46, 513–531. [Google Scholar] [CrossRef]
- Hoekstra, A.Y.; Chapagain, A.K.; Zhang, G. Water Footprints and Sustainable water Allocation. Sustainability 2016, 8, 20. [Google Scholar] [CrossRef]
- Karandish, F.; Hoekstra, A.Y. Informing National Food and Water Security Policy through Water Footprint Assessment: The Case of Iran. Water 2017, 9, 831. [Google Scholar] [CrossRef]
- Wu, M.; Cui, S.; Qiu, L.; Zhang, P.; Cao, X. Assessment of Blue Water Migration and Efficiency in Water-Saving Irrigation Paddy Rice Fields Using the Water Flow Tracking Method. Agronomy 2024, 14, 166. [Google Scholar] [CrossRef]
- Bazrafshan, O.; Vafaei, K.; Ramezani Etedali, H.; Zamani, H.; Hashemi, M. Economic Analysis of Water Footprint for Water Management of Rain-Fed and Irrigated Almonds in Iran. Irrig. Sci. 2024, 42, 115–133. [Google Scholar] [CrossRef]
- Giordano, V.; Tuninetti, M.; Laio, F. Efficient Agricultural Practices in Africa Reduce Crop Water Footprint despite Climate Change, but Rely on Blue Water Resources. Commun. Earth Environ. 2023, 4, 475. [Google Scholar] [CrossRef]
- Karandish, F.; Šimůnek, J. A Comparison of the HYDRUS (2D/3D) and SALTMED Models to Investigate the Influence of Various Water-Saving Irrigation Strategies on the Maize Water Footprint. Agric. Water Manag. 2019, 213, 809–820. [Google Scholar] [CrossRef]
- Araya, A.; Stroosnijder, L.; Girmay, G.; Keesstra, S.D. Crop Coefficient, Yield Response to Water Stress and Water Productivity of Teff (Eragrostis Tef (Zucc.). Agric. Water Manag. 2011, 98, 775–783. [Google Scholar] [CrossRef]
- Abbasi, F.; Sohrab, F.; Abbasi, N. Evaluation of Irrigation Efficiencies in Iran. Irrig. Drain. Struct. Eng. Res. 2017, 17, 113–120. [Google Scholar]
- Gao, X.; Qiu, L.; Huang, X.; Wu, M.; Cao, X. Monitoring Grey Water Footprint and Associated Environmental Controls in Agricultural Watershed. Environ. Sci. Pollut. Res. 2024, 31, 11334–11348. [Google Scholar] [CrossRef] [PubMed]
- Zhao, D.; Liu, W.; Gao, R.; Zhang, P.; Li, M.; Wu, P.; Zhuo, L. Spatiotemporal Evolution of Crop Grey Water Footprint and Associated Water Pollution Levels in Arid Regions of Western China. Agric. Water Manag. 2023, 280, 108224. [Google Scholar] [CrossRef]
- Chapagain, A.K.; Hoekstra, A.Y.; Savenije, H.H.G. Water Saving through International Trade of Agricultural Products. Hydrol. Earth Syst. Sci. 2006, 10, 455–468. [Google Scholar] [CrossRef]
- Aldaya, M.M.; Chapagain, A.K.; Hoekstra, A.Y.; Mekonnen, M.M. The Water Footprint Assessment Manual; Routledge: London, UK, 2012. [Google Scholar] [CrossRef]
- Department of Environment (DOE). Assortment of Laws and Regulations for Environmental Protection in Iran; Department of Environment (DOE): Tehran, Iran, 2000.
- Ababaei, B.; Ramezani Etedali, H. Water Footprint Assessment of Main Cereals in Iran. Agric. Water Manag. 2017, 179, 401–411. [Google Scholar] [CrossRef]
- Franke, N.A.; Boyacioglu, H.; Hoekstra, A.Y. Grey Water Footprint Accounting: Tier 1 Supporting Guidelines; UNESCO-IHE Delft: Delft, The Netherlands, 2013; Volume 1. [Google Scholar]
- Yuan, Q.; Song, G.; Fullana-i-Palmer, P.; Wang, Y.; Semakula, H.M.; Mekonnen, M.M.; Zhang, S. Water Footprint of Feed Required by Farmed Fish in China Based on a Monte Carlo-Supported von Bertalanffy Growth Model: A Policy Implication. J. Clean. Prod. 2017, 153, 41–50. [Google Scholar] [CrossRef]
- Von Bertalanffy, L. A Quantitative Theory of Organic Growth (Inquiries on Growth Laws. II). Hum. Biol. 1938, 10, 181–213. [Google Scholar]
- Li, J.; Yang, W.; Wang, Y.; Li, Q.; Liu, L.; Zhang, Z. Carbon Footprint and Driving Forces of Saline Agriculture in Coastally Reclaimed Areas of Eastern China: A Survey of Four Staple Crops. Sustainability 2018, 10, 928. [Google Scholar] [CrossRef]
- Win, K.T.; Nonaka, R.; Win, A.T.; Sasada, Y.; Toyota, K.; Motobayashi, T. Effects of Water Saving Irrigation and Rice Variety on Greenhouse Gas Emissions and Water Use Efficiency in a Paddy Field Fertilized with Anaerobically Digested Pig Slurry. Paddy Water Environ. 2015, 13, 51–60. [Google Scholar] [CrossRef]
- Luo, T.; Yue, Q.; Yan, M.; Cheng, K.; Pan, G. Carbon Footprint of China’s Livestock System—A Case Study of Farm Survey in Sichuan Province, China. J. Clean. Prod. 2015, 102, 136–143. [Google Scholar] [CrossRef]
- Iribarren, D.; Vázquez-Rowe, I.; Hospido, A.; Moreira, M.T.; Feijoo, G. Updating the Carbon Footprint of the Galician Fishing Activity (NW Spain). Sci. Total Environ. 2011, 409, 1609–1611. [Google Scholar] [CrossRef] [PubMed]
- Colson, G.; de Bruyn, C. Models and Methods in Multiple Objectives Decision Making. In Mathematical and Computer Modelling; Elsevier: Amsterdam, The Netherlands, 1989; Volume 12, pp. 1201–1211. [Google Scholar] [CrossRef]
- Yoon, K.; Hwang, C.-L. Multiple Attribute Decision Making, 1st ed.; Lecture Notes in Economics and Mathematical Systems; Springer: Berlin/Heidelberg, Germany, 2011; Volume 186. [Google Scholar] [CrossRef]
- Kamalakannan, R.; Ramesh, C.; Shunmugasundaram, M.; Sivakumar, P.; Mohamed, A. Evaluvation and Selection of Suppliers Using TOPSIS. Mater. Today Proc. 2020, 33, 2771–2773. [Google Scholar] [CrossRef]
- Radmehr, A.; Bozorg-Haddad, O.; Loáiciga, H.A. Integrated Strategic Planning and Multi-Criteria Decision-Making Framework with Its Application to Agricultural Water Management. Sci. Rep. 2022, 12, 8406. [Google Scholar] [CrossRef] [PubMed]
- Li, X. TOPSIS Model with Entropy Weight for Eco Geological Environmental Carrying Capacity Assessment. Microprocess. Microsyst. 2021, 82, 103805. [Google Scholar] [CrossRef]
- Park, H.K.; Kim, K.B.; Hyung, J.S.; Kim, T.H.; Koo, J.Y. Decision-Making for the Hazard Ranking of Water Distribution Networks Using the TOPSIS Method. Water Supply 2023, 23, 715–726. [Google Scholar] [CrossRef]
- Dehghan Rahimabadi, P.; Behnia, M.; Nasabpour Molaei, S.; Khosravi, H.; Azarnivand, H. Assessment of Groundwater Resources Potential Using Improved Water Quality Index (ImpWQI) and Entropy-Weighted TOPSIS Model. Sustain. Water Resour. Manag. 2024, 10, 7. [Google Scholar] [CrossRef]
- Sałabun, W.; Wątróbski, J.; Shekhovtsov, A. Are MCDA Methods Benchmarkable? A Comparative Study of TOPSIS, VIKOR, COPRAS, and PROMETHEE II Methods. Symmetry 2020, 12, 1549. [Google Scholar] [CrossRef]
- Niu, D.; Song, Z.; Wang, M.; Xiao, X. Improved TOPSIS Method for Power Distribution Network Investment Decision-Making Based on Benefit Evaluation Indicator System. Int. J. Energy Sect. Manag. 2017, 11, 595–608. [Google Scholar] [CrossRef]
- Fathi, E.; Javid, N.; Mirzaie, S.; Nasiripour, M. Investigating the Trend of Changes in the Structure and Composition of the Country’s Population and Its Future up to the Horizon of 1430; Iran’s Statistics Research Institute: Tehran, Iran, 2019. [Google Scholar]
- Soltani, A.; Zand, E.; Alimagham, S.; Nehbandani, A.; Barani, H.; Soltani, E.; Torabi, B.; Zeinali, E.; Mirkarimi, S.; Joulaie, R. Country Food Security Analysis Using Water, Land, Food and Environmental Nexus, Necessary Prospective and Policies; Iran’s Ministry of Agriculture Jihad, Organization of Research, Education and Promotion of Agriculture: Tehran, Iran, 2019.
- Gohari, A.; Mirchi, A.; Madani, K. Erratum to: System Dynamics Evaluation of Climate Change Adaptation Strategies for Water Resources Management in Central Iran. Water Resour. Manag. 2017, 31, 4367–4368. [Google Scholar] [CrossRef]
- Saymohammadi, S.; Zarafshani, K.; Tavakoli, M.; Mahdizadeh, H.; Amiri, F. Prediction of Climate Change Induced Temperature & Precipitation: The Case of Iran. Sustainability 2017, 9, 146. [Google Scholar] [CrossRef]
- Mansouri Daneshvar, M.R.; Ebrahimi, M.; Nejadsoleymani, H. An Overview of Climate Change in Iran: Facts and Statistics. Environ. Syst. Res. 2019, 8, 7. [Google Scholar] [CrossRef]
- Roshan, G.R.; Oji, R.; Attia, S. Projecting the Impact of Climate Change on Design Recommendations for Residential Buildings in Iran. Build. Environ. 2019, 155, 283–297. [Google Scholar] [CrossRef]
- Kalbali, E.; Ziaee, S.; Najafabadi, M.M.; Zakerinia, M. Approaches to Adapting to Impacts of Climate Change in Northern Iran: The Application of a Hydrogy-Economics Model. J. Clean. Prod. 2021, 280, 124067. [Google Scholar] [CrossRef]
- Department of Environment (DOE). Iran’s Third National Communication to UNFCCC; Department of Environment (DOE): Tehran, Iran, 2017.
- Liu, C.; Cutforth, H.; Chai, Q.; Gan, Y. Farming Tactics to Reduce the Carbon Footprint of Crop Cultivation in Semiarid Areas. A Review. Agron. Sustain. Dev. 2016, 36, 69. [Google Scholar] [CrossRef]
- Gan, Y.; Liang, C.; Chai, Q.; Lemke, R.L.; Campbell, C.A.; Zentner, R.P. Improving Farming Practices Reduces the Carbon Footprint of Spring Wheat Production. Nat. Commun. 2014, 5, 5012. [Google Scholar] [CrossRef]
- Wang, X.; Feng, Y.; Yu, L.; Shu, Y.; Tan, F.; Gou, Y.; Luo, S.; Yang, W.; Li, Z.; Wang, J. Sugarcane/Soybean Intercropping with Reduced Nitrogen Input Improves Crop Productivity and Reduces Carbon Footprint in China. Sci. Total Environ. 2020, 719, 137517. [Google Scholar] [CrossRef]
- Li, J.; Wang, Y.; Guo, Z.; Li, J.; Tian, C.; Hua, D.; Shi, C.; Wang, H.; Han, J.; Xu, Y. Effects of Conservation Tillage on Soil Physicochemical Properties and Crop Yield in an Arid Loess Plateau, China. Sci. Rep. 2020, 10, 4716. [Google Scholar] [CrossRef]
- Zheng, H.; Mei, P.; Wang, W.; Yin, Y.; Li, H.; Zheng, M.; Ou, X.; Cui, Z. Effects of Super Absorbent Polymer on Crop Yield, Water Productivity and Soil Properties: A Global Meta-Analysis. Agric. Water Manag. 2023, 282, 108290. [Google Scholar] [CrossRef]
- Phapumma, A.; Monkham, T.; Chankaew, S.; Kaewpradit, W.; Harakotr, P.; Sanitchon, J. Characterization of Indigenous Upland Rice Varieties for High Yield Potential and Grain Quality Characters under Rainfed Conditions in Thailand. Ann. Agric. Sci. 2020, 65, 179–187. [Google Scholar] [CrossRef]
- Mirzaie-Nodoushan, F.; Morid, S.; Dehghanisanij, H. Reducing Water Footprints through Healthy and Reasonable Changes in Diet and Imported Products. Sustain. Prod. Consum. 2020, 23, 30–41. [Google Scholar] [CrossRef]
- Bronts, S.; Gerbens-Leenes, P.W.; Guzmán-Luna, P. The Water, Land and Carbon Footprint of Conventional and Organic Dairy Systems in the Netherlands and Spain. A Case Study into the Consequences of Ecological Indicator Selection and Methodological Choices. Energy Nexus 2023, 11, 100217. [Google Scholar] [CrossRef]
- Yousefi, H.; Mohammadi, A.; Noorollahi, Y. Prioritization in Exporting Agricultural Products Using Virtual Water Concept (Case Study: Melon and Watermelon). Ecopersia 2017, 5, 147–162. [Google Scholar]
- Yousefi, H.; Mohammadi, A.; Mirzaaghabeik, M.; Noorollahi, Y. Virtual Water Evaluation for Grains Productsin Iran Case Study: Pea and Bean. J. Water Land Dev. 2017, 35, 275–280. [Google Scholar] [CrossRef]
- Reddy, K.S.; Maruthi, V.; Pankaj, P.K.; Kumar, M.; Pushpanjali; Prabhakar, M.; Reddy, A.G.; Reddy, K.S.; Singh, V.K.; Koradia, A.K. Water Footprint Assessment of Rainfed Crops with Critical Irrigation under Different Climate Change Scenarios in SAT Regions. Water 2022, 14, 1206. [Google Scholar] [CrossRef]
- Holka, M.; Kowalska, J.; Jakubowska, M. Reducing Carbon Footprint of Agriculture—Can Organic Farming Help to Mitigate Climate Change? Agriculture 2022, 12, 1383. [Google Scholar] [CrossRef]
- Adetoro, A.A.; Abraham, S.; Paraskevopoulos, A.L.; Owusu-Sekyere, E.; Jordaan, H.; Orimoloye, I.R. Alleviating Water Shortages by Decreasing Water Footprint in Sugarcane Production: The Impacts of Different Soil Mulching and Irrigation Systems in South Africa. Groundw. Sustain. Dev. 2020, 11, 100464. [Google Scholar] [CrossRef]
- Jaiswal, B.; Agrawal, M. Carbon Footprints of Agriculture Sector. Environ. Footpr. Eco-Des. Prod. Process. 2020, 1, 81–99. [Google Scholar] [CrossRef]
- Panchasara, H.; Samrat, N.H.; Islam, N. Greenhouse Gas Emissions Trends and Mitigation Measures in Australian Agriculture Sector—A Review. Agriculture 2021, 11, 85. [Google Scholar] [CrossRef]
- Bozorg-Haddad, O.; Zolghadr-Asli, B.; Sarzaeim, P.; Aboutalebi, M.; Chu, X.; Loáiciga, H.A. Evaluation of Water Shortage Crisis in the Middle East and Possible Remedies. J. Water Supply Res. Technol.—AQUA 2020, 69, 85–98. [Google Scholar] [CrossRef]
- Allen, R.G.; Pereira, L.S.; Raes, D.; Smith, M. Crop Evaporation–Guidelines for Computing Crop Water Requirements–FAO Irrigation and Drainage Paper 56. Food Agric. Organ. United Nations 1998, 300, 300. [Google Scholar]
- Khandelwal, S.S.; Dhiman, S.D. Irrigation Water Requirements of Different Crops in Limbasi Branch Canal Command Area of Gujarat. J. Agrometeorol. 2015, 17, 114–117. [Google Scholar] [CrossRef]
- IPCC. Introduction BT—IPCC Guidelines for National Greenhouse Gas Inventories. IPCC Guidel. Natl. Greenh. Gas Invent. 2006, 1.1–1.21. Available online: https://www.ipcc-nggip.iges.or.jp/meeting/pdfiles/Washington_Report.pdf (accessed on 8 March 2024).
- Yang, S.H. The Research of City Trees Effects of Carbon and Oxygen Balance. City Environ. Ecol. 1996, 9, 37–39. [Google Scholar]
- Weidema, B.P.; Bauer, C.; Hischier, R.; Mutel, C.L.; Nemecek, T.; Reinhard, J.; Vadenbo, C.; Wernet, G. Overview and Methodology: Data Quality Guideline for the Ecoinvent Database Version 3; Swiss Centre for Life Cycle Inventories: St. Gallen, Switzerland, 2013. [Google Scholar]
- Cheng, K.; Pan, G.; Smith, P.; Luo, T.; Li, L.; Zheng, J.; Zhang, X.; Han, X.; Yan, M. Carbon Footprint of China’s Crop Production—An Estimation Using Agro-Statistics Data over 1993–2007. Agric. Ecosyst. Environ. 2011, 142, 231–237. [Google Scholar] [CrossRef]
- West, T.O.; Marland, G. A Synthesis of Carbon Sequestration, Carbon Emissions, and Net Carbon Flux in Agriculture: Comparing Tillage Practices in the United States. Agric. Ecosyst. Environ. 2002, 91, 217–232. [Google Scholar] [CrossRef]
- Xie, H.; Wang, L.; Chen, X. Improvement and Application of Ecological Footprint Evaluation Model; Chemical Industry Press: Beijing, China, 2008. [Google Scholar]
- Di, X.; Nie, Z.; Yuan, B.; Zuo, T. Life Cycle Inventory for Electricity Generation in China. Int. J. Life Cycle Assess. 2007, 12, 217–224. [Google Scholar] [CrossRef]
- Stocker, T.F.; Qin, D.; Plattner, G.-K.; Alexander, L.V.; Allen, S.K.; Bindoff, N.L.; Bréon, F.-M.; Church, J.A.; Cubasch, U.; Emori, S. Technical Summary. In Climate change 2013: The physical science basis. Contribution of Working Group I to the Fifth Assessment Report of the Intergovernmental Panel on Climate Change; Cambridge University Press: Cambridge, UK, 2013; pp. 33–115. [Google Scholar]
Figure 1.
Research process flowchart.
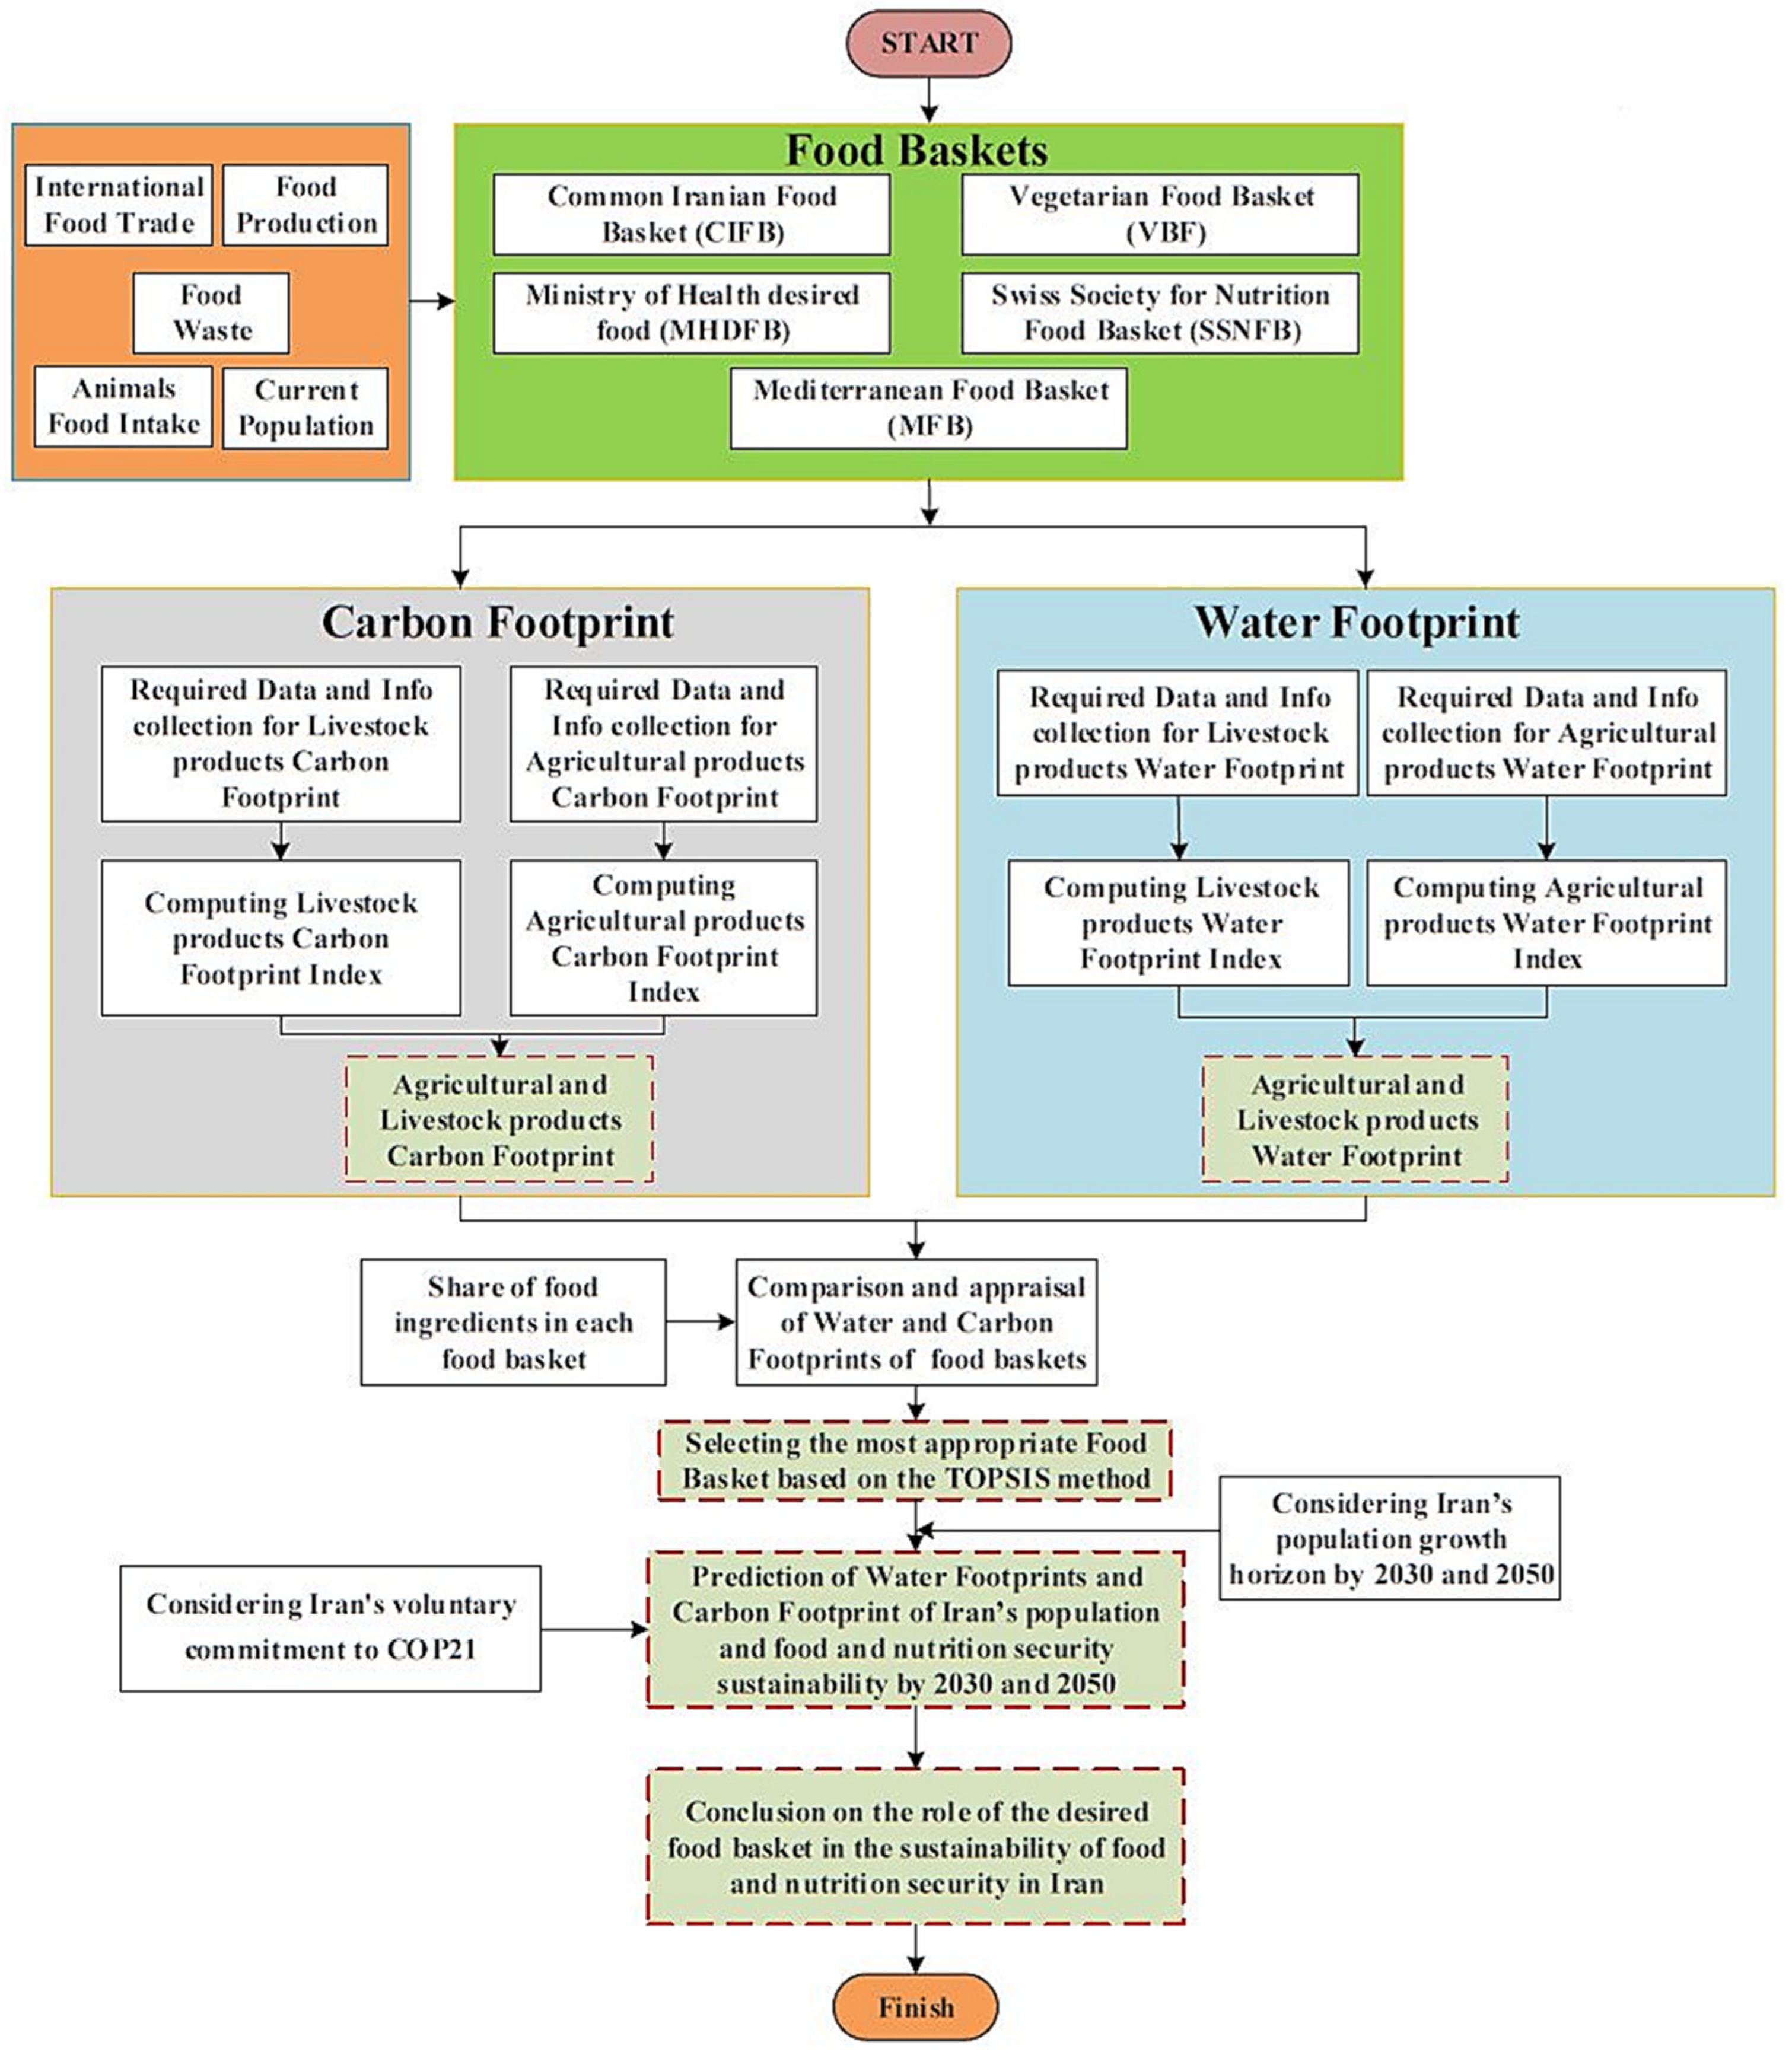
Figure 2.
Comparison of blue water footprints of studied food groups (A) and food baskets (B).
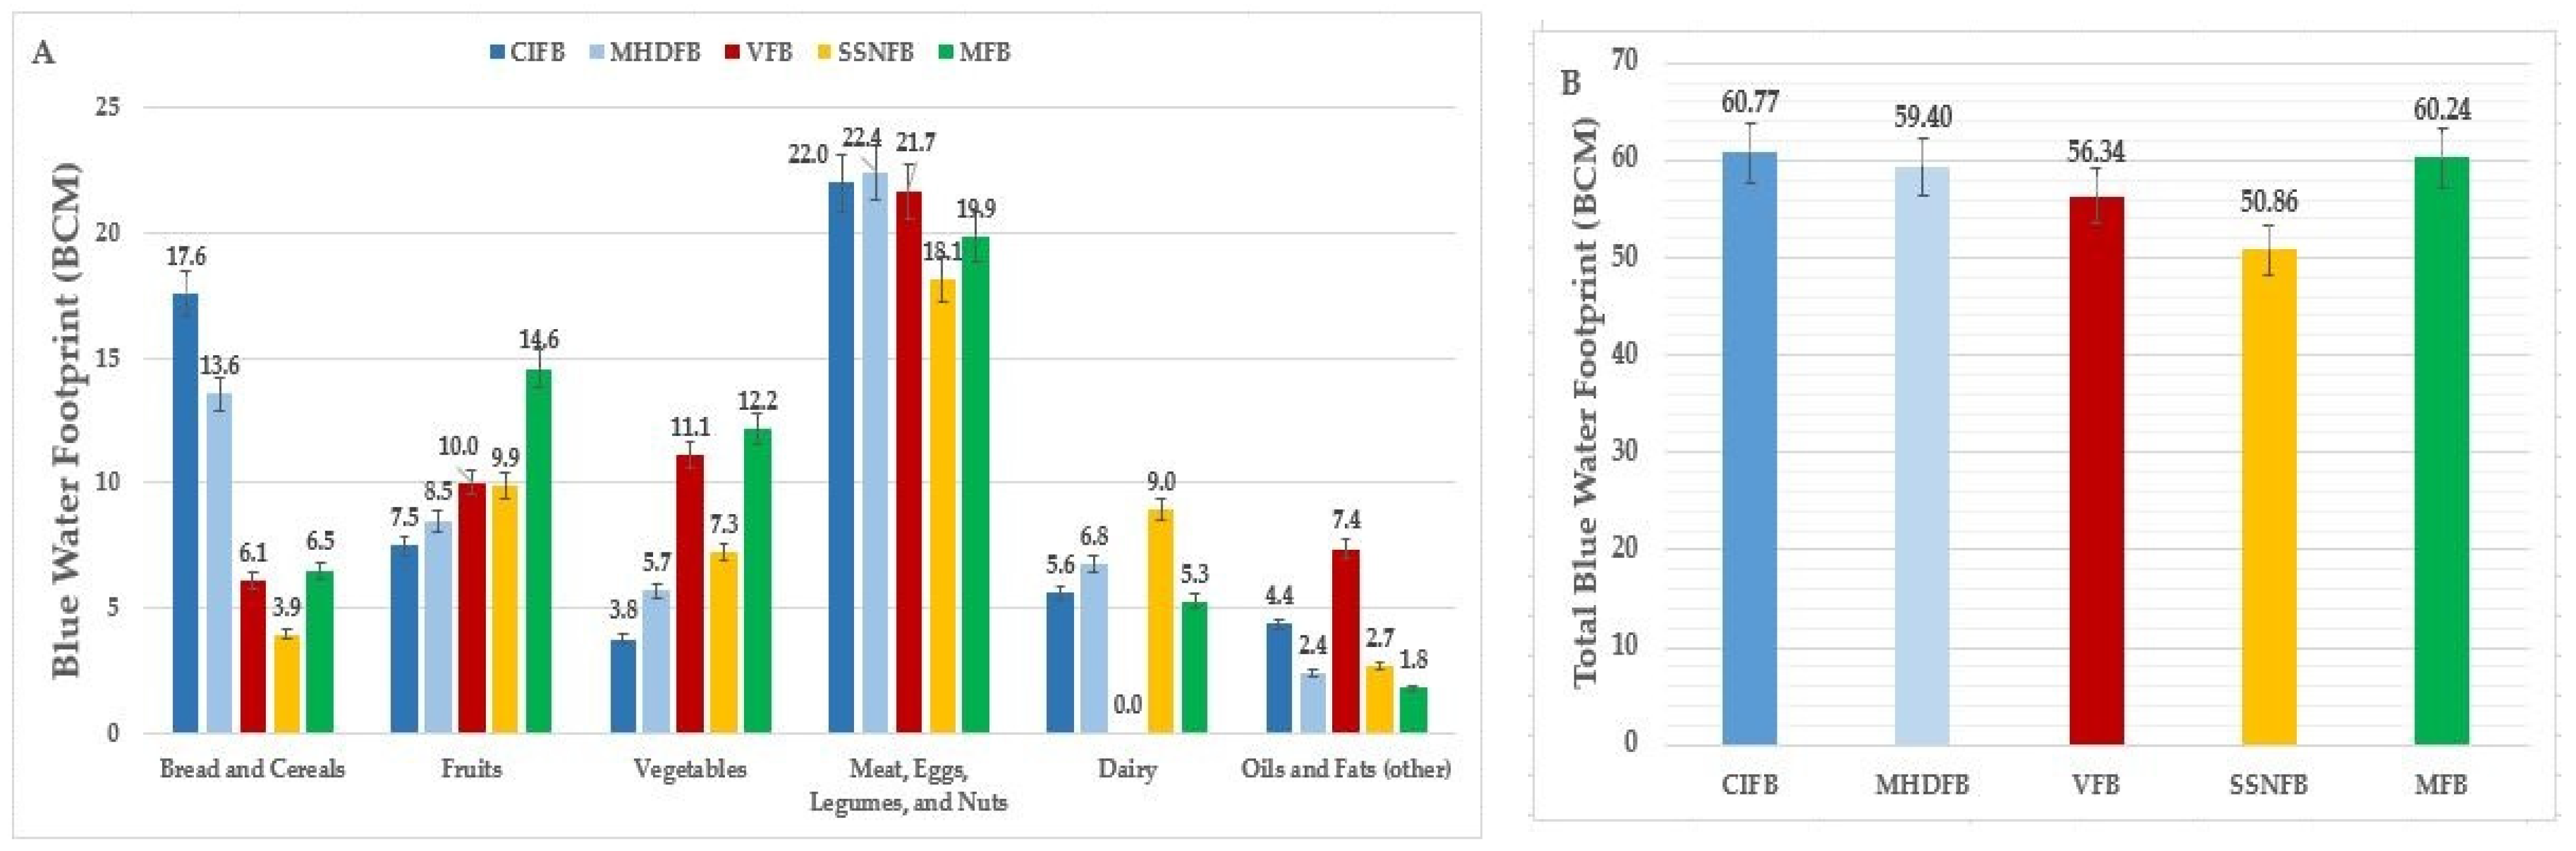
Figure 3.
Comparison of gray water footprints of studied food groups (A) and food baskets (B).

Figure 4.
Comparison of the carbon footprint of studied food baskets.
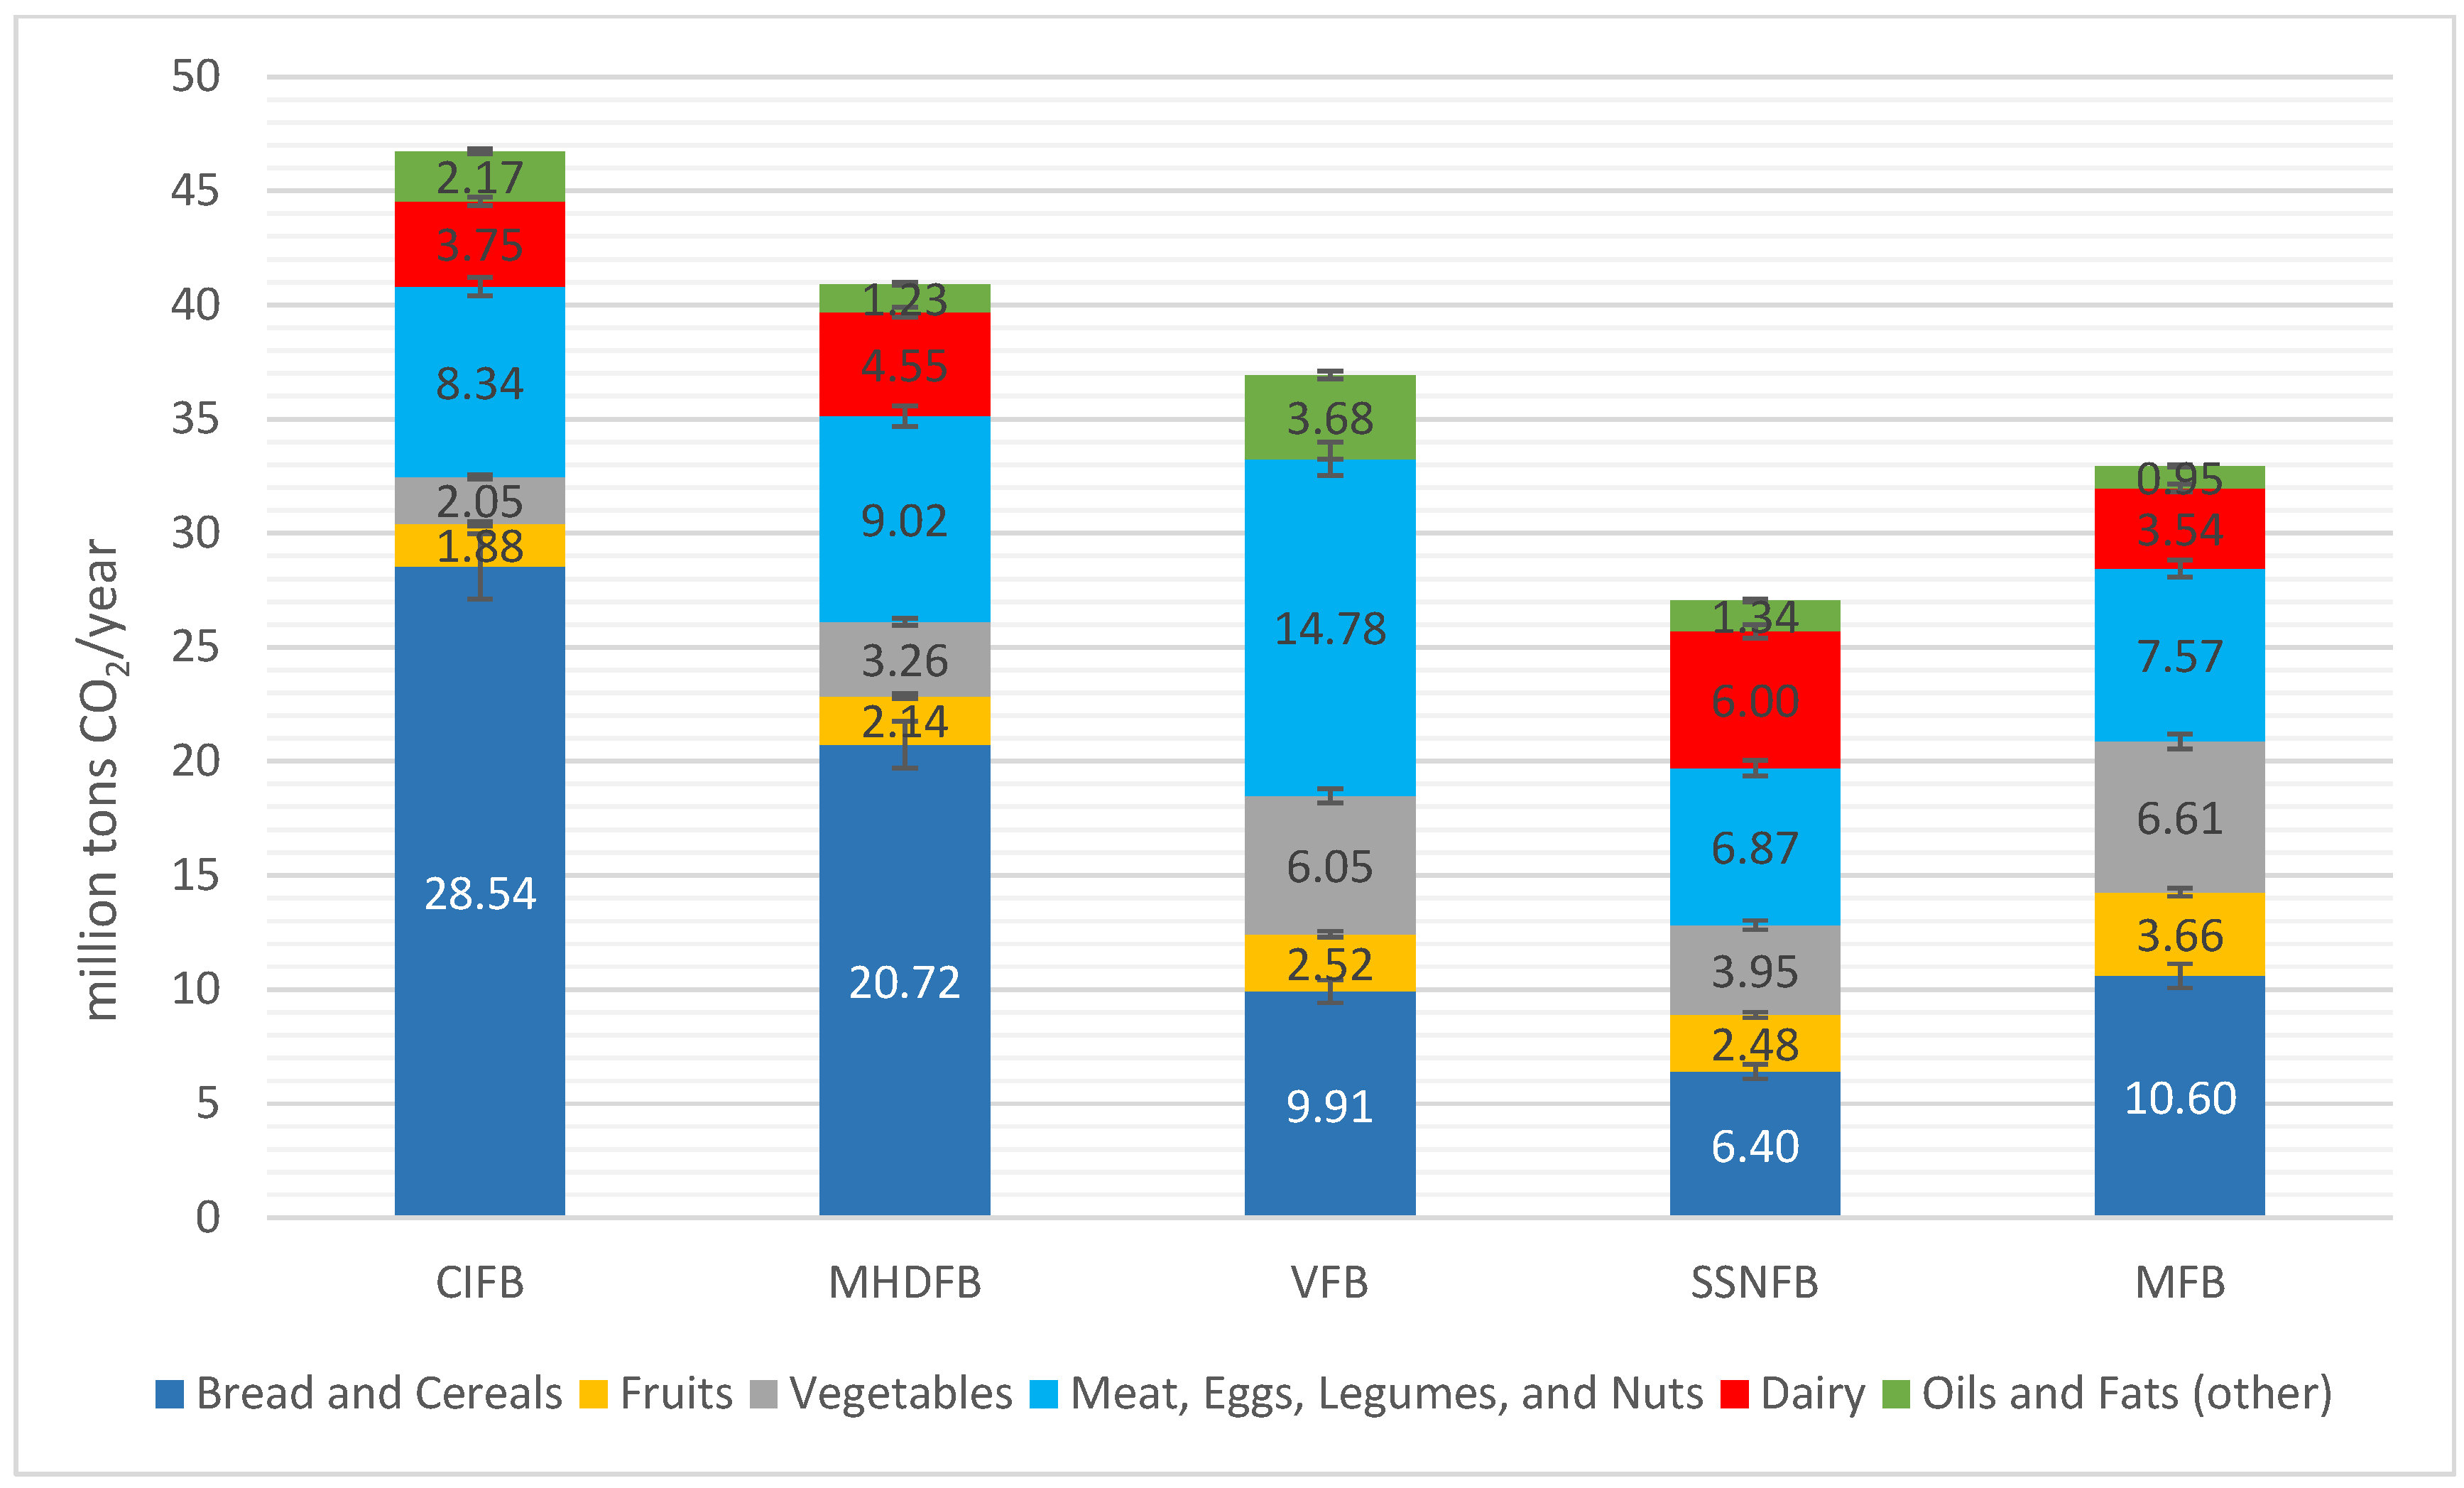
Figure 5.
Comparison of the water footprints of CIFB and VFB for years 2030 and 2050 (red arrows indicate the possibility of increasing the stored water volume (BCM) when using VFB instead of CIFB).
Figure 5.
Comparison of the water footprints of CIFB and VFB for years 2030 and 2050 (red arrows indicate the possibility of increasing the stored water volume (BCM) when using VFB instead of CIFB).

Figure 6.
Comparison of the carbon footprints of CIFB and VFB for years 2030 and 2050 (red arrows indicate a decrease in carbon footprint (million tons CO2·year−1) if VFB is adopted instead of the CIFB).
Figure 6.
Comparison of the carbon footprints of CIFB and VFB for years 2030 and 2050 (red arrows indicate a decrease in carbon footprint (million tons CO2·year−1) if VFB is adopted instead of the CIFB).

Figure 7.
The share of Iran’s different CO2 emission sources in 2010 [69].
Figure 7.
The share of Iran’s different CO2 emission sources in 2010 [69].


Table 1.
Characteristics of studied food baskets.
| Food Group | kg/capita/year | ||||
|---|---|---|---|---|---|
| CIFB | MHDFB | VFB | SSNFB | MFB | |
| Bread and Cereals | 114 | 155.1 | 70 | 45.2 | 75 |
| Fruits | 100.5 | 102.2 | 120.4 | 118.6 | 175 |
| Vegetables | 103 | 135 | 246.3 | 160.6 | 269 |
| Meat, Eggs, Legumes, and Nuts | 61.4 | 59.4 | 57.3 | 48.5 | 55 |
| Dairy | 104.1 | 91.2 | 0 | 120.4 | 71 |
| Oils and Fats (other) | 36 | 27.3 | 133.5 | 94.1 | 16 |
Table 2.
Selection of the examined food-basket priority using the TOPSIS method.
| Food Baskets (Options) | Preference Coefficient (CL) | Priority |
|---|---|---|
| VFB | 0.701 | 1 |
| SSNFB | 0.681 | 2 |
| MFB | 0.469 | 3 |
| MHDFB | 0.200 | 4 |
| CIFB | 0.000 | 5 |
Table 3.
The effect of selecting the CIFB and VFB in ensuring food and nutrition security sustainability in terms of water allocated to the agricultural sector.
Table 3.
The effect of selecting the CIFB and VFB in ensuring food and nutrition security sustainability in terms of water allocated to the agricultural sector.
| Year | Allowable Water to Agricultural Sector (BCM) [63] | CIFB | VFB | ||
|---|---|---|---|---|---|
| Water Footprint (BCM) | Water Balance (BCM) | Water Footprint (BCM) | Water Balance (BCM) | ||
| 2021 | 62 | 63.9 | −1.9 | 57.9 | 4.1 |
| 2030 | 70 | 69.8 | −0.2 | 63.3 | 6.7 |
| 2050 | 66 | 78.2 | −12.2 | 70.9 | −4.9 |
Disclaimer/Publisher’s Note: The statements, opinions and data contained in all publications are solely those of the individual author(s) and contributor(s) and not of MDPI and/or the editor(s). MDPI and/or the editor(s) disclaim responsibility for any injury to people or property resulting from any ideas, methods, instructions or products referred to in the content. |
© 2024 by the authors. Licensee MDPI, Basel, Switzerland. This article is an open access article distributed under the terms and conditions of the Creative Commons Attribution (CC BY) license (https://creativecommons.org/licenses/by/4.0/).
Share and Cite
MDPI and ACS Style
Mohammadi, A.; Javadi, S.; Yousefi, H.; Pouraram, H.; Randhir, T.O. A Framework for Assessing Food Baskets Based on Water and Carbon Footprints. Water 2024, 16, 1196. https://doi.org/10.3390/w16091196
AMA Style
Mohammadi A, Javadi S, Yousefi H, Pouraram H, Randhir TO. A Framework for Assessing Food Baskets Based on Water and Carbon Footprints. Water. 2024; 16(9):1196. https://doi.org/10.3390/w16091196
Chicago/Turabian StyleMohammadi, Ali, Saman Javadi, Hossein Yousefi, Hamed Pouraram, and Timothy O. Randhir. 2024. "A Framework for Assessing Food Baskets Based on Water and Carbon Footprints" Water 16, no. 9: 1196. https://doi.org/10.3390/w16091196
Note that from the first issue of 2016, this journal uses article numbers instead of page numbers. See further details here.