Photochlorination of Anthracene in Saline Ice under Simulated Solar Light


School of Environmental Science and Engineering, Shaanxi University of Science and Technology, Weiyang District, Xi’an 710021, China
*
Author to whom correspondence should be addressed.
Water 2024, 16(9), 1237; https://doi.org/10.3390/w16091237
Submission received: 21 March 2024
/
Revised: 23 April 2024
/
Accepted: 24 April 2024
/
Published: 26 April 2024
Abstract
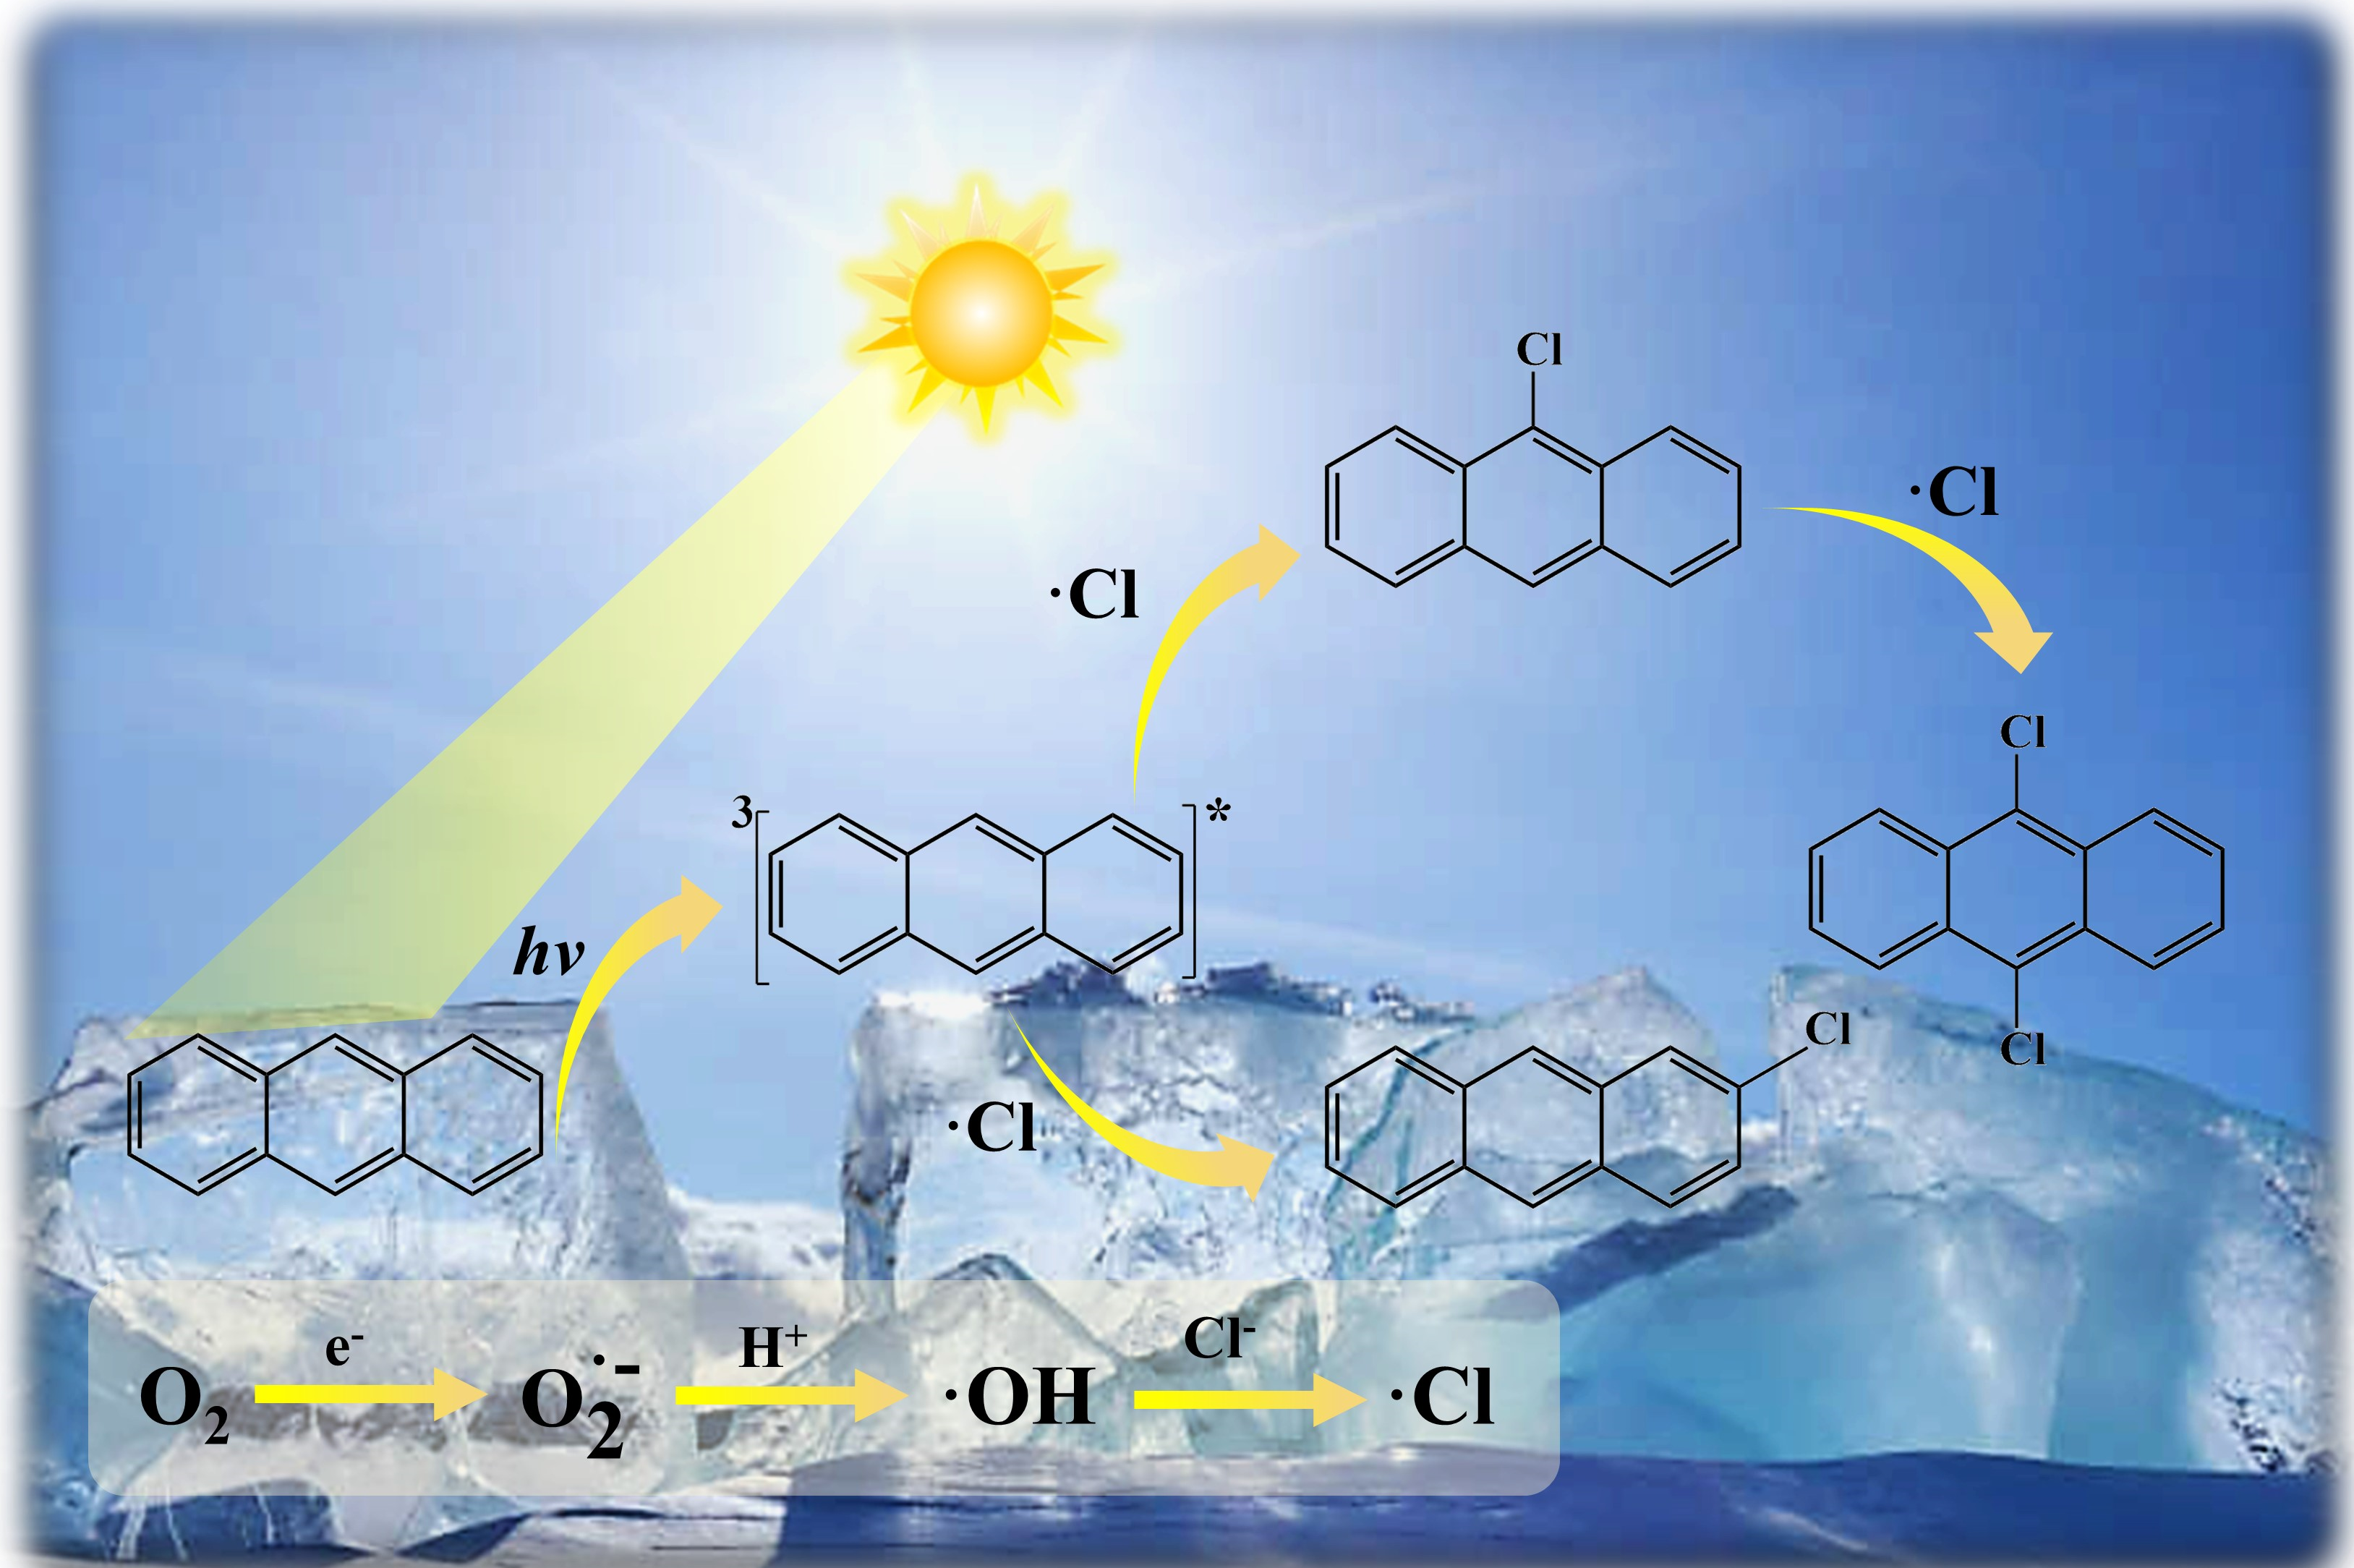
:Polycyclic aromatic hydrocarbons (PAHs) can undergo photochemical reactions in chlorine-containing environments, generating chlorinated polycyclic aromatic hydrocarbons (ClPAHs). This phenomenon has been confirmed in aqueous and soil environments, while was previously overlooked in saline ice. Thus, this study aimed to investigate the photochemical chlorination behavior of anthracene (ANT) in saline ice. Under photoexcitation, the ground state ANT generates the singlet state ANT (1ANT*), which is transformed into the triplet state ANT (3ANT*) via intersystem crossing. Simultaneously, the oxygen receives electrons and further reacts to form the hydroxyl radical (·OH). The ·OH reacts with chloride ions (Cl−) to produce chlorine radicals (·Cl). The ·Cl then reacts with 3ANT* to form monochloroanthracene (9-ClANT, 2-ClANT). The resulting monochloroanthracene further reacts with ·Cl to form dichloroanthracene (9,10-Cl2ANT). Lower temperature, higher salinity, and dissolved organic matter are facilitated to generate ClPAHs, which may show negative impacts on the ecological environment.

1. Introduction
Polycyclic aromatic hydrocarbons (PAHs) are a class of hazardous and noxious substances [1,2,3]. Due to the structural stability and resistance to degradation, PAHs are widely found in the environment [4]. In aquatic environments, the majority of PAHs originate from human activity emissions [2,5,6,7,8]. PAHs can reach remote polar and alpine regions via runoff and atmospheric transport. Subsequently, these compounds may become entrapped in ice due to prevailing temperature and other climatic conditions [9,10]. Casal et al. and Iriarte et al. detected PAHs in samples from Antarctica and investigated the influence of ice melt on PAHs fluxes [9,11]. PAHs can undergo photochemical reactions in natural environments, for example, in top water anthracene (ANT) photolysis to form anthraquinone and anthracenone [12]. In seawater, ANT can react to form chloroanthracenes (ClANTs) [13,14]. Chlorinated polycyclic aromatic hydrocarbons (ClPAHs) are a class of compounds with one or more chlorines attached to the aromatic rings of the corresponding parent PAHs. Due to the higher structural stability, biotoxicity, and elevated activity at the aryl hydrocarbon receptor (AhR), ClPAHs represent a significant risk to biological safety, surpassing that of their parent PAH compounds [15,16,17]. In the environment, most ClPAHs originate from human activities such as tap water disinfection, sewage treatment, and waste incineration [16,18,19,20]. However, ClPAHs have also been detected in less traveled areas [21,22]. Jin et al. were able to detect trace amounts of ClPAHs in the atmosphere, soil, and organisms in regions such as the Tibetan Plateau [21]. This could be attributed to the photochemical chlorination of PAHs in the natural environment [13,14].
Seawater, being the largest chlorine-containing environment on Earth, plays a significant role in the production of ClPAHs under natural conditions [13]. Extensive research has been conducted on the photochemical transformation of PAHs in seawater environments [14,23]. Sankoda et al. investigated the photochemical chlorination of PAHs in seawater by employing glass beads to simulate beach-like conditions [13,14]. Hu et al. investigated the photochemical transformation of benzo[a]pyrene (BaP) in brine using a xenon (Xe) lamp to simulate sunlight. They found that the photochemical transformation of BaP in brine was mainly induced by its self-sensitization [24]. Chloride ion (Cl−) plays an important role in the photochemical chlorination of PAHs [25]. The cold polar climate causes the seawater to freeze into ice. During this process, pollutants in the seawater can become trapped within the ice [11,26,27]. Ice has unique physical and chemical properties and is an important medium for photochemical reactions, which can affect the photochemical reactions of pollutants in ice [28]. Keren et al. demonstrated that the phototransformation of phenanthrene and ANT is faster in ice compared to water. This may be attributed to the enhanced luminous flux from reflected light on the ice surface [29]. Due to the presence of different solutes, saline ice and water ice exhibit variations in microstructure and mechanical properties among other aspects. These discrepancies lead to the markedly distinct photochemical behaviors of pollutants embedded in saline ice as opposed to those in water ice [30,31,32]. Previous studies have demonstrated that the presence of salt leads to the formation of more numerous micron-scale channels of liquid brine on the ice surface. The channels on saline ice surfaces can facilitate phototransformation reactions of contaminants compared to those on water ice surfaces [32].
Previous studies have primarily investigated the photochemical chlorination of PAHs to ClPAHs in aqueous solutions and soils [14,24,33]. In contrast, studies on the photochemical reaction of PAHs in ice have focused on the influence of various environmental factors on phototransformation [27,29,34,35,36]. Currently, there have been no reports on the photochlorination reaction of PAHs in saline ice. ANT is an essential chemical raw material that is widely used in the production of pesticides, gasoline depressants, and so on. Consequently, the content of ANT in the natural environment is usually higher compared to other PAHs [37]. In the natural environment, ANT can undergo phototransformation by absorbing solar radiation [14,23,38,39]. In this study, ANT was used as a model compound to research the photochemical chlorination of PAHs in saline ice under simulated solar light irradiation. Simultaneously, the influence of environmental factors such as pH, reaction temperature, Cl−, and dissolved organic matter (DOM) on the phototransformation of ANT and the formation of ClANTs on saline ice were also investigated.
2. Material and Methods
2.1. Materials and Reagents
Detailed information on the materials utilized in this study can be found in Text S2 of Supplementary Materials.
2.2. Preparation of ANT Reaction Ice
First, the ANT stock solution (200 mg/L) was prepared using chromatography grade methanol and stored in a brown bottle in the refrigerator, protected from light to maintain its stability. Sodium chloride (NaCl) solution was prepared from ultrapure water and stored at room temperature. ANT saline solution (0.5 mg/L) was prepared by diluting the ANT stock solution with a 0.5 mol/L NaCl solution. Note that the methanol in the ANT stock solution should have volatilized before the dilution process. Then, the ANT saline solution (20 mL) was transferred to a glass Petri dish. The Petri dish was wrapped in aluminum foil and refrigerated for approximately 15 h to acquire ANT saline ice for subsequent reactions.
2.3. Trapping Experiments
In the phototransformation experiment, coumarin (COU, 0.1 mmol/L) was added as an ·OH scavenger to investigate the contribution of ·OH to the phototransformation of ANT and the formation of its chlorinated products [40]. Additionally, the involvement of singlet oxygen (1O2) in the phototransformation of ANT in saline ice was assessed by adding furfuryl alcohol (FFA, 1 mmol/L) as a scavenger [41]. The scavengers used in the remaining trapping experiments were 2,2,6,6-tetramethylpiperidine-1-oxy radical (TEMPOL, 0.1 mmol/L) for superoxide radical (), 2,4,6-trimethylphenol (TMP, 0.5 mmol/L) for the triplet state ANT (3ANT*) [42], 3,5-dimethyl-1 H-pyrazole (DMPZ, 0.2 mmol/L) for chlorine radicals (·Cl), sodium thiocyanate (NaSCN, 1 mmol/L) for ·Cl, and 1,4-diazabicyclo [2.2.2]octane (DABCO, 0.2 mmol/L) for ANT cationic radicals (ANT·+) [33].
2.4. Irradiation Experiments
The photochemical experiments were conducted in a self-made temperature-adjustable reaction chamber using a 300 W Xe light source (CEL-HXF300, Education Au-Light Technology Co., Ltd., Beijing, China) to simulate sunlight. The schematic diagram of the self-made reactor is shown in Figure S1. The ice samples were positioned in the reaction chamber at −15 °C (258.3 K). The distance between the ice samples and the Xe light source was 15 cm. The light intensity on the surface of the ice samples was 160 mW/cm2, except for the experiments investigating different light intensities. Samples were collected after 0, 5, 10, 20, 40, and 60 min of light exposure. The collected samples were wrapped in tinfoil and thawed at room temperature. A total of 1.5 mL of the thawed sample was then pipetted directly into the high-performance liquid chromatography (HPLC) for analysis.
2.5. Sample Preparation
The illuminated sample underwent additional processing, which involved liquid-liquid extraction and rotary evaporation. The detailed steps are as follows. First, melt the light-exposed ice sample into a liquid at room temperature. Second, extract the 40 mL reaction solution with 5 mL of a hexane and dichloromethane mixture (v/v = 1:1). Repeat the extraction process three times. Third, the three extracts were combined and then evaporated to dryness using a rotary evaporator (R-1001VN, Greatwall Scientific industrial and Trade Co., Ltd., Zhengzhou, China). Finally, methanol was added to the rotary flask until the volume reached 1 mL for HPLC analysis. When used for gas chromatography-mass spectrometry (GC-MS) analysis, dichloromethane was added to the flask, with the volume adjusted to 1 mL.
2.6. Methods of Analysis
Detailed descriptions of the analytical methods used in this study are available in Text S3 in the Supplementary Materials.
3. Results and Discussion
3.1. Phototransformation of ANT and Formation of Its Chlorinated Products in Saline Ice
As shown in Figure S2, the UV–Vis absorption spectrum of ANT had a maximum absorption peak at 251 nm as well as vibrational absorption in the range of 350–400 nm. Spectral data from Xe lamp manufacturers (Beijing, China)indicate that the emission spectrum is ≥300 nm. Therefore, ANT can directly absorb photons and transform into excited states for photochemical reactions under Xe lamp irradiation.
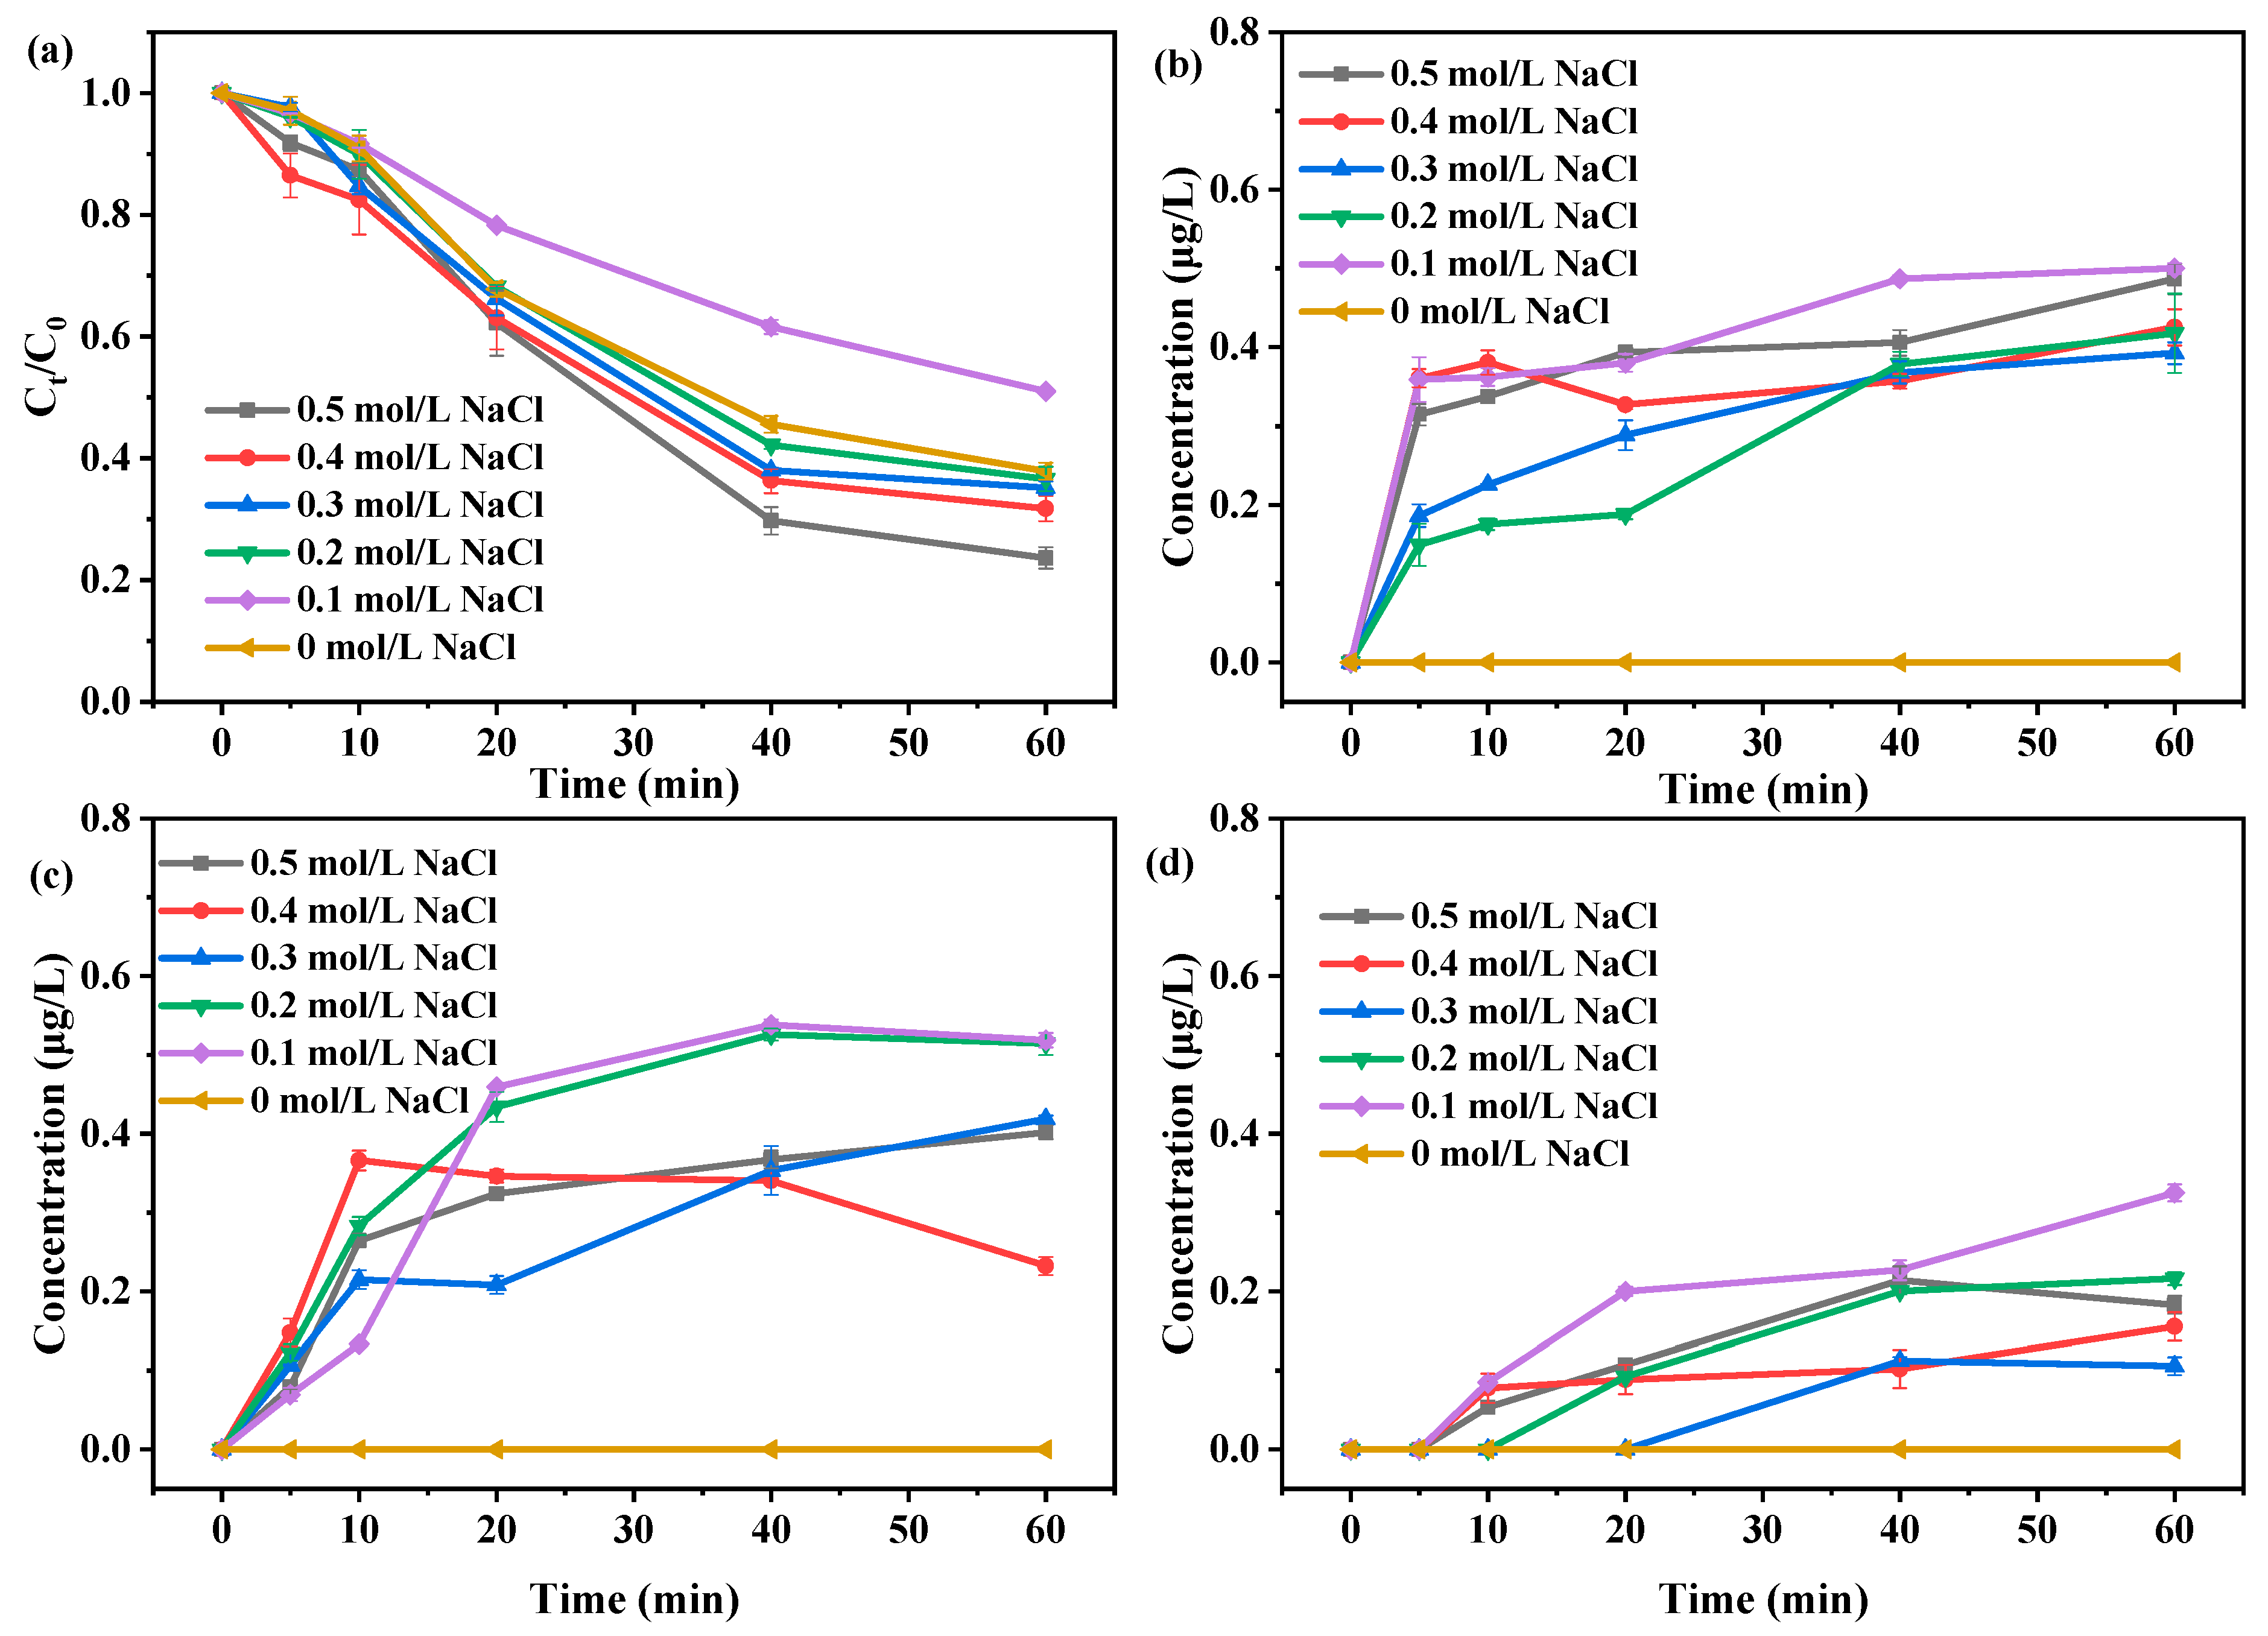
The phototransformation of ANT in ice with varying salt concentrations is shown in Figure 1a. The phototransformation rates of ANT accelerated with the increase in the salt concentration when [NaCl] ≥ 0.2 mol/L (Table S1). After 1 h irradiation, ANT was phototransformed by 62.15%, 49.02%, 63.40%, 64.88%, 68.25%, and 76.37% when the Cl− concentration was 0, 0.1, 0.2, 0.3, 0.4, and 0.5 mol/L, respectively. Research demonstrates that salt concentrations affect the porosity and void microstructures of ice, which would cause changes in the reaction rate of ANT in ice containing different salt concentrations [32]. The surface of saline ice possessed broader channels compared to pure water ice, as depicted in Figure S3a,b. This observation is consistent with previous studies. These results suggest that the addition of NaCl resulted in the formation of micrometer-scale channels on the ice surface and the coexistence of contaminants with saline solution in the channels [32]. As the NaCl concentration increases, the saline channels on the ice surface widen, and ANT absorbs photons more readily [32]. This explains the accelerated rate of the phototransformation of ANT with increasing salt concentration when [NaCl] ≥ 0.2 mol/L. When [NaCl] = 0.1 mol/L, the phototransformation of ANT was inhibited. This may be due to the limited promotion of ANT phototransformation by the narrow micrometer-scale channels formed on the ice surface, and the quenching effect of NaCl on the excited ANT [37,43]. In addition, a Raman spectrometer was used to detect ice samples with and without NaCl; the spectra are depicted in Figure S4. Compared with water ice, the O-H stretching vibration peak of ice samples containing 0.5 mol/L NaCl exhibited broadening at 2700–3700 nm. There is a strong interdependence between the O-H stretching vibration and hydrogen bond strength [44]. The addition of NaCl weakens the strength of hydrogen bonds and promotes the phototransformation of ANT.
Figure 1b–d shows the formation of ANT photochlorination reaction products including 2-ClANT, 9-ClANT, and 9,10-Cl2ANT. It was observed that the production of 2-ClANT reached a maximum after 5 min of light, while the production of 9-ClANT was only a third of that of 2-ClANT and no 9,10-Cl2ANT was detected. According to previous research [13,14], the chlorination of PAHs is related to their physical and chemical properties. Notably, the point with the highest frontier electron density (FED) in PAH, which is the sum of the highest occupied molecular orbital (HOMO) and the lowest unoccupied molecular orbital (LUMO), is likely to be attacked by ·Cl. The FED of ANT at positions 9 and 10 (0.352) is greater than that at position 2 (0.166), and the FED at these three positions is significantly higher than the other positions [13,14]. Thus, chlorination preferentially occurs at positions 9 and 10 of ANT, followed by position 2 [45]. The propensity for the further reaction of ClANT correlates with its absolute hardness; the lower absolute hardness of 9-ClANT promotes further chlorination [14]. Thus, 9-ClANT can be further chlorinated to form 9,10-Cl2ANT, which will result in a smaller amount of 9-ClANT detected under short-term illumination. Figure S5 illustrates the total amount of chlorinated products generated by the photochemical chlorination of ANT at various NaCl concentrations. When 0.1 ≤ [NaCl] ≤ 0.3 mol/L, with the increase in NaCl concentration, Cl− promoted the energy transfer between 1ANT* and O2 to produce 1O2. The 1O2 facilitated the photooxidation of ANT, which in turn inhibited the photochlorination of ANT [46]. When [NaCl] ≥ 0.3 mol/L, the energy transfer between 1ANT* and O2 was limited with increasing NaCl concentration. This led to a reduction in the steady-state concentration of 1O2, which in turn inhibited the photooxidation of ANT and thereby promoted the photochlorination of ANT [43]. No ClANTs were detected when [NaCl] = 0 mol/L, indicating that the chloride ions involved in the chlorination reaction of ANT originated from free Cl− in the saline ice.
ANT is a photosensitive PAH that can directly absorb light and undergo photochemical reactions. Therefore, exploring the impact of light intensity on ANT phototransformation is essential. In this study, the light intensity was varied by adjusting the distance between the light source and the sample. The photolysis kinetics of ANT and the generation of ClANTs were investigated at light intensities of 160, 130, and 100 mW/cm2, respectively. The findings, presented in Figure S6, revealed that the photodegradation of ANT was accelerated and the generation of ClANTs increased as the light intensity enhanced. The results of the experiments with extended light exposure are shown in Table S2. With longer light exposure, the photodegradation rate of ANT increased, while the production of ClANTs initially increased and then decreased. This suggests that ClANTs are also capable of undergoing photolytic reactions.
3.2. Reactive Oxygen Species
To explore the type of reactive oxygen species (ROS) involved in the reaction, HPLC, FL, and EPR were used for detection. The detection results are shown in Figure 2, Figures S7 and S8. In the ·OH, , and 1O2 trapping experiments, COU, TEMPOL, and FFA were added to the reaction samples, respectively. Compared to the control group, the addition of trapping agents resulted in a noticeable reduction in the phototransformation of ANT. Meanwhile, the EPR results indicated that the signals of ·OH and 1O2 increased with the increase in light duration (Figure S8). 1,3-Diphenylisobenzofuran (DPBF), a fluorescent substance, can react with to generate non-fluorescent products [47]. When adding DPBF to the ice samples for FL detection, the fluorescence intensity of DPBF decreased with increasing exposure time. These phenomena indicate that ·OH, , and 1O2 participate in the phototransformation reactions of ANT. Interestingly, the addition of FFA did not significantly affect the production of 9-ClANT and 9,10-Cl2ANT, suggesting that 1O2 is essentially uninvolved in the ANT chlorination reaction. In contrast, the production of ClANTs was significantly reduced after the addition of TEMPOL or COU to the ice samples, suggesting that and ·OH play a crucial role in the chlorination reaction of ANT. Upon deoxygenation, the phototransformation of ANT decreased, the generation of 2-ClANT significantly decreased, and the production of 9-ClANT and 9,10-Cl2ANT was not detected. This indicated that O2 is involved in the phototransformation of ANT and plays a major role in the photochlorination of ANT to ClANTs. The small amount of 2-ClANT detected may be due to the residual traces of O2 during the deoxygenation process.
To investigate the involvement of other non-reactive oxygen radicals in the reaction, TMP was added to detect 3ANT*, DABCO to detect ANT·+, and DMPZ and NaSCN to detect ·Cl. The experimental results are shown in Figure 2. The addition of TMP, DMPZ, and NaSCN inhibited the photochemical transformation of ANT (Figure 2a), suggesting the involvement of 3ANT* and ·Cl in the phototransformation process of ANT. After 1 h of light exposure, only small amounts of 2-ClANT and 9-ClANT were detected in the TMP-added samples, while no 9,10-Cl2ANT was detected. The addition of DMPZ reduced the production of ClANTs by approximately 50% compared to the control group. After adding NaSCN, only a small amount of 2-ClANT was detected; 9-ClANT and 9,10-Cl2ANT were not detected (Figure 2b–d). This indicates that both 3ANT* and ·Cl are involved in ANT photochlorination to produce ClANTs. The addition of DABCO to the samples inhibited the phototransformation of ANT (Figure 2) but had minimal effect on the generation of ClANTs. This suggests that ANT·+ participates in the photooxidation of ANT, but does not significantly affect the photochlorination of ANT.
3.3. Laser Flash Photolysis Experiment
To further determine the 3ANT* during the photochemical reaction, the ultra-pure water ice of ANT, the NaCl-containing ice (0.5 mol/L), and the FA-containing saline ice (10 mg/L) were investigated by laser flash photolysis. The results demonstrated that the absorption peak of 3ANT* was at 408 nm under the irradiation of a 355 nm laser [48]. These results are depicted in Figure 3.
The samples of ANT in water ice, saline ice, saline solution, and FA-containing saline ice all exhibited obvious absorption peaks at 408 nm, whereas no absorption peak at 408 nm was observed in the deoxygenation experiment. The absorption intensity of each sample, ranked from large to small, is as follows: ΔA (FA) > ΔA (Water Ice) > ΔA (Saline Ice) > ΔA (25 °C) > ΔA (N2). The addition of FA led to an increase in the steady-state concentration and a shortening of the lifetime of 3ANT* (Figure S9), which may have caused an increase in the production of ClANTs. After deoxygenation, 3ANT* was not detected. This suggests that 3ANT* originates from the intersystem crossing between 1ANT* and O2. Without O2, 3ANT* is not generated. The slightly lower peak at 408 nm for the saline solution sample at 25 °C compared to the saline ice sample at −15 °C indicates that the increase in temperature inhibits the production of 3ANT*. Meanwhile, as shown in Figure S9, the lifetime of 3ANT* in 25 °C saline water was shorter than that in saline ice, which will lead to a decrease in the production of ClANTs with increasing temperature. The addition of NaCl decreased the intensity of the peak at 408 nm compared to water ice. This could be attributed to the reaction between ·Cl and 3ANT*, resulting in a decrease in the amount of 3ANT* in the saline ice.
To define the role of ·Cl in the photochemical chlorination of ANT, LFP was used for its detection. SCN− is known to react with the ·Cl to form , which exhibits a distinct absorption peak within the 450–500 nm range [49]. This spectral signature does not overlap the absorption peak of 3ANT*, which is located at 408 nm, thereby avoiding interference with the absorption at 450–500 nm. Consequently, SCN− was chosen as the indicator and incorporated into the ANT saline ice. After exposure to a 355 nm laser, the LFP image is shown in Figure S10. The characteristic absorption peaks of (SCN appeared in the range of 450–500 nm, and the absorption peak of 3ANT* at 408 nm. These findings corroborate the participation of ·Cl in the photochlorination of ANT.
3.4. The Reaction Pathways of ANT
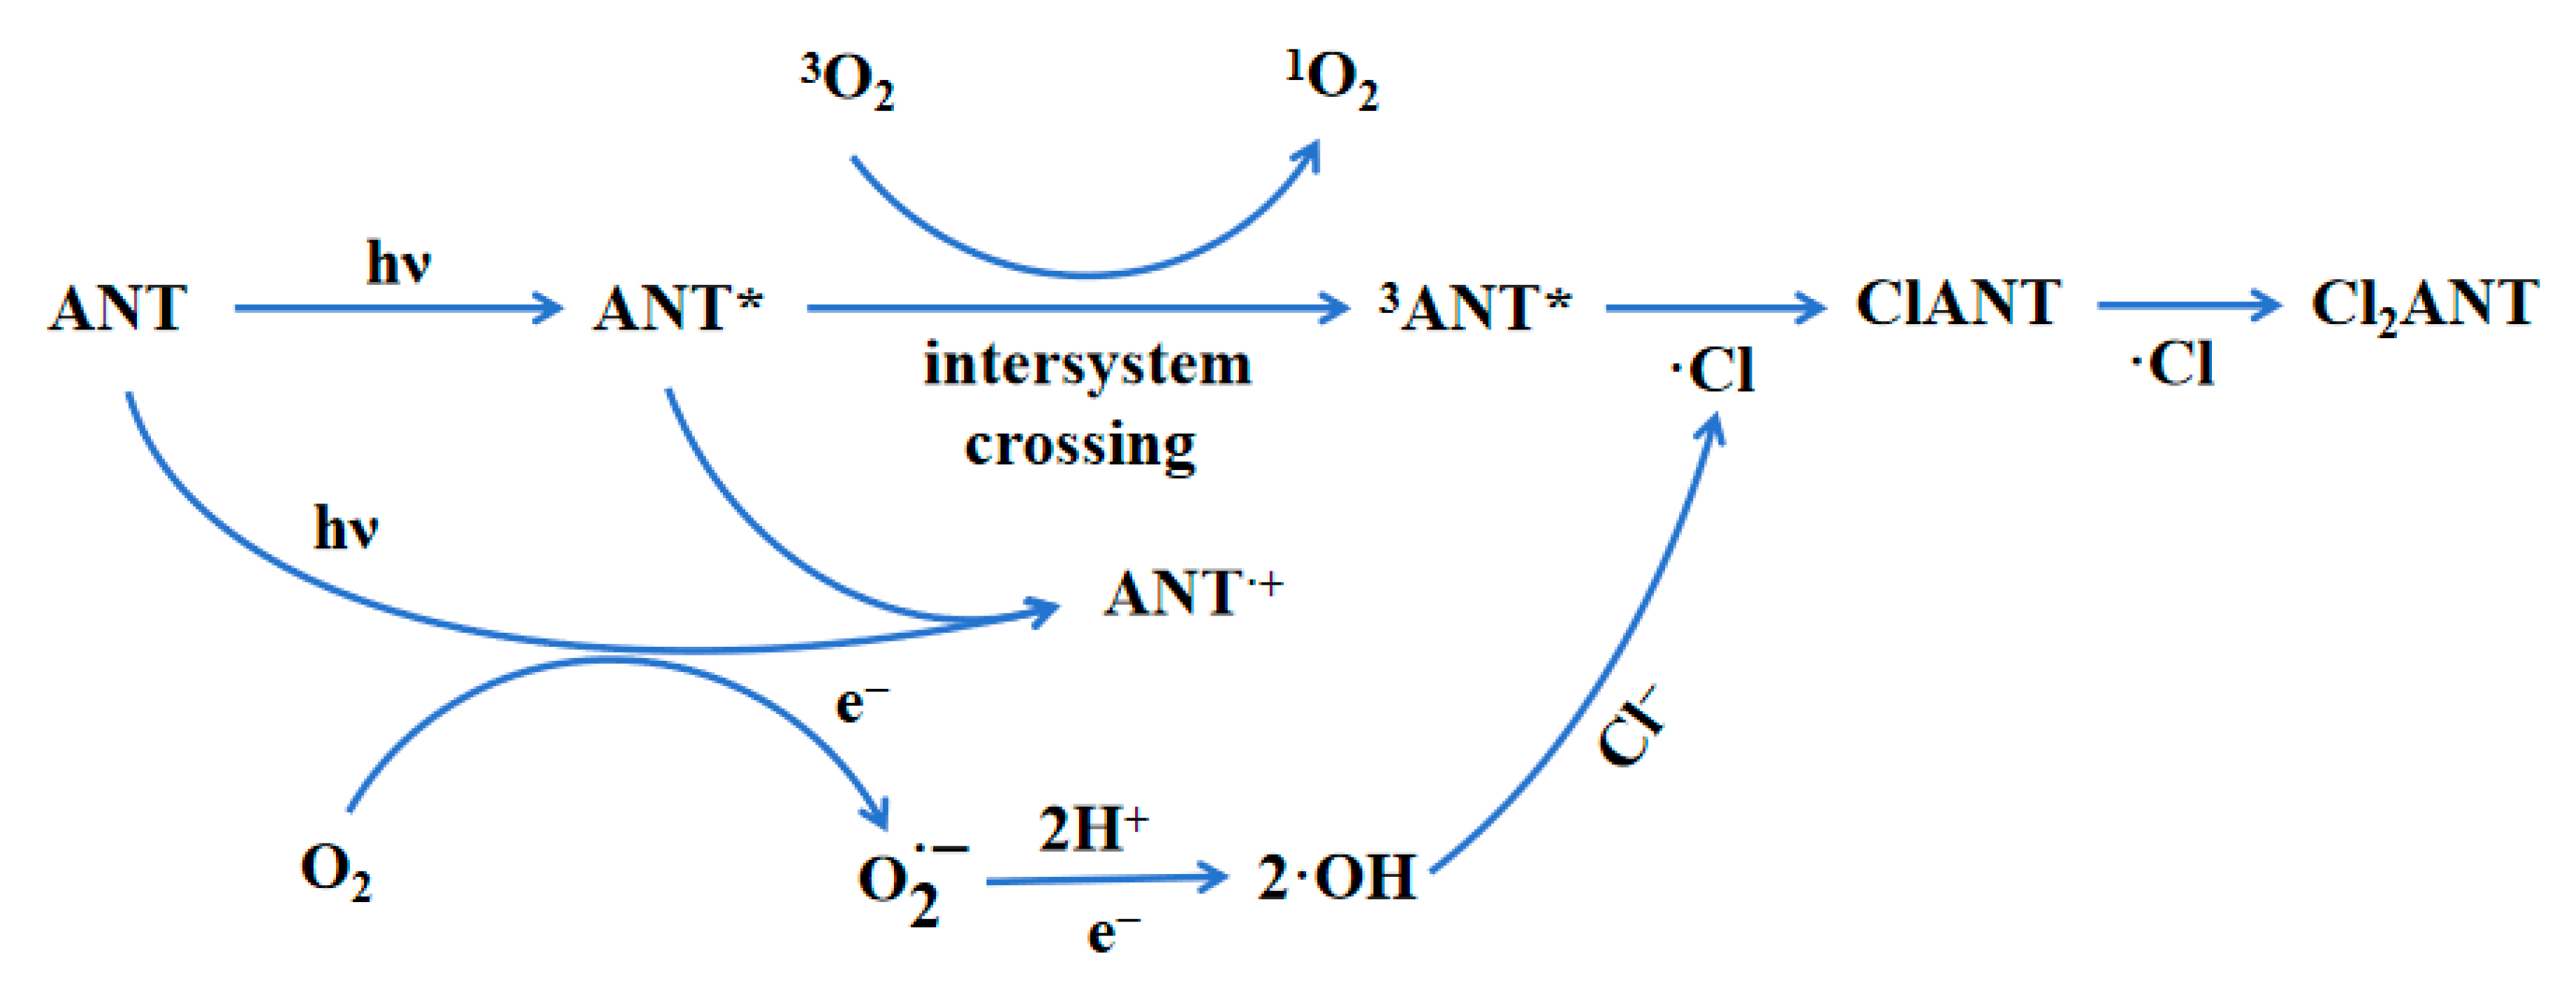
Based on the findings from the free radical trapping experiment and LFP, the reaction pathway for the photochemical chlorination of ANT to generate ClANTs in saline ice was inferred, as shown in Scheme 1. First, ANT captures photons and undergoes excitation, generating 1ANT* and releasing electrons (e−). Second, 1ANT* could undergo intersystem crossing with the triplet oxygen (3O2) to produce 3ANT* and 1O2. 1ANT* could release e−, and the released e− reacts with O2 to produce . The then reacts with H2O to form ·OH, which in turn reacts with Cl− to generate ·Cl. Finally, ·Cl reacts with 3ANT* to produce ClANT (2-ClANT, 9-ClANT), which can continue to react with ·Cl to generate Cl2ANT (9,10-Cl2ANT).
3.5. The Influence of Temperature
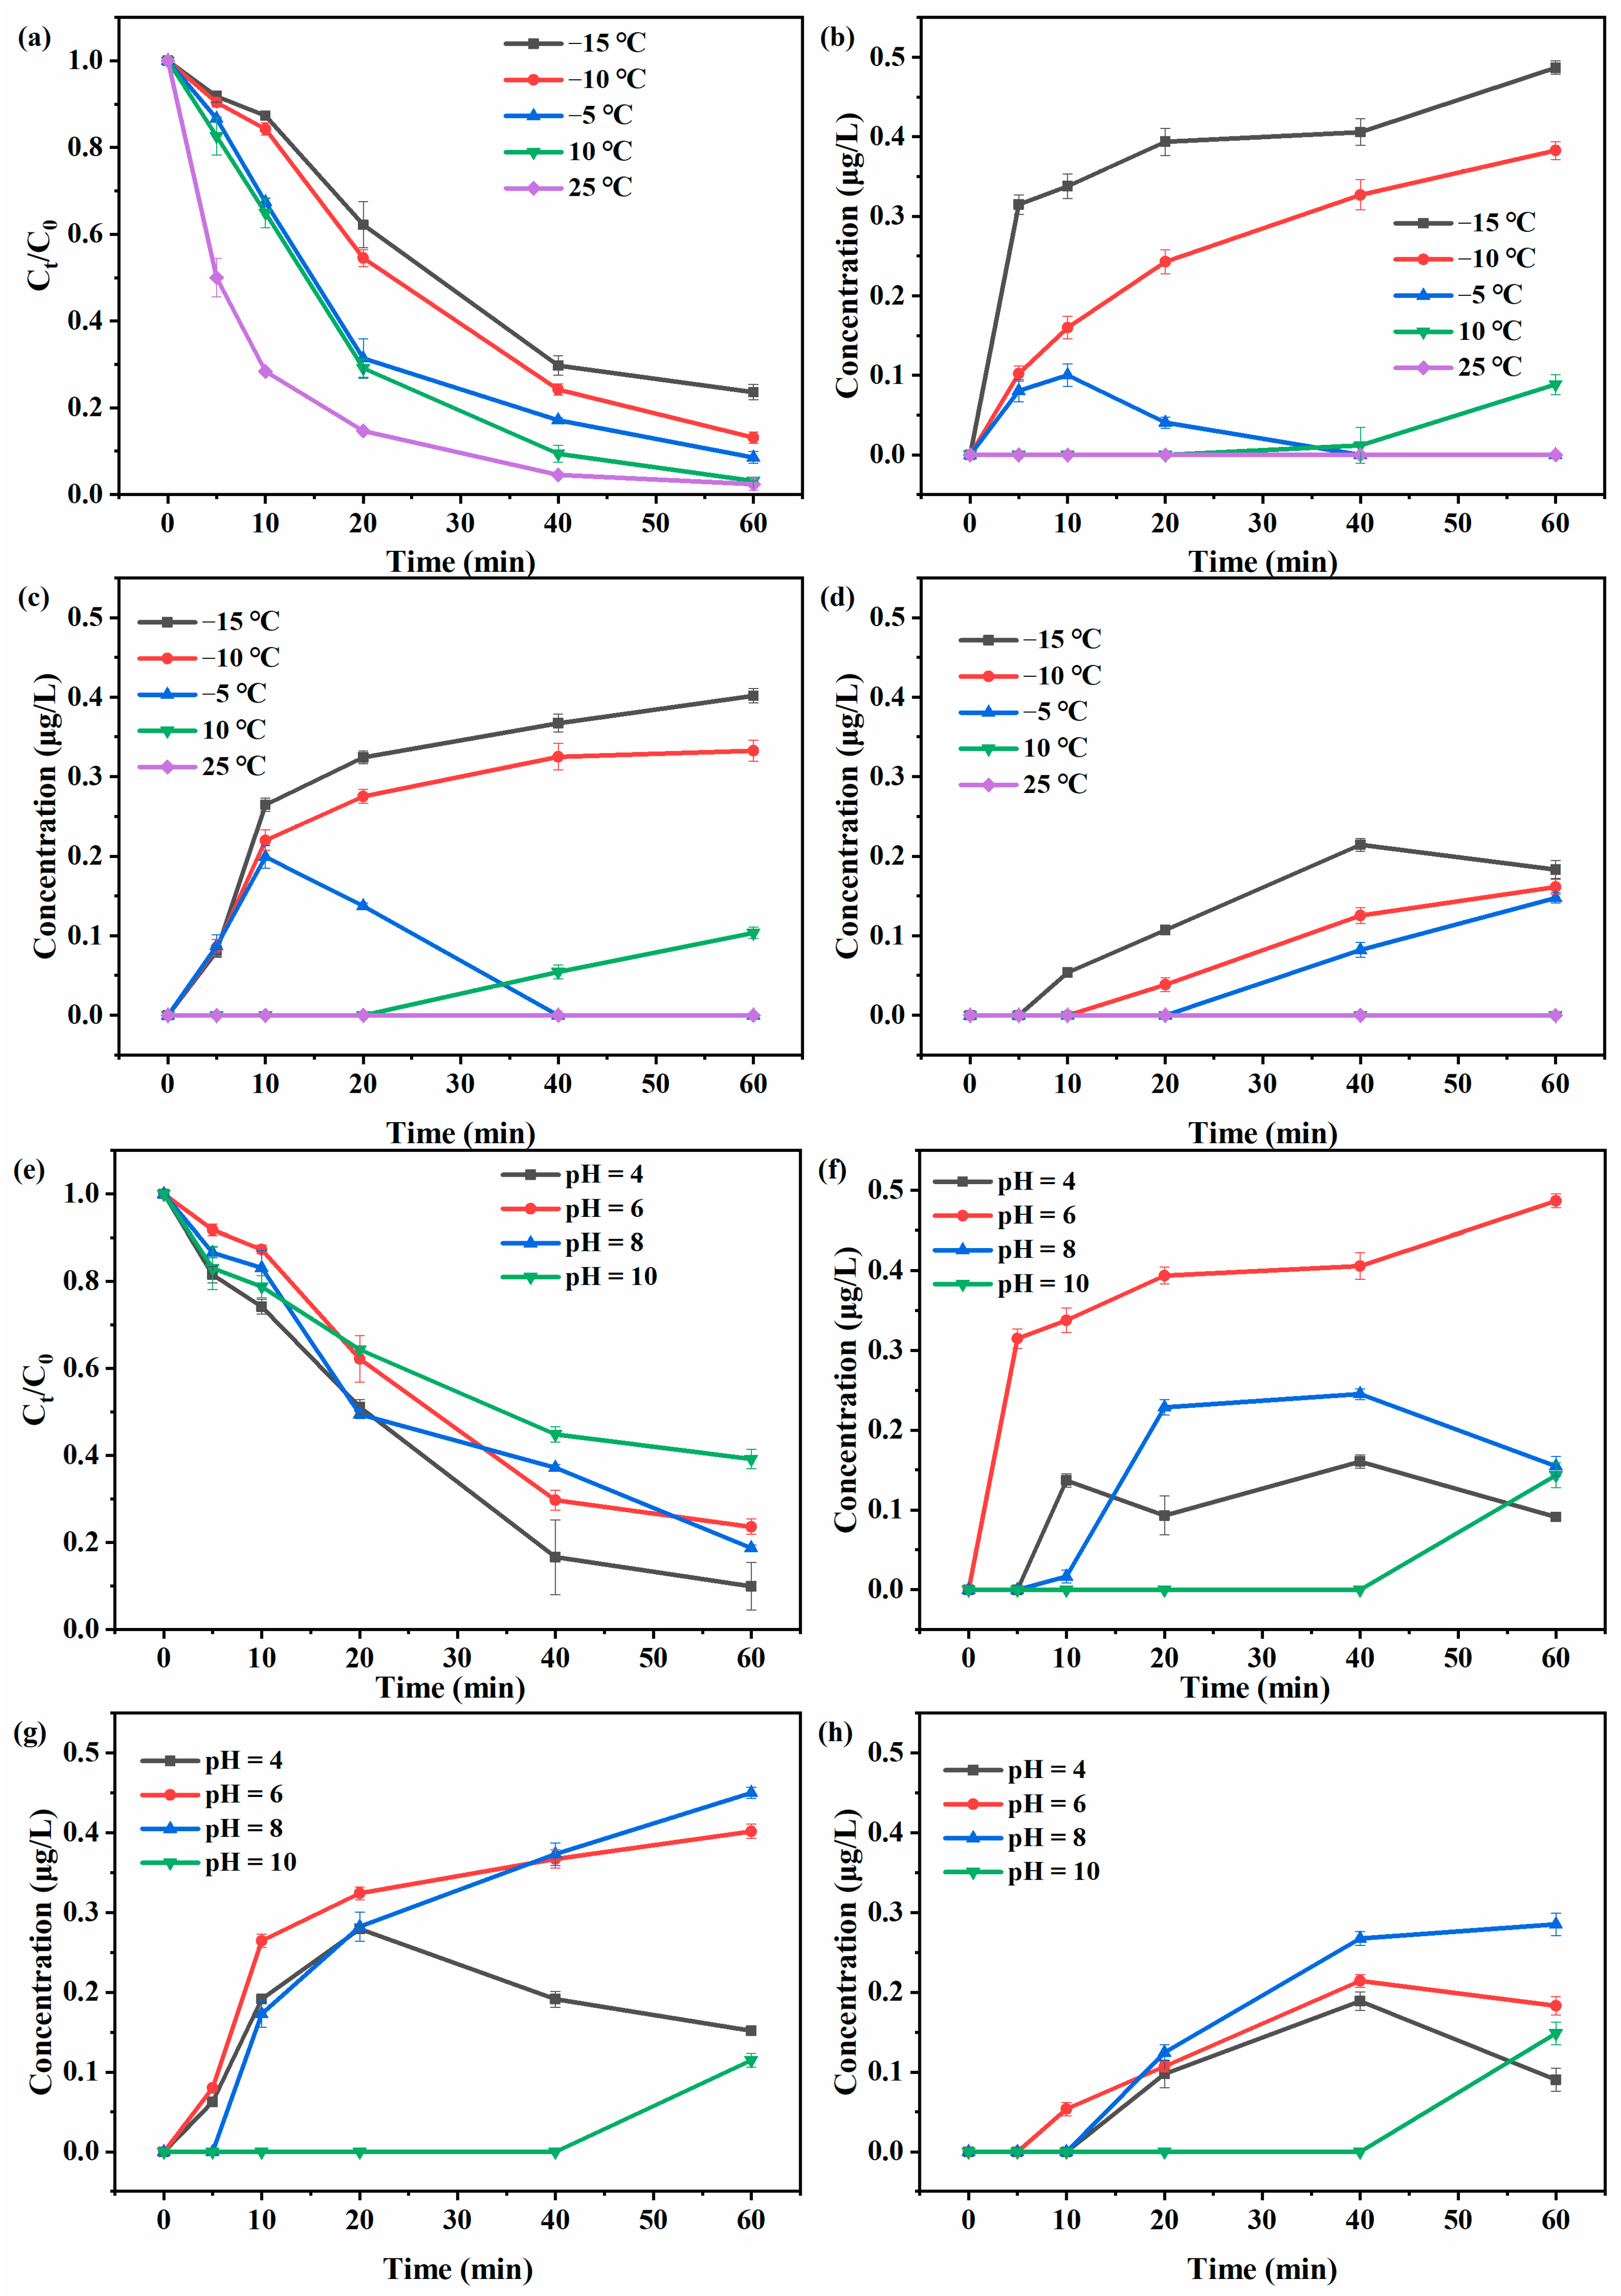
Previous studies have demonstrated that temperature has a significant effect on the morphology and structure of ice [30,31]. The phototransformation kinetics of ANT in both aqueous solution and water ice have been investigated. Kahan et al. reported a faster phototransformation rate of ANT on ice surfaces compared to water [34]. In contrast, Hullar et al. showed that the phototransformation rates of ANT were identical in both mediums [50]. The impact of temperature on the phototransformation of ANT in saline ice certainly merits investigation. In this experiment, the influence of temperature on the phototransformation of ANT and the formation of its chlorinated products was deeply explored by manipulating the temperature of the photoreaction chamber. As shown in Figure 4a, ANT was phototransformed by 76.37%, 86.88%, 91.44%, 96.85%, and 97.52% at temperatures of −15, −10, −5, 10, and 25 °C following 1 h of illumination, respectively. The phototransformation of ANT increased with the increase in temperature. The outcomes of this experiment diverge from the results of previous studies by Kahan [34] and Hullar et al. [50]. The plausible explanation for this discrepancy could be attributed to the presence of salt ions (Na+, Cl−) in this experiment. It appears that these salt ions enhance the phototransformation of ANT in both ice and water mediums. Intriguingly, the phototransformation of ANT in ice containing 0.5 mol/L NaCl was 1.25 times higher than that in pure water ice, while the phototransformation of ANT in the 0.5 mol/L NaCl aqueous solution was twice as high as that in pure water [37,43]. These findings suggest that the presence of Cl− promotes the phototransformation of ANT in water more significantly than in ice.
However, the generation of ClANTs decreased with the temperature increases, and even no ClANTs could be detected at 25 °C. This phenomenon may be related to the excited state of ANT. Previous studies have indicated that the generation and decay of the 3ANT* are partially influenced by temperature. For example, the binding ability between the triplet state PAH and chlorine increases with decreasing temperature [51]. Therefore, in this study, LFP was used to detect the transient absorption spectra and transient lifetime of 3ANT* at −15 and 25 °C, and the detection results are presented in Figure 3 and Figure S9 (see Section 3.3). The lifetime of 3ANT* was measured to be 163.1 ns in saline solution at 25 °C, which is approximately 40% shorter than that in saline ice. The lifetime of 3ANT* decreases with increasing temperature, which is consistent with the results of Greiner et al. [51,52]. Consequently, as the temperature increases, the amounts of chlorinated products through the photochemical chlorination of ANT in saline ice decrease, and may not even be detected.
3.6. The Influence of pH
pH is another major factor affecting the phototransformation of PAHs in natural conditions. The pH of the ice varies from region to region as a result of human activities and natural processes [53,54]. The phototransformation rate of ANT and the production of chlorinated products in saline ice at different pH were investigated in this experiment. As depicted in Figure 4e, the phototransformation of ANT was increased under acidic condition and inhibited under alkaline condition compared with neutral conditions. At pH = 4, the phototransformation of ANT reached 85.69% after 1 h of light exposure. At pH = 10, the phototransformation of ANT was 60.79% after 1 h of illumination, which was 15.58% lower than that observed under neutral conditions. Under acidic condition, increased H+ led to the increased phototransformation of ANT, which is analogous to the findings of Shaban et al. [55] However, under alkaline condition, the presence of OH− in the environment becomes dominant and inhibits the formation of ·OH [56], thus slowing down the phototransformation of ANT. As depicted in Figure 4f–h, the production of ClANTs was inhibited under acidic condition compared to the neutral condition, while the formation of ClANTs was almost undetectable under the alkaline condition. The highest generation of 2-ClANT was observed when the pH = 6 for the reaction sample, followed by pH = 8, pH = 4, and finally pH = 10. The generation of 9-ClANT under different pH conditions was in descending order of pH = 6, pH = 8, pH = 4, and pH = 10. The trend of 9,10-Cl2ANT was similar to that of 9-ClANT. ANT is photoexcited to produce ROS ( and ·OH) with O2, and then the ROS reacts with Cl− to form ·Cl. However, the reaction between ·OH and Cl− is inhibited under alkaline conditions [56], which negatively affects the production of ClANTs. Under acidic conditions, ANT is more susceptible to undergoing photooxidation reactions than photochlorination [18,55,57].
3.7. The Influence of Fulvic Acid
Dissolved organic matter (DOM) is one of the prevalent pollutants in water. When water freezes, the DOM in the aqueous solution also enters the ice and affects the phototransformation of PAHs in the ice. Based on studies by various environmentalists [27,38,42], the conclusions regarding the influence of DOM on the phototransformation of PAHs are as follows. (1) DOM in water is generally colored and can shield light, thus reducing the number of photons received by PAHs and impeding their phototransformation. (2) DOM can be transformed from the ground state to the excited state after absorbing photons, leading to the generation of ROS, and the existence of ROS can promote the phototransformation of PAHs. The intensities of the two effects above-mentioned vary with the concentration of DOM, and together influence the phototransformation of PAHs.
In this experiment, FA was used as a representative DOM to explore its influence on the phototransformation of ANT and its chlorinated product generation. The experimental results are shown in Figure 5. To examine the effect of FA on the phototransformation of ANT and the formation of its chlorinated products, 0.5, 1, 10, and 20 mg/L FA were added to the saline ice containing ANT, respectively. As illustrated in Figure 5a, varying concentrations of FA exhibited different effects on the phototransformation of ANT. When [FA] = 0.5 mg/L, the phototransformation of ANT was increased, while when [FA] = 1 mg/L, there was essentially no effect on the ANT phototransformation. When [FA] ≥ 10 mg/L, the addition of FA inhibited the phototransformation of ANT.
At a FA concentration of 0.5 mg/L, the addition of FA resulted in an increase in micrometer-scale channels on the ice surface (see Figure S3). Meanwhile, ROS generated by FA photolysis promoted the photodegradation of ANT. In contrast, at higher concentrations, the optical shielding effect of FA dominated, thus inhibiting the photodegradation of ANT. At 1 mg/L, the positive and negative effects of FA on ANT phototransformation were equivalent. This further confirms that the effect of FA on the photochemical conversion of ANT is related to the concentration of FA.
The addition of FA promoted the formation of ClANTs (Figure 5b–d). LFP was utilized to detect ANT saline ice added to 10 mg/L FA to explore the impact of FA on the steady-state concentration and lifetime of 3ANT*. The experimental results are presented in Figure 3 and Figure S9. The addition of FA promoted the formation of 3ANT*, and the lifetime of 3ANT* in FA saline ice (133.2 ns) was shortened by half compared with that in saline ice (260.4 ns) [58]. The triplet state of DOM promotes the reaction of free chlorine to form ·Cl, according to Kong et al. [59]. Therefore, it is reasonable to speculate that FA can absorb photons to be excited and generate ROS. The ROS can react with Cl− to generate ·Cl [60,61], thus promoting the formation of ClANTs. The promotion of ClANT production varies with different concentrations of FA. When [FA] ≤ 10 mg/L, the production of ClANTs increased with the increase in FA concentration. However, when the concentration of FA was added up to 20 mg/L, the production of ClANTs decreased sharply compared with that of 10 mg/L FA. This phenomenon indicates that the effects of FA on the ANT photochemical reaction are complex. When the concentration of FA is large enough, the inhibitory effects such as the light shielding effect and competition effect are dominant.
3.8. ANT Phototransformation Products
A total of six transformation intermediates were identified by GC-MS, as detailed in the Supplementary Materials (Figures S11 and S12). Full scan mode and selected ion monitoring (SIM) mode were used to analyze the samples after 0, 10, and 20 min of light irradiation. In full scan GC-MS spectrometry, the peak of ANT was detected at a retention time of 10.11 min, identified by the mass-to-charge ratios (m/z) of 178. Following 10 min of exposure, two new peaks appeared at retention times of 11.25 and 11.38 min, which were identified based on a comparison of their respective m/z of 194, 165, and 195 for 9-anthracenone and 152, 180, and 208 for 9,10-anthraquinone, respectively. It was discovered that ANT and its active species undergo an additive reaction with ROS to generate anthracenone. Subsequently, anthracenone further reacts with ROS to form anthraquinone. In SIM mode, the peak at a retention time of 10.65 min was identified to be 9-ClANT based on the m/z of 176, 212, and 214, the peak at a retention time of 13.67 min was identified to be 2-ClANT based on the m/z of 176, 212, and 214, and the peak at 15.61 min was identified to be 9,10-Cl2ANT based on the m/z of 176, 246, and 248. After 20 min of illumination, a new peak appeared at 7.75 min and was identified as 3-methoxy-3-phenylpropyl chloride (m/z 121, 185), which could potentially be the product of the further phototransformation of ClANTs.
4. Conclusions
This study investigated the photochemical transformation of ANT in saline ice. A pathway for the generation of ClANTs via the combination of 3ANT* and ·Cl in saline ice has been established. The total generation of ClANTs showed a decreasing and then increasing trend with increasing NaCl concentration. This trend correlates with the ice crystal structure and the production of ·Cl, 3ANT*. Furthermore, as the temperature rises, ClANT production declines due to the shortened lifetime of 3ANT*. The promotional effect of FA on raising the steady-state concentration of 3ANT* and accelerating its transformation outweighs the inhibitory impact of optical shielding, thus promoting the production of ClANTs.
The photochemical behaviors of PAHs are universal in the natural environment. In saline ice where Cl− is present, PAHs have been confirmed to transform to ClPAHs under the irradiation of sunlight. Given that ClPAHs are more toxic than their precursors, the formation mechanism of ClPAHs in saline ice and the factors influencing their formation deserve more in-depth research. Conditions in natural saline ice are complex and variable. This study confirms that regions with lower temperature, higher salinity, and an augmented quantity of DOM are more likely to generate ClPAHs, potentially heightening the negative impacts on the region’s ecological environment.
Supplementary Materials
The following supporting information can be downloaded at: https://www.mdpi.com/article/10.3390/w16091237/s1, Text S1. QA/QC for ClANTs. Text S2. Materials and reagents. Text S3. Methods of analysis. Table S1. The photodegradation rate constant (k) of ANT in saline ice at different NaCl concentrations. Table S2. Photodegradation rate of ANT and production of ClANTs under different exposure times. Figure S1. Schematic diagram of a homemade temperature-adjustable reaction chamber. Figure S2. UV-Vis absorption spectra of ANT and FA. Figure S3. Raman micrographs of ANT in (a) water ice, (b) saline ice, and (c) FA saline ice. Figure S4. Raman spectra of ANT in water ice (blue line), saline ice (red line), and FA saline ice (blank line). Figure S5. The formation of total ClANTs at varying concentrations of NaCl after illumination. Figure S6. Phototransformation kinetics of (a) ANT and its chlorinated products (b) 2-ClANT, (c) 9-ClANT, and (d) 9, 10-Cl2ANT at varying light intensities. Figure S7. Fluorescence spectra of reactive ice samples with the addition of DPBF as a function of time of exposure to Xe lamps. Figure S8. EPR spectra of the adducts formed between the spin-trapping agents (a) TEMP and (b) DMPO in irradiated saline ice samples. Figure S9. Transient lifetimes of 3ANT* in (a) saline ice, (b) normal temperature saline solution, (c) water ice, and (d) FA saline ice. Figure S10. Laser flash photolysis images of ANT saline ice with added NaSCN. The excitation spectrum is 355 nm. Figure S11. The total ion flow diagram of GC-MS after 30 min of illumination. Figure S12. MS spectra of the degradation intermediates of ANT by GC-MS analysis.
Author Contributions
Conceptualization, X.H.; Methodology, Y.L. and X.H.; Validation, Y.L. and X.H.; Formal analysis, X.H.; Investigation, Y.L., X.H., H.X., B.C. and Y.B.; Writing—original draft, Y.L.; Writing—review & editing, Y.L. and X.H.; Supervision, X.H.; Funding acquisition, X.H. All authors have read and agreed to the published version of the manuscript.
Funding
This work was financially supported by the National Natural Science Foundation of China (No. 22176120, 22376132).
Data Availability Statement
Data are contained within the article and Supplementary Materials.
Conflicts of Interest
The authors declare no conflict of interest.
References
- Lu, J.; Li, M.; Tan, J.; He, M.; Wu, H.; Kang, Y.; Hu, Z.; Zhang, J.; Guo, Z. Distribution, sources, ecological risk and microbial response of polycyclic aromatic hydrocarbons in Qingdao bays, China. Environ. Pollut. 2023, 338, 122687. [Google Scholar] [CrossRef] [PubMed]
- Chen, D.; Feng, Q.; Liang, H.; Gao, B.; Alam, E. Distribution characteristics and ecological risk assessment of polycyclic aromatic hydrocarbons (PAHs) in underground coal mining environment of Xuzhou. Hum. Ecol. Risk Assess. 2019, 25, 1564–1578. [Google Scholar] [CrossRef]
- Ma, B.; Chen, H.; He, Y.; Wang, H.; Xu, J. Evaluation of toxicity risk of polycyclic aromatic hydrocarbons (PAHs) in crops rhizosphere of contaminated field with sequential extraction. J. Soils Sediments 2010, 10, 955–963. [Google Scholar] [CrossRef]
- Yao, Y.; Meng, X.; Wu, C.; Bao, L.; Wang, F.; Wu, F.-C.; Zeng, E.Y. Tracking human footprints in Antarctica through passive sampling of polycyclic aromatic hydrocarbons in inland lakes. Environ. Pollut. 2016, 213, 412–419. [Google Scholar] [CrossRef]
- Yadav, D.K.; Kumar, A.R.; Jayaraman, S.; Lenka, S.; Gurjar, S.; Sarkar, A.; Saha, J.K.; Patra, A.K. Polycyclic aromatic hydrocarbons in diverse agricultural soils of central India: Occurrence, sources, and potential risks. Int. J. Environ. Anal. Chem. 2022, 102, 1–15. [Google Scholar] [CrossRef]
- Zhang, Q.; Meng, J.; Su, G.; Liu, Z.; Shi, B.; Wang, T. Source apportionment and risk assessment for polycyclic aromatic hydrocarbons in soils at a typical coking plant. Ecotoxicol. Environ. Saf. 2021, 222, 112509. [Google Scholar] [CrossRef]
- Qi, A.; Wang, P.; Lv, J.; Zhao, T.; Huang, Q.; Wang, Y.; Zhang, X.; Wang, M.; Xiao, Y.; Yang, L.; et al. Distributions of PAHs, NPAHs, OPAHs, BrPAHs, and ClPAHs in air, bulk deposition, soil, and water in the Shandong Peninsula, China: Urban-rural gradient, interface exchange, and long-range transport. Ecotoxicol. Environ. Saf. 2023, 265, 115494. [Google Scholar] [CrossRef]
- Chongtai, C.; Tian, L.; Xu, S.; Zilan, W.; Jianhui, T. Spatiotemporal distribution and particle-water partitioning of polycyclic aromatic hydrocarbons in Bohai Sea, China. Water Res. 2023, 244, 120440. [Google Scholar]
- Casal, P.; Cabrerizo, A.; Vila-Costa, M.; Pizarro, M.; Jiménez, B.; Dachs, J. Pivotal role of snow deposition and melting driving fluxes of polycyclic aromatic hydrocarbons at Coastal Livingston Island (Antarctica). Environ. Sci. Technol. 2018, 52, 12327–12337. [Google Scholar] [CrossRef]
- Liu, M.; Cai, M.; Duan, M.; Chen, M.; Lohmann, R.; Lin, Y.; Liang, J.; Ke, H.; Zhang, K. PAHs in the North Atlantic Ocean and the Arctic Ocean: Spatial distribution and water mass transport. J. Geophys. Res. Oceans 2022, 127, e2021JC018389. [Google Scholar] [CrossRef]
- Iriarte, J.; Dachs, J.; Casas, G.; Martínez-Varela, A.; Berrojalbiz, N.; Vila-Costa, M. Snow-dependent biogeochemical cycling of polycyclic aromatic hydrocarbons at coastal Antarctica. Environ. Sci. Technol. 2023, 57, 1625–1636. [Google Scholar] [CrossRef]
- Sanches, S.; Leitão, C.; Penetra, A.; Cardoso, V.V.; Ferreira, E.; Benoliel, M.J.; Crespo, M.T.B.; Pereira, V.J. Direct photolysis of polycyclic aromatic hydrocarbons in drinking water sources. J. Hazard. Mater. 2011, 192, 1458–1465. [Google Scholar] [CrossRef] [PubMed]
- Sankoda, K.; Kuribayashi, T.; Nomiyama, K.; Shinohara, R. Occurrence and source of chlorinated polycyclic aromatic hydrocarbons (Cl-PAHs) in tidal flats of the Ariake Bay, Japan. Environ. Sci. Technol. 2013, 47, 7037–7044. [Google Scholar] [CrossRef] [PubMed]
- Sankoda, K.; Nomiyama, K.; Kuribayashi, T.; Shinohara, R. Halogenation of polycyclic aromatic hydrocarbons by photochemical reaction under simulated tidal flat conditions. Polycycl. Aromat. Compd. 2013, 33, 236–253. [Google Scholar] [CrossRef]
- Huang, C.; Xu, X.; Wang, D.; Ma, M.; Rao, K.; Wang, Z. The aryl hydrocarbon receptor (AhR) activity and DNA-damaging effects of chlorinated polycyclic aromatic hydrocarbons (Cl-PAHs). Chemosphere 2018, 211, 640–647. [Google Scholar] [CrossRef] [PubMed]
- Nishimura, C.; Horii, Y.; Tanaka, S.; Asante, K.A.; Ballesteros, F.; Viet, P.H.; Itai, T.; Takigami, H.; Tanabe, S.; Fujimori, T. Occurrence, profiles, and toxic equivalents of chlorinated and brominated polycyclic aromatic hydrocarbons in E-waste open burning soils. Environ. Pollut. 2017, 225, 252–260. [Google Scholar] [CrossRef]
- Xinyan, L.; Mei, M.; Bilin, Z.; Na, L.; Ling, F.; Donghong, W.; Tiangang, L. Chlorinated polycyclic aromatic hydrocarbons induce immunosuppression in THP-1 macrophages characterized by disrupted amino acid metabolism. Environ. Sci. Technol. 2022, 56, 16012–16023. [Google Scholar]
- Xu, X.; Xiao, R.; Dionysiou, D.D.; Spinney, R.; Fu, T.; Li, Q.; Wang, Z.; Wang, D.; Wei, Z. Kinetics and mechanisms of the formation of chlorinated and oxygenated polycyclic aromatic hydrocarbons during chlorination. Chem. Eng. J. 2018, 351, 248–257. [Google Scholar] [CrossRef]
- Wang, Y.; Su, P.; Ge, X.; Ren, H.; Ma, S.; Shen, G.; Chen, Q.; Yu, Y.; An, T. Identification of specific halogenated polycyclic aromatic hydrocarbons in surface soils of petrochemical, flame retardant, and electronic waste dismantling industrial parks. J. Hazard. Mater. 2022, 436, 129160. [Google Scholar] [CrossRef] [PubMed]
- Yang, Y.; Liu, G.; Zheng, M.; Liu, S.; Yang, Q.; Liu, X.; Wang, M.; Yang, L. Discovery of significant atmospheric emission of halogenated polycyclic aromatic hydrocarbons from secondary zinc smelting. Ecotoxicol. Environ. Saf. 2022, 238, 113594. [Google Scholar] [CrossRef]
- Jin, R.; Bu, D.; Liu, G.; Zheng, M.; Lammel, G.; Fu, J.; Yang, L.; Li, C.; Habib, A.; Yang, Y.; et al. New classes of organic pollutants in the remote continental environment—Chlorinated and brominated polycyclic aromatic hydrocarbons on the Tibetan Plateau. Environ. Int. 2020, 137, 105574. [Google Scholar] [CrossRef] [PubMed]
- Vuong, Q.T.; Thang, P.Q.; Ohura, T.; Choi, S.-D. Chlorinated and brominated polycyclic aromatic hydrocarbons in ambient air: Seasonal variation, profiles, potential sources, and size distribution. Rev. Environ. Sci. Biotechnol. 2020, 19, 259–273. [Google Scholar] [CrossRef]
- Grossman, J.N.; Stern, A.P.; Kirich, M.L.; Kahan, T.F. Anthracene and pyrene photolysis kinetics in aqueous, organic, and mixed aqueous-organic phases. Atmos. Environ. 2016, 128, 158–164. [Google Scholar] [CrossRef]
- Yang, M.; Zhang, H.; Chang, F.; Hu, X. Self-sensitized photochlorination of benzo[a]pyrene in saline water under simulated solar light irradiation. J. Hazard. Mater. 2020, 408, 124445. [Google Scholar] [CrossRef] [PubMed]
- Wu, N.; Xiang, W.; Zhu, F.; Huo, Z.; Wang, Z.; Qu, R. Oxidative degradation and possible interactions of coexisting decabromodiphenyl ether (BDE-209) on polystyrene microplastics in UV/chlorine process. Water Res. 2023, 245, 120560. [Google Scholar] [CrossRef]
- Pouch, A.; Zaborska, A.; Mazurkiewicz, M.; Winogradow, A.; Pazdro, K. PCBs, HCB and PAHs in the seawater of Arctic fjords—Distribution, sources and risk assessment. Mar. Pollut. Bull. 2021, 164, 111980. [Google Scholar] [CrossRef] [PubMed]
- Malley, P.P.A.; Kahan, T.F. Nonchromophoric organic matter suppresses polycyclic aromatic hydrocarbon photolysis in ice and at ice surfaces. J. Phys. Chem. A 2014, 118, 1638–1643. [Google Scholar] [CrossRef] [PubMed]
- Dubowski, Y.; Hoffmann, M.R. Photochemical transformations in ice: Implications for the fate of chemical species. Geophys. Res. Lett. 2000, 27, 3321–3324. [Google Scholar] [CrossRef]
- Ram, K.; Anastasio, C. Photochemistry of phenanthrene, pyrene, and fluoranthene in ice and snow. Atmos. Environ. 2009, 43, 2252–2259. [Google Scholar] [CrossRef]
- Vetráková, Ľ.; Neděla, V.; Runštuk, J.; Heger, D. The morphology of ice and liquid brine in an environmental scanning electron microscope: A study of the freezing methods. Cryosphere 2019, 13, 2385–2405. [Google Scholar] [CrossRef]
- Noble, J.A.; Michoulier, E.; Aupetit, C.; Mascetti, J. Influence of ice structure on the soft UV photochemistry of PAHs embedded in solid water. Astron. Astrophys. 2020, 644, A22. [Google Scholar] [CrossRef]
- Chakraborty, S.; Kahan, T.F. Physical characterization of frozen aqueous solutions containing sodium chloride and humic acid at environmentally relevant temperatures. ACS Earth Space Chem. 2020, 4, 305–310. [Google Scholar] [CrossRef]
- Zhengnan, T.; Yumeng, Q.; Xiaosheng, T.; Zunyao, W.; Ruijuan, Q. Photochemical transformation of anthracene (ANT) in surface soil: Chlorination and hydroxylation. J. Hazard. Mater. 2023, 452, 131252. [Google Scholar]
- Kahan, T.F.; Donaldson, D.J. Photolysis of polycyclic aromatic hydrocarbons on water and ice surfaces. J. Phys. Chem. A 2007, 111, 1277–1285. [Google Scholar] [CrossRef]
- Xue, S.; Sun, J.; Liu, Y.; Zhang, Z.; Lin, Y.; Liu, Q. Effect of dissolved organic matter fractions on photodegradation of phenanthrene in ice. J. Hazard. Mater. 2019, 361, 30–36. [Google Scholar] [CrossRef] [PubMed]
- Wang, X.; Wang, S.; Qu, R.; Ge, J.; Wang, Z.; Gu, C. Enhanced Removal of Chlorophene and 17β-estradiol by Mn(III) in a Mixture Solution with Humic Acid: Investigation of Reaction Kinetics and Formation of Co-oligomerization Products. Environ. Sci. Technol. 2018, 52, 13222–13230. [Google Scholar] [CrossRef]
- Blaha, K. Effects of Sodium Chloride on Anthracene Photolysis Kinetics in Aqueous-Organic Solutions. Ph.D. Thesis, Syracuse University, Syracuse, NY, USA, 2017. [Google Scholar]
- Zhao, S.; Xue, S.; Zhang, J.; Zhang, Z.; Sun, J. Dissolved organic matter-mediated photodegradation of anthracene and pyrene in water. Sci. Rep. 2020, 10, 3413. [Google Scholar] [CrossRef] [PubMed]
- Rubio-Clemente, A.; Chica, E.; Peñuela, G.A. Photolysis of a mixture of anthracene and benzo[a]pyrene at ultra-trace levels in natural water with disinfection purposes. JEnvS 2020, 92, 79–94. [Google Scholar] [CrossRef]
- Sun, Z.; Wang, X.; Liu, C.; Fang, G.; Chu, L.; Gu, C.; Gao, J. Persistent free radicals from low-molecular-weight organic compounds enhance cross-coupling reactions and toxicity of anthracene on amorphous silica surfaces under light. Environ. Sci. Technol. 2021, 55, 3716–3726. [Google Scholar] [CrossRef]
- Zijin, L.; Xianbo, S.; Jie, F.; Wen, L.; Zhengqing, C. Elevated nitrate promoted photodegradation of PAHs in aqueous phase: Implications for the increased nutrient discharge. J. Hazard. Mater. 2023, 443, 130143. [Google Scholar]
- Jialu, F.; Xianbo, S.; Yongdi, L.; Dongye, Z.; Xiaodi, H.; Wen, L.; Zhengqing, C. New insight into environmental photochemistry of PAHs induced by dissolved organic matters: A model of naphthalene in seawater. Process. Saf. Environ. Prot. 2022, 161, 325–333. [Google Scholar]
- Grossman, J.N.; Kowal, S.F.; Stubbs, A.D.; Cawley, C.N.; Kahan, T.F. Anthracene and pyrene photooxidation kinetics in saltwater environments. ACS Earth Space Chem. 2019, 3, 2695–2703. [Google Scholar] [CrossRef]
- Sobron, P.; Wang, A. Low-temperature raman spectroscopy of materials relevant for planetary. Proc. Lunar. Planet. Sci. 2011, 42, 1580. [Google Scholar]
- Jin, R.; Zheng, M.; Lammel, G.; Bandowe, B.A.M.; Liu, G. Chlorinated and brominated polycyclic aromatic hydrocarbons: Sources, formation mechanisms, and occurrence in the environment. Prog. Energy Combust. Sci. 2020, 76, 100803. [Google Scholar] [CrossRef]
- Glover, C.M.; Rosario-Ortiz, F.L. Impact of halides on the photoproduction of reactive intermediates from organic matter. Environ. Sci. Technol. 2013, 47, 13949–13956. [Google Scholar] [CrossRef] [PubMed]
- Ohyashiki, T.; Nunomura, M.; Katoh, T. Detection of superoxide anion radical in phospholipid liposomal. Biochim. Biophys. Acta. Biomembr. 1999, 1421, 131–139. [Google Scholar] [CrossRef] [PubMed]
- Kremer, M.J.; Connery, K.A.; DiPippo, M.M.; Feng, J.; Chateauneuf, J.E.; Brennecke, J.F. Laser flash photolysis investigation of the triplet-triplet annihilation of anthracene in supercritical water. J. Phys. Chem. A 1999, 103, 6591–6598. [Google Scholar] [CrossRef]
- Lei, Y.; Yu, Y.; Lei, X.; Liang, X.; Cheng, S.; Ouyang, G.; Yang, X. Assessing the use of probes and quenchers for understanding the reactive species in advanced oxidation processes. Environ. Sci. Technol. 2023, 57, 5433–5444. [Google Scholar] [CrossRef] [PubMed]
- Hullar, T.; Magadia, D.; Anastasio, C. Photodegradation rate constants for anthracene and pyrene are similar in/on ice and in aqueous solution. Environ. Sci. Technol. 2018, 52, 12225–12234. [Google Scholar] [CrossRef]
- Bünau, G.V.; Weber, S.; Wolff, T. Time and temperature dependence of anthracene triplet yields in frozen aqueous micellar solutions: An electron paramagnetic resonance study. J. Photochem. Photobiol. A Chem. 1994, 80, 363–368. [Google Scholar] [CrossRef]
- Greiner, G. The unusual temperature dependence of the fluorescence intensity and lifetime of anthracene in ethanol. J. Photochem. Photobiol. A Chem. 2000, 137, 1–7. [Google Scholar] [CrossRef]
- Matson, P.G.; Martz, T.R.; Hofmann, G.E. High-frequency observations of pH under Antarctic sea ice in the southern Ross Sea. Antarct. Sci. 2011, 23, 607–613. [Google Scholar] [CrossRef]
- Cummings, V.J.; Barr, N.G.; Budd, R.G.; Marriott, P.M.; Safi, K.A.; Lohrer, A.M. In situ response of Antarctic under-ice primary producers to experimentally altered pH. Sci. Rep. 2019, 9, 6069. [Google Scholar] [CrossRef] [PubMed]
- Shaban, Y.A. Solar light-induced photodegradation of chrysene in seawater in the presence of carbon-modified n-TiO2 nanoparticles. Arab. J. Chem. 2019, 12, 652–663. [Google Scholar] [CrossRef]
- Pawar, R.M. The Effect of Soil pH on Degradation of Polycyclic Aromatic Hydrocarbons (PAHs). Ph.D. Thesis, University of Hertfordshire, Hatfield, UK, 2012. [Google Scholar]
- Ohura, T.; Miwa, M. Photochlorination of polycyclic aromatic hydrocarbons in acidic brine solution. Bull. Environ. Contam. Toxicol. 2016, 96, 524–529. [Google Scholar] [CrossRef] [PubMed]
- Jiang, C.; Xue, S.; Zhao, S.; Sun, J.; Zhang, Z. Indirect photodegradation of anthracene and pyrene induced by dissolved organic matter derived reactive species in ice. J. Environ. Chem. Eng. 2023, 11, 111086. [Google Scholar] [CrossRef]
- Kong, Q.; Ye, L.; Pan, Y.; Zhou, Y.; Lei, Y.; Zeng, Z.; Chen, S.; Yao, L.; Zhang, X.; Westerhoff, P.; et al. Photochemical transformation of free chlorine induced by triplet state dissolved organic matter. Environ. Sci. Technol. 2023, 57, 10849–10859. [Google Scholar] [CrossRef] [PubMed]
- Ge, L.; Cao, S.; Halsall, C.; Niu, J.; Bai, D.; He, G.; Zhang, P.; Ma, H. Photodegradation of hydroxyfluorenes in ice and water: A comparison of kinetics, effects of water constituents, and phototransformation by-products. JEnvS 2023, 124, 139–145. [Google Scholar] [CrossRef]
- Liu, H.; Zhao, H.; Quan, X.; Zhang, Y.; Chen, S. Formation of chlorinated intermediate from bisphenol a in surface saline water under simulated solar light irradiation. Environ. Sci. Technol. 2009, 43, 7712–7717. [Google Scholar] [CrossRef]
Figure 1.
Phototransformation kinetics of (a) ANT and its chlorinated products (b) 2-ClANT, (c) 9-ClANT, and (d) 9,10-Cl2ANT at varying concentrations of NaCl. Reaction conditions: [ANT]initial = 0.5 mg/L, temperature: −15 °C, pH = 6.
Figure 1.
Phototransformation kinetics of (a) ANT and its chlorinated products (b) 2-ClANT, (c) 9-ClANT, and (d) 9,10-Cl2ANT at varying concentrations of NaCl. Reaction conditions: [ANT]initial = 0.5 mg/L, temperature: −15 °C, pH = 6.

Figure 2.
Effect of the addition of a trapping agent on (a) the phototransformation kinetics of ANT and the formation of its chlorinated products, specifically (b) 2-ClANT, (c) 9-ClANT, and (d) 9,10-Cl2ANT. Reaction conditions: [ANT]initial = 0.5 mg/L, [NaCl] = 0.5 mol/L, temperature: −15 °C.
Figure 2.
Effect of the addition of a trapping agent on (a) the phototransformation kinetics of ANT and the formation of its chlorinated products, specifically (b) 2-ClANT, (c) 9-ClANT, and (d) 9,10-Cl2ANT. Reaction conditions: [ANT]initial = 0.5 mg/L, [NaCl] = 0.5 mol/L, temperature: −15 °C.
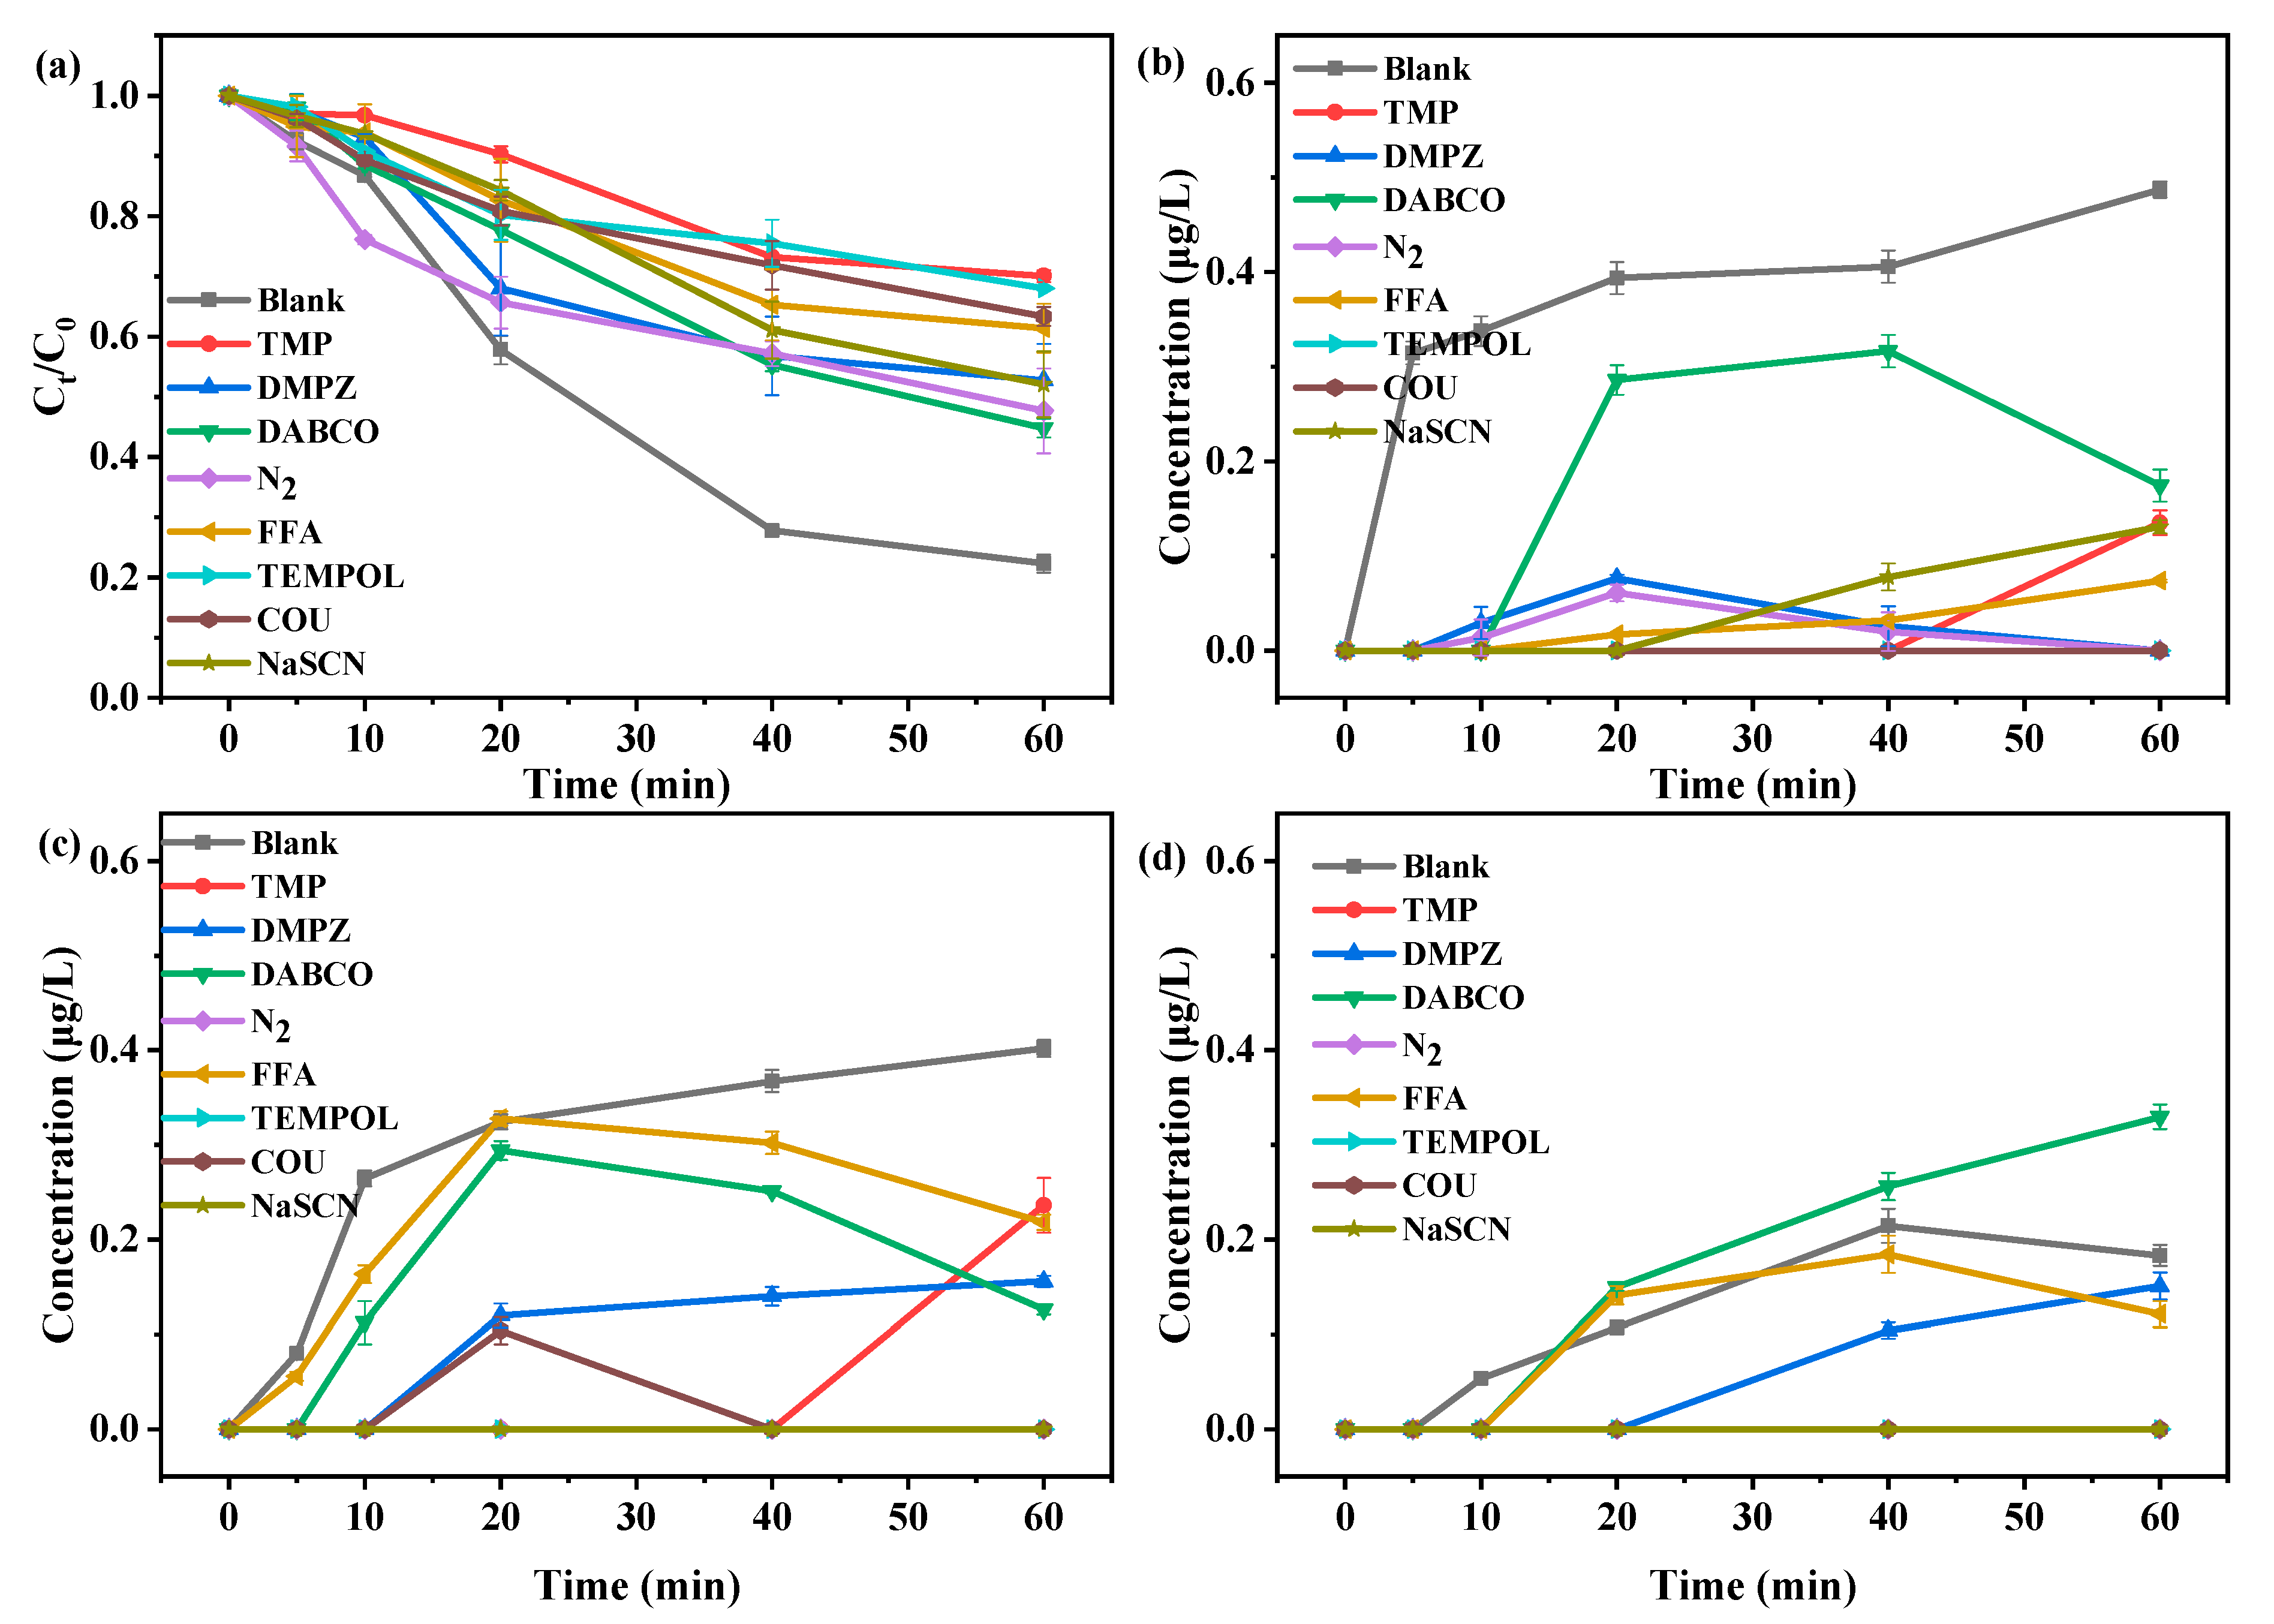
Figure 3.
Laser flash photolysis of ANT in FA saline ice (■), water ice (▼), saline ice (●), normal temperature saline solution (25 °C, ▲), and unoxygenated saline ice (through N2, ◆). Reaction conditions: [ANT] = 5 × 10⁻⁵ mol/L, [NaCl] = 0.5 mol/L.
Figure 3.
Laser flash photolysis of ANT in FA saline ice (■), water ice (▼), saline ice (●), normal temperature saline solution (25 °C, ▲), and unoxygenated saline ice (through N2, ◆). Reaction conditions: [ANT] = 5 × 10⁻⁵ mol/L, [NaCl] = 0.5 mol/L.

Scheme 1.
The pathway for the formation of ClANTs by ANT photochlorination in saline ice.

Figure 4.
(a) Kinetics of the phototransformation of ANT and the generation of its chlorinated products (b) 2-ClANT, (c) 9-ClANT, and (d) 9,10-Cl2ANT at different temperatures. (e) Phototransformation kinetics of ANT and the formation of its chlorinated products (f) 2-ClANT, (g) 9-ClANT, and (h) 9,10-Cl2ANT at different pH. Reaction conditions: [ANT]initial = 0.5 mg/L, [NaCl] = 0.5 mol/L.

Figure 5.
Effect of FA on (a) the phototransformation kinetics of ANT, and the formation of its chlorinated products including (b) 2-ClANT, (c) 9-ClANT, and (d) 9,10-Cl2ANT. Reaction conditions: [ANT]initial = 0.5 mg/L, [NaCl] = 0.5 mol/L, temperature: −15 °C.
Figure 5.
Effect of FA on (a) the phototransformation kinetics of ANT, and the formation of its chlorinated products including (b) 2-ClANT, (c) 9-ClANT, and (d) 9,10-Cl2ANT. Reaction conditions: [ANT]initial = 0.5 mg/L, [NaCl] = 0.5 mol/L, temperature: −15 °C.

Disclaimer/Publisher’s Note: The statements, opinions and data contained in all publications are solely those of the individual author(s) and contributor(s) and not of MDPI and/or the editor(s). MDPI and/or the editor(s) disclaim responsibility for any injury to people or property resulting from any ideas, methods, instructions or products referred to in the content. |
© 2024 by the authors. Licensee MDPI, Basel, Switzerland. This article is an open access article distributed under the terms and conditions of the Creative Commons Attribution (CC BY) license (https://creativecommons.org/licenses/by/4.0/).
Share and Cite
MDPI and ACS Style
Li, Y.; Hu, X.; Xie, H.; Cai, B.; Bai, Y. Photochlorination of Anthracene in Saline Ice under Simulated Solar Light. Water 2024, 16, 1237. https://doi.org/10.3390/w16091237
AMA Style
Li Y, Hu X, Xie H, Cai B, Bai Y. Photochlorination of Anthracene in Saline Ice under Simulated Solar Light. Water. 2024; 16(9):1237. https://doi.org/10.3390/w16091237
Chicago/Turabian StyleLi, Yujie, Xuefeng Hu, Hao Xie, Beichuan Cai, and Yaxing Bai. 2024. "Photochlorination of Anthracene in Saline Ice under Simulated Solar Light" Water 16, no. 9: 1237. https://doi.org/10.3390/w16091237
Note that from the first issue of 2016, this journal uses article numbers instead of page numbers. See further details here.