

Novel Oxidation Strategies for the In Situ Remediation of Chlorinated Solvents from Groundwater—A Bench-Scale Study
 , , and
Abstract
:
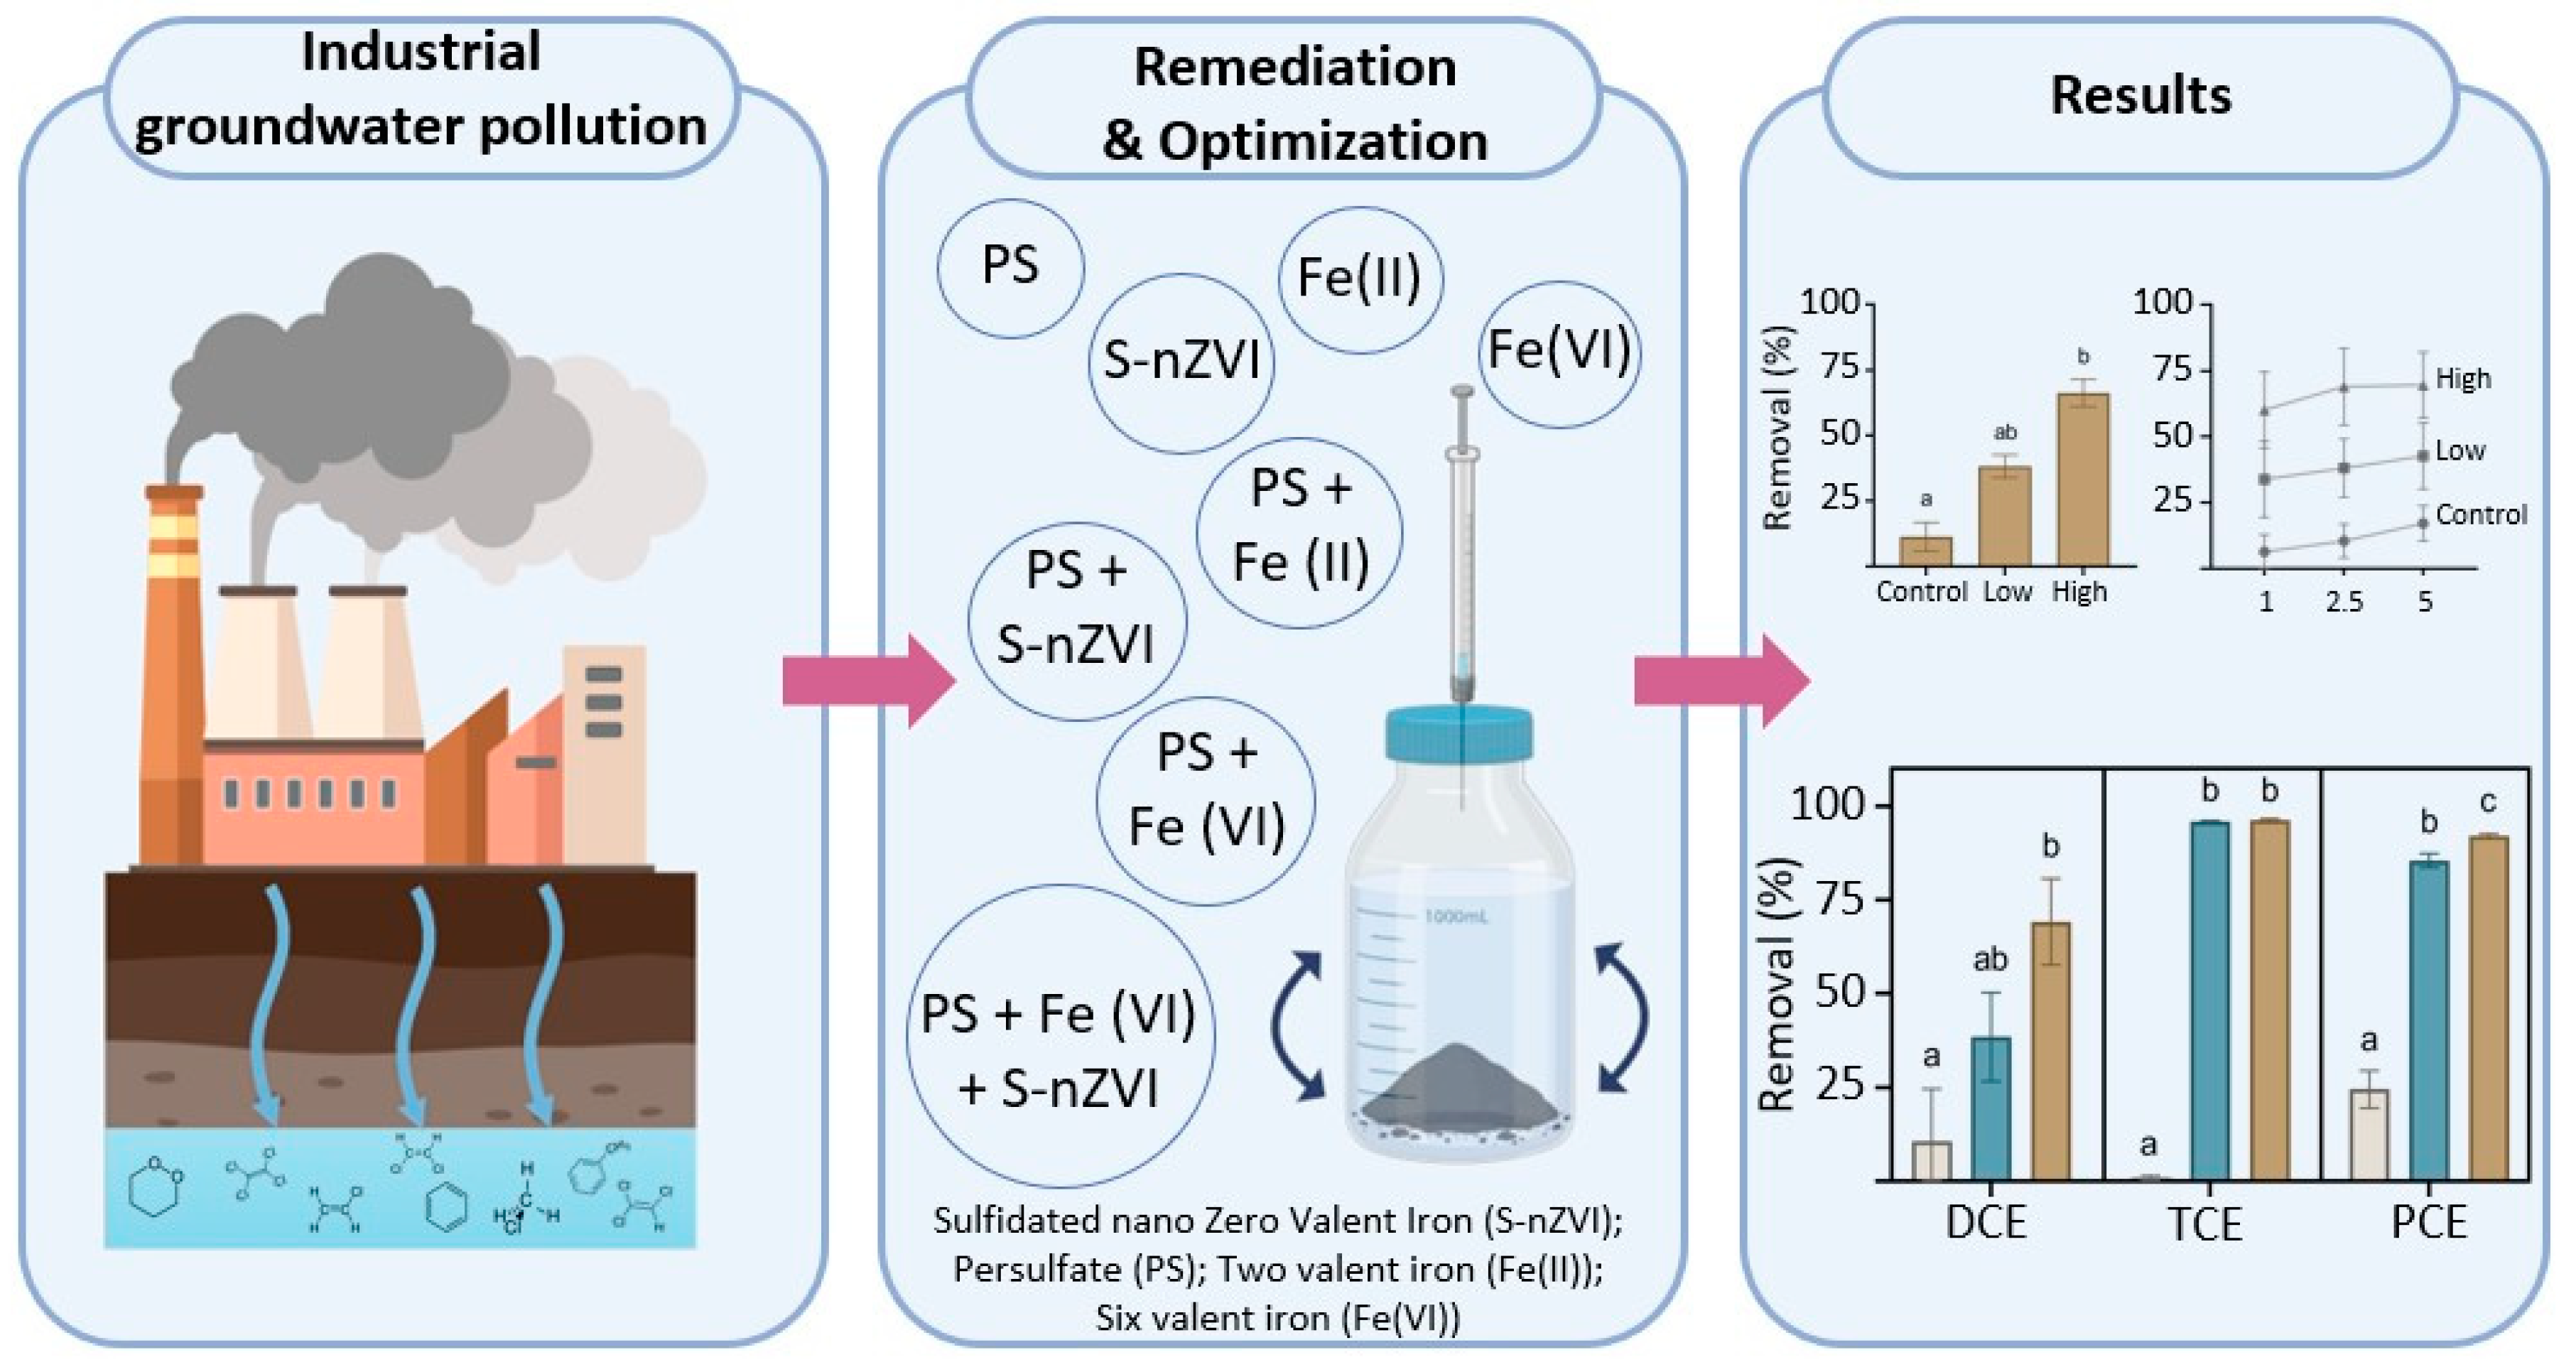
1. Introduction
2. Materials and Methods
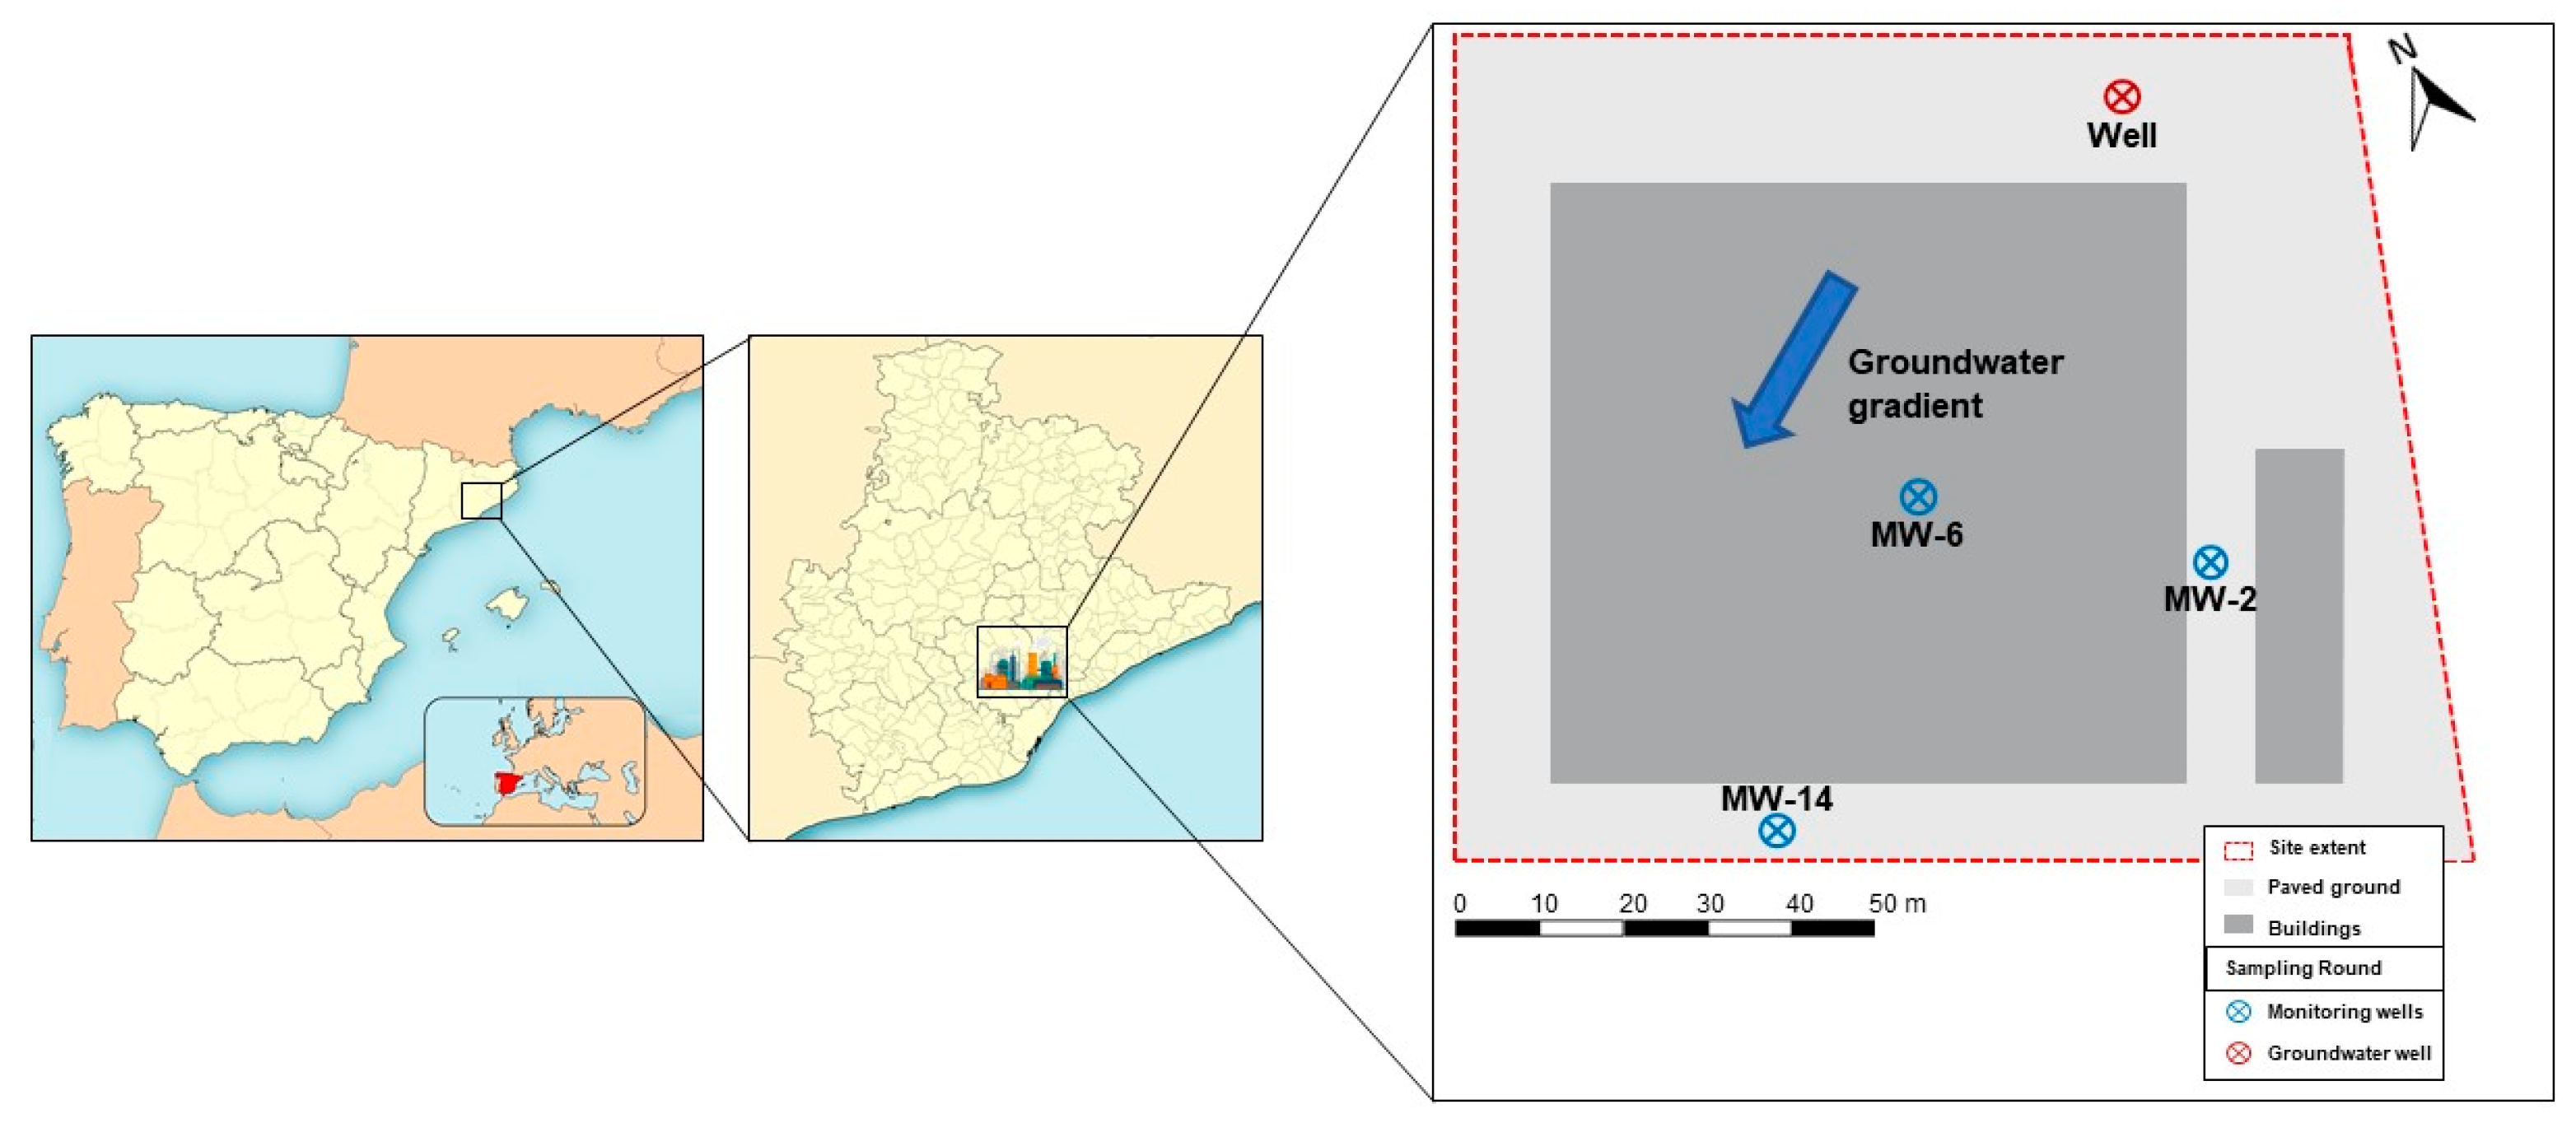
2.1. Site Description and Sampling
2.2. Chemicals and Reagents
2.3. Physico-Chemical Characterization of Besòs Groundwater
2.4. Experimental Design
2.5. Analytical Methodology for the Monitoring of Volatile Organic Compounds in Groundwater
2.6. Analytical Methodology—Quantification of Chlorinated Solvents’ Removal
2.7. Environmental and Human Health Risk Assessments
2.8. Statistical Analysis
3. Results and Discussion
3.1. Groundwater Characterization

| Depth | Temperature | pH | Conductivity | DO | Eh | TOC | TSS | |
|---|---|---|---|---|---|---|---|---|
| m | °C | mS/cm | mg/L | mV | mg/L | mg/L | ||
| Well | 6.21 | 16.8 | 7.40 | 0.42 | 2.38 | 65.9 | <2 | 15 |
| MW-2 | 7.19 | 16.3 | 7.49 | 1.44 | 0.82 | −68.5 | 3 | 979 |
| MW-6 | 7.33 | 17.3 | 5.21 | 57.60 | 1.33 | 69.2 | - | 2336 |
| MW-14 | 7.42 | 19.1 | 5.52 | 11.68 | 5.32 | 158.7 | - | 103 |
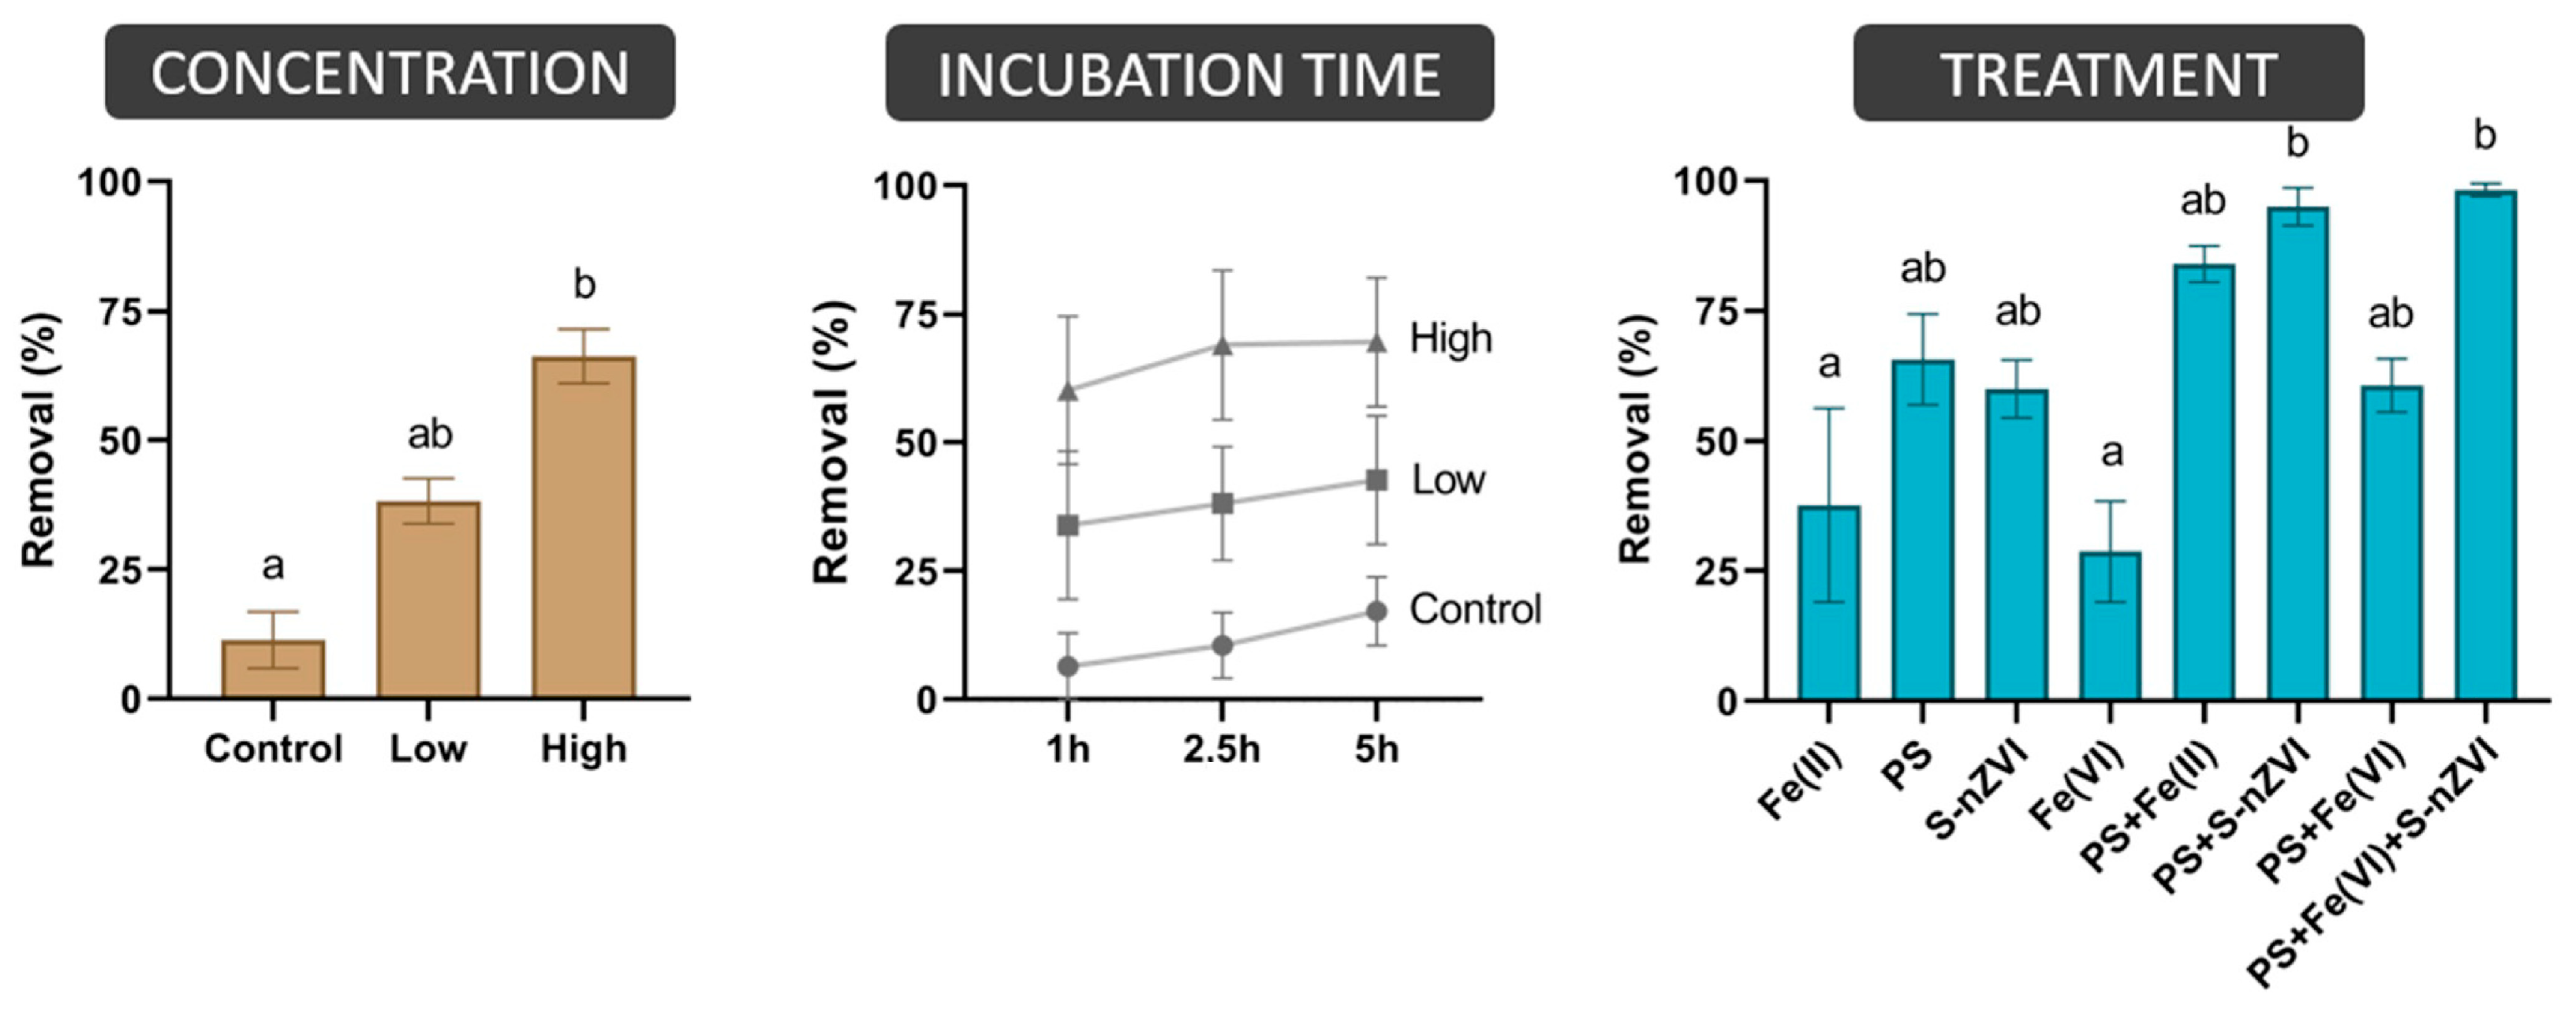
3.2. Remediation of Chlorinated Solvents in Synthetic Groundwater
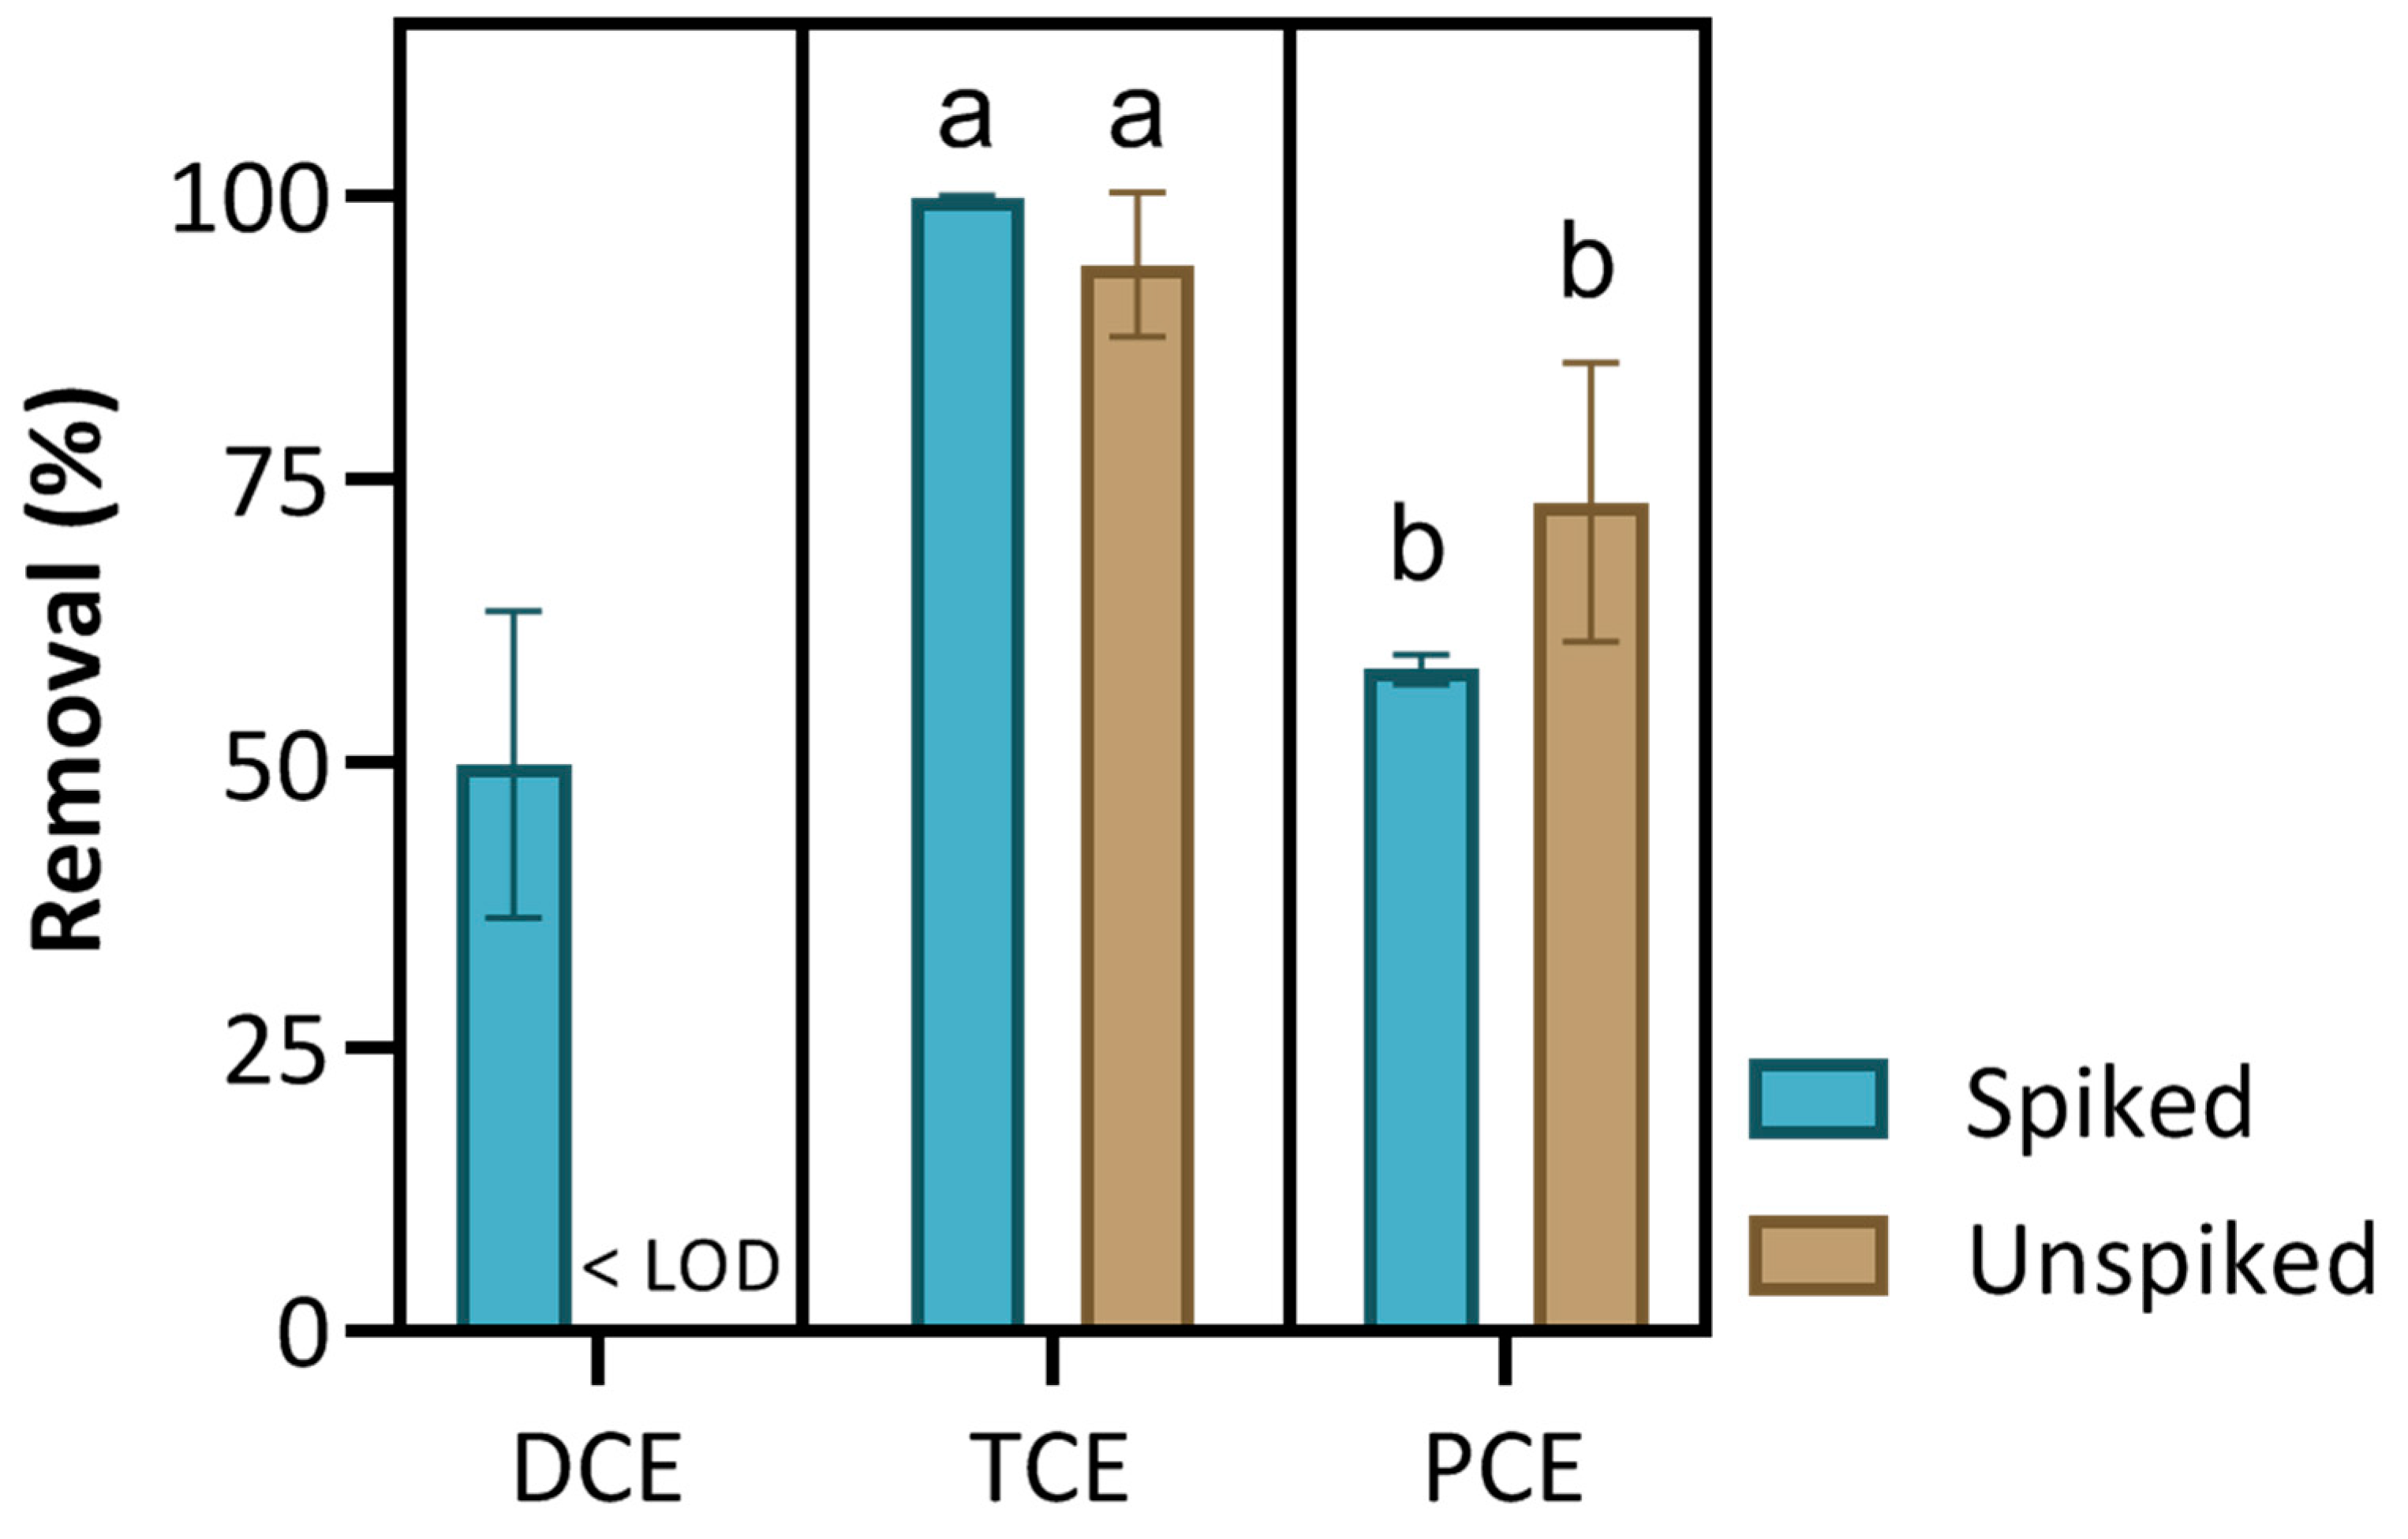
3.3. Remediation of Chlorinated Solvents in Real Groundwater
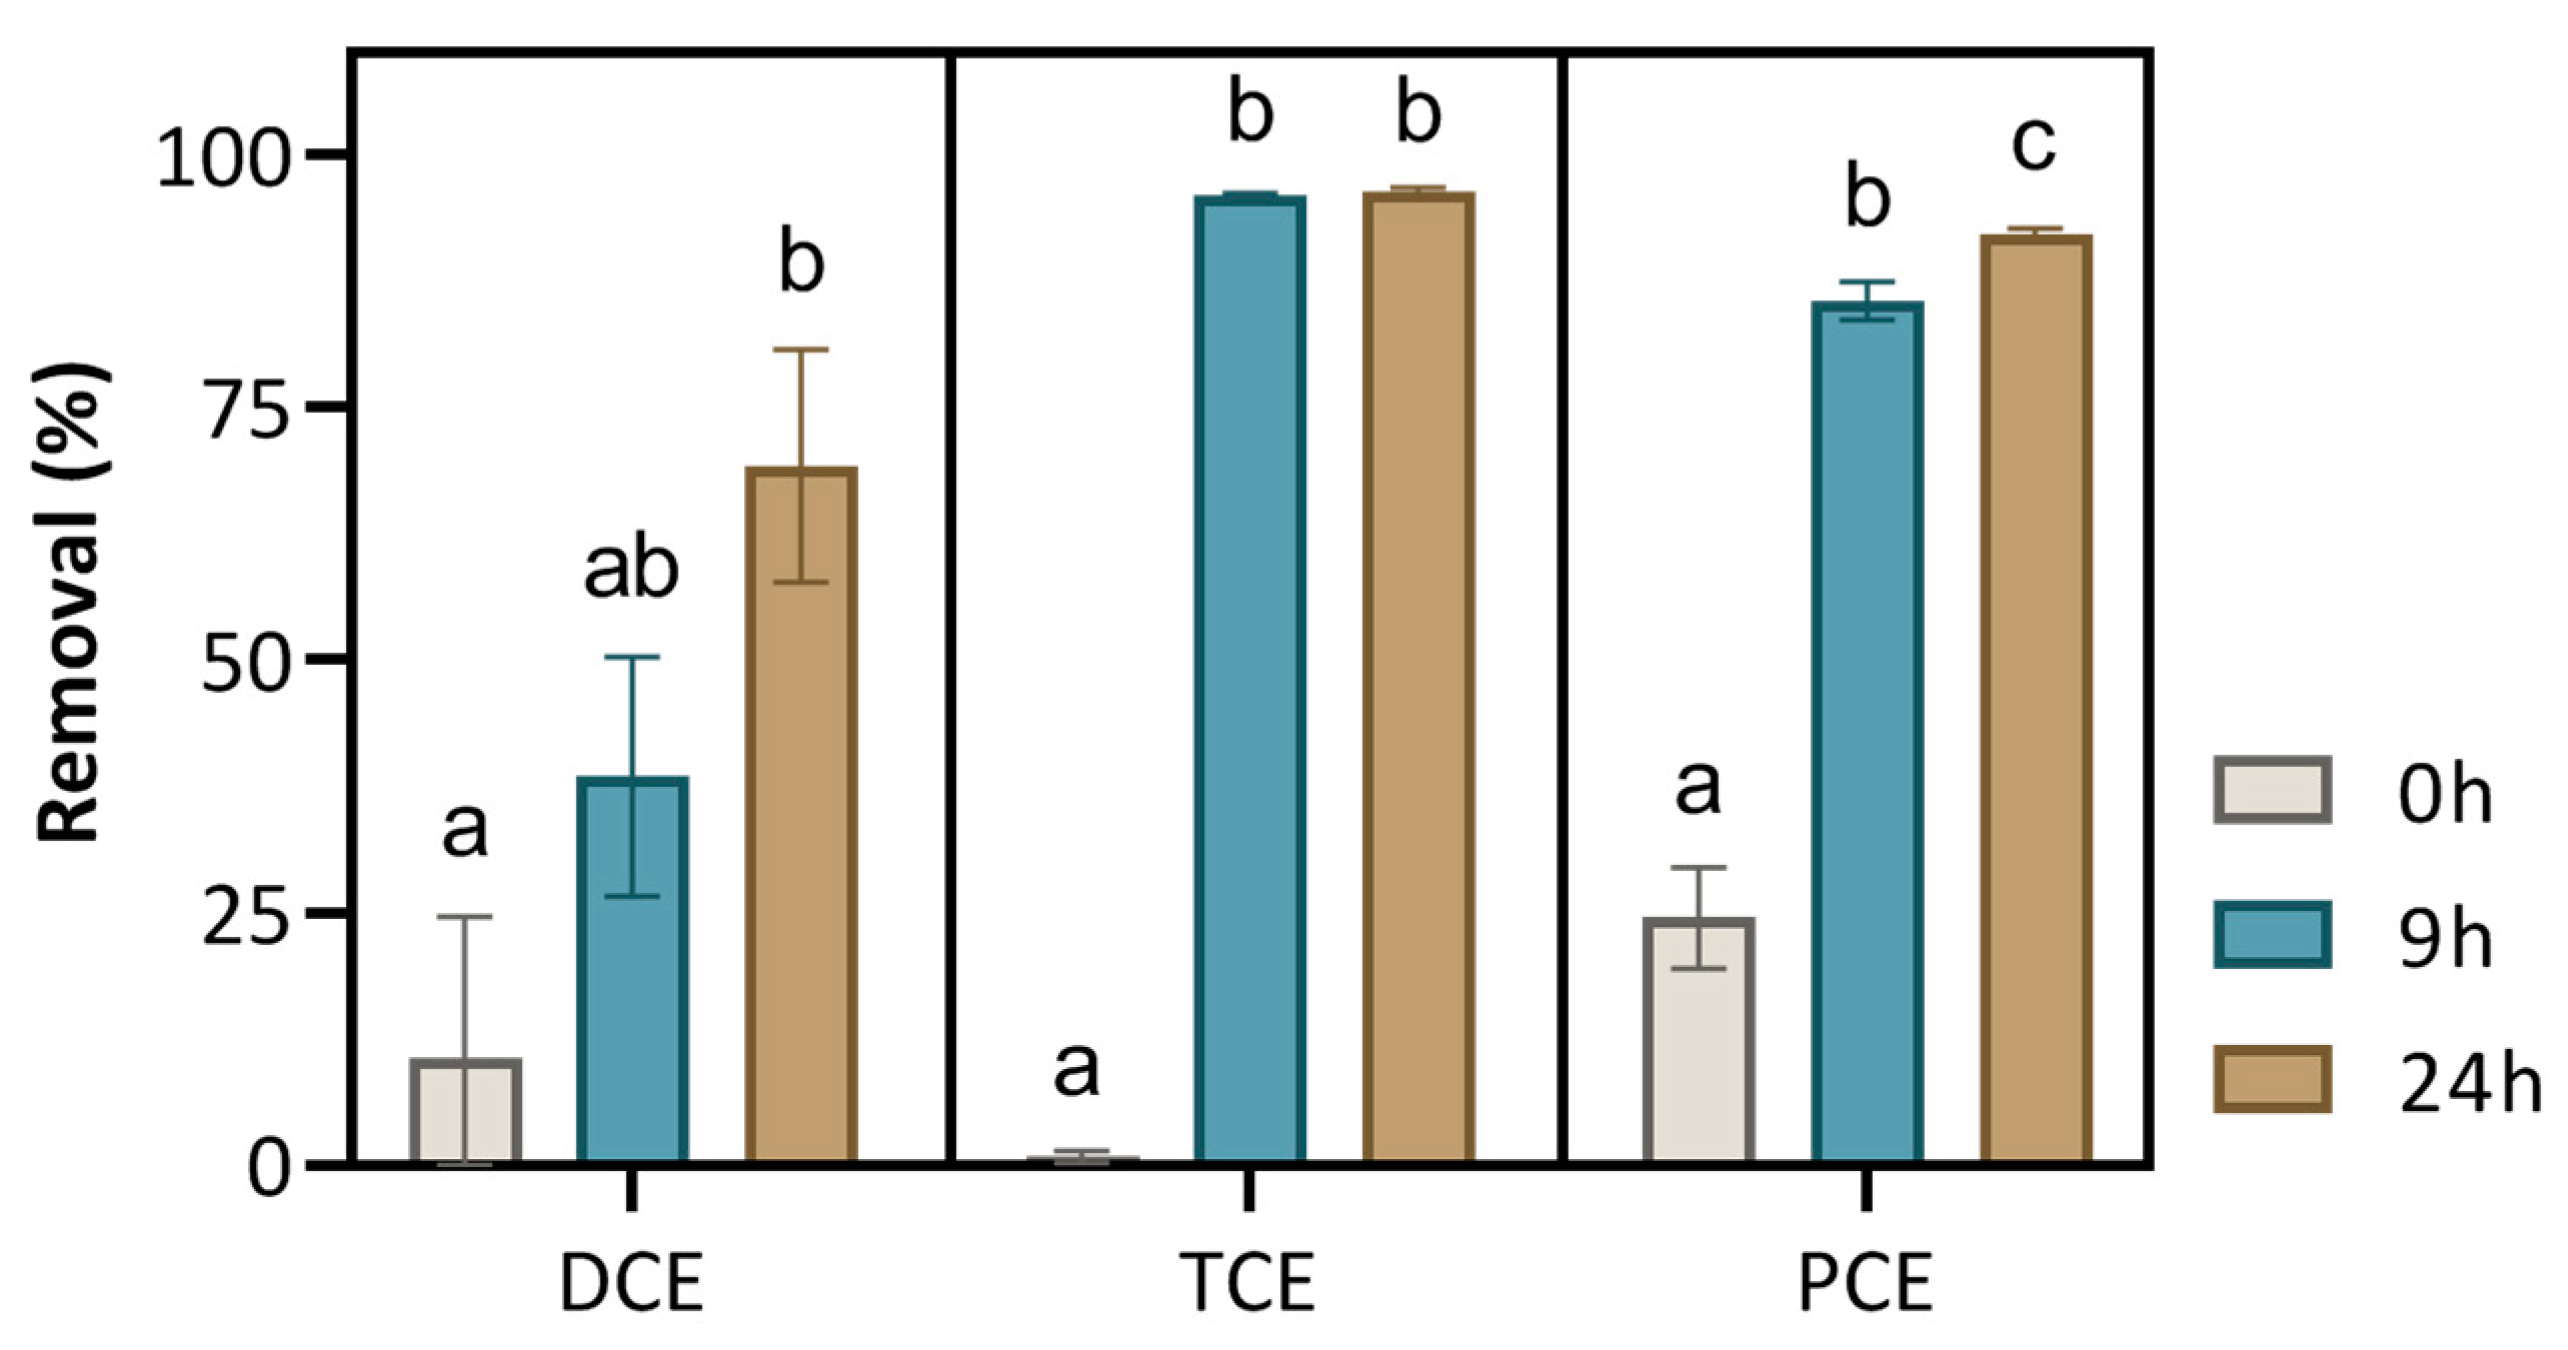
3.4. Effect of Incubation Time on the Remediation of Chlorinated Solvents
3.5. Environmental and Human Health Risk Assessments
3.6. Comparison with Current Available Remediation Solutions and Their Limitations
4. Conclusions
Supplementary Materials
Author Contributions
Funding
Data Availability Statement
Acknowledgments
Conflicts of Interest
References
- Jurado, A.; Vàzquez-Suñé, E.; Carrera, J.; de Alda, M.L.; Pujades, E.; Barceló, D. Emerging organic contaminants in groundwater in Spain: A review of sources, recent occurrence and fate in a European context. Sci. Total Environ. 2012, 440, 82–94. [Google Scholar] [CrossRef]
- Lapworth, D.J.; Baran, N.; Stuart, M.E.; Ward, R.S. Emerging organic contaminants in groundwater: A review of sources, fate and occurrence. Environ. Pollut. 2012, 163, 287–303. [Google Scholar] [CrossRef] [PubMed]
- Lopez, B.; Ollivier, P.; Togola, A.; Baran, N.; Ghestem, J.P. Screening of French groundwater for regulated and emerging contaminants. Sci. Total Environ. 2015, 518–519, 562–573. [Google Scholar] [CrossRef] [PubMed]
- Yu, S.; Lee, P.-K.; Hwang, S.-I. Groundwater contamination with volatile organic compounds in urban and industrial areas: Analysis of co-occurrence and land use effects. Environ. Earth Sci. 2015, 74, 3661–3677. [Google Scholar] [CrossRef]
- Hale, S.E.; Arp, H.P.H.; Schliebner, I.; Neumann, M. Persistent, mobile and toxic (PMT) and very persistent and very mobile (vPvM) substances pose an equivalent level of concern to persistent, bioaccumulative and toxic (PBT) and very persistent and very bioaccumulative (vPvB) substances under REACH. Environ. Sci. Eur. 2020, 32, 155. [Google Scholar] [CrossRef]
- Russell, H.H.; Matthews, J.E.; Sewell, G.W. TCE Removal from Contaminated Soil and Ground Water 1. In Epa Environmental Engineering Sourcebook; CRC Press: Boca Raton, FL, USA, 1992; pp. 87–99. [Google Scholar] [CrossRef]
- Balderacchi, M.; Filippini, M.; Gemitzi, A.; Klöve, B.; Petitta, M.; Trevisan, M.; Wachniew, P.; Witczak, S.; Gargini, A. Does groundwater protection in Europe require new EU-wide environmental quality standards. Front. Chem. 2014, 2, 32. [Google Scholar] [CrossRef]
- Dobosy, P.; Vizsolyi, É.C.; Varga, I.; Varga, J.; Láng, G.G.; Záray, G. Trichloroethylene removal from water by ferrate treatment. Microchem. J. 2016, 127, 74–78. [Google Scholar] [CrossRef]
- Pierri, D. Actual decay of tetrachloroethene (PCE) and trichloroethene (TCE) in a highly contaminated shallow groundwater system. Environ. Adv. 2021, 5, 100090. [Google Scholar] [CrossRef]
- Tobiszewski, M.; Namieśnik, J. Determination of chlorinated solvents in industrial water and wastewater by DAI-GC-ECD. Anal. Bioanal. Chem. 2011, 399, 3565–3572. [Google Scholar] [CrossRef]
- Bundesamt, U. REACH: Improvement of Guidance and Methods for the Identification and Assessment of PMT/vPvM Substances. 2019. Available online: https://www.umweltbundesamt.de/en/publikationen/reach-improvement-of-guidance-methods-for-the (accessed on 8 November 2023).
- Directive 2020/2184 on the Quality of Water Intended for Human Consumption, Official Journal of the European Union L 435/1 (2020). Available online: https://eur-lex.europa.eu/eli/dir/2020/2184/oj (accessed on 25 April 2024).
- Hale, S.E.; Neumann, M.; Schliebner, I.; Schulze, J.; Averbeck, F.S.; Castell-Exner, C.; Collard, M.; Drmač, D.; Hartmann, J.; Hofman-Caris, R.; et al. Getting in control of persistent, mobile and toxic (PMT) and very persistent and very mobile (vPvM) substances to protect water resources: Strategies from diverse perspectives. Environ. Sci. Eur. 2022, 34, 22. [Google Scholar] [CrossRef]
- Li, Q.; Chen, Z.; Wang, H.; Yang, H.; Wen, T.; Wang, S.; Hu, B.; Wang, X. Removal of organic compounds by nanoscale zero-valent iron and its composites. Sci. Total Environ. 2021, 792, 148546. [Google Scholar] [CrossRef] [PubMed]
- Petri, B.G.; Watts, R.J.; Tsitonaki, A.; Crimi, M.; Thomson, N.R.; Teel, A.L. Fundamentals of ISCO Using Persulfate. In In Situ Chemical Oxidation for Groundwater Remediation; Springer: New York, NY, USA, 2011; pp. 147–191. [Google Scholar] [CrossRef]
- Devi, P.; Das, U.; Dalai, A.K. In-situ chemical oxidation: Principle and applications of peroxide and persulfate treatments in wastewater systems. Sci. Total Environ. 2016, 571, 643–657. [Google Scholar] [CrossRef] [PubMed]
- Calenciuc, C.; Fdez-Sanromán, A.; Lama, G.; Annamalai, S.; Sanromán, A.; Pazos, M. Recent Developments in Advanced Oxidation Processes for Organics-Polluted Soil Reclamation. Catalysts 2022, 12, 64. [Google Scholar] [CrossRef]
- Santos, A.; Lorenzo, D.; Dominguez, C.M. Persulfate in remediation of soil and groundwater contaminated by organic compounds. In Electrochemically Assisted Remediation of Contaminated Soils; Springer International Publishing: Cham, Switzerland, 2021; pp. 221–262. Available online: http://www.springer.com/series/5929 (accessed on 13 February 2024).
- Pardo, F.; Santos, A.; Romero, A. Fate of iron and polycyclic aromatic hydrocarbons during the remediation of a contaminated soil using iron-activated persulfate: A column study. Sci. Total Environ. 2016, 566–567, 480–488. [Google Scholar] [CrossRef] [PubMed]
- Sharma, B.M.; Bharat, G.K.; Tayal, S.; Larssen, T.; Bečanová, J.; Karásková, P.; Whitehead, P.G.; Futter, M.N.; Butterfield, D.; Nizzetto, L. Perfluoroalkyl substances (PFAS) in river and ground/drinking water of the Ganges River basin: Emissions and implications for human exposure. Environ. Pollut. 2016, 208, 704–713. [Google Scholar] [CrossRef] [PubMed]
- He, T.; Zhou, B.; Chen, H.; Yuan, R. Degradation of organic chemicals in aqueous system through ferrate-based processes: A review. J. Environ. Chem. Eng. 2022, 10, 108706. [Google Scholar] [CrossRef]
- Galdames, A.; Ruiz-Rubio, L.; Orueta, M.; Sánchez-Arzalluz, M.; Vilas-Vilela, J.L. Zero-valent iron nanoparticles for soil and groundwater remediation. Int. J. Environ. Res. Public. Health 2020, 17, 5817. [Google Scholar] [CrossRef]
- Deng, S.; Bao, Y.; Cagnetta, G.; Huang, J.; Yu, G. Mechanochemical degradation of perfluorohexane sulfonate: Synergistic effect of ferrate(VI) and zero-valent iron. Environ. Pollut. 2020, 264, 114789. [Google Scholar] [CrossRef] [PubMed]
- Kang, J.; Wu, W.; Liu, W.; Li, J.; Dong, C. Zero-valent iron (ZVI) Activation of Persulfate (PS) for Degradation of Para-Chloronitrobenzene in Soil. Bull. Environ. Contam. Toxicol. 2019, 103, 140–146. [Google Scholar] [CrossRef]
- Farrell, J.; Kason, M.; Melitas, N.; Li, T. Investigation of the long-term performance of zero-valent iron for reductive dechlorination of trichloroethylene. Environ. Sci. Technol. 2000, 34, 514–521. [Google Scholar] [CrossRef]
- Zhang, Y.; Ozcer, P.; Ghoshal, S. A comprehensive assessment of the degradation of C1 and C2 chlorinated hydrocarbons by sulfidated nanoscale zerovalent iron. Water Res. 2021, 201, 117328. [Google Scholar] [CrossRef] [PubMed]
- Garcia, A.N.; Zhang, Y.; Ghoshal, S.; He, F.; O’Carroll, D.M. Recent Advances in Sulfidated Zerovalent Iron for Contaminant Transformation. Environ Sci Technol 2021, 55, 8464–8483. [Google Scholar] [CrossRef] [PubMed]
- Song, X.; Wen, Y.; Wang, Y.; Adeel, M.; Yang, Y. Environmental risk assessment of the emerging EDCs contaminants from rural soil and aqueous sources: Analytical and modelling approaches. Chemosphere 2018, 198, 546–555. [Google Scholar] [CrossRef] [PubMed]
- Spurgeon, D.; Wilkinson, H.; Civil, W.; Hutt, L.; Armenise, E.; Kieboom, N.; Sims, K.; Besien, T. Worst-case ranking of organic chemicals detected in groundwaters and surface waters in England. Sci. Total Environ. 2022, 835, 155101. [Google Scholar] [CrossRef]
- Fan, C.; Wang, G.S.; Chen, Y.C.; Ko, C.H. Risk assessment of exposure to volatile organic compounds in groundwater in Taiwan. Sci. Total Environ. 2009, 407, 2165–2174. [Google Scholar] [CrossRef]
- Williams, P.; Benton, L.; Warmerdam, J.; Sheehan, P. Comparative risk analysis of six volatile organic compounds in California drinking water. Environ. Sci. Technol. 2002, 36, 4721–4728. [Google Scholar] [CrossRef] [PubMed]
- La Vigna, F.; Sbarbati, C.; Bonfà, I.; Martelli, S.; Ticconi, L.; Aleotti, L.; Covarelli, A.; Petitta, M. First survey on the occurrence of chlorinated solvents in groundwater of eastern sector of rome. Rend. Lincei 2019, 30, 297–306. [Google Scholar] [CrossRef]
- Liang, C.; Bruell, C.J.; Marley, M.C.; Sperry, K.L. Persulfate oxidation for in situ remediation of TCE. I. Activated by ferrous ion with and without a persulfate-thiosulfate redox couple. Chemosphere 2004, 55, 1213–1223. [Google Scholar] [CrossRef] [PubMed]
- Al-Shamsi, M.A.; Thomson, N.R. Treatment of organic compounds by activated persulfate using nanoscale zerovalent iron. Ind. Eng. Chem. Res. 2013, 52, 13564–13571. [Google Scholar] [CrossRef]
- Habib, M.; Ayaz, T.; Ali, M.; Xu, Z.; Zhou, Z.; Ullah, S.; Lyu, S. Persulfate activation via iron sulfide nanoparticles for enhanced trichloroethylene degradation and its applications in groundwater remediation. J. Water Process Eng. 2024, 58, 104922. [Google Scholar] [CrossRef]
- Tobiszewski, M.; Namieśnik, J. Abiotic degradation of chlorinated ethanes and ethenes in water. Environ. Sci. Pollut. Res. 2012, 19, 1994–2006. [Google Scholar] [CrossRef] [PubMed]
- Gosset, A.; Durrieu, C.; Orias, F.; Bayard, R.; Perrodin, Y. Identification and assessment of ecotoxicological hazards attributable to pollutants in urban wet weather discharges. Environ. Sci. Process Impacts 2017, 19, 1150–1168. [Google Scholar] [CrossRef] [PubMed]
- Stroo, H.F.; Ward, C.H. In Situ Remediation of Chlorinated Solvent Plumes; Springer Science and Business Media LLC: Dordrecht, The Netherlands, 2010. [Google Scholar] [CrossRef]
- Frascari, D.; Zanaroli, G.; Danko, A.S. In situ aerobic cometabolism of chlorinated solvents: A review. J. Hazard. Mater. 2015, 283, 382–399. [Google Scholar] [CrossRef] [PubMed]
- Mathur, J.; Goswami, P.; Gupta, A.; Srivastava, S.; Minkina, T.; Shan, S.; Rajput, V.D. Nanomaterials for Water Remediation: An Efficient Strategy for Prevention of Metal (loid) Hazard. Water 2022, 14, 3998. [Google Scholar] [CrossRef]
- Alazaiza, M.Y.D.; Albahnasawi, A.; Ali, G.A.M.; Bashir, M.J.K.; Copty, N.K.; Amr, S.S.A.; Abushammala, M.F.M.; Al Maskari, T. Recent advances of nanoremediation technologies for soil and groundwater remediation: A review. Water 2021, 13, 2186. [Google Scholar] [CrossRef]
- Qian, L.; Chen, Y.; Ouyang, D.; Zhang, W.; Han, L.; Yan, J.; Kvapil, P.; Chen, M. Field demonstration of enhanced removal of chlorinated solvents in groundwater using biochar-supported nanoscale zero-valent iron. Sci. Total Environ. 2020, 698, 134215. [Google Scholar] [CrossRef]
- Wu, X.; Gu, X.; Lu, S.; Qiu, Z.; Sui, Q.; Zang, X.; Miao, Z.; Xu, M.; Danish, M. Accelerated degradation of tetrachloroethylene by Fe(II) activated persulfate process with hydroxylamine for enhancing Fe(II) regeneration. J. Chem. Technol. Biotechnol. 2015, 91, 1280–1289. [Google Scholar] [CrossRef]


| Batch Experiment | Spiked Comp. | Spiked Conc. * | Water Matrix | Incubation Time | Experiment Reagent | Rationale for the Reagent |
|---|---|---|---|---|---|---|
| 1 | TCE | 100 µg/L | Synthetic GW | 1, 2.5 and 5 h | PS | Strong oxidant |
| Fe(II) | Catalyst | |||||
| PS + Fe(II) | Strong oxidant and catalyst | |||||
| S-nZVI | Weak oxidant and catalyst | |||||
| PS + S-nZVI | Weak and strong oxidant and catalyst | |||||
| Fe(VI) | Strong oxidant and indirect catalyst | |||||
| PS + Fe(VI) | Two strong oxidants and indirect catalyst | |||||
| PS + Fe(VI) + S-nZVI | Weak and two strong oxidants and two catalysts | |||||
| 2 | DCE, TCE and PCE | 10 µg/L | Synthetic GW | 1, 2.5 and 5 h | PS + S-nZVI | Weak and strong oxidant and catalyst |
| PS + Fe(VI) + S-nZVI | Weak and two strong oxidants and two catalysts | |||||
| 3 | DCE, TCE and PCE | 10 µg/L | Real GW | 0 and 5 h | PS + S-nZVI | Weak and strong oxidant and catalyst |
| 4 | DCE, TCE and PCE | 10 µg/L | Real GW | 0, 9 and 24 h | PS + S-nZVI | Weak and strong oxidant and catalyst |
| Compound | Well | MW-2 | MW-6 | MW-14 |
|---|---|---|---|---|
| Benzene | <LOD | <LOD | 0.66 | <LOD |
| Chloromethane | <LOD | <LOD | 1.35 | <LOD |
| Cis-1.2-dichloroethylene | <LOD | <LOD | 0.45 | 0.84 |
| Ethylbenzene | <LOD | <LOD | 0.87 | <LOD |
| M-xylene/p-xylene | <LOD | <LOD | 0.67 | <LOD |
| Naphthalene | <LOD | <LOD | 0.26 | <LOD |
| O-xylene | <LOD | <LOD | 1.48 | <LOD |
| Tetrachloroethylene | <LOD | <LOD | 0.28 | 6.33 |
| Toluene | <LOD | <LOD | 1.96 | 0.20 |
| Trichloroethylene | <LOD | <LOD | 2.86 | 7.81 |
| 1,2,4-trimethylbenzene | <LOD | <LOD | 0.60 | <LOD |
| 1,2-dichlorobenzene | <LOD | 0.28 | <LOD | <LOD |
| 1,3,5-trimethylbenzene | <LOD | <LOD | 0.31 | <LOD |
| Non-Cancer Hazard Quotient (NCQ) | Cancer Risk Quotient (CQ) | Environmental Risk Quotient (EQ) | ||||
|---|---|---|---|---|---|---|
| 0 h | 5 h | 0 h | 5 h | 0 h | 5 h | |
| PCE | 1.2 × 10⁻² ± 1.7 × 10⁻³ | 3.1 × 10⁻³ ± 1.4 × 10⁻³ | 1.7 × 10⁻¹⁰ ± 2.5 × 10⁻¹¹ | 4.6 × 10⁻¹¹ ± 2.1 × 10⁻¹¹ | 5.9 × 10⁻¹ ± 8.7 × 10⁻² | 1.6 × 10⁻¹ ± 7.3 × 10⁻² |
| TCE | 1.2 × 10⁻¹ ± 2.45 × 10⁻² | 7.4 × 10⁻³ ± 7.7 × 10⁻³ | 3.2 × 10⁻⁹ ± 6.6 × 10⁻¹⁰ | 2.0 × 10⁻¹⁰ ± 2.1 × 10⁻¹⁰ | 5.2 × 10⁻¹ ± 1.0 × 10⁻¹ | 3.2 × 10⁻² ± 3.3 × 10⁻² |
| DCE | 5.87 × 10⁻⁴ ± 0.0 | 5.87 × 10⁻⁴ ± 0.0 | * | * | 1.5 × 10⁻² ± 0.0 | 1.5 × 10⁻² ±0.0 |
| Σ | 1.3 × 10⁻¹ ± 5.8 × 10⁻² | 1.1 × 10⁻² ± 3.4 × 10⁻³ | 3.4 × 10⁻⁹ ± 1.6 × 10⁻⁹ | 2.5 × 10⁻¹⁰ ± 9.5 × 10⁻¹¹ | 1.1 × 100 ± 5.6 × 10⁻² | 2.1 × 10⁻¹ ± 3.5 × 10⁻² |
Disclaimer/Publisher’s Note: The statements, opinions and data contained in all publications are solely those of the individual author(s) and contributor(s) and not of MDPI and/or the editor(s). MDPI and/or the editor(s) disclaim responsibility for any injury to people or property resulting from any ideas, methods, instructions or products referred to in the content. |
© 2024 by the authors. Licensee MDPI, Basel, Switzerland. This article is an open access article distributed under the terms and conditions of the Creative Commons Attribution (CC BY) license (https://creativecommons.org/licenses/by/4.0/).
Share and Cite
Cano-López, A.; Fernandez-Rojo, L.; Pérez-Estrada, L.; Jou-Claus, S.; Batriu, M.; Bosch, C.; Martínez-Lladó, X.; Baeta Trias, J.; Mora Vilamaña, R.; Escolà Casas, M.; et al. Novel Oxidation Strategies for the In Situ Remediation of Chlorinated Solvents from Groundwater—A Bench-Scale Study. Water 2024, 16, 1241. https://doi.org/10.3390/w16091241
Cano-López A, Fernandez-Rojo L, Pérez-Estrada L, Jou-Claus S, Batriu M, Bosch C, Martínez-Lladó X, Baeta Trias J, Mora Vilamaña R, Escolà Casas M, et al. Novel Oxidation Strategies for the In Situ Remediation of Chlorinated Solvents from Groundwater—A Bench-Scale Study. Water. 2024; 16(9):1241. https://doi.org/10.3390/w16091241
Chicago/Turabian StyleCano-López, Alicia, Lidia Fernandez-Rojo, Leónidas Pérez-Estrada, Sònia Jou-Claus, Marta Batriu, Carme Bosch, Xavier Martínez-Lladó, Joana Baeta Trias, Ricard Mora Vilamaña, Mònica Escolà Casas, and et al. 2024. "Novel Oxidation Strategies for the In Situ Remediation of Chlorinated Solvents from Groundwater—A Bench-Scale Study" Water 16, no. 9: 1241. https://doi.org/10.3390/w16091241