Article

Microbial Source Tracking in a Watershed Dominated by Swine

1
Department of Agricultural Research Services, Chitedze Research Station, P.O. Box 158, Lilongwe, Malawi
2
Department of Soil Science, North Carolina State University, Campus Box 7619, Raleigh, North Carolina, 27695-7619, USA
3
Department of Animal Science, North Carolina State University, Campus Box 7621, Raleigh, North Carolina, 27695-7621, USA
*
Author to whom correspondence should be addressed.
Water 2010, 2(3), 587-604; https://doi.org/10.3390/w2030587
Submission received: 5 August 2010 / Revised: 30 August 2010 / Accepted: 2 September 2010 / Published: 9 September 2010

Abstract

:
The high concentration of swine production in southeastern North Carolina generates public health concerns regarding the potential transport of pathogens from these production systems to nearby surface waters. The microbial source tracking (MST) tool, antibiotic resistance analysis (ARA), was used to identify sources of E. coli in a segment of Six Runs Creek in Sampson County, North Carolina. Among 52 water samples, fecal coliform (FC) counts averaged 272.1 ± 181.6 CFU/100 mL. Comparisons of isolates from water samples to an ARA library with an average rate of correct classification (ARCC) of 94.3% indicated an average of 64% and 27.1% of 1,961 isolates from Six Runs Creek were associated with lagoon effluent and cattle manure respectively. The potential for aerosol transport of bacteria during lagoon spray events, as well as, the potential for wildlife to serve as a vehicle of transport for bacteria from fields and lagoons to nearby surface waters should be investigated further.

1. Introduction

Surface water can be polluted with fecal bacteria from both point and nonpoint pollutant sources within agricultural and urban systems [1,2]. In agricultural systems that involve livestock and poultry production in the United States, waste on dry weight basis exceeds 200 million tons per year [3]. Livestock manure contains more than 150 pathogens including Campylobacter spp., Salmonella spp. and Escherichia coli O157:H7 that account for over 90% of food and waterborne diseases in humans [4]. Typically lagoon systems are used for swine waste nutrient management. However reasonable levels of bacteria still persist since lagoons were not designed to control bacteria [5]. Consequently, the land application of lagoon effluent gives rise to concern because land application has the potential to introduce many microorganisms to the soil surface of which some may reach surface water via runoff.
Fecal indicator bacteria (FIB) can be quantified in any given waterbody; however, the host source of the fecal bacteria cannot be determined by counts alone [6]. Previous methods for determining the sources of fecal pollution involved monitoring increases in nutrient concentration against background levels and use of ratios of fecal coliforms to fecal streptococci [7]. Microbial Source Tracking (MST) technologies have emerged as tools used to determine the sources of fecal pollution in environmental waters. These technologies typically involve genotypic and phenotypic evaluations of bacteria that are based on the assumption that specific markers or phenotypically expressed traits associated with bacteria are similar within the animal hosts and can be used as a discriminating tool for identifying host sources of bacteria from environmental matrices [8]. Genotypic approaches that have been investigated include repetitive element based polymerase chain reaction (rep-PCR) fingerprinting [9,10,11,12], ribotyping [13] amplified fragment length polymorphism [14], pulse field gel electrophoresis [15], denaturing gradient gel electrophoresis [16], detection of source specific marker genes [17,18]. Phenotypic investigations have included carbon source utilization profiles (CUP) [19], biochemical fingerprinting [20], and antibiotic resistance profiles [21,22,23].
Antibiotic resistance analysis (ARA), one of the earliest MST methods developed, has been tested in a variety of different watershed environments [22,23,24,25] and is still used in fecal source tracking studies [21,26,27,28,29]. The ARA approach is based on the premise that fecal indicator bacteria (FIB) from hosts exposed to antibiotics will develop resistance to those antibiotics, and on the hypothesis that this selective pressure would be a mechanism for discriminating among fecal indicator bacteria from a variety of hosts [30,31,32,33,34,35]. A library or database composed of antibiotic resistance profiles (ARP) of FIB from known host sources is developed and serves as a point of reference for identifying unknown source isolates from water sources. Two source tracking methods comparison studies reported issues with accuracy for numerous source tracking methods, including ARA. However, both studies also described approaches that could compensate for potential problems [35,36]. Such approaches include the application of cross-validation analysis of known-source isolates as well as the removal of clonal isolates to ensure a reliable library.
Performance success [21,28,37] coupled with cost effectiveness [38] made ARA a good choice for determining the sources of fecal pollution in a small watershed with few major contributors of fecal pollution. This paper describes the use of ARA to determine sources of E. coli in a segment of Six Runs Creek, located in a small Sampson County, North Carolina, watershed with a high concentration of swine production.

2. Materials and Methods
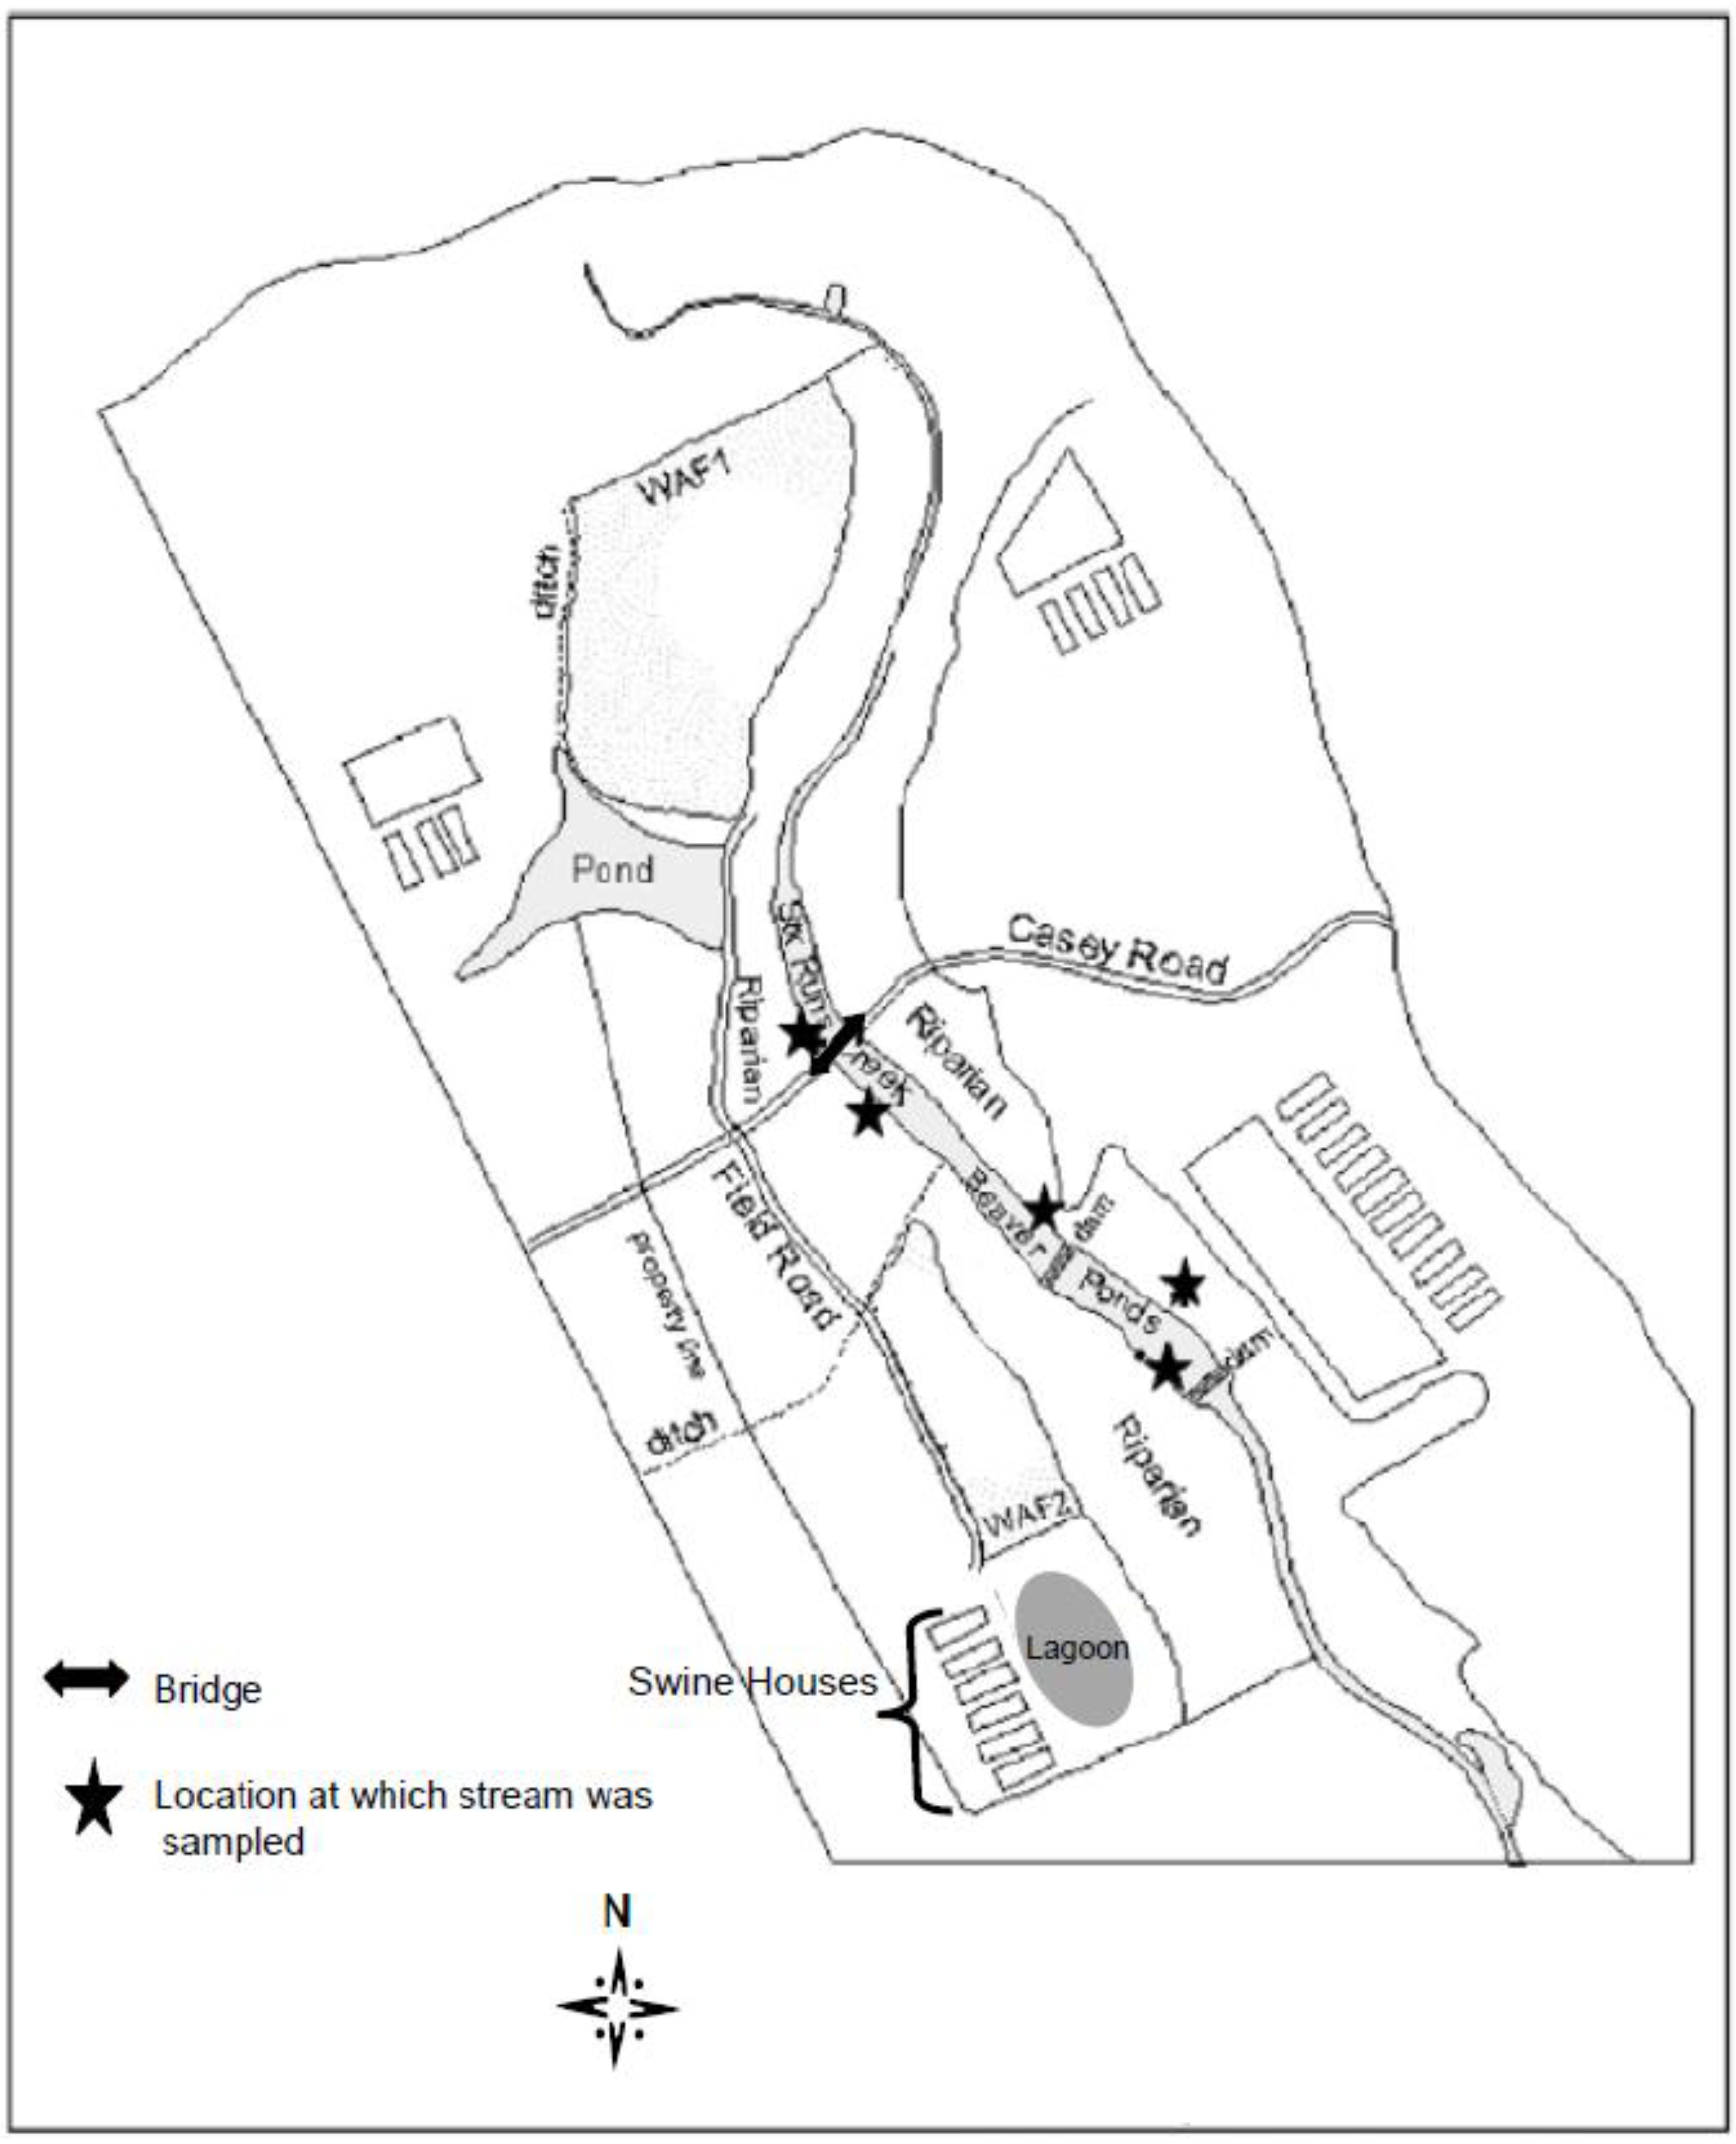
2.1. Study Site

The study site (Figure 1) is located in a 275 ha watershed along the upper reach of Six Runs Creek, which flows in a southerly direction in eastern Sampson County, N.C., USA. Four commercial swine operations with 23 swine houses are located within this watershed. The swine operation designated as the study site is approximately 18 km north of Clinton, N.C., USA Six Runs Creek flows in a channel adjacent to the waste application field site one (WAF1) of the study site, and the segment adjacent to waste application field site two (WAF2) is impounded by two beaver dams and forms an elongated pond (Figure 1).
Figure 1. Map of the study site. WAF1 = Waste application field site one; WAF2 = Waste application field site two.
Water 02 00587 g001
The study site consisted of a single swine operation that had a standing herd of 4,400 finishing animals. The WAF2 and associated riparian system located on the west side of Six Runs Creek was the primary focus of evaluation in this study. The width of the forested riparian buffer ranges from 41 m to 87 m. Waste application field site two (1.8 ha) was cropped with coastal Bermuda grass that had been grazed (100 feeder calves, with an occasional cutting of hay removed). On average, WAF2 received lagoon liquid three to four times during the warm season, once in late fall and early spring.
Most of the soils in the study area are well drained and soil types were derived from soil survey maps of Sampson County, N.C., USA [39]. Soil in WAF2 is classified as a Wagram series (loamy, kaolinitic, thermic Arenic Kandiudults). Soils in the riparian zone are classified as a Marvyn series (fine-loamy, kaolinitic, thermic Typic Kanhapludults) and Blanton (loamy, siliceous, semiactive, thermic Grossarenic Paleudults).

2.2. Host-origin Isolates

Fecal samples from known hosts in the watershed were collected throughout the project to build the library of host-origin ARPs for source identification of E. coli in Six Runs Creek. Lagoon liquid was collected from the lagoon adjacent to WAF2 and fresh swine feces were collected from the facility houses. Cattle and dog feces were collected from WAF2. Bird and deer feces were collected from the riparian area near Six Runs Creek. Feces from area nutria, beaver, and raccoon were collected from the intestine of trapped animals.
All samples were placed on ice in coolers, transported to the laboratory and assayed within 6 hours of collection. Known source samples were diluted and plated on m-FC agar (Becton Dickinson, Cockeysville, MD, USA) to obtain fecal coliform isolates. The fecal coliforms were assigned as E. coli by confirmation as 4-methylumbelliferyl-b-D-glucuronide (MUG)-positive with Colilert broth (IDEXX Laboratories, Westbrook, ME). A subset of the host-origin isolates were also identified by API 20E patterns (bioMerieux sa®, France). Details for collection, transport, dilutions, and plating of fecal samples have been previously described [32]. A total of 1,937 E. coli isolates (10–12 isolates/fecal sample) from the nine known hosts were used to develop the database.

2.3. Water Sample Isolates

Water samples were collected on a monthly basis when conditions permitted between October 2007 and December 2008. Samples were collected as single grab samples from the center of five Six Runs Creek sites. Sampling sites consisted of upstream, midstream and lower stream sites in relation to WAF2. All water samples were placed on ice and processed within six hours of collection. All water samples were filtered and the membrane filter was incubated on m-FC agar at 44.5 °C for 24 h (Becton Dickinson, Cockeysville, MD, USA) for the detection and enumeration of fecal coliforms. Prior to antibiotic resistance analysis, randomly selected fecal coliforms from the water samples were assigned as E. coli using the same procedure described in the section on host origin isolates.

2.4. Antibiotic Resistance Analysis (ARA)

Antibiotic resistance analysis (ARA) was performed on 1,937 host-origin E. coli isolates and 1,961 E. coli isolates from 52 surface water samples. 38 concentrations of nine antibiotics were used to determine ARPs of the isolates (Table 1). The antibiotic and concentrations were selected based on previous ARA studies and their common use in human and veterinary medicine [40]. An isolate was considered to be resistant to a given concentration of antibiotic if growth comparable to the control plate (no antibiotic) was observed. Observations were converted to binary data; with growth on a given antibiotic concentration represented “1” and “0” represented no growth. Any isolates which failed to grow on the control plates were excluded from the analysis. The details of the ARA procedure have been described and are the same as that used in the method comparison studies [23,32,36].
Table 1. Antibiotic concentrations used for antibiotic resistance analysis (ARA) of E. coli isolates.
AntibioticsConcentrations (µg/mL)No. of Variables
Erythromycin60, 70, 90 and 1004
Neomycin2.5, 5.0 and 103
Oxytetracycline2.5, 5.0, 7.5, 10 and 155
Streptomycin2.5, 5.0, 7.5, 10 and 155
Tetracycline2.5, 5.0, 7.5, 10 and 155
Cephalothin15, 25 and 354
Apramycin8, 16, 32, 64 and 1283
Trimethoprim8, 16, 32, 64 and 1285
Rifamicin60, 75 and 903
Total antibiotic variables38
ControlNo antibiotic2

2.5. Host-Origin Library

Data were analyzed with SAS-JMP statistical software (v. 5.0.1, SAS Inst., Cary, NC). ARA patterns were evaluated by discriminant analysis (DA, with covariance pooled and not pooled) and cluster analysis (to produce a dendrogram for visualizing the degree of overlap). Clustering analysis is the technique of grouping data together that share similar values across a number of variables. The distance graph feature associated with cluster analysis clustered the isolates as points and demonstrated whether source patterns were clustered about a central location or if there were multiple clusters around different locations. The host-origin library was developed and clonal isolates (duplicate ARPs) were identified and removed. Classification ties were assigned a source depending on where the isolate was observed in dendrograms [41]. Additional efforts to develop a stringent host origin library and to obtain reliable source identification of unknown source isolates involved the application of an 80% threshold criterion for correct classification to the library. All isolates below the 80% correct classification certainty (based on posterior probabilities from discriminant analysis) were excluded from the library. The second approach was to calculate the average frequency of misclassification (AFM) for each source category, and use this average to develop a minimum detectable percentage (MDP) to make decisions about the significance of hosts contributing minor sources E. coli in water samples [22,34].

2.6. Calculation of ARCC, AFM and MDP

The average rate of correct classification (ARCC) was calculated by adding the percentage of isolates correctly classified from each source category and dividing by the total number of source categories. The average frequency of misclassification (AFM) was calculated by adding the percentage of isolates incorrectly classified from each source category and dividing by the total number of source categories [22,41].
The AFM can be used to estimate the likelihood that an isolate that is not from category X will in fact be classified into category X, and therefore can provide the basis for a significance cut-off (minimum detectable percentage, MDP) when predicting the source of isolates from water samples or unknown sources [33,34].
For example, the AFM of the isolates in the ARA library were misclassified by 0.68 ± 0.92 SD. Given that the library had nine source categories, nine multiplied by the standard deviation (0.92) added to the AFM of 0.68% produced a 9% MDP. With nine source categories, the probability of an isolate being assigned to any category by chance alone was 11%. However, 9% was taken as a more stringent lower limit for considering any one source category to be a significant contributor of fecal pollution [23]. Therefore, for example, birds would be considered a significant contributor to the indicator bacteria in a water sample only if 9% or more of the isolates were classified into the ‘bird’ source category. Ultimately, when classifying isolates of unknown origin (water samples), source categories identified at percentages below the MDP were considered a negligible contributing source.
Cross-validation analysis via the hold-out method was used to determine the representativeness of the library. An individual isolate was removed from the library one at a time. Then, the removed isolate was classified based on the library comprised of the remaining isolates, and the ARCC for these removed isolates was calculated [34].

3. Results

3.1. Fecal Coliform Monitoring

The levels of fecal coliforms (FC) in surface water averaged 272.1 ± 181.6 CFU/100 mL over the course of the study, which exceeded the 200 CFU/100 mL maximum standard for recreational water [42]. This minimum standard was exceeded for almost three quarters of the study with the exception of surface water samples collected in January, March and June of 2008 (66.8 ± 37.3 to 90.0 ± 98.0 CFU/100 mL). The highest average density of FC (537.3 ± 1098.0 CFU/100 mL) was detected in water samples collected following a rainfall event in July 2008.

3.2. Host Origin Library

The removal of clonal isolates, those isolates with duplicate ARPs resulted in a loss of 30%–92% of isolates from the individual source categories, reducing the total number of E. coli (1,937) to 948 isolates. The 948 isolates with unique ARPs were subjected to discriminant analysis, producing an average rate of correct classification (ARCC) of 85%, with individual source correct classification (CC) rates ranging from 70%–100% (Table 2). The application of an 80% correct classification certainty threshold resulted in a loss of up to 60% of isolates from the individual source categories. The refined library of 470 isolates had an ARCC of 94.3%, with individual source CC rates ranging from 75%–100%. The average frequency of misclassification (AFM) for the library was used to calculate the MDP of 9% for the study site and represented a stringent lower limit for considering any one source category to be a significant contributor of fecal pollution [22] (Table 2).
The library, composed of 470 unique ARPs to which an 80% correct classification threshold criterion was applied, was subjected to cross-validation analysis by the hold-out method. The cross-validation ARCCs for lagoon (93%), cattle (95%) and swine (86%) were only 2%–5% lower than the CC rates for these categories listed in Table 3. The cross-validation ARCC for deer, bird and dog was 100% for each. The cross-validation ARCCs for raccoon (71%), nutria (79%) and beaver (94%) were only 4%–9% lower than the CC rates for these categories listed in Table 3.

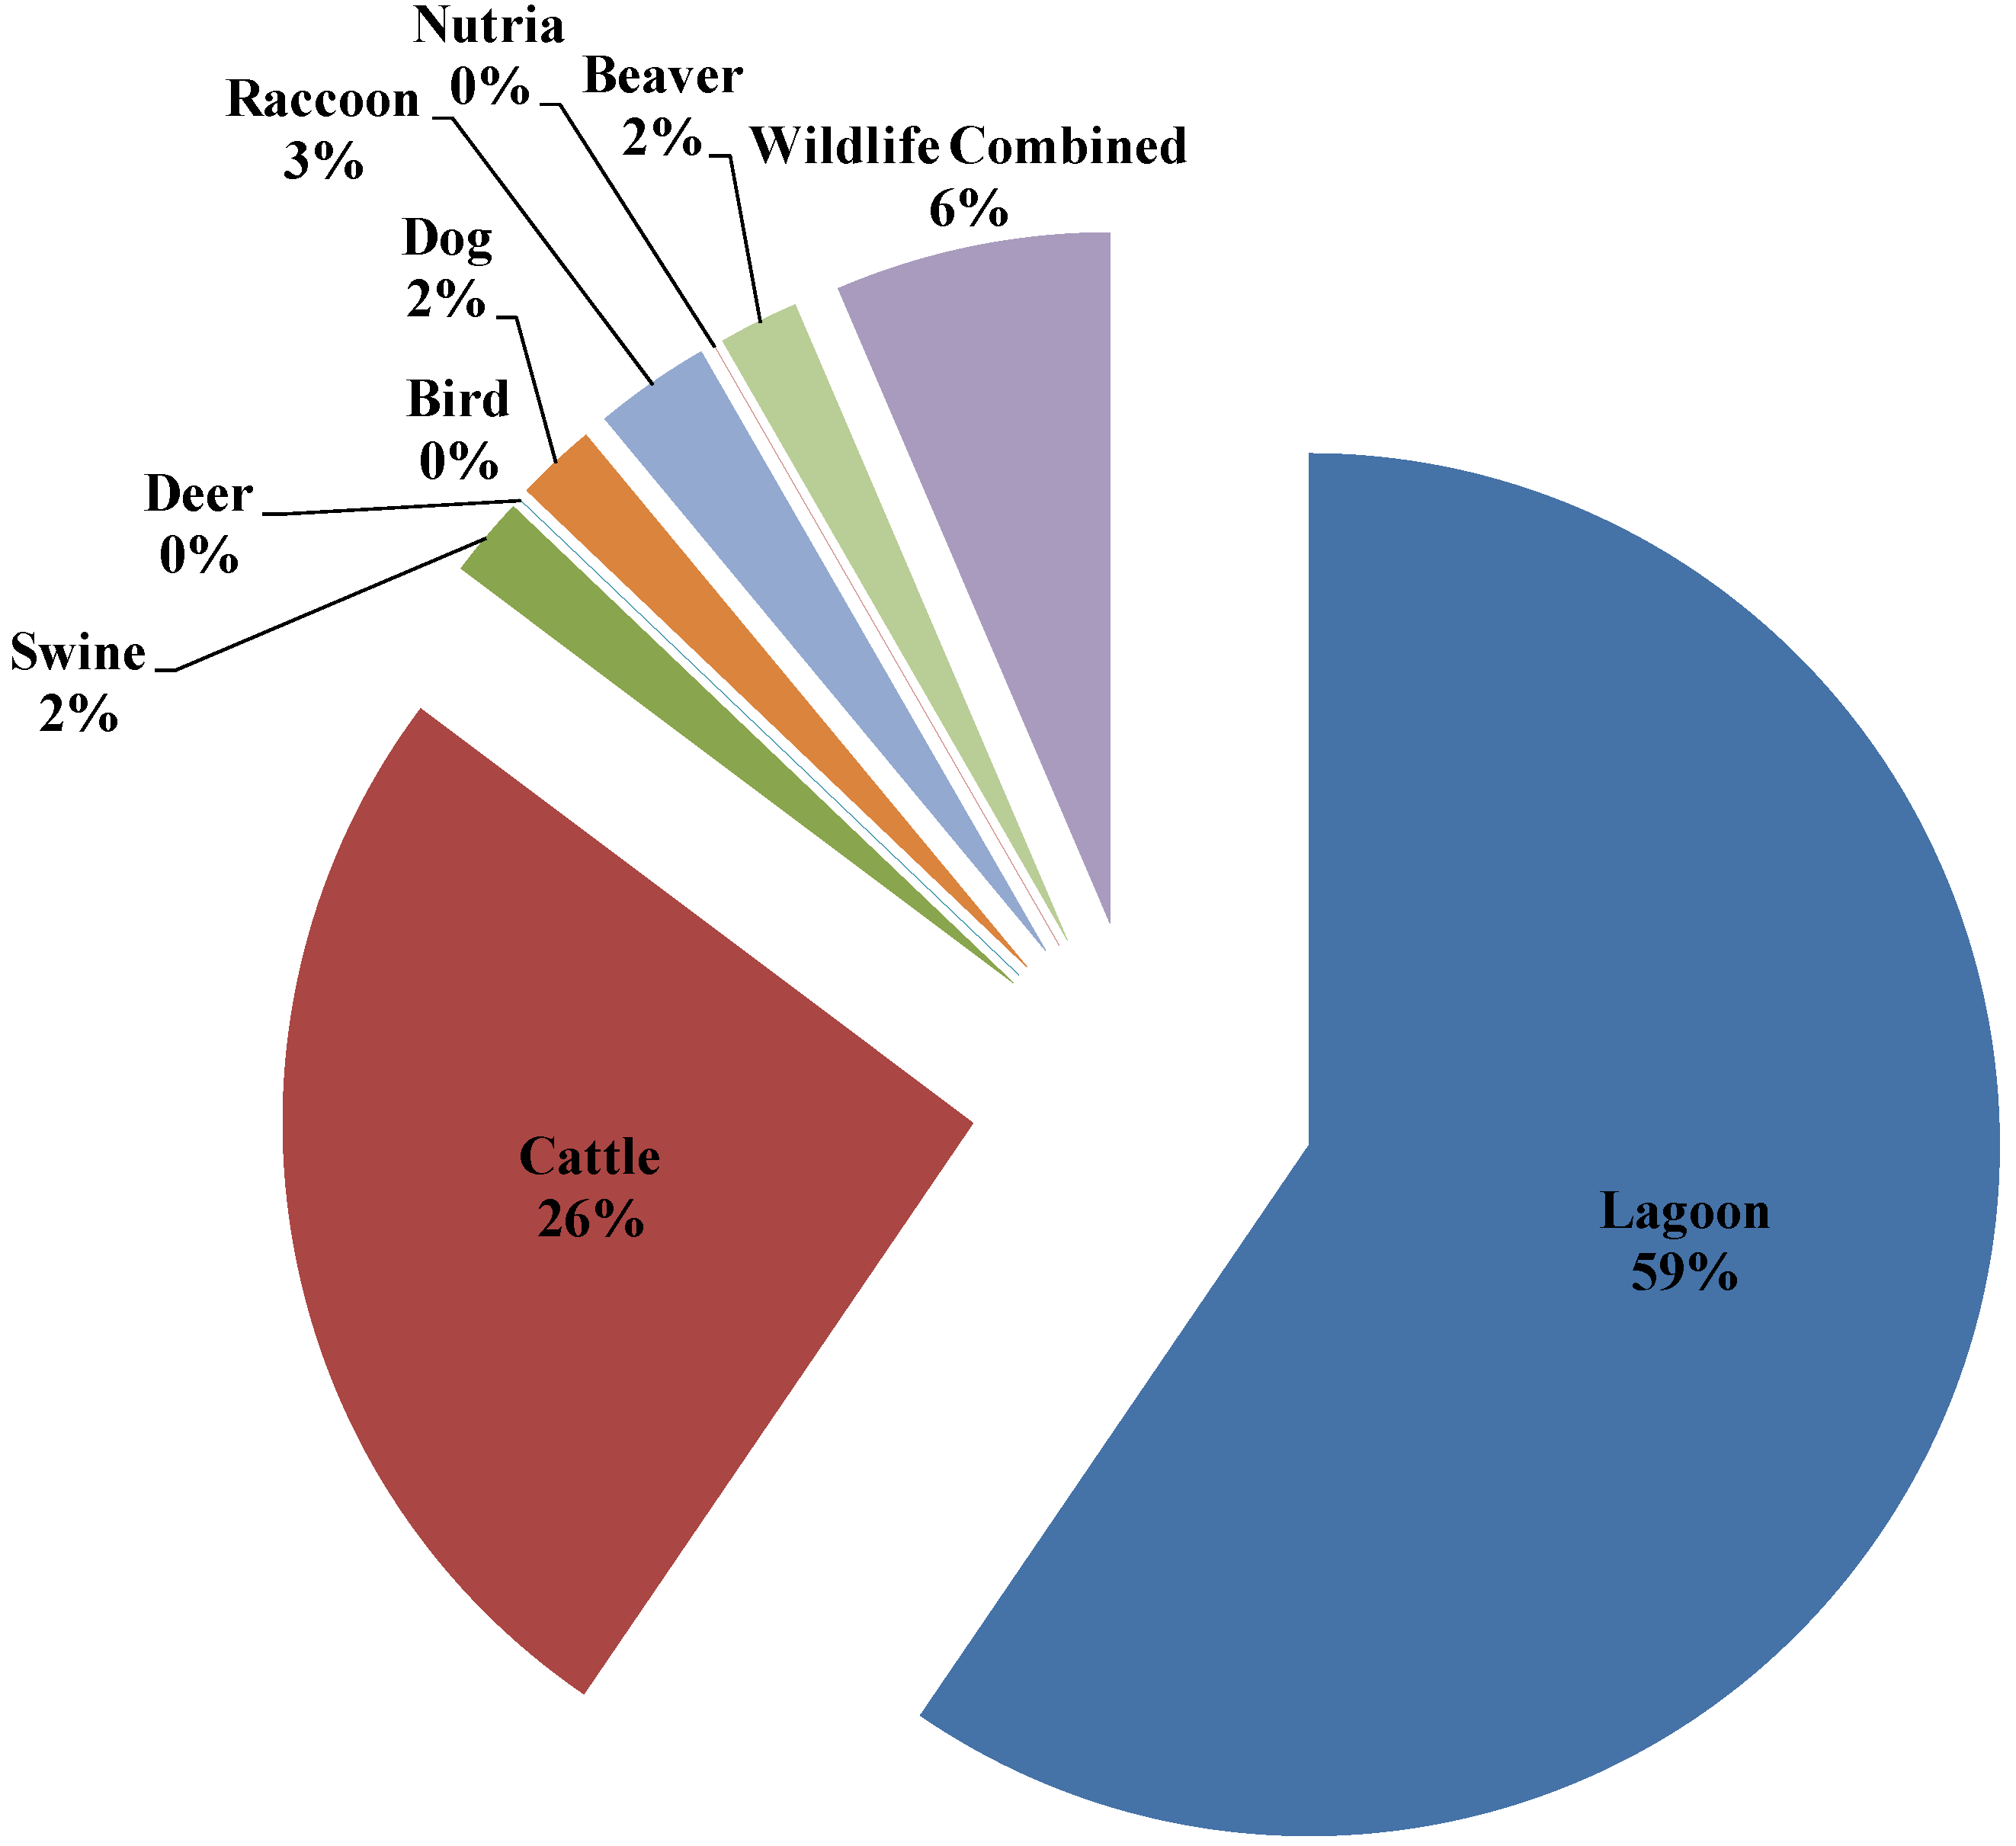
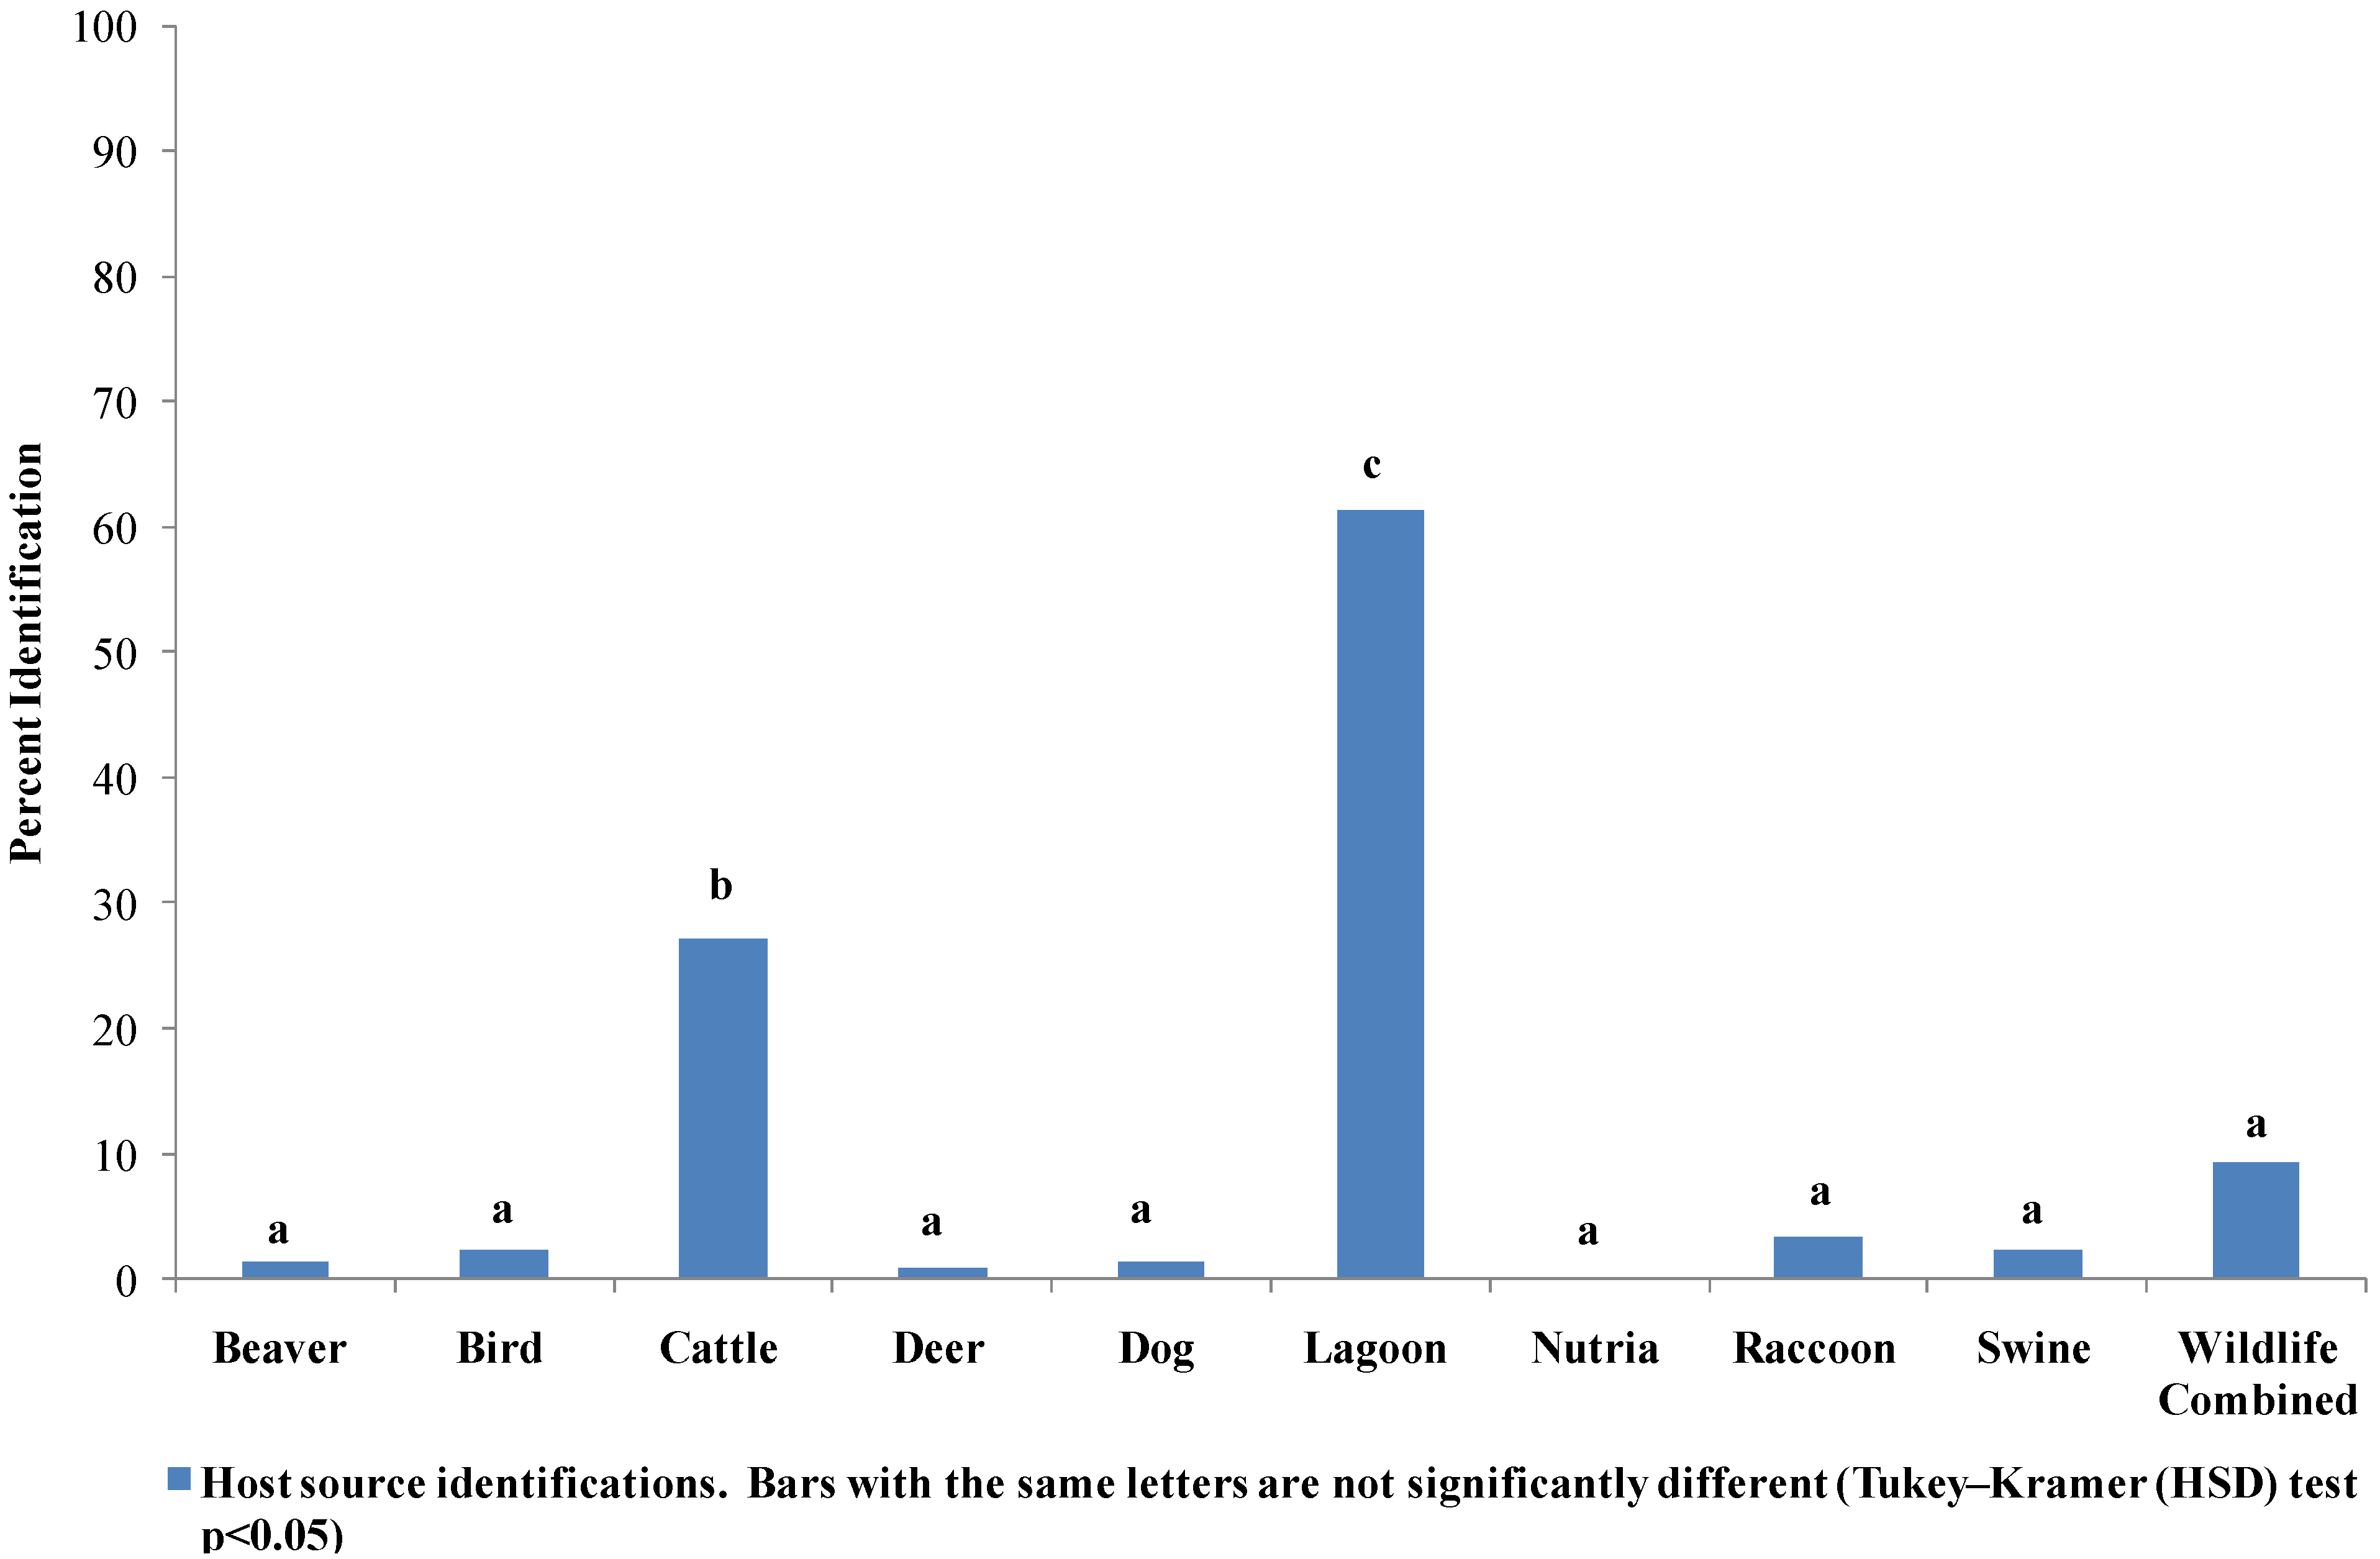
3.3. Host Source Identification of E. coli from Six Runs Creek

Lagoon (50%–59%) and cattle (17%–32%) represented the predominant host source of E. coli isolates in Six Runs Creek at all sampling locations (Figure 2, Figure 3 and Figure 4). Isolates identified as the remaining host source categories were below the 9% MDP, with the exception of isolates from the three sampling sites adjacent to WAF2 identified to the combined wildlife category (11%; Figure 4). Among all E. coli from Six Runs Creek, those identified to the lagoon liquid category (>60%) was significantly greater than the remaining host source category. Those isolates identified as cattle (>25%) was significantly greater than identified as swine manure and all wildlife categories (Figure 5)
Table 2. Discriminant analysis of unique antibiotic resistance patterns (ARPs) used to classify E. coli from nine known sources into source categories.
Categories into which isolates from the library were classified
Source of IsolatesBeaverBirdCattleDeerDogLagoonNutriaRaccoonSwineTotal (ni)
CC*MCCCMCCCMCCCMCCCMCCCMCCCMCCCMCCCMC
Beaver4 0 0 0 0 0 0 0 04
Bird 024 1 0 0 1 0 0 127
Cattle 0 1183 0 0 15 1 0 17217
Deer 0 0 134 0 0 0 0 035
Dog 0 0 1 022 0 0 0 124
Lagoon 0 0 19 0 0246 0 0 59324
Nutria 0 0 0 0 0 023 2 025
Raccoon 0 0 0 0 0 0 12 03
Swine 0 0 29 0 0 56 0 0204 289
Total4024118351340220246722322220478
Total isolates (n) 948
% n CC=(100)(CC)/ni)100.088.984.397.191.775.992.066.770.685.2
%n MC=(100)(MC)/(n-ni)0.00.15.70.00.08.20.20.29.0
* Number of isolates correctly classified (CC) by discriminant analysis; Number of isolates misclassified (MC) by discriminant analysis; Average rate of correct classification (ARCC); n = Total isolates; ni = Total isolates in an individual source category.
Table 3. Discriminant analysis of unique antibiotic resistance patterns (ARPs) with the application of an 80% correct classification certainty criterion used to classify E. coli from nine known sources into source categories.
Categories into which isolates from the library were classified
Source of IsolatesBeaverBirdCattleDeerDogLagoonNutriaRaccoonSwineTotal (ni)
CC*MCCCMCCCMCCCMCCCMCCCMCCCMCCCMCCCMC
Beaver4 0 1 0 0 0 0 0 05
Bird 019 0 0 0 0 0 0 019
Cattle 0 0136 0 0 1 1 0 0138
Deer 0 0 028 0 0 0 0 028
Dog 0 0 0 020 0 0 0 020
Lagoon 0 0 0 0 0125 0 0 9134
Nutria 0 0 0 0 0 022 1 023
Raccoon 0 0 0 0 0 0 23 05
Swine 0 0 0 0 0 5 0 093 98
Total401901361280200125622331939
Total isolates(n) 470
% n CC=(100CC)/(ni)100.0100.099.3100.0100.095.488.075.091.294.3
%n MC=(100)MC/(n-ni)0.00.00.30.00.01.80.70.22.4
* Number of isolates correctly classified (CC) by discriminant analysis; Number of isolates misclassified (MC) by discriminant analysis; Average rate of correct classification (ARCC); n = Total isolates ; ni = Total isolates in an individual source category.
Figure 2. Host source identification of E. coli isolates (n = 102) from the Six Runs Creek sampling site above the bridge.
Water 02 00587 g002
Figure 3. Host source identification of E. coli isolates (n = 144) from the Six Runs Creek sampling site below the bridge.
Water 02 00587 g003
Figure 4. Host source identification of E. coli isolates (n = 1,715) from three Six Runs Creek sampling sites adjacent to waste application field two (WAF2).
Water 02 00587 g004
Figure 5. Host source identification of E. coli isolates (n = 1,961) from the surface waters of Six Runs Creek.
Water 02 00587 g005

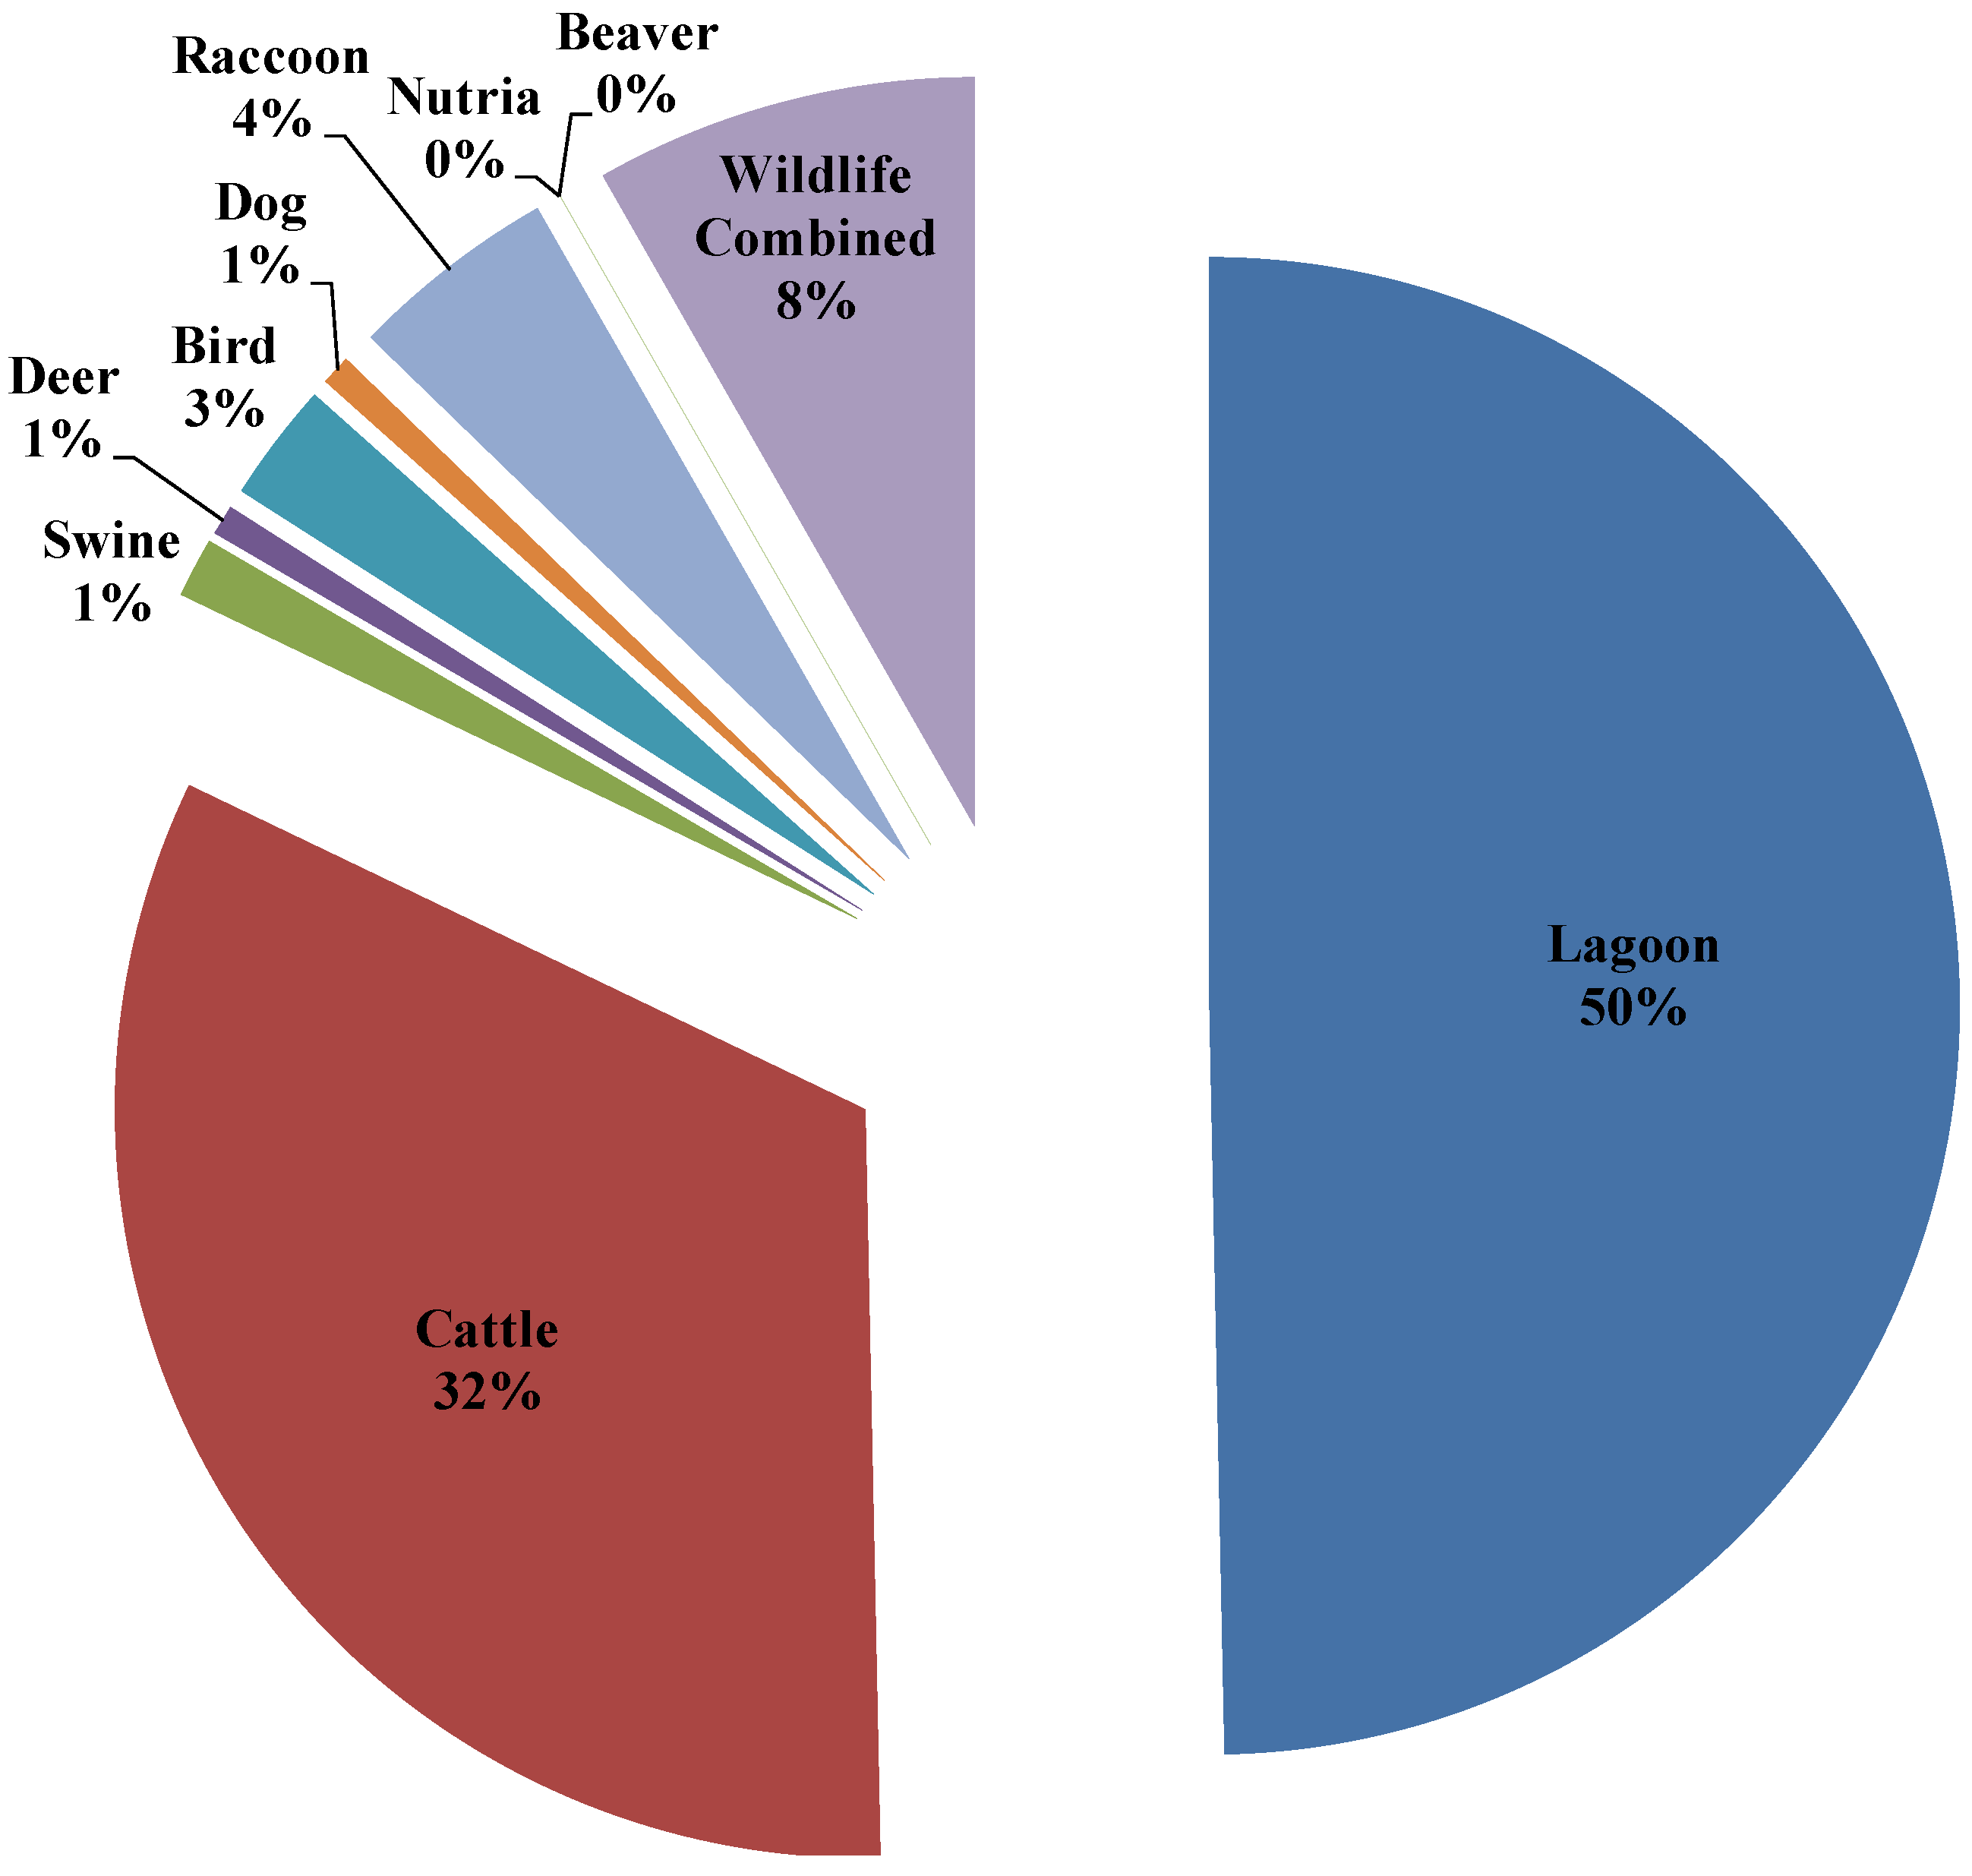
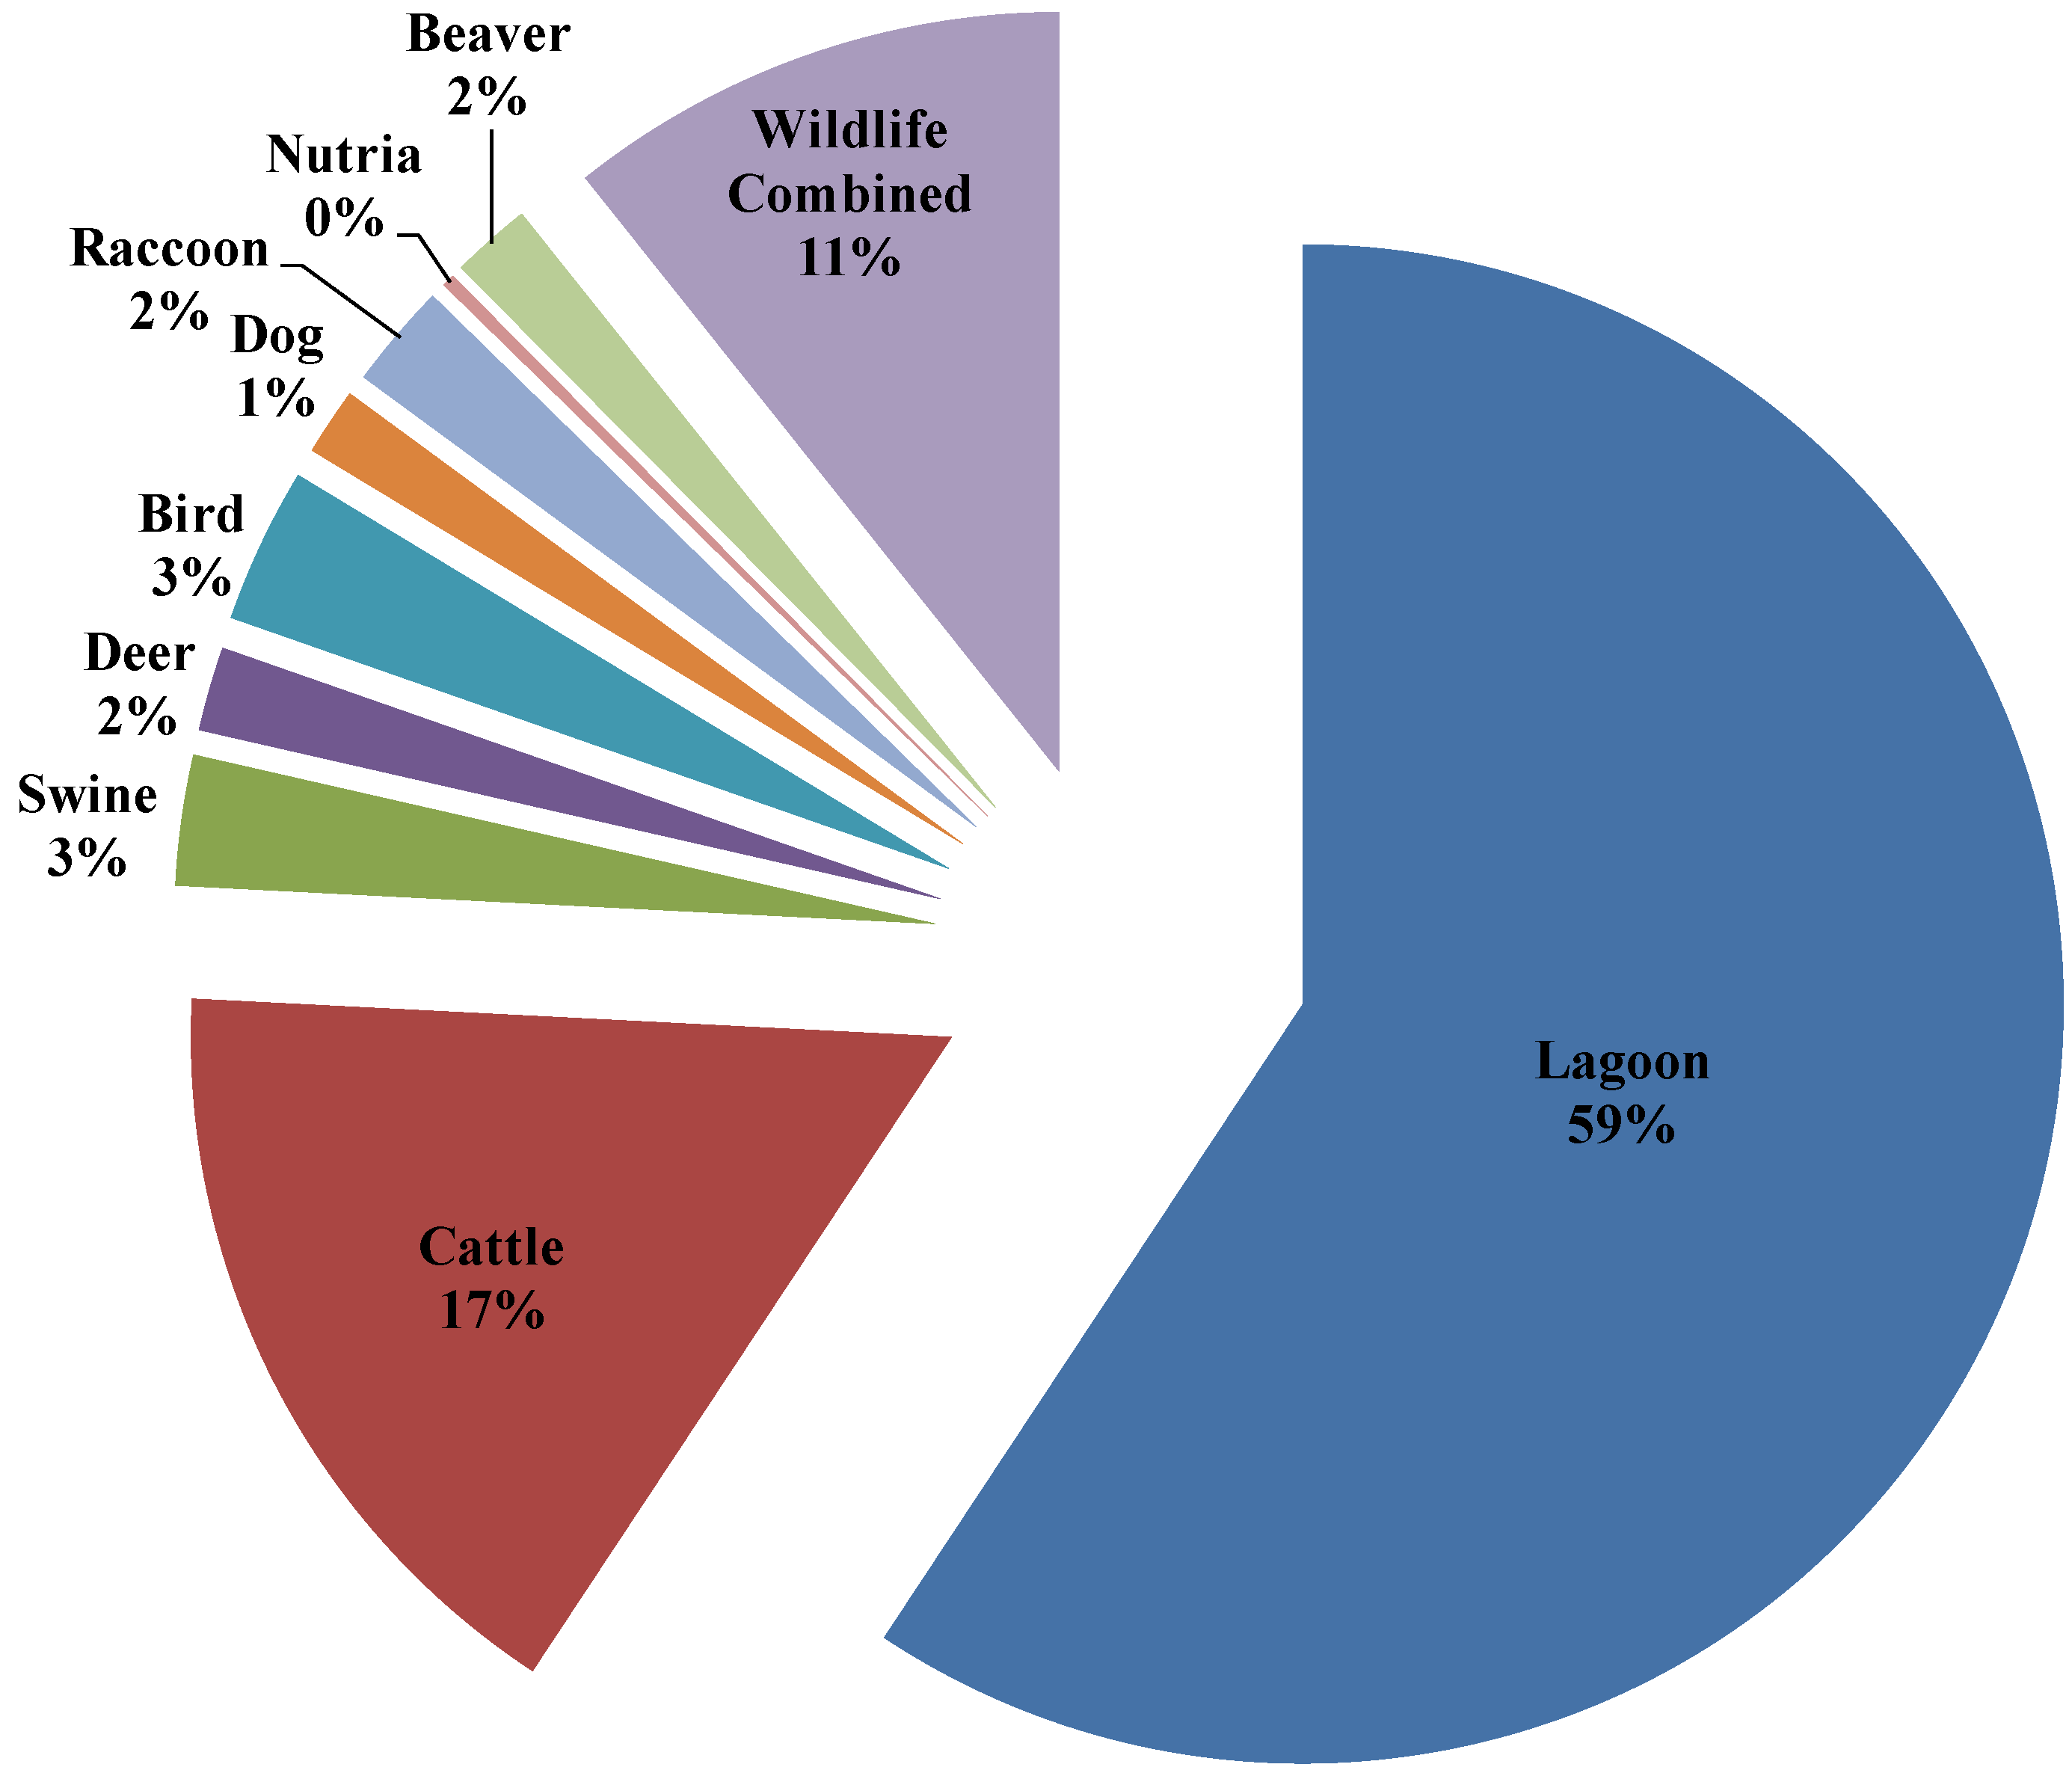
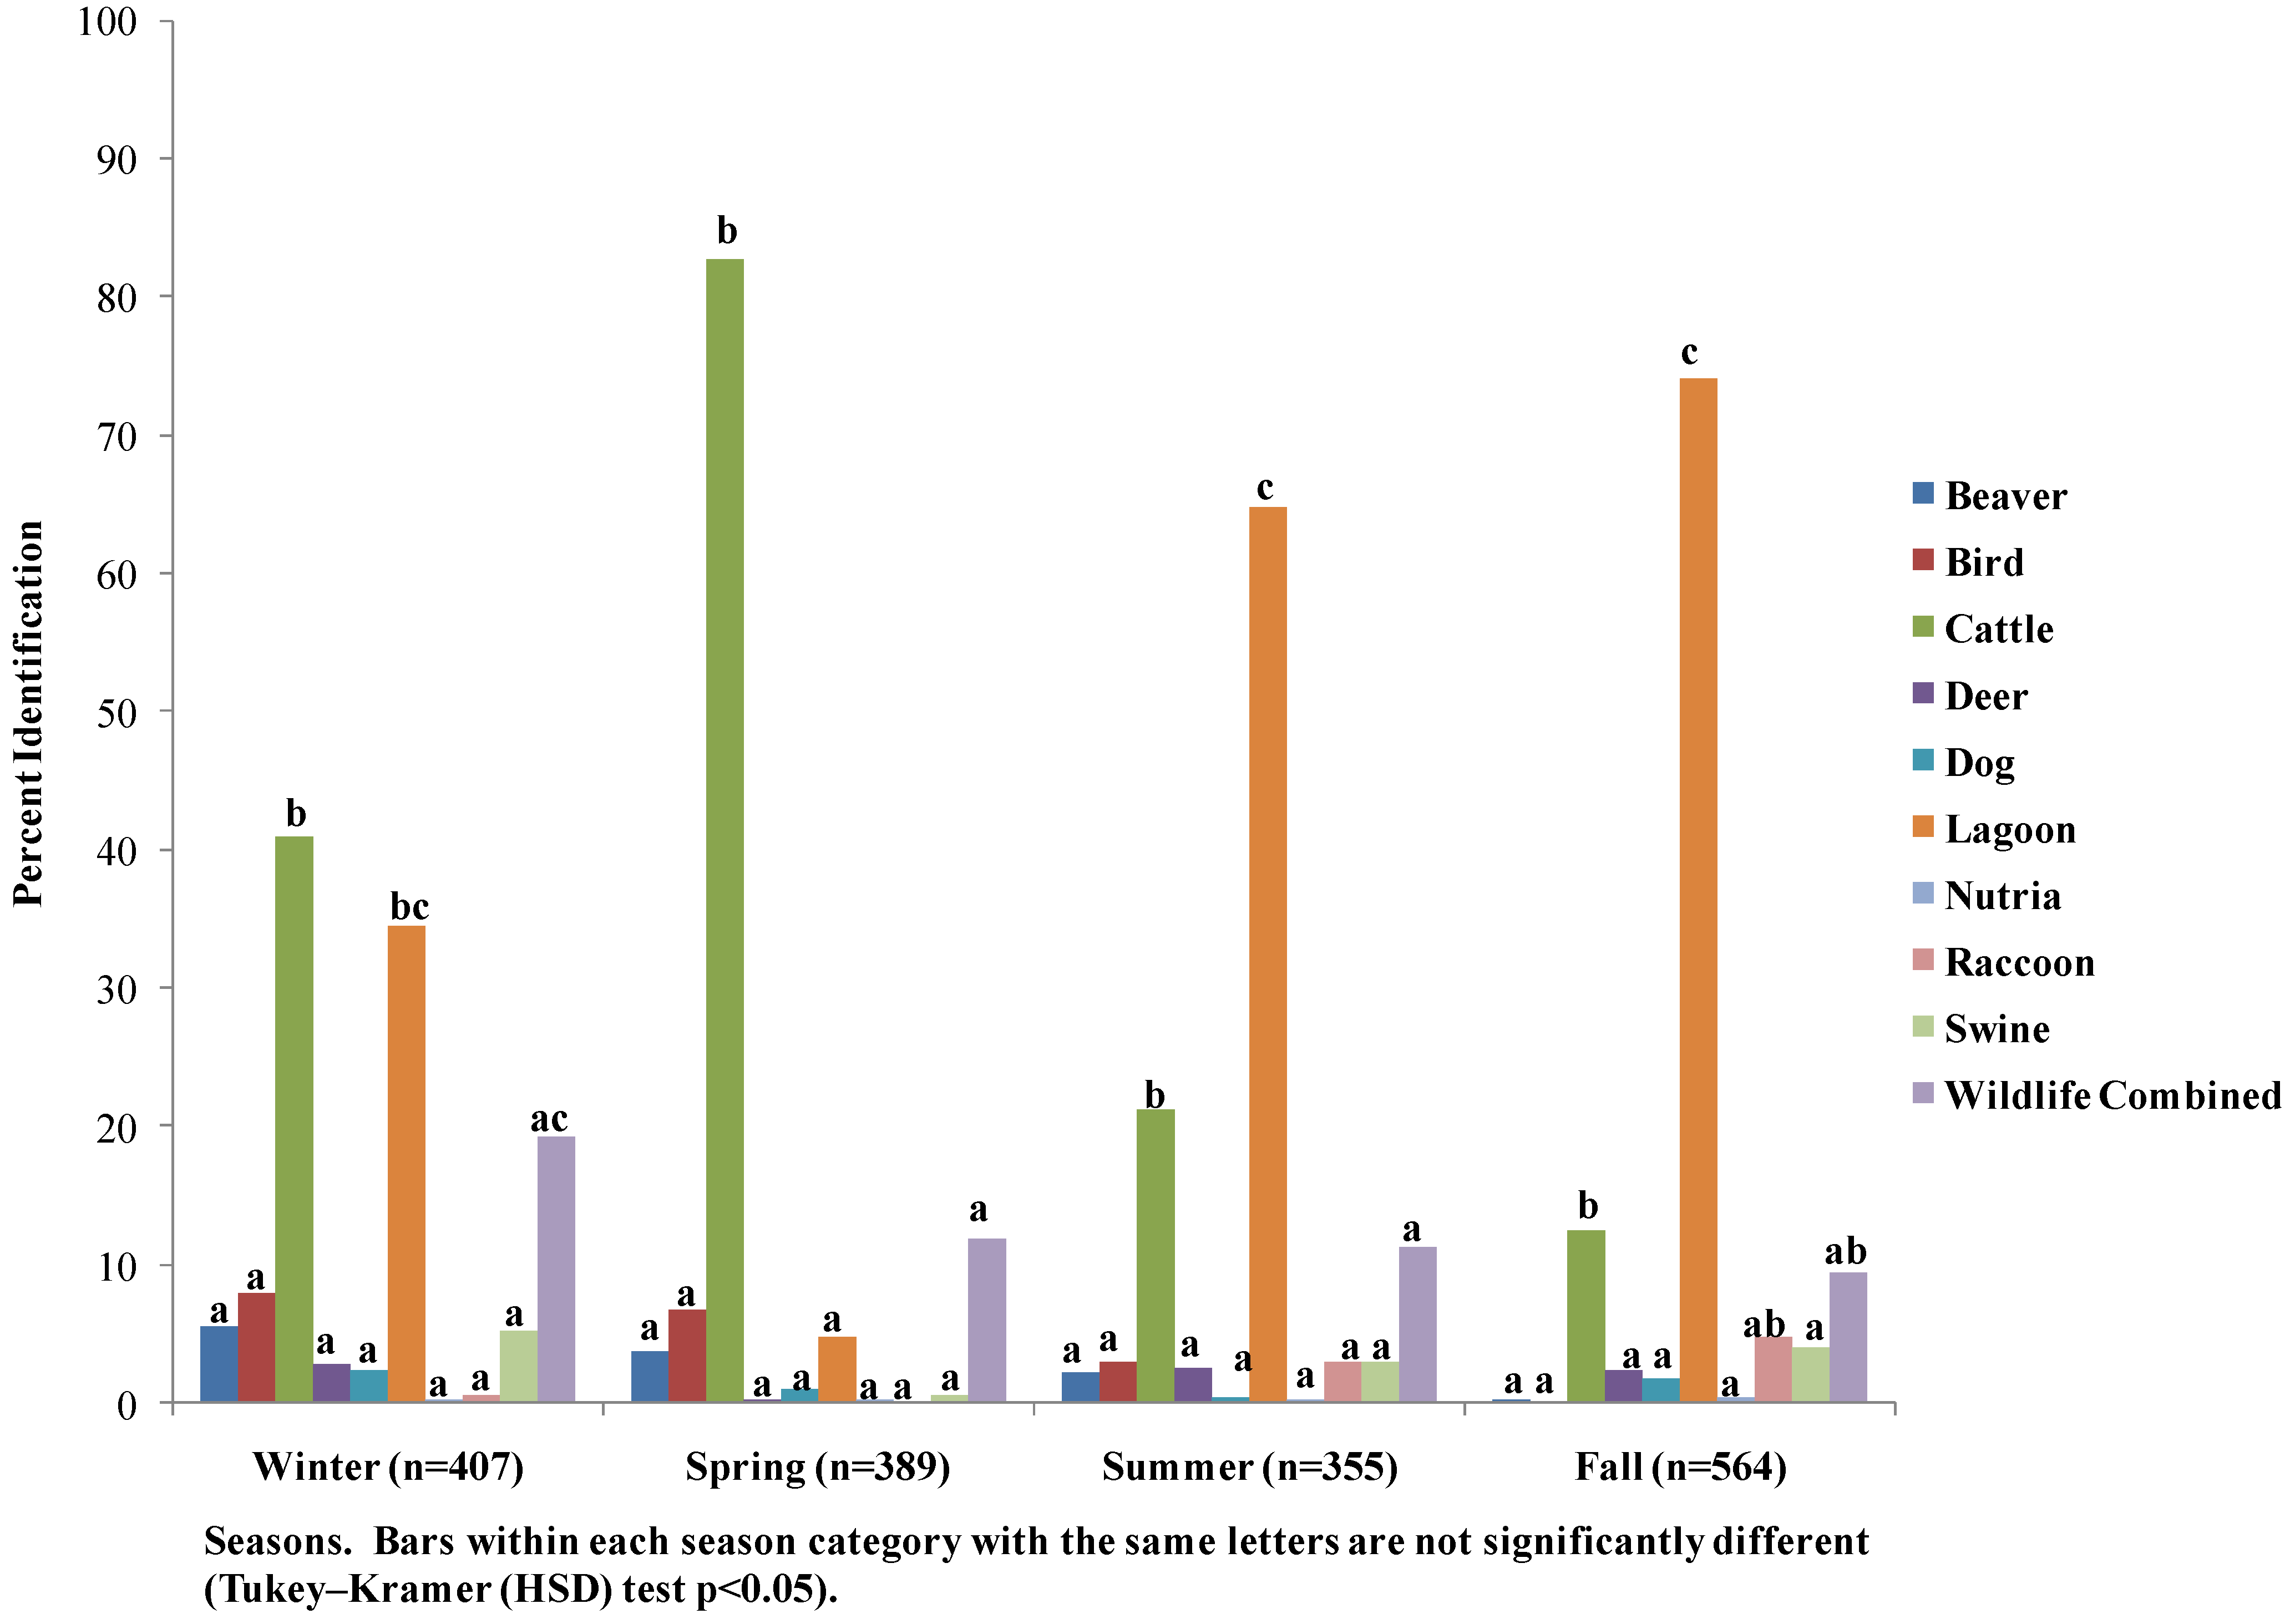
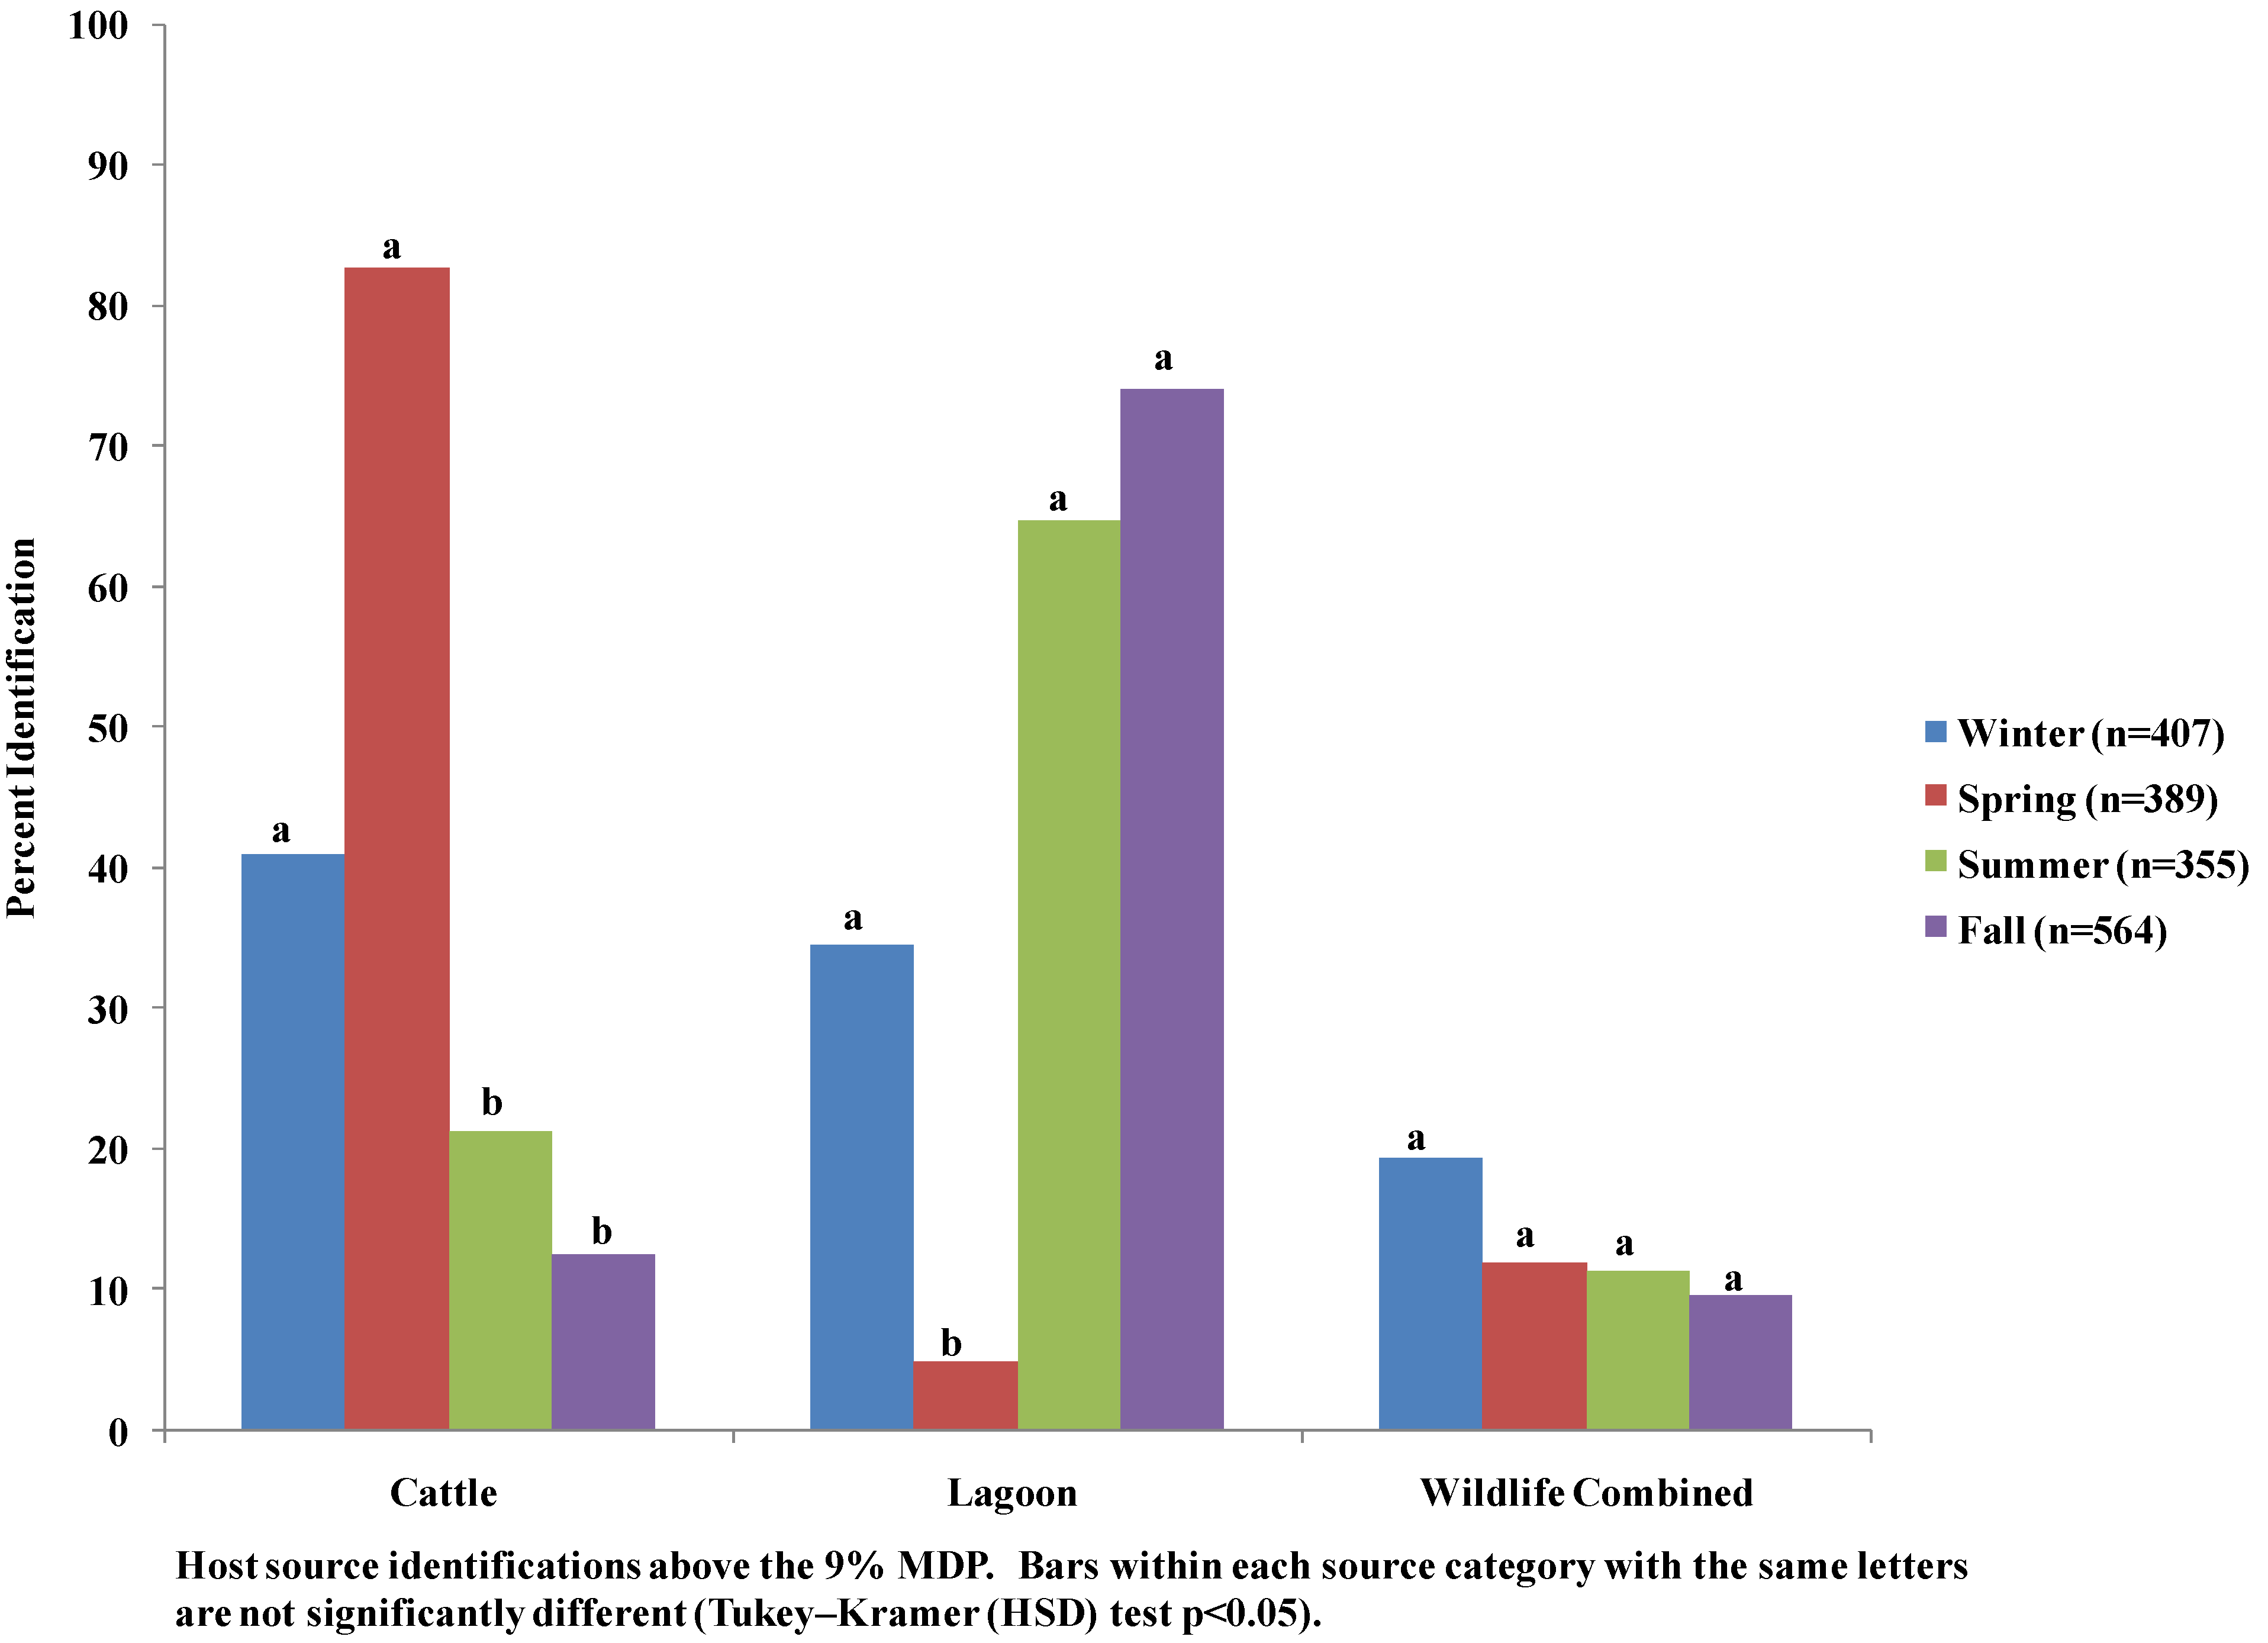
3.4. Seasonal Host Source Allocations

The proportion of E. coli isolates from surface water adjacent to the WAF2 identified as lagoon liquid category was significantly greater than all other host source categories during the summer (64.7%) and fall (74.1%; Figure 6). However, cattle (40.9%) and lagoon liquid (34.5%) identifications were not significantly different from each other during the winter. Neither was the percentage of isolates identified to the combined wildlife (19.3%) category different from the percentage of isolates identified as lagoon liquid during the winter (Figure 6). All of the E. coli allocations to the individual wildlife categories (0.0%–7.9%) and swine manure (0.6%–5.3%) were below the 9% MDP for all seasons (Figure 6).
An evaluation of the seasonal characteristics for the host source identifications that occurred above the 9% MDP indicated isolates identified as lagoon liquid (5%) was significantly less than the percentage of isolates identified as lagoon liquid during the other seasons (34%–74%; Figure 7). A significantly greater percentage of isolates identified as cattle occurred during the winter and spring (40%–82%) than in summer and fall (12%–21%). There were no significant differences in the combined wildlife category.
Figure 6. Seasonal host source identification of E. coli isolates from three Six Runs Creek sampling sites adjacent to waste application field two (WAF2).
Water 02 00587 g006
Figure 7. Seasonal characteristics for host source identification of E. coli isolates that occurred above the 9% minimum detectable percentage (MDP) from three Six Runs Creek sampling sites adjacent to waste application field two (WAF2).
Water 02 00587 g007

4. Discussion

On average, the levels of fecal coliforms (FC) in surface water from Six Runs Creek were 272.1 ± 181.6 CFU/100 mL, which exceeded the maximum standard for recreational water(200 CFU/100 mL). The elevated counts in surface water may be a reflection of the slow turnover of the water movement due to the beaver dam as compared to a true free flowing stream. The resulting ponding may contribute to an accumulation of nutrients thus providing an energy source for the microorganisms to multiply. Fincher et al. [43] reported fecal coliform counts of 373 CFU/100 mL and 1,470 CFU/100 mL in rural and urban sections of an impaired stream, respectively. When considering the study site in the present study exists within a watershed that includes four swine operations with 23 swine houses, average FC counts were not exceptionally high when compared to other rural and urban watersheds.
Antibiotic resistance analysis (ARA) was employed to identify the sources of fecal pollution in the watershed. Antibiotic resistance analysis studies frequently involve large known-source libraries, consisting of about 1,000 to 6,000 isolates [44]. However, many of the strains examined with these libraries are isolated from the same sample or source material, and hence the libraries may be biased due to the presence of multiple replications (clones) of the same bacterial genotype within a single animal host source [11]. A representative known source library composed of unique antibiotic resistance patterns (ARP) among the host source categories with reliable correct classification (CC) rates is important for unknown source identification. The high rate of correct classification obtained with our database (93.4%) may be attributed to the removal of clonal isolates, those isolates with identical antibiotic resistance patterns (ARPs), and the application of an 80% correct classification threshold criterion to the non-clonal isolates. Furthermore, the cross validation testing indicated the library was representative with a 9% or less difference in the ARCC of the validation analysis and the CC rates of the individual sources in the library. Graves et al. [21] reported a known source library ARCC of 95.4%, Hagedorn et al. [25] achieved an ARCC of 87%, and Wiggins et al. [45] reported a known source library ARCC 74%. The ARCC obtained in our study was similar to that found by Graves et al. [21]. However, one must note that nearly all of the earlier studies didn’t employ stringent measures for library representative testing.
Evaluation of surface water isolates by ARA indicated that lagoon liquid was the predominant source of E. coli in water samples above bridge (63.7%), below bridge (54.2%) and surface water locations adjacent to the application field (66.4%). Olivas and Faulkner [37] identified 48% of E. coli isolates as livestock. Livestock as a predominant source of E. coli in surface water has been a common observation. Studies have reported 47%–52% of E. coli isolates were from livestock sources [21,30,37]. According to Carroll et al. [26] a higher percentage of isolates identified as human (21%–87%) were associated with surface water near residential developments that relied on onsite wastewater treatment systems. Higher percentages of isolates identified as livestock and other animal sources were associated with surface water in less developed areas [26]. Land use patterns and the geographical setting of the present study indicated that the dominant contributor of E. coli would be from livestock sources (swine and cattle). However, flocks of birds were often observed both within the application field and at the water source during some sampling trips. The presence of the beaver dam in the creek indicates that there is a high population of beavers, hence a likely source of bacterial contamination. In the present study, most of the land within the watershed is dedicated for agricultural purposes; fecal loading due to failing onsite wastewater systems was very unlikely due to distances between homes and surfaces waters.
Seasonal evaluations of E. coli isolates from surface water implicated cattle as the predominant source in winter (40.9%) and spring (52.8%). Cattle were fenced in the pasture and had no direct access to the creek at our study site. However, the isolates identified as cattle from the segment of Six Runs Creek evaluated in the present study may indicate cattle isolates from other areas in the watershed were able to persist and be transported in stream currents. E. coli isolates identified as lagoon liquid were predominant in summer (64.7%) and fall (74.1%) and may be a reflection of increased spray events during these seasons. Warmer months tend to increase wildlife activity and there may have been transport of E. coli from the lagoon to the stream by wildlife (birds, turtles). One must also consider the possibility of aerosol transport of E. coli in lagoon liquid during spray events. Results from other studies are similar to our findings except for the possible influence of human sources. Olivas and Faulkner [37] reported 56% of E. coli isolates were of human origin during fall. However, source identification of E. coli as livestock and human sources were similar in winter (39% and 35%), spring (40% and 35%) and summer (43% and 37%) [37]. Graves et al. [21] reported cattle as the predominant source of E. coli isolates during warm months (60%) and cool months (53%). Booth et al. [30] reported livestock as the predominant source of E. coli isolates in summer (48.9%) and winter (44.4%).
ARA results from this study were not unexpected given the land use parameters of the watershed thus fortifying the usefulness of ARA as tool for identifying sources of fecal pollution in a watershed with few major contributors of fecal pollution. The study further implies future investigations should address alternate modes of bacterial transport when best management practices for waste management are in place and followed.

5. Conclusions

Over the course of the study, effective swine waste management in an area with four large swine operations have resulted in average fecal coliform counts in surface water that were not exceedingly high. Among isolates evaluated by antibiotic resistance analysis (ARA), livestock were considered a major source. However, in some instances unknown source isolates grouped into a combined wildlife category were not significantly different from the livestock sources. Considering livestock didn’t have direct access to the stream and the position of the riparian would prevent surface runoff during lagoon spray events one must consider other means of bacterial transport. Aerosol transport of E. coli to nearby surface waters during spray events as well as the potential for wildlife to transport bacteria from fields and lagoons to nearby surface waters should be investigated further as potential sources of lagoon and livestock isolates in Six Runs Creek.

Acknowledgements

Funding support for this research was provided by the University of North Carolina Water Resources Research Institute (Project #70235) and the United States Geological Survey. The authors would like to thank all those who assisted with field work and data interpretation. Special thanks to the farm owners for providing access to their property.

References

  1. Simpson, J.M.; Santo Domingo, J.W; Reasoner, D.J. Microbial source tracking: State of the science. Environ. Sci. Technol. 2002, 36, 5279–5288. [Google Scholar]
  2. Scott, T.M.; Rose, J.B.; Jenkins, T.M.; Farrah, S.R.; Lukasik, J. Microbial source tracking: Current methodology and future directions. Appl. Environ. Microbiol. 2002, 68, 5796–5803. [Google Scholar] [CrossRef]
  3. Aillery, M.; Gollehon, N.; Johansson, R.; Key, N.; Ribaudo, M. Managing manure to improve air and water quality. Agric. Nutr. Manag. 2006, 2, 13–20. [Google Scholar]
  4. United States Environmental Protection Agency (USEPA). National pollutant discharge elimination system permit regulation and effluent limitation guidelines and standards for concentrated animal feeding operations (CAFOs); final rule. Federal Register 2003, 68, 7176–7274. [Google Scholar]
  5. Burkholder, J.; Libra, B.; Weyer, P.; Heathcote, S.; Kolpin, D.; Thorne, P.S.; Wichman, M. Impacts of waste from concentrated animal feeding operations on water quality. Environ. Health Perspect. 2007, 115, 308–312. [Google Scholar] [CrossRef]
  6. Carson, A.C.; Shear, B.L.; Ellersieck, M.R.; Asfaw, A. Identification of fecal Escherichia coli from humans and animals by ribotyping. Appl. Environ. Microbiol. 2001, 67, 1503–1507. [Google Scholar] [CrossRef] [PubMed]
  7. Evenson, J.C.; Strevett, K.A. Discrininant analysis of fecal bacterial species composition for use as a phenotypic microbial source tracking method. Res. Microbiol. 2006, 157, 437–444. [Google Scholar] [CrossRef] [PubMed]
  8. Amor, K.; Heinrichs, D.E.; Frirdich, E.; Ziebell, K.; Johnson, R.P.; Whitfield, C. Distribution of core oligosaccharide types in lipopolysaccharides from Escherichia coli. Infect. Immun. 2000, 68, 1116–1124. [Google Scholar] [CrossRef] [PubMed]
  9. Dombek, P.E.; Johnson, L.K.; Zimmerley, S.T.; Sadowsky, M.J. Use of repetitive DNA sequences and the PCR to differentiate Escherichia coli isolates from human and animal sources. Appl. Environ. Microbiol. 2000, 66, 2572–2577. [Google Scholar] [CrossRef] [PubMed]
  10. McLellan, S.L.; Daniels, A.D.; Salmore, A.K. Genetic characterization of Escherichia coli populations from host sources of fecal pollution by using DNA fingerprinting. Appl. Environ. Microbiol. 2003, 69, 2587–2594. [Google Scholar] [CrossRef] [PubMed]
  11. Johnson, L.A.K.; Brown, M.B.; Carruthers, E.A.; Ferguson, J.A.; Dombek, P.E.; Sadowskyl, M.J. Sample size, library composition, and genotypic diversity among natural populations of Escherichia coli from different animals influence accuracy of determining sources of fecal pollution. Appl. Environ. Microbiol. 2004, 70, 4478–4485. [Google Scholar] [CrossRef] [PubMed]
  12. Kon, T.; Weir, S.C.; Howell, E.T.; Lee, H.; Trevors, J.T. Repetitive element (REP)-polymerase chain reaction (PCR) analysis of Escherichia coli isolates from recreational waters of southeastern Lake Huron. Can. J. Microbiol. 2009, 55, 269–276. [Google Scholar] [CrossRef] [PubMed]
  13. Parveen, S.; Portier, K.M.; Robinson, K.; Edmiston, L.; Tamplin, M.L. Discriminant analysis of ribotype profiles of Escherichia coli for differentiating human and nonhuman sources of fecal pollution. Appl. Environ. Microbiol. 1999, 65, 3142–3147. [Google Scholar] [PubMed]
  14. Leung, K.T.; Mackereth, R.; Tien, Y.C.; Topp, E. A comparison of AFLP and ERIC-PCR analyses for discriminating Escherichia coli from cattle, pig and human sources. FEMS Microbiol. Ecol. 2004, 47, 111–119. [Google Scholar] [CrossRef] [PubMed]
  15. Myoda, S.P.; Carson, C.A.; Fuhrmann, J.J.; Hahm, B.K.; Hartel, P.G.; Yampara-Lquise, H.; Johnson, L.; Kuntz, R.L.; Nakatsu, C.H.; Sadowsky, M.J.; Samadpour, M. Comparison of genotypic-based microbial source tracking methods requiring a host origin database. J. Water Health 2003, 1, 167–180. [Google Scholar] [PubMed]
  16. Buchan, A.; Alber, M.; Hodson, R.E. Strain-specific differentiation of environmental Escherichia coli isolates via denaturing gradient gel electrophoresis (DGGE) analysis of the 16S-23S intergenic spacer region. FEMS Microbiol. Ecol. 2001, 35, 313–321. [Google Scholar] [PubMed]
  17. Field, K.G; Bernhard, A.E; Brodeur, T.J. Molecular approaches to microbiological monitoring: Fecal Source Detection. Environ. Monit. Assess. 2003, 81, 313–32. [Google Scholar] [CrossRef] [PubMed]
  18. Khatib, L.A.; Tsai, Y.L.; Olson, B.H. A biomarker for the identification of swine fecal pollution in water, using the STII toxin gene from enterotoxigenic Escherichia coli. Appl. Microbiol. Biotechnol. 2003, 63, 231–238. [Google Scholar] [CrossRef] [PubMed]
  19. Hagedorn, C.; Crozier, J.B.; Mentz, K.A.; Booth, A.M.; Graves, A.K.; Nelson, N.J.; Reneau, R.B., Jr. Carbon source utilization profiles as a method to identify sources of faecal pollution in water. J. Appl. Microbiol. 2003, 94, 792–799. [Google Scholar] [CrossRef] [PubMed]
  20. Ahmed, W.; Katouli, M. Phenotypic variations of enterococci in surface waters: analysis of biochemical fingerprinting data from multi-catchments. J. Appl. Microbiol. 2008, 105, 452–458. [Google Scholar] [CrossRef] [PubMed]
  21. Graves, A.K.; Hagedorn, C.; Brooks, A.; Hagedorn, R.L.; Martin, E. Microbial source tracking in a rural watershed dominated by cattle. Water Res. 2007, 41, 3729–3739. [Google Scholar] [CrossRef] [PubMed]
  22. Harwood, V.J.; Whitlock, J.; Withington, V. Classification of antibiotic resistance patterns of indicator bacteria by discriminant analysis: Use in predicting the source of fecal contamination in subtropical waters. Appl. Environ. Microbiol. 2000, 66, 3698–3704. [Google Scholar] [CrossRef] [PubMed]
  23. Harwood, V.J.; Wiggins, B.; Hagedorn, C.; Ellender, R.D.; Gooch, J.; Kern, J.; Samadpour, M.; Chapman, A.; Robinson, B.J.; Thompson, B.C. Phenotypic library-based microbial source tracking methods: Efficacy in the California collaborative study. J. Water Health 2003, 1, 153–166. [Google Scholar] [PubMed]
  24. Wiggins, B.A. Discriminant analysis of antibiotic resistance patterns in fecal streptococci, a method to differentiate human and animal sources of fecal pollution in natural waters. Appl. Environ. Microbiol. 1996, 62, 3997–4002. [Google Scholar] [PubMed]
  25. Hagedorn, C.; Robinson, S.L.; Filtz, J.R.; Grubbs, S.M.; Angier, T.A.; Reneau, R.B. Determining sources of fecal pollution in a rural Virginia watershed with antibiotic resistance patterns in fecal streptococci. Appl. Environ. Microbiol. 1999, 65, 5522–5531. [Google Scholar] [PubMed]
  26. Carroll, S.; Hargreaves, M.; Goonetilleke, A. Sourcing faecal pollution from onsite wastewater treatment systems in surface waters using antibiotic resistance analysis. J. Appl. Microbiol. 2005, 99, 471–482. [Google Scholar] [CrossRef] [PubMed] [Green Version]
  27. Orosz-Coghlan, P.A.; Rusin, P.A.; Karpiscak, M.M.; Gerba, C.P. Microbial source tracking of E. coli in constructed wetlands. Water Environ. Res. 2006, 78, 227–32. [Google Scholar] [CrossRef] [PubMed]
  28. Carroll, S.P.; Dawes, L.; Hargreaves, M.; Goonetilleke, A. Faecal pollution source identification in an urbanizing catchment using antibiotic resistance profiling, discriminant analysis and partial least squares regression. Water Res. 2009, 43, 1237–1246. [Google Scholar] [CrossRef] [PubMed] [Green Version]
  29. Greenberg, J.; Price, B.; Ware, A. Alternative estimate of source distribution in microbial source tracking using posterior probabilities. Water Res. 2010, 44, 2629–2637. [Google Scholar] [CrossRef]
  30. Booth, A.M.; Hagedorn, C.; Graves, A.K.; Hagedorn, S.C.; Mentz, K.H. Sources of fecal pollution in Virginia’s Blackwater river. J. Environ. Eng. 2003, 129, 547–552. [Google Scholar] [CrossRef]
  31. Choi, S.; Chu, W.; Brown, J.; Becker, S.J.; Harwood, V.J.; Jiang, S.C. Application of enterococci antibiotic resistance patterns for contamination source identification at Huntington Beach, California. Mar. Pollut. Bull. 2003, 46, 748–755. [Google Scholar] [CrossRef] [PubMed]
  32. Graves, A.K.; Hagedorn, C.; Teetor, A.; Mahal, M.; Booth, A.M.; Reneau, R.B., Jr. Antibiotic resistance profiles to determine sources of fecal contamination in a rural Virginia watershed. J. Environ. Qual. 2002, 31, 1300–1308. [Google Scholar] [CrossRef] [PubMed]
  33. Whitlock, J.E.; Jones, D.T.; Harwood, V.J. Identification of the sources of fecal coliforms in an urban watershed using antibiotic resistance analysis. Water Res. 2002, 36, 4273–4282. [Google Scholar] [CrossRef] [PubMed]
  34. Wiggins, B.A.; Cash, P.W.; Creamer, W.S.; Dart, S.E.; Garcia, P.P.; Gerecke, T.M.; Han, J.; Henry, B.L; Hoover, K.B.; Johnson, E.L.; Jones, K.C.; McCarthy, J.G.; McDonough, J.A.; Mercer, S.A.; Noto, M.J.; Park, H.; Phillips, M.S.; Purner, S.M.; Smith, B.M.; Stevens, E.N.; Varner, A.K. Use of antibiotic resistance analysis for representativeness testing of multiwatershed libraries. Appl. Environ. Microbiol. 2003, 69, 3399–3405. [Google Scholar] [CrossRef]
  35. Stewart, J.R.; Ellender, R.D; Gooch, J.A.; Jiang, S.; Myoda, S.P.; Weisberg, S.B. Recommendations for microbial source tracking: lessons learned from a methods comparison study. J. Water Health 2003, 1, 225–231. [Google Scholar] [PubMed]
  36. Stoeckel, D.M.; Mathes, M.V.; Hyer, K.E.; Hagedorn, C.; Kator, H.; Lukasik, J.; O’Brien, T.L.; Fenger, T.W.; Samadpour, M.; Strickler, K.M.; Wiggins, B.A. Comparison of seven protocols to identify fecal contamination sources using E. coli. Environ. Sci. Technol. 2004, 38, 6109–6117. [Google Scholar] [CrossRef]
  37. Olivas, Y.; Faulkner, B.R. Fecal source tracking by antibiotic resistance analysis on a watershed exhibiting low resistance. Environ. Monit. Assess. 2008, 139, 15–25. [Google Scholar] [CrossRef] [PubMed]
  38. Price, B.; Venso, E.; Frana, M.; Greenberg, J.; Ware, A. A comparison of ARA and DNA data for microbial source tracking based on source-classification models developed using classification trees. Water Res. 2007, 41, 3575–3584. [Google Scholar] [CrossRef] [PubMed]
  39. USDA. Soil Survey of Sampson County, North Carolina; USDA-SCS: Washington DC, USA, 1985; Map no. 4. [Google Scholar]
  40. Mathew, A.G.; Upchurch, W.G.; Chattin, S.E. Incidence of antibiotic resistance in fecal Eschericia coli isolated from commercial swine farms. J. Animal Sci. 1998, 76, 429–434. [Google Scholar]
  41. Ritter, K.J.; Carruthers, E.; Carson, C.A.; Ellender, R.D.; Harwood, V.J.; Kingsley, K.; Nakatsu, C.; Sadowsky, M.; Shear, B.; West, B.; Whitlock, J.E.; Wiggins, B.A.; Wilbur, J.D. Assessment of statistical methods used in library-based approaches to microbial source tracking. J. Water Health 2003, 1, 209–223. [Google Scholar] [PubMed]
  42. North Carolina Department of Environment and Natural Resources. In Classifications and Water Quality Standards Applicable to Surface Water and Wetlands of North Carolina; Division of Water Quality: Raleigh, NC, USA, 1997; p. 41.
  43. Fincher, L.M.; Parker, C.D.; Chauret, C.P. Surface Water Quality: Occurrence and Antibiotic Resistance of Escherichia coli O157:H7 in a Watershed in North-Central Indiana. J. Environ. Qual. 2009, 38, 997–1004. [Google Scholar] [CrossRef] [PubMed]
  44. Burnes, B.S. Antibiotic resistance analysis of fecal coliforms to determine fecal pollution sources in a mixed-use watershed. Environ. Monit. Assess. 2003, 85, 87–98. [Google Scholar] [CrossRef] [PubMed]
  45. Wiggins, B.A.; Andrews, R.W.; Conway, R.A.; Corr, C.L.; Dobratz, E.J.; Dougherty, D.P.; Eppard, J.R.; Knupp, S.R.; Limjoco, M.C.; Mettenburg, J.M.; Rinehardt, J.M.; Sonsino, J.; Torrijos, R.L.; Zimmerman, M.E. Use of antibiotic resistance analysis to identify nonpoint sources of fecal pollution. Appl. Environ. Microbiol. 1999, 65, 3483–3486. [Google Scholar] [PubMed]

