Spatially Explicit Analysis of Water Footprints in the UK
Abstract
:1. Introduction
2. Methodology
2.1. Production and Consumption Water Footprints
2.2. Data
3. Results and Discussion
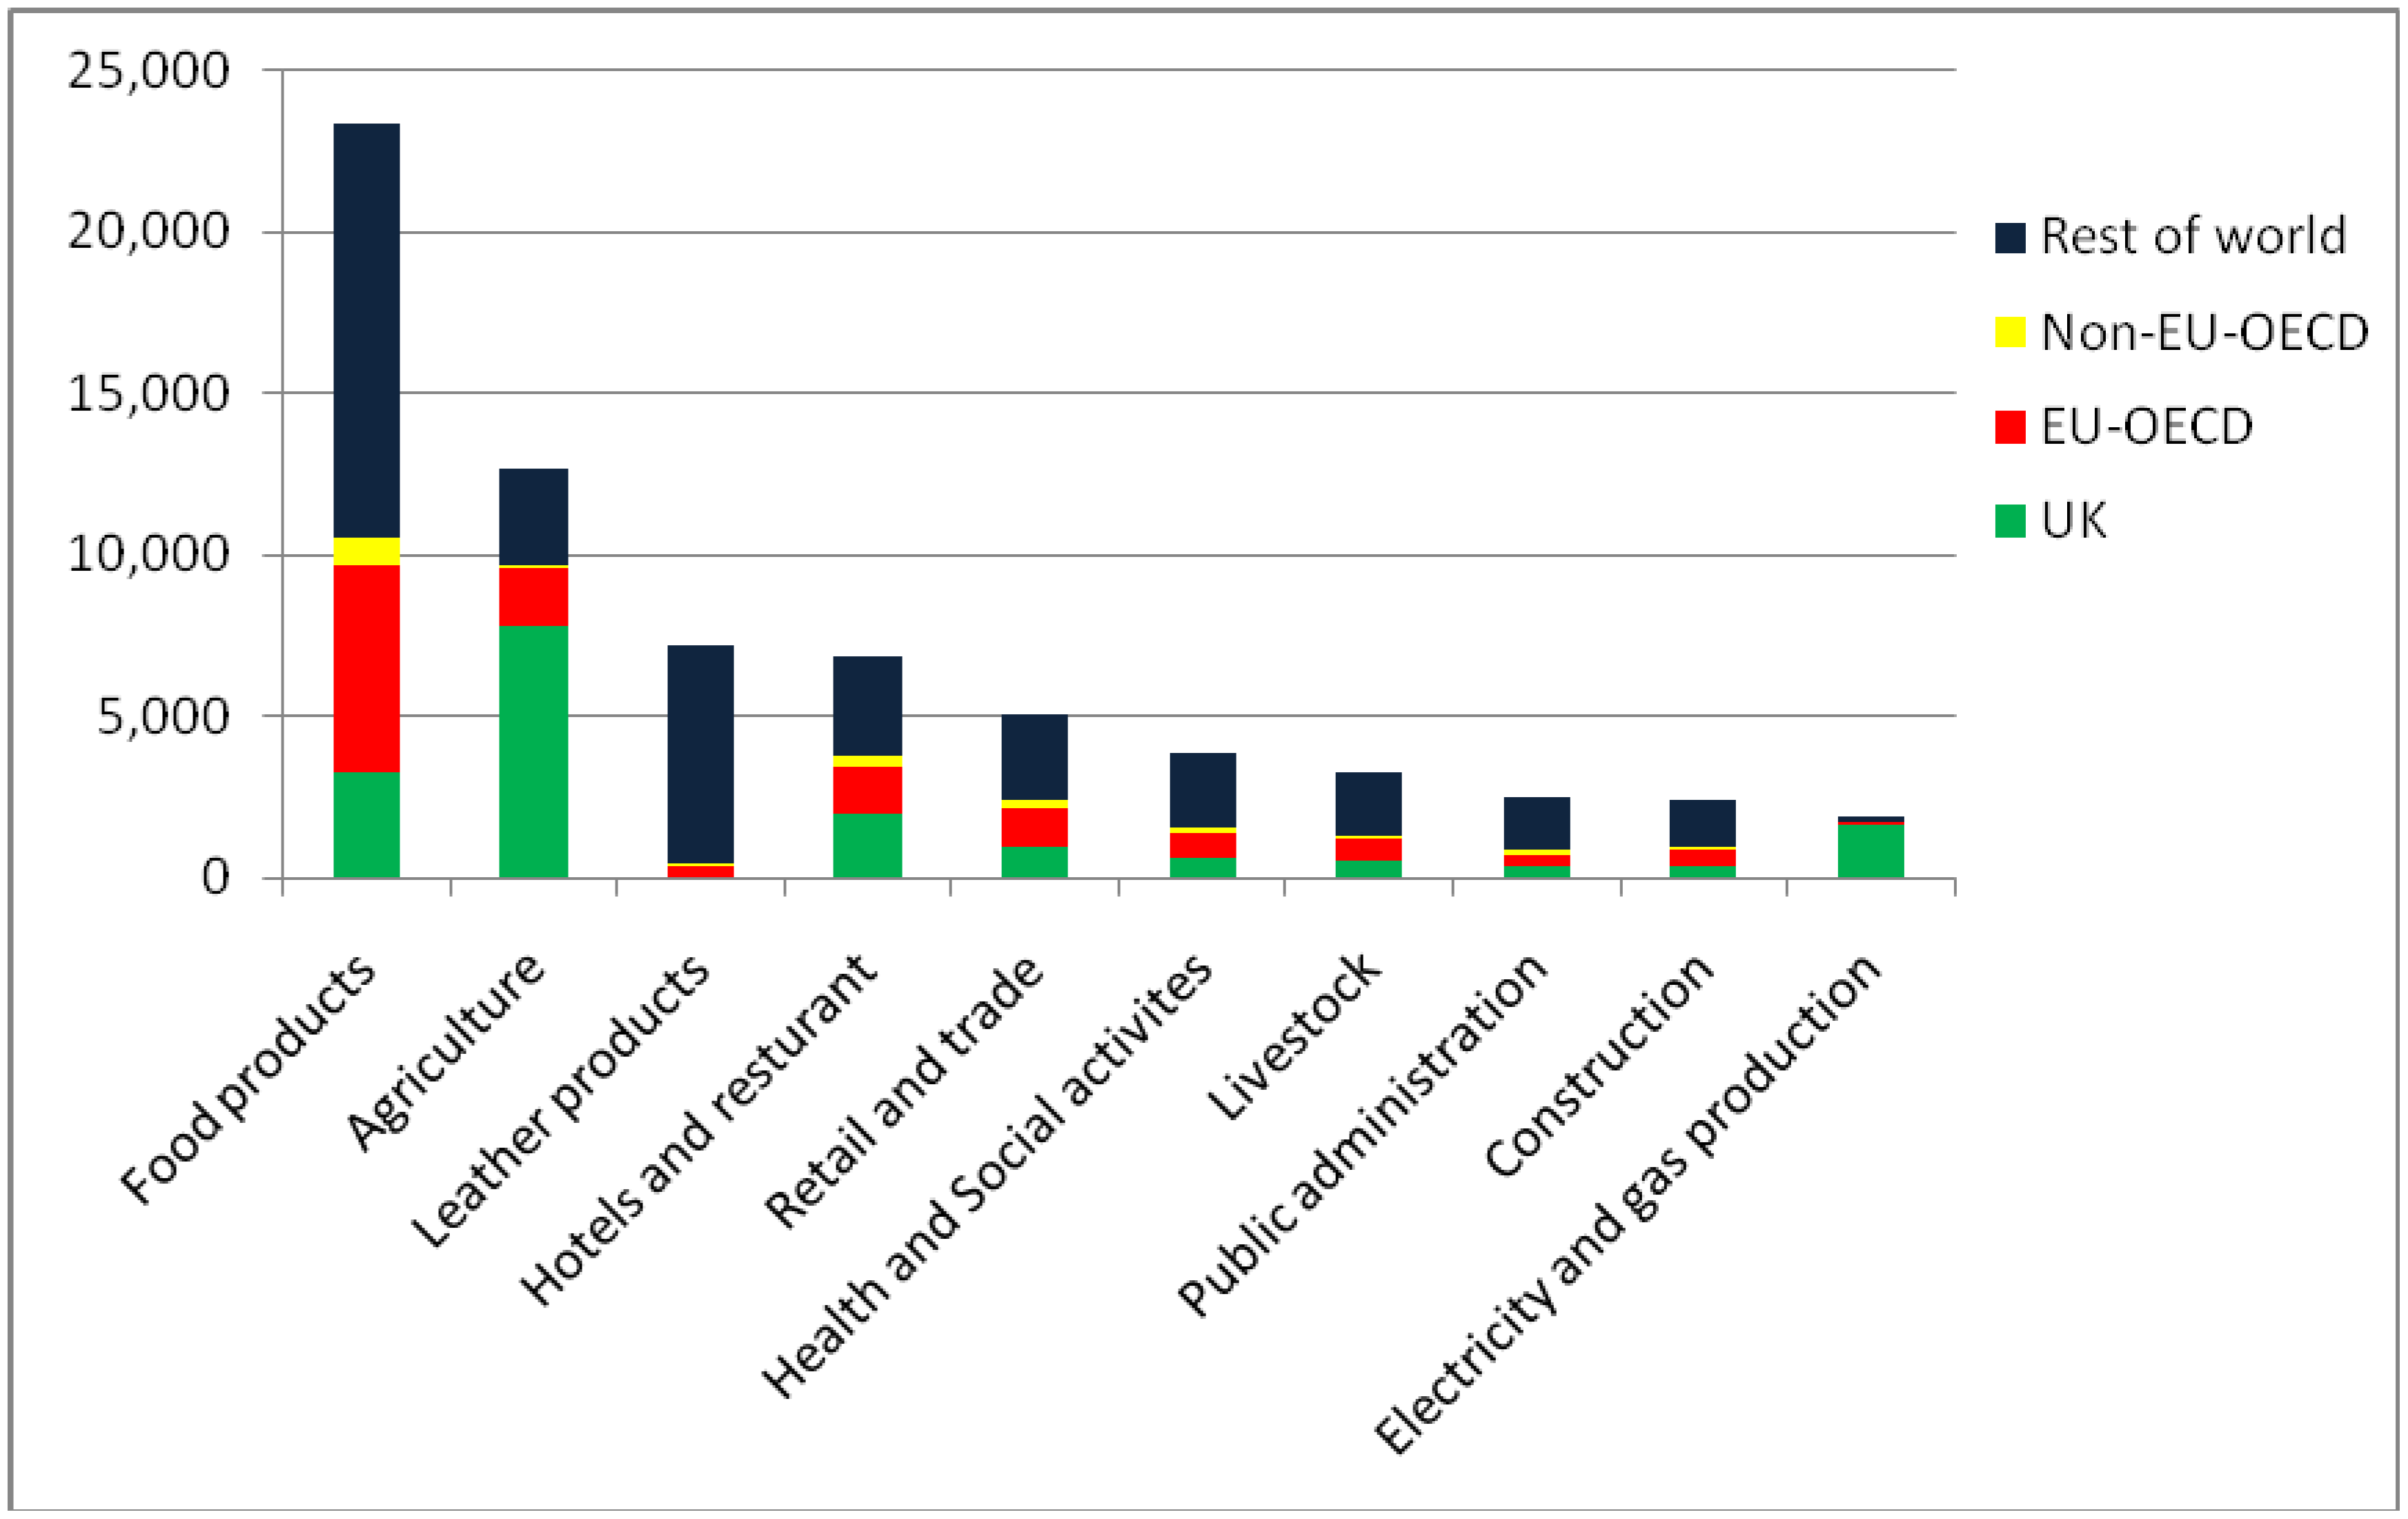
3.1. Production Water Footprint of the UK
| Sectors | DWI | Production water footprints | ||
|---|---|---|---|---|
| Domestic FD | Export | Total | ||
| Agriculture | 1,964.1 | 7,747 | 854 | 8,601 |
| Livestock | 44.3 | 547 | 60 | 607 |
| Forestry | 146.5 | 25 | 9 | 33 |
| Fishing | 1,288.1 | 44 | 506 | 550 |
| Mining | 3.5 | 3 | 85 | 88 |
| Food products | 3.5 | 3,245 | 727 | 3,971 |
| Textiles | 2.0 | 11 | 12 | 24 |
| Leather products | 2.0 | 11 | 22 | 33 |
| Wood products, except furniture | 3.2 | 9 | 4 | 13 |
| Paper, paperboard and publishing | 3.2 | 56 | 45 | 101 |
| Chemicals | 8.1 | 73 | 428 | 501 |
| Non-metal mineral products | 2.5 | 10 | 17 | 26 |
| Metal products | 7.0 | 56 | 154 | 211 |
| Manufacture Machinery | 0.6 | 30 | 85 | 116 |
| Electric machinery | 0.8 | 29 | 101 | 130 |
| Transport equipment | 1.6 | 108 | 183 | 291 |
| Other manufacturing | 2.8 | 53 | 19 | 72 |
| Electricity and gas production | 78.1 | 1,637 | 25 | 1,662 |
| Water supply | 78.1 | 227 | 0 | 227 |
| Construction | 0.1 | 333 | 0 | 333 |
| Retail and trade | 0.8 | 978 | 131 | 1,109 |
| Hotels and restaurants | 0.8 | 1,987 | 219 | 2,206 |
| Transportation | 0.4 | 63 | 49 | 112 |
| Business and finance | 0.4 | 347 | 188 | 535 |
| Public administration | 0.4 | 379 | 1 | 379 |
| Education | 1.0 | 297 | 6 | 303 |
| Health and Social activities | 1.0 | 568 | 0 | 568 |
| Recreational and cultural activities | 0.4 | 156 | 22 | 178 |
| Total | - | 19,029 | 3,948 | 22,977 |
| Production WF per person (m3) | - | 317 | 66 | 383 |
3.2. Consumption Water Footprints of the UK


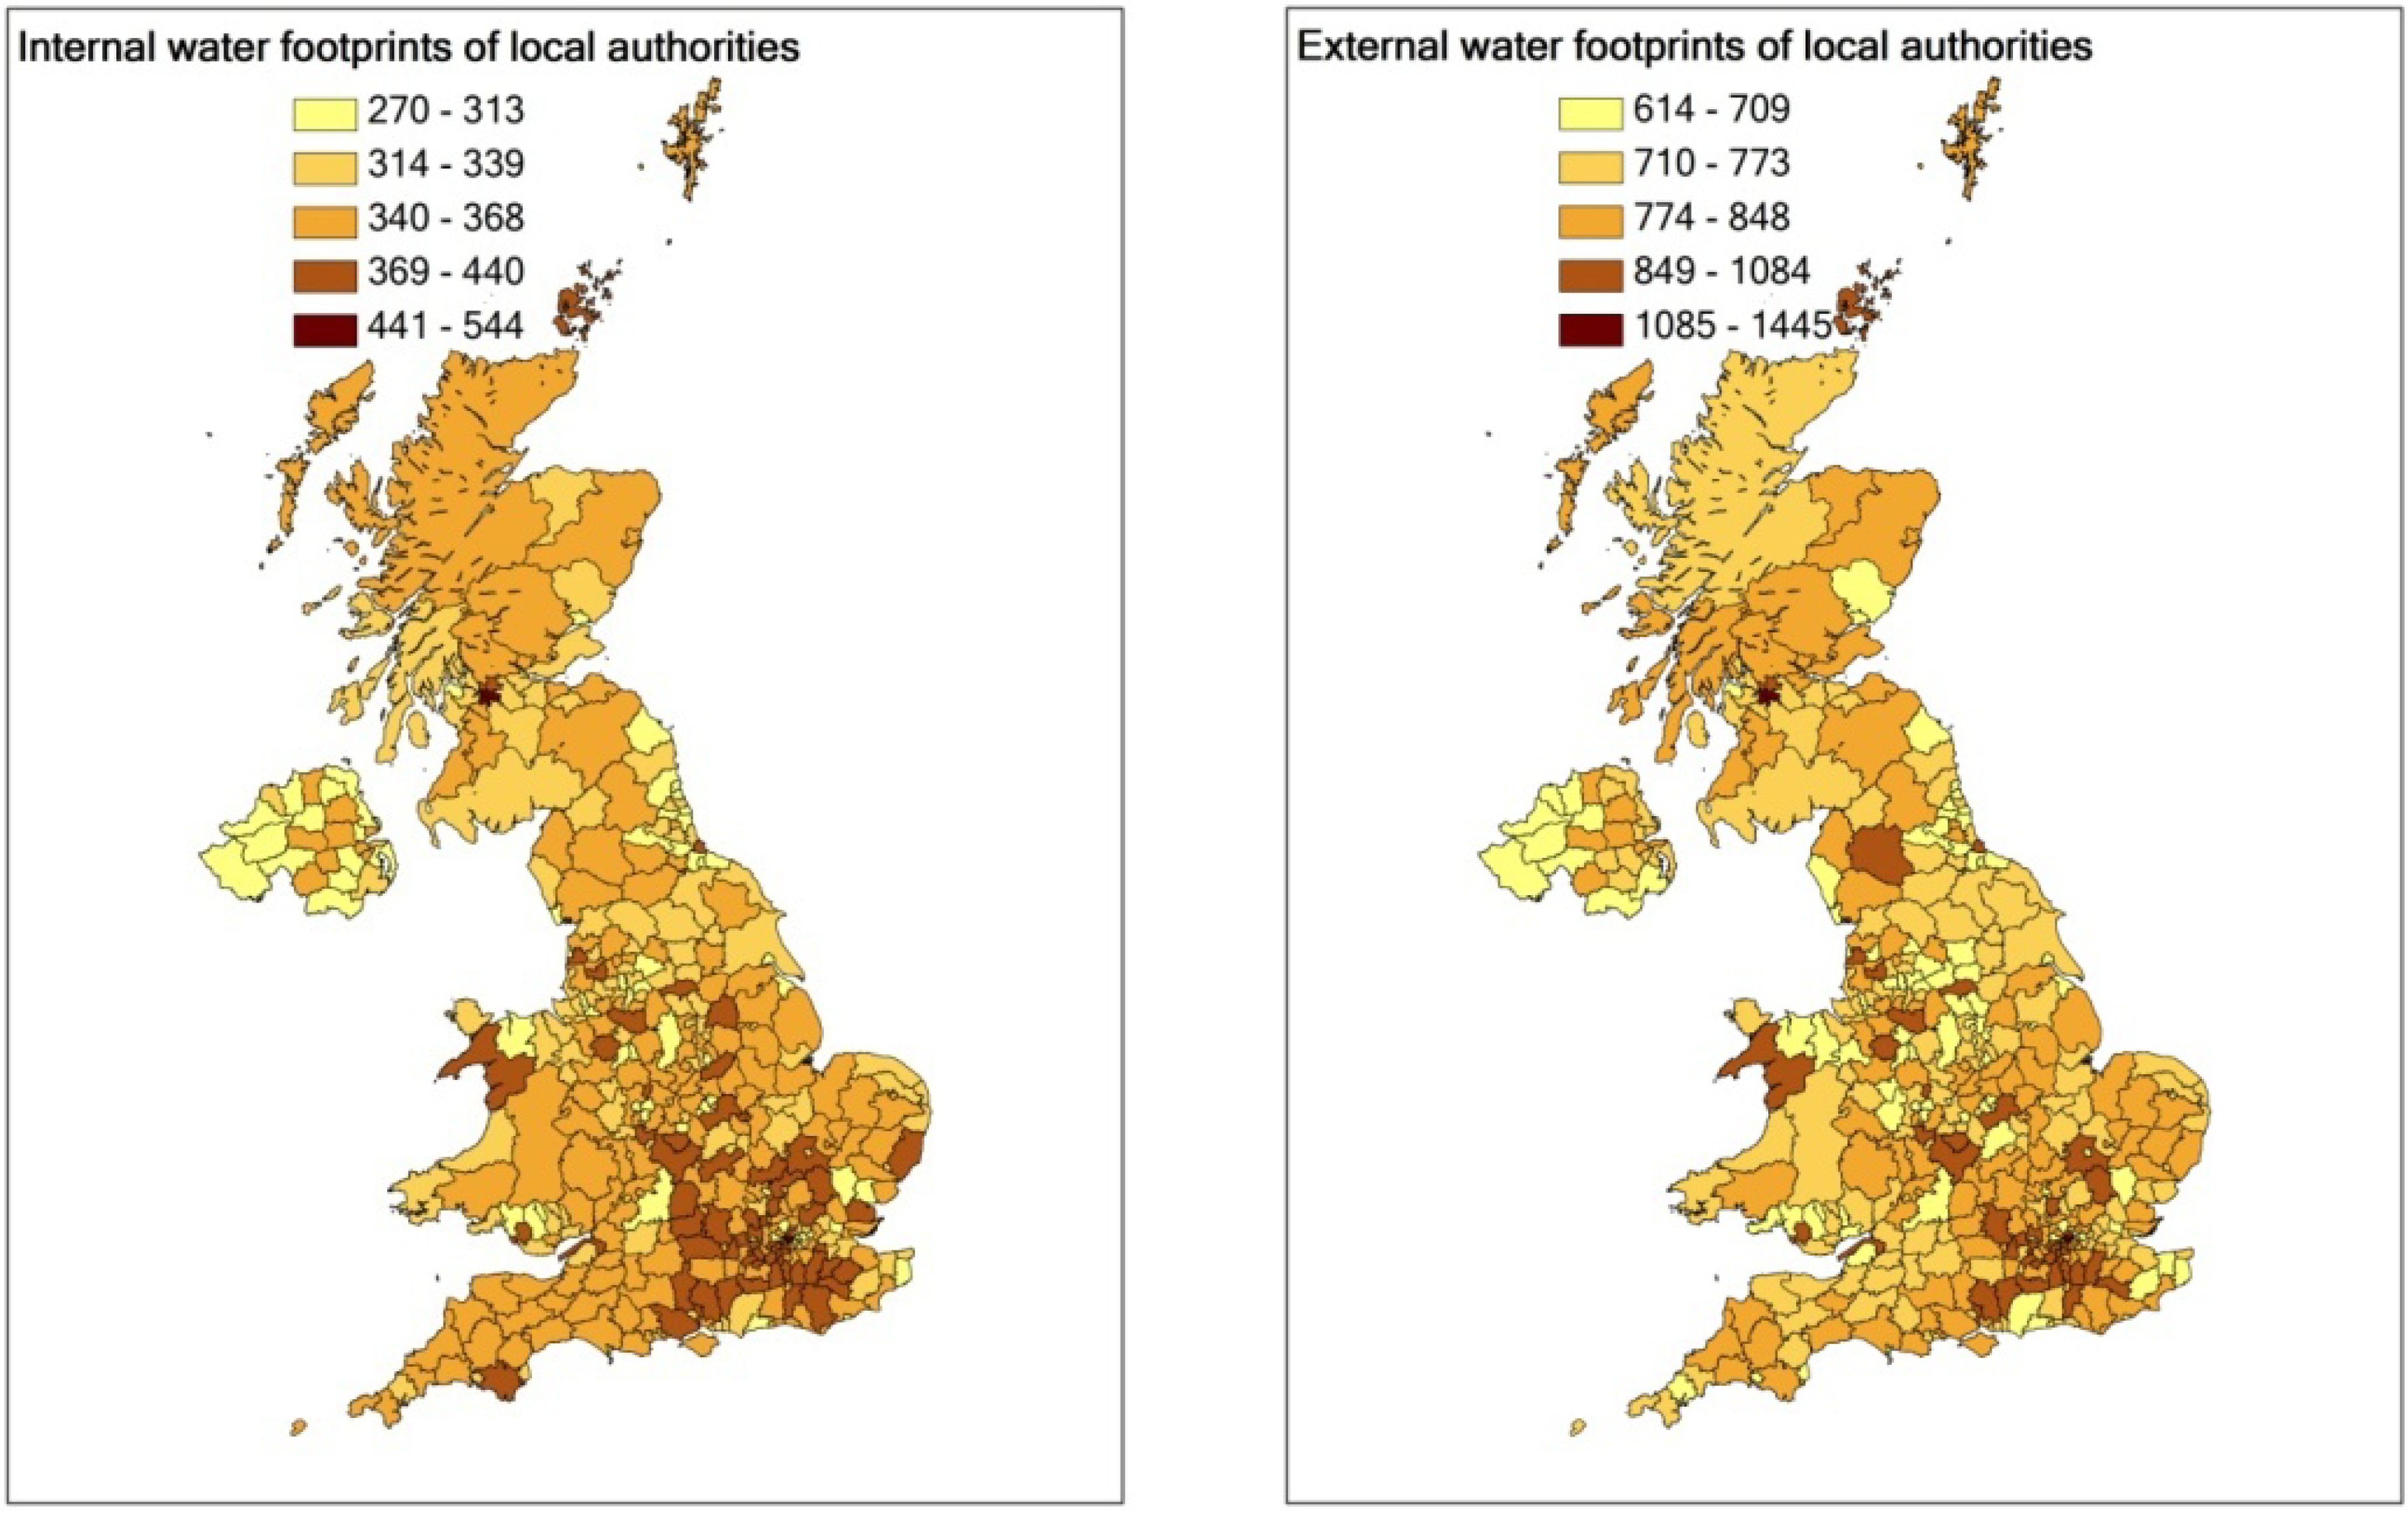
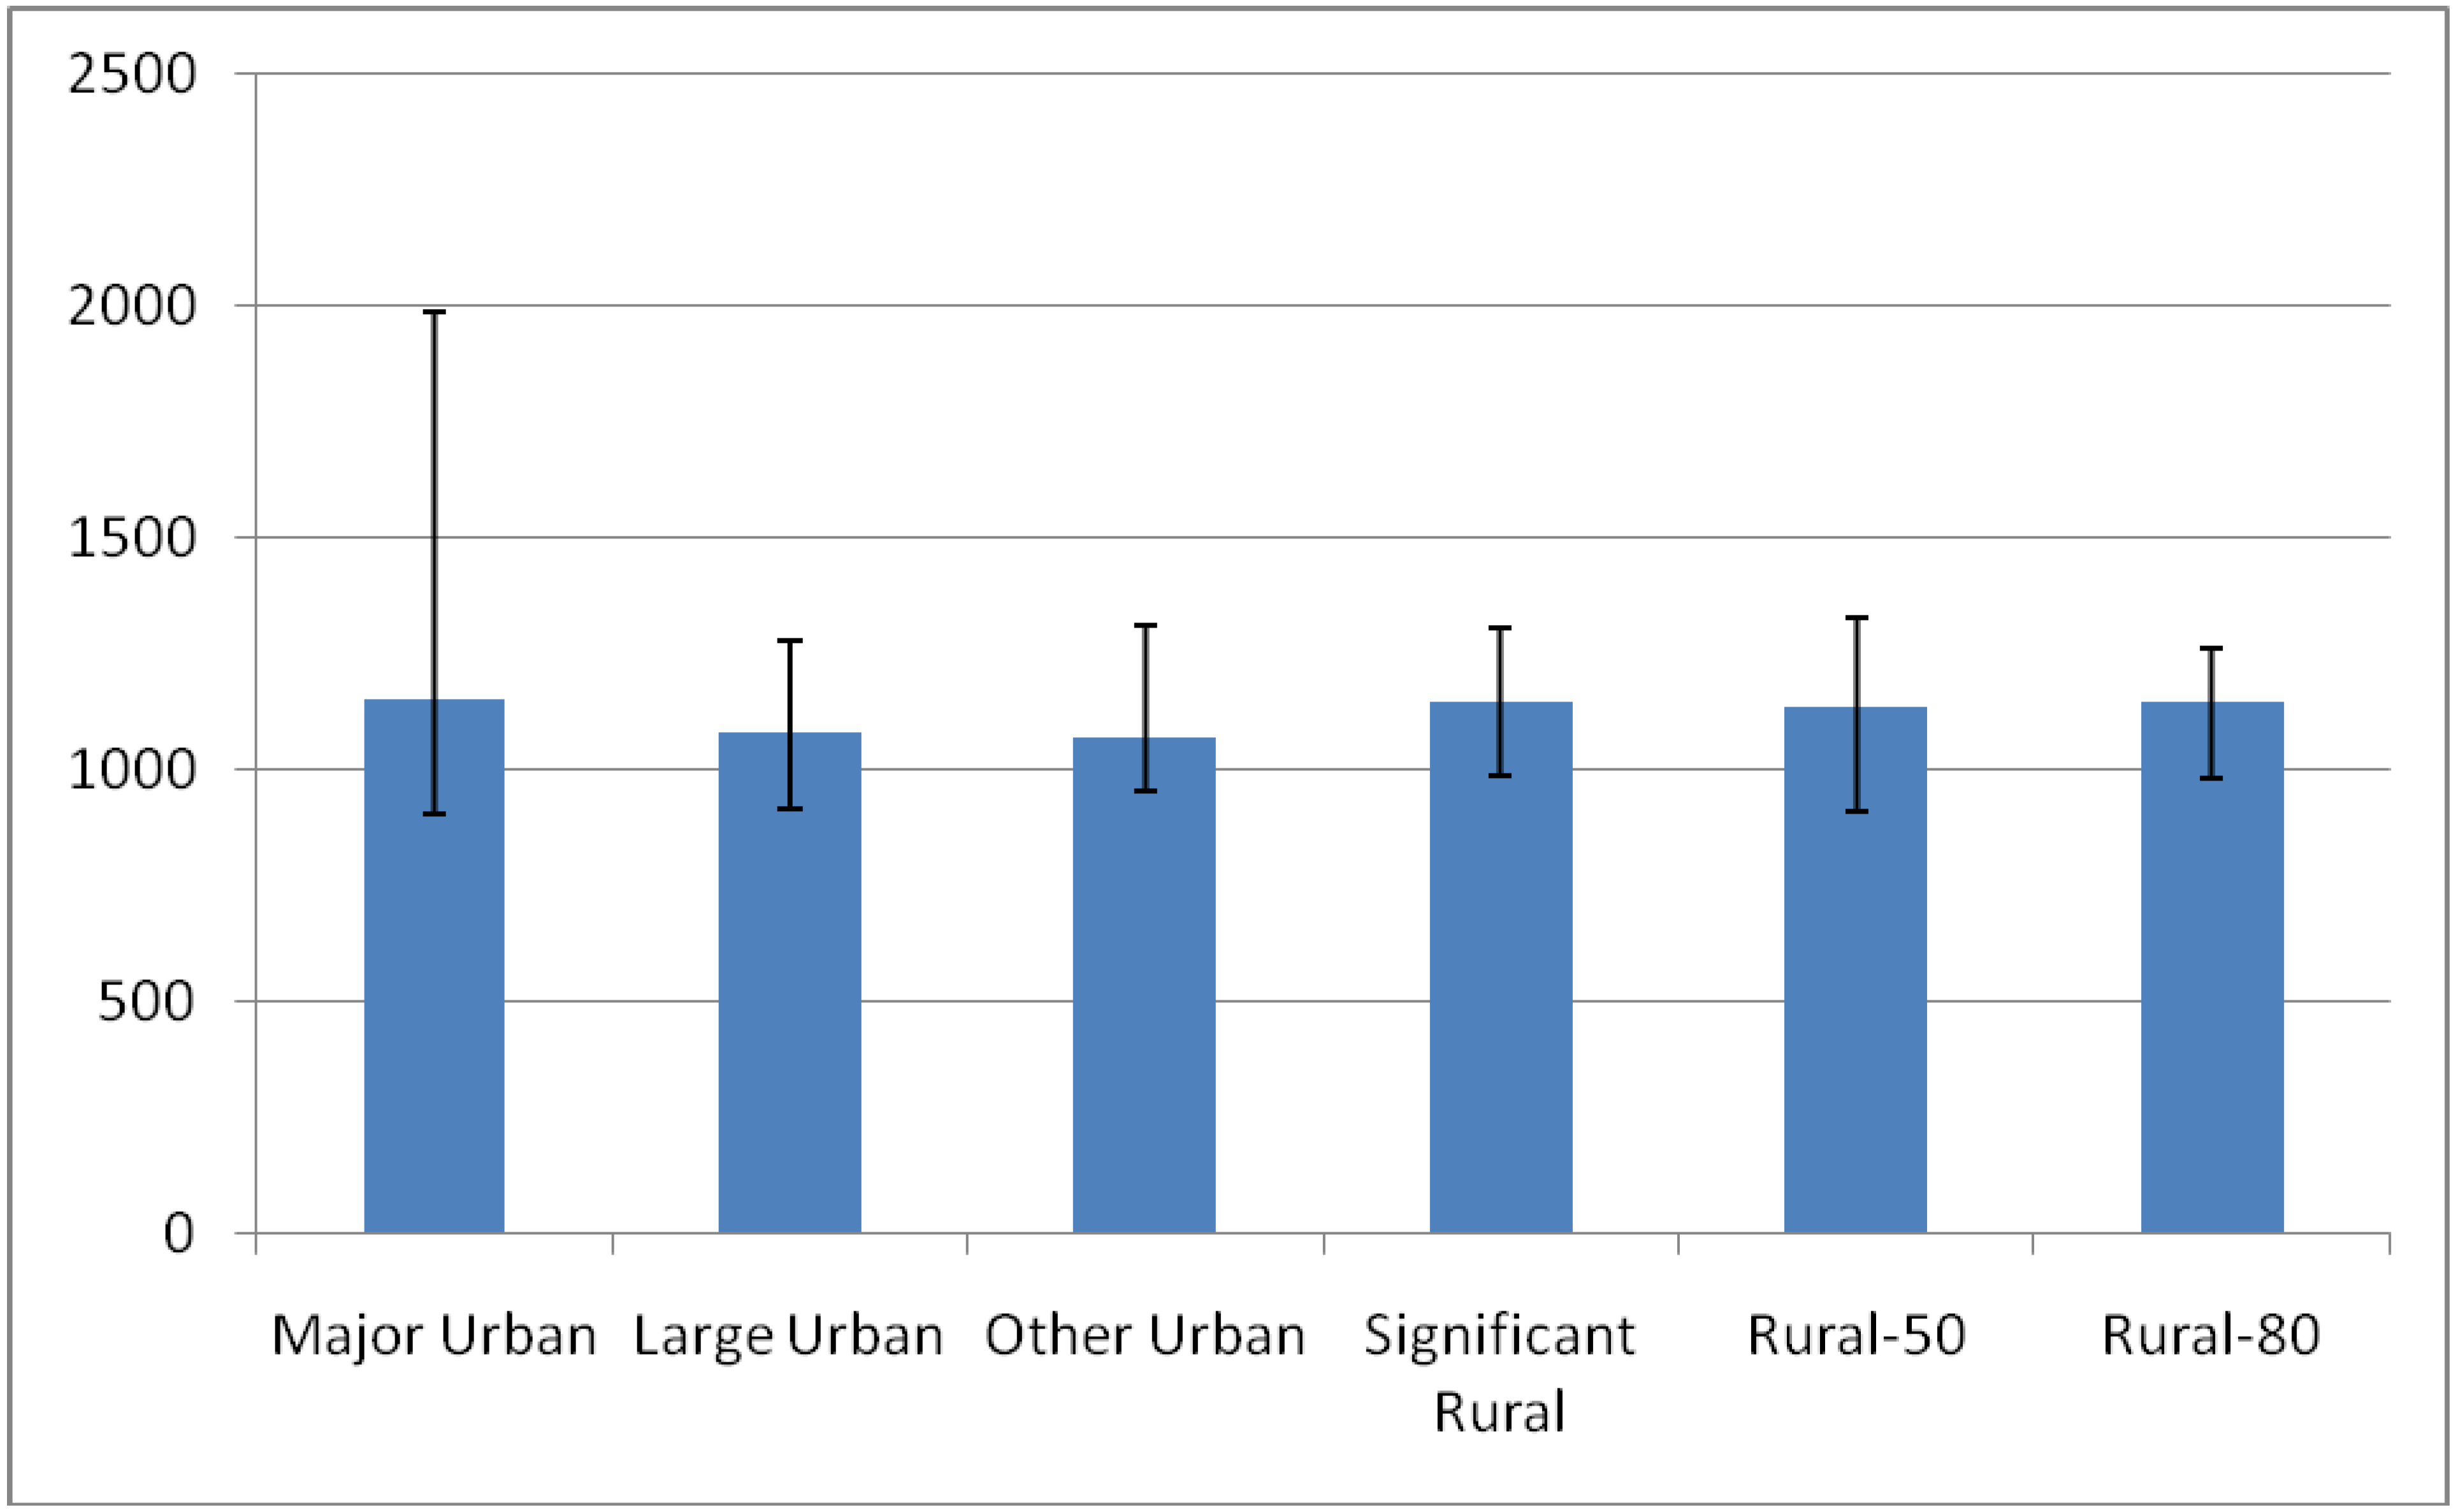
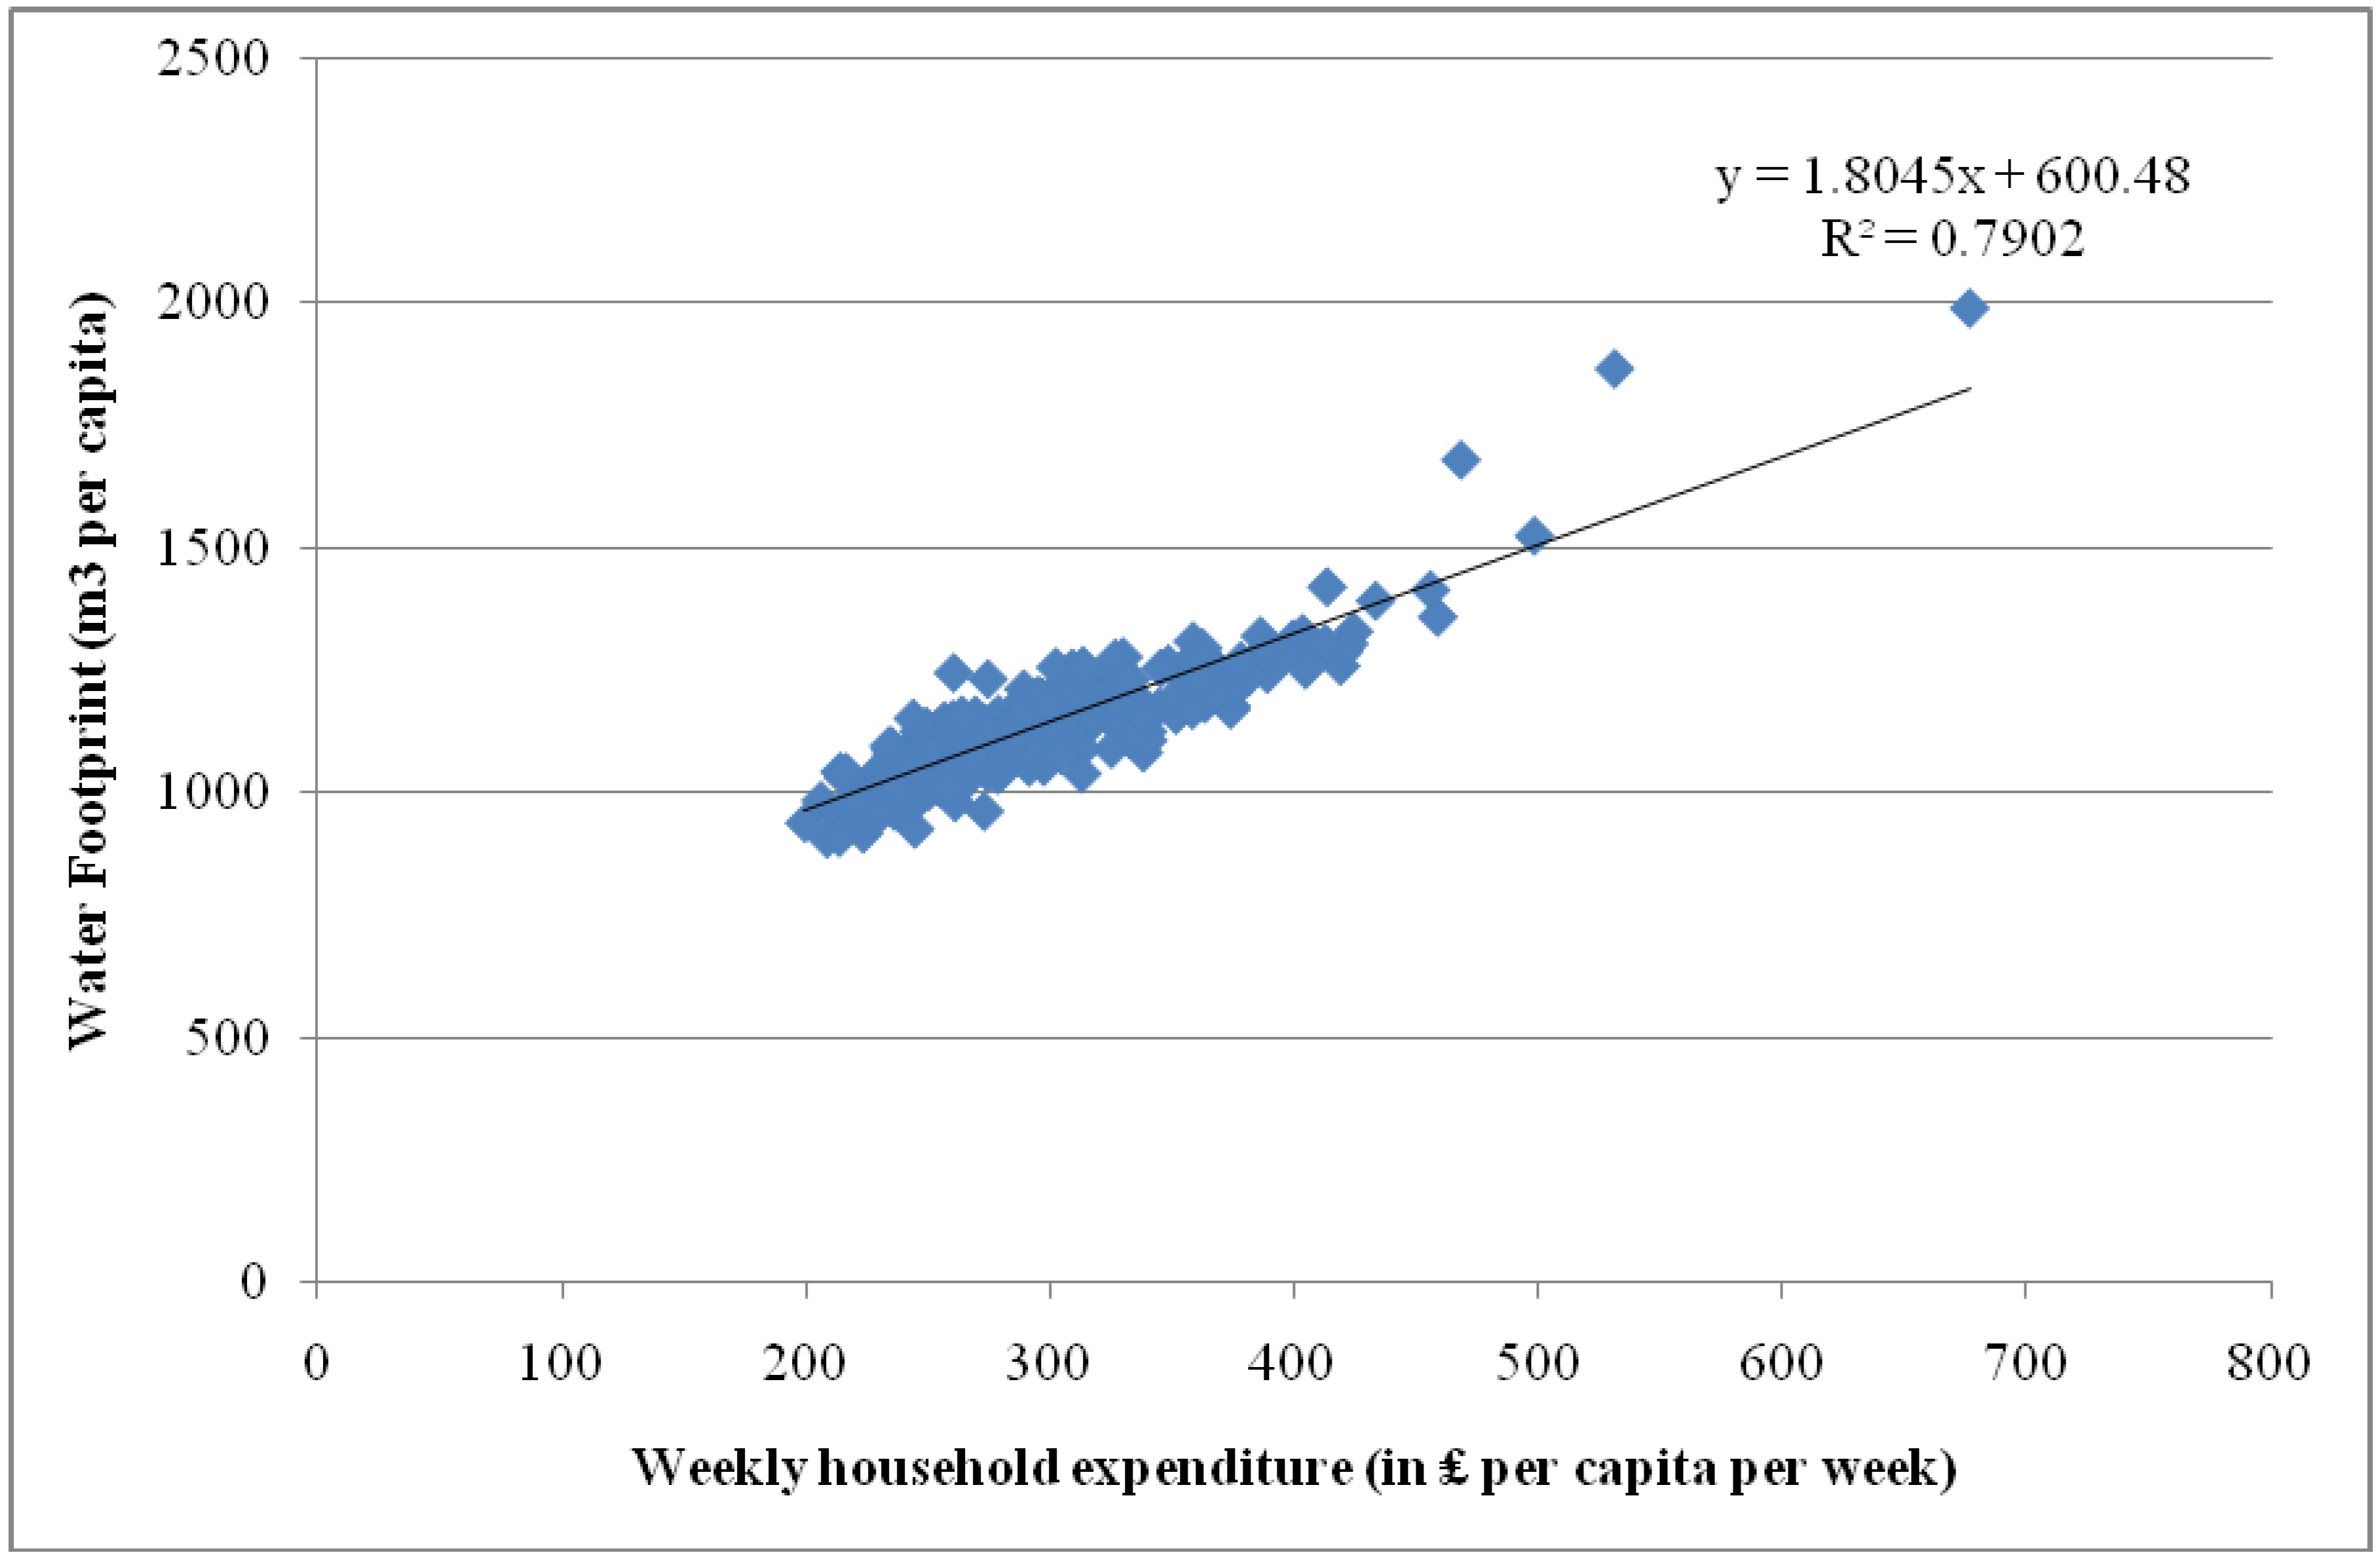
3.3. Spatial Analysis of the UK Water Footprints at Local Level


4. Conclusions
References
- Yu, Y.; Hubacek, K.; Feng, K.; Guan, D. Assessing regional and global water footprints for the UK. Ecol. Econ. 2010, 69, 1140–1147. [Google Scholar] [CrossRef]
- Chapagain, A.K.; Orr, S. UK Water Footprint: The Impact of the UK’s Food and Fibre Consumption on Global Water Resources; WWF-UK: Surrey, UK, 2008. [Google Scholar]
- Hoekstra, A.Y.; Hung, P.Q. Virtual Water Trade: A Quantification of Virtual Water Flows between Nations in relation to International Crop Trade; Institute for Water Education: Delft, The Netherlands, 2002. [Google Scholar]
- Chapagain, A.K. Globalisation of Water: Opportunities and Threats of Virtual Water Trade; A.A. Balkema Publishers, Taylor & Francis Group: Leiden, The Netherlands, 2006. [Google Scholar]
- Hoekstra, A.Y.; Chapagain, A.K. Water footprints of nations: water use by people as a function of their consumption pattern. Water Resour. Manage. 2007, 21, 35–48. [Google Scholar] [CrossRef]
- Hoekstra, A.Y.; Chapagain, A.K. Globalization of Water: Sharing the Planet's Freshwater Resources; Blackwell Publishing: Oxford, UK, 2008. [Google Scholar]
- Hoekstra, A.Y.; Chapagain, A.K.; Aldaya, M.M.; Mekonnen, M.M. Water Footprint Manual: State of the Art 2009; Water Footprint Network: Enschede, The Netherlands, 2009. [Google Scholar]
- Chapagain, A.K.; Hoekstra, A.Y. The global component of freshwater demand and supply: An assessment of virtual water flows between nations as a result of trade in agricultural and industrial products. Water Int. 2008, 33, 19–32. [Google Scholar] [CrossRef]
- Allan, J.A. Virtual water: A strategic resource global solutions to regional deficits. Ground Water 1998, 36, 545–546. [Google Scholar] [CrossRef]
- Hoekstra, A.Y.; Chapagain, A.K. Water footprints of nations: Water use by people as a function of their consumption pattern. Water Resour. Manage. 2007, 21, 35–48. [Google Scholar] [CrossRef]
- Hartman, L.M. The Input-output model and regional water management. J. Farm Econ. 1965, 47, 1583–1591. [Google Scholar] [CrossRef]
- Lenzen, M.; Foran, B. An input–output analysis of Australian water usage. Water Policy 2001, 3, 321–340. [Google Scholar] [CrossRef]
- Vela’zquez, E. An Input–output model of water consumption: Analysing intersectoral water relationships in Andalusia. Ecol. Econ. 2006, 56, 226–240. [Google Scholar] [CrossRef]
- Hubacek, K.; Sun, L. Economic and societal changes in China and its effects on water use. J. Ind. Ecol. 2005, 9, 187–200. [Google Scholar] [CrossRef]
- Guan, D.; Hubacek, K. A new and integrated hydro-economic accounting and analytical framework for water resources: A case study for North China. J. Environ. Manage. 2008, 88, 1300–1313. [Google Scholar] [CrossRef] [PubMed]
- Hubacek, K.; Guan, D.; Barrett, J.; Wiedmann, T. Environmental implications of urbanization and lifestyle change in China: Ecological and water footprints. J. Clean. Prod. 2009, 17, 1241–1218. [Google Scholar] [CrossRef]
- Lenzen, M.; Peters, G.M. How city dwellers affect their resource hinterland. J. Ind. Ecol. 2010, 14, 73–90. [Google Scholar] [CrossRef]
- WWF. Living Planet Report 2008; WWF: Gland, Switzerland, 2008. [Google Scholar]
- WWF. Living Planet Report 2010; WWF: Gland, Switzerland, 2010. [Google Scholar]
- Lenzen, M.; Wood, R.; Wiedmann, T. Uncertainty analysis for Multi-Region Input-Output Models—A case study of the UK’s carbon footprint. Econ. Syst. Res. 2010, 22, 43–63. [Google Scholar] [CrossRef]
- Minx, J.C.; Wiedmann, T.; Wood, R.; Peters, G.P.; Lenzen, M.; Owen, A.; Scott, K.; Barrett, J.; Hubacek, K.; Baiocchi, G.; Paul, A.; Dawkins, E.; Briggs, J.; Guan, D.; Suh, S.; Ackerman, F. Input-output analysis and carbon footprinting: An overview of applications. Econ. Syst. Res. 2009, 21, 187–216. [Google Scholar] [CrossRef]
- Wiedmann, T.; Wood, R.; Minx, J.; Lenzen, M.; Guan, D.; Harris, R. A carbon footprint time series of the UK—Results from a Multi-Region Input-Output Model. Econ. Syst. Res. 2010, 22, 19–42. [Google Scholar] [CrossRef]
- Andrew, R.; Peters, G.P.; Lennox, J. Approximation and regional aggregation in multi-regional input-output analysis for national carbon footprint accounting. Econ. Syst. Res. 2009, 21, 311–335. [Google Scholar] [CrossRef]
- Lee, H.L.; Hertel, T.; Sohngen, B.; Ramankutty, N. Towards an Integrated Data Base for Assessing the Potential for Greenhouse Gas Mitigation; GTAP Technical Paper No. 25; The Methane and Sequestration Branch of the US Environmental Protection Agency (USEPA): West Lafayette, IN, USA, 2005.
- Narayanan, B.; Walmsley, T. Global Trade, Assistance, and Production: The GTAP 7 Data Base; Center for Global Trade Analysis, Purdue University: West Lafayette, IN, USA, 2008. [Google Scholar]
- European Commission. Water Accounts: Results of Pilot Studies; Office for Official Publications of the European Communities: Luxemburg, 2002. [Google Scholar]
- Australian Bureau of Statistics Water Accounts; Australian Government, National Water Commission: Canberra, Australia, 2006.
- China National Statistic Office. China Statistical Yearbook 2006; China Statistics Press: Beijing, China, 2006. [Google Scholar]
- Chapagain, A.K.; Hoekstra, A.Y. Virtual Water Flows between Nations in Relation to Trade in Livestock and Livestock Products; Value of Water Research Report Series 13; UNESCO-IHE, Institue for Water Education: Delft, The Netherlands, 2003. [Google Scholar]
- Mosaic United Kingdom—The Consumer Classification for the UK; Experian: Nottingham, UK, 2008.
- Water, a Shared Responsiblity; United Nations Educational, Scientific and Cultural Organization: Paris, France, 2006.
- Falkenmark, M.; Lannerstad, M. Consumptive water use to feed humanity—curing a blind spot. Hydrol. Earth Syst. Sci. Discuss. 2004, 1, 7–40. [Google Scholar] [CrossRef]
- Water Resources in England and Wales—Current State and Future Pressures; GEHO1208BPAS-E-E; Environment Agency: Bristol, UK, 2008.
- Water Scarcity; European Environment Agency (EEA): Copenhagen, Denmark, 2010. Available online: http://www.eea.europa.eu/themes/water/featuredarticles/water-scarcity (accessed on 13 December 2010).
- Water Demand Management Bulletin; Enviroment Agency: Rotherham, UK, 2010. Available online: http://www.environment-agency.gov.uk/business/news/103450.aspx (accessed on 13 December 2010).
- Kennedy, C.; Steinberger, J.; Gasson, B.; Hansen, Y.; Hillman, T.; Havránek, M.; Pataki, D.; Phdungsilp, A.; Ramaswami, A.; Mendez, G.V. Greenhouse gas emissions from global cities. Environ. Sci. Technol. 2009, 43, 7297–7302. [Google Scholar] [CrossRef] [PubMed]
- Minx, J.; Creutzig, F.; Medinger, V.; Ziegler, T.; Owen, A.; Baiocchi, G. Developing a Progmatic Approach to Assess Urban Metabolism in Europe; A Report to the European Environment Agency; Stockholm Environment Institute, The University of York: York, UK; Technische Universität Berlin: Berlin, Germany, 2010. [Google Scholar]
- Defra Classification of Local Authority Districts and Unitary Authorities in England—An Introductory Guide; Department for Environment Food and Rural Affairs: York, UK, 2009.
- Wilkinson, R.; Pickett, R. The Spirit Level: Why More Equal Societies Almost Always Do Better; Allen Lane: London, UK, 2009. [Google Scholar]
Appendix
| Min | Max | Average | SD | |||
|---|---|---|---|---|---|---|
| 1 | Major Urban | Districts with either 100,000 people or 50% of their population in an urban area of more than 750,000 | 906 | 1,988 | 1,149 | 194 |
| 2 | Large Urban | Districts with either 50,000 people or 50% of their population in one of the 17 urban areas of the UK with a population between 250,000 and 750,000 | 916 | 1,277 | 1,080 | 84 |
| 3 | Other Urban | Districts with fewer than 37,000 people and more than 26% of their population in rural settlements and large market towns | 952 | 1,313 | 1,066 | 78 |
| 4 | Significant Rural | Districts with more than 37,000 people and more than 26% of their population in rural settlements and market towns. | 988 | 1,304 | 1,143 | 83 |
| 5 | Rural-50 | District with at least 50% but less than 80% of their population in rural settlements and larger market towns | 909 | 1,329 | 1,135 | 84 |
| 6 | Rural-80 | Districts with at least 80% of their population in rural settlements and larger market towns | 982 | 1,262 | 1,146 | 59 |
© 2010 by the authors; licensee MDPI, Basel, Switzerland. This article is an open access article distributed under the terms and conditions of the Creative Commons Attribution license (http://creativecommons.org/licenses/by/3.0/).
Share and Cite
Feng, K.; Hubacek, K.; Minx, J.; Siu, Y.L.; Chapagain, A.; Yu, Y.; Guan, D.; Barrett, J. Spatially Explicit Analysis of Water Footprints in the UK. Water 2011, 3, 47-63. https://doi.org/10.3390/w3010047
Feng K, Hubacek K, Minx J, Siu YL, Chapagain A, Yu Y, Guan D, Barrett J. Spatially Explicit Analysis of Water Footprints in the UK. Water. 2011; 3(1):47-63. https://doi.org/10.3390/w3010047
Chicago/Turabian StyleFeng, Kuishuang, Klaus Hubacek, Jan Minx, Yim Ling Siu, Ashok Chapagain, Yang Yu, Dabo Guan, and John Barrett. 2011. "Spatially Explicit Analysis of Water Footprints in the UK" Water 3, no. 1: 47-63. https://doi.org/10.3390/w3010047
APA StyleFeng, K., Hubacek, K., Minx, J., Siu, Y. L., Chapagain, A., Yu, Y., Guan, D., & Barrett, J. (2011). Spatially Explicit Analysis of Water Footprints in the UK. Water, 3(1), 47-63. https://doi.org/10.3390/w3010047


