1. Introduction
In the Middle East, a region with one of the lowest water availabilities per capita worldwide, the steadily growing water demand leads to political, socio-economic and environmental problems. Water consumption for agricultural purposes exceeds all other sectors. Hence, there is an increasing need for water reuse and irrigation of agricultural crops with treated wastewater (TWW) [
1]. This practice carries a variety of risks and challenges for sustainable land use and agriculture [
2,
3,
4,
5]. Most of the published studies have focused on the impact of TWW irrigation on soils, crops, the environment, or human health [
6,
7,
8,
9]. The approach of conducting a spatial soil suitability study for TWW reuse based on soil sensitivities is rather unusual and innovative. The research subgroup “Green water management” within the multinational joint research project network GLOWA (Global Change and the Hydrological Cycle) Jordan River has worked on the analysis of soil units and soil properties in large parts of the Jordan River catchment and adjacent areas, with the aim of developing a regional based land evaluation for TWW reuse in the region. Hence, the goal of our study was (1) to identify and define significant agricultural and environmental risks; (2) to provide sensitivity maps (low, moderate, and high sensitivity) for each of the identified risk categories; and (3) to aggregate these maps into a total sensitivity map displaying the total sensitivity of soil and groundwater as a result of agricultural TWW reuse by weighting each sensitivity category based on its comparative relevance.
2. Methods and Results
The methodical approach of the survey was conducted in two parallel processes. As there no supraregional spatial data about soil properties was available, a new set of data has been created. Available national soil maps have been taken or digitalized and matched with a small-scaled transboundary map. The soil units of these maps were subsequently attributed with allocated soil properties, e.g., regarding soil texture, organic matter content (OM), pH. The other process has been the definition of major agricultural and environmental threats, their assessment and visualization.
2.1. Database
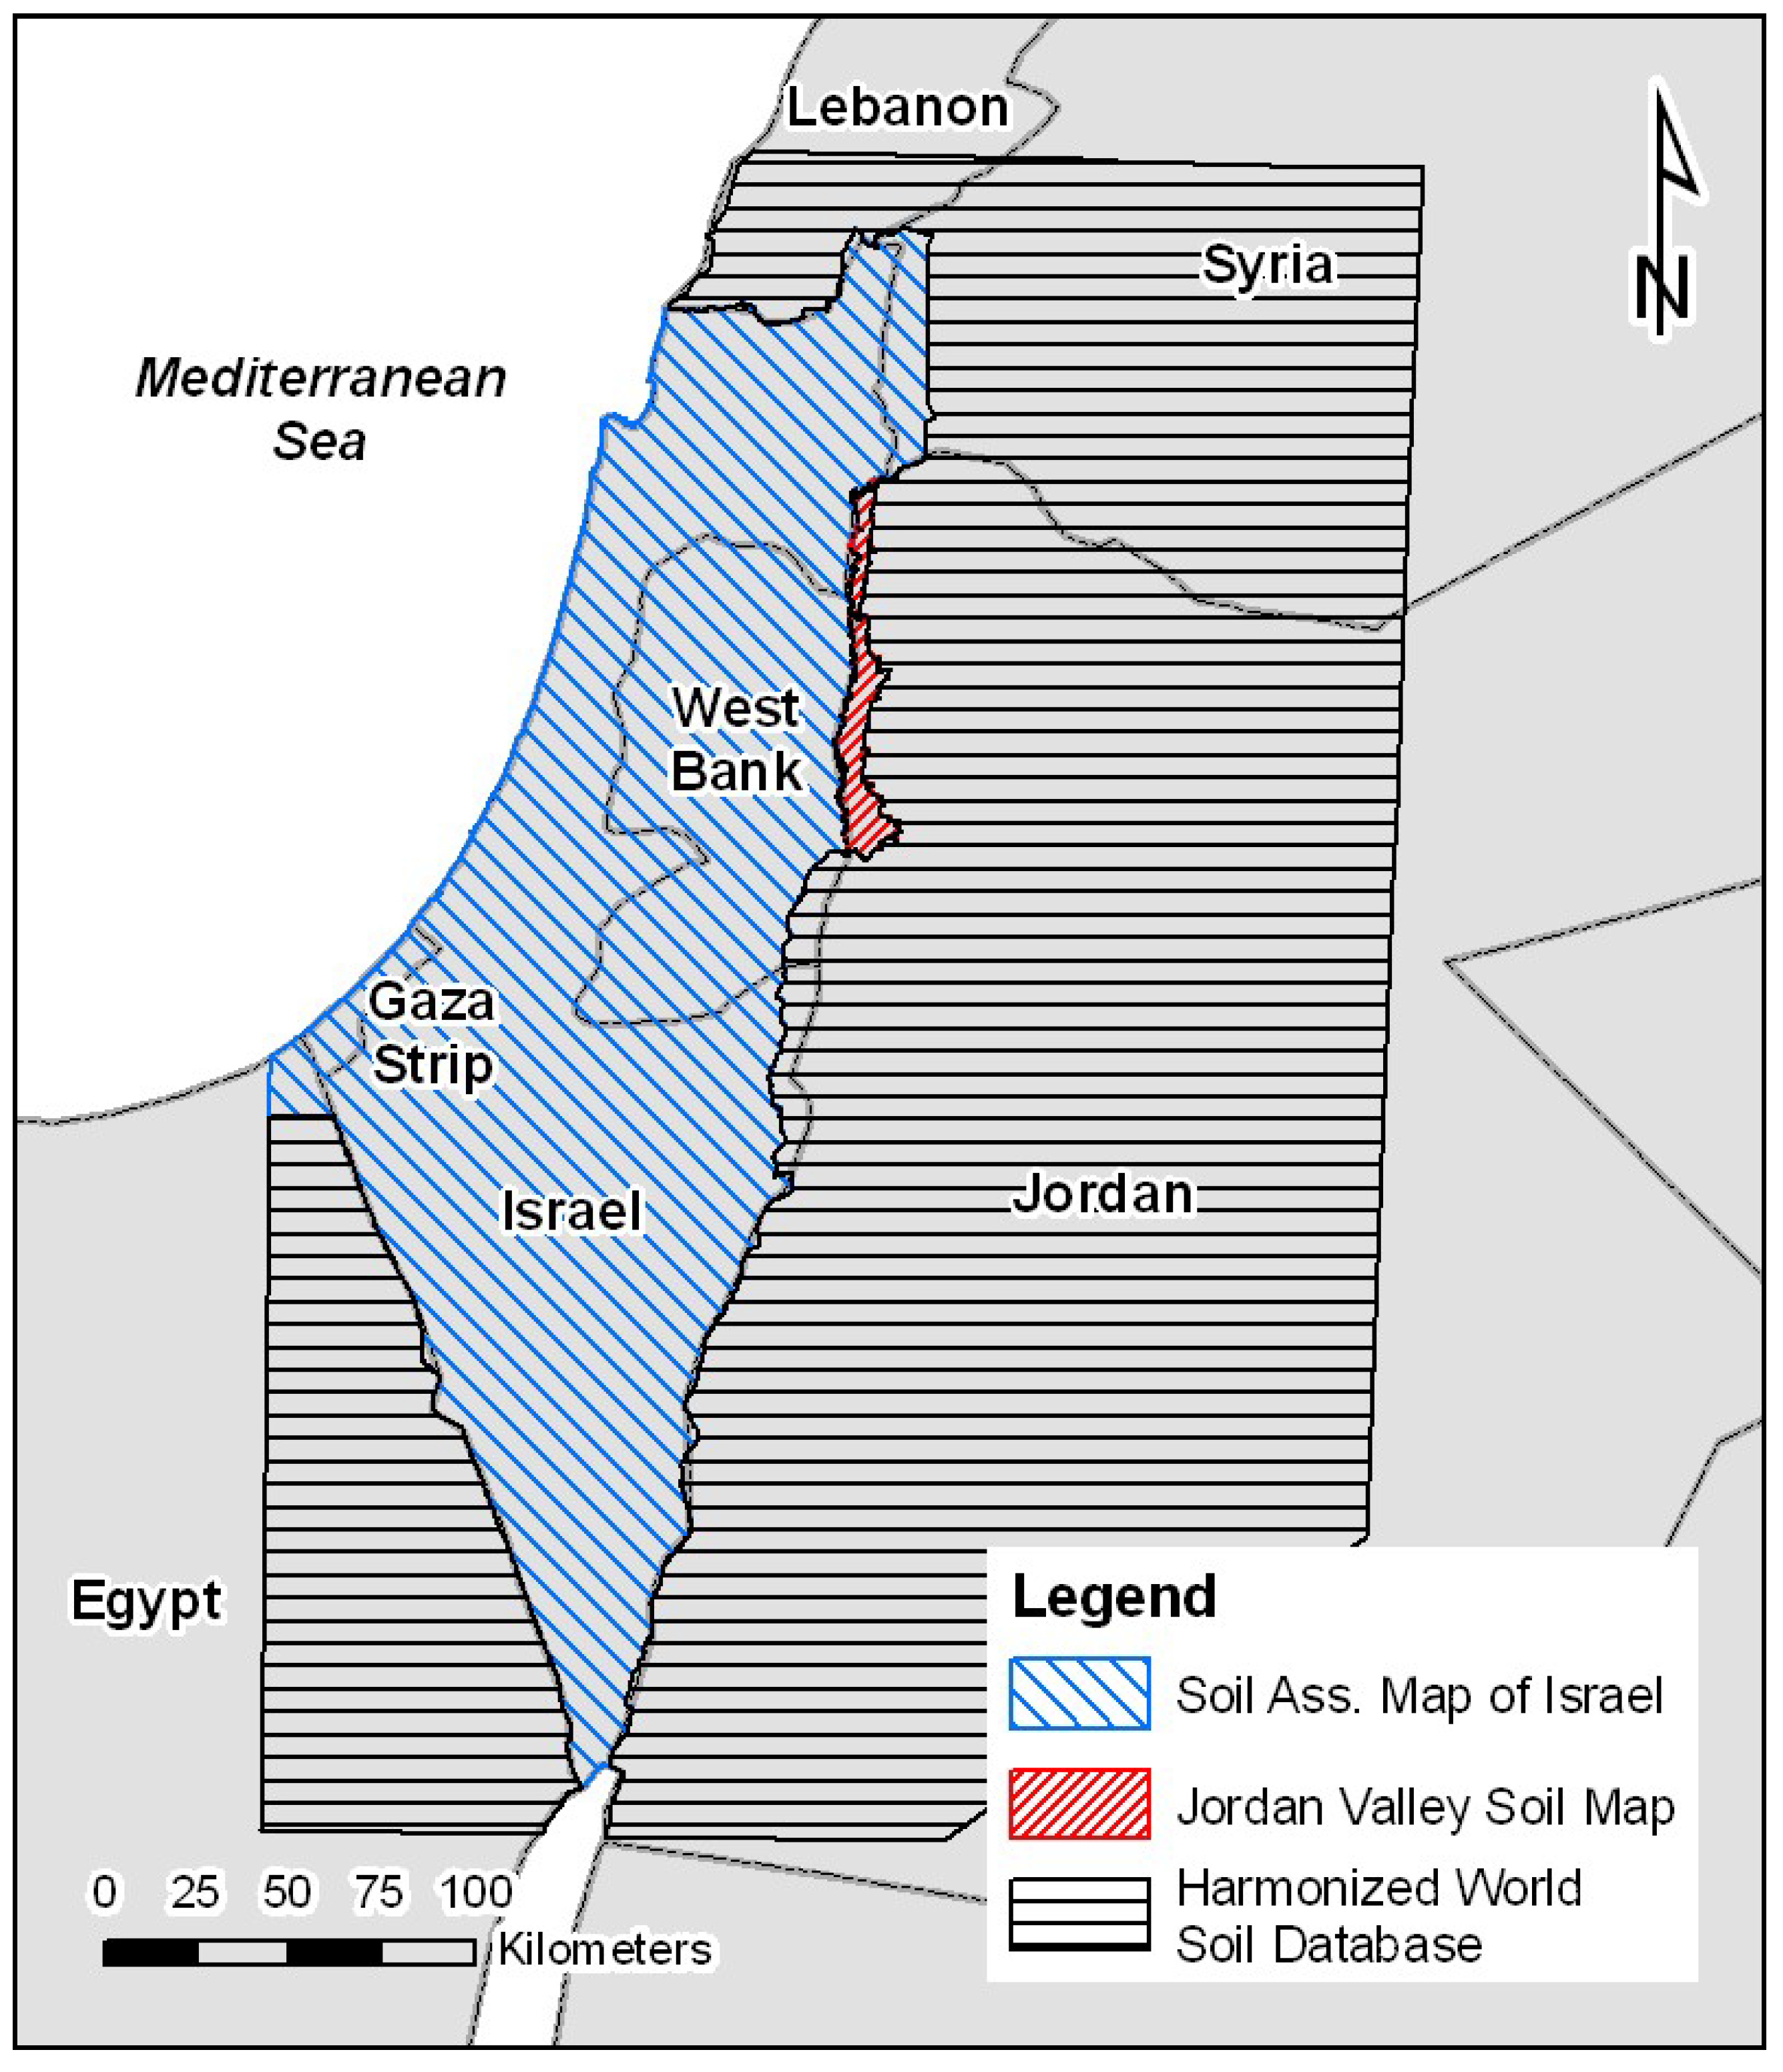
For the evaluation and the conducting of the sensitivity assessment, the following three different sources of soil information have been joined using GIS (ESRI ArcGIS 9.3). All three were harmonized and slightly adjusted if necessary. The coverage of the map sources is described in
Figure 1. The area of interest was chosen according to the areas of interest of the other workgroups within the Jordan River basin and the adjacent region where irrigated agriculture is commonly practiced.
2.1.1. Soil Association Map of Israel
The “Soil Association Map of Israel” compiled in 1972 [
10] comprehensively covers the area of Israel, Gaza, the West Bank, parts of the Golan Heights and the Sinai and was used for the area depicted in
Figure 1. The soil associations are defined as “geographical associations of the listed soil units which are distributed in a landscape segment according to a definite pattern related to the physiographic, lithologic and microclimatic conditions” [
10]. The scale of the underlying soil surveying and mapping campaigns, which were conducted mainly in the 1950s and 1960s, ranges between 1:20,000 for the northern parts, 1:50.000 for the Golan Heights and 1:100,000 for the areas south of Be’er Sheva/Arad. Based on literature data [
11,
12,
13], mean physical and chemical soil characteristics for two depths (topsoil (0–30 cm) and subsoil (>30 cm)) were allocated to the respective soil associations. Information about soil properties, such as texture, organic matter content (OM), CaCO
3-content, bulk density or pH-values (H
2O) were matched to the spatial information of soil associations given by the digital soil map wherever possible. In doing so, the information about soil properties from particular soil profiles taken from literature has been averaged if necessary and was linked to the corresponding soil association. Although this does not represent the heterogeneity of soil properties and does not reflect the possible variability of soils within an association, it was performed knowing that there was no information with higher spatial specification and resolution available. Since 2008, several comprehensive interviews with local experts have taken place to improve the database. Some associations could not be attributed sufficiently due to the lack of pedological information, but these associations are mostly not relevant for irrigation or agricultural production.
2.1.2. Jordan Valley Soil Map
The soil map of the middle and lower Jordan Valley was compiled in 2010. The soil units and their extent were derived from older regional soil maps which were compiled on a scale of 1:50,000 by Dar al-Handsah, a private company, in the late 1950s and early 1960s. As these maps are the only detailed soils maps for the Jordan Valley, they were digitized and matched with the associated soil properties from recent soil field surveys and analysis (more than 1200 soil profile records) carried out by the Jordan Valley Authority (1988–2005). The map covers the area from the Yarmuk River in the north to the Dead Sea in the south. The soil properties are given for three depths (0–30 cm, 30–60 cm, 60–90 cm). For means of harmonization with the other sources, the values of the lower two depths have been averaged.
2.1.3. Harmonized World Soil Database
Due to the fact that no nationwide soil information was available for Jordan, the information for missing areas was taken from the Harmonized World Soil Database [
14]. Its soil information for the Middle East region is taken from the FAO “Digital Soil Map of the World”, which has been compiled in a 1: 5,000,000 scale. The Harmonized World Soil Database provides small-scale worldwide soil information. The soil properties are given in two depths: topsoil (0–30 cm) and subsoil (30–100 cm).
2.1.4. Harmonization of the Generated Database
The soil physical and chemical characteristics of the particular maps were aligned. Due to the partly slightly incoherent course of limits between mapping units, the soil properties from both intersecting soil units were averaged. Gaps were filled with the soil information from the Harmonized World Soil Database. The greater Jordanian region has been displayed using the Harmonized World Soil Database.
2.1.5. Additional Information
An assessment of groundwater sensitivity was available for Israel, Gaza and the West Bank [
15] and was merged with the respective soil map after harmonization and matching with the database. Further physical soil parameters were derived in accordance with German standard methods and pedotransfer functions (field capacity (FC), available water capacity (AWC), effective rooting depth, field capacity in the root zone (FC
RD), hydraulic conductivity (K)) [
16]. This took into account the slightly divergent texture size classes of the German texture classification and the regionally applied USDA system. A raster data set on a 1 km x 1 km spatial resolution including information on leaching rates according to external modeling results based on spatial information of field capacity, rainfall and evapotranspiration was integrated. These results were contributed by the GLOWA Jordan River working group “Climate and Hydrology” (personal communication, L. Menzel, Institute of Geography, Heidelberg University, Germany).
2.2. Risk Definitions and Sensitivity Assessment
The environmental risks of irrigation with TWW mainly depend on the local soil properties and the water quality. The quality of the TWW depends on the water resource, the “pick-up” during usage, the treatment technology and the dilution of the TWW after treatment and is therefore regionally variable. In all countries of this study, different ratios of TWW or even raw wastewater diluted with various other water sources, like surface, ground or spring water, are used for irrigation in order to increase the available irrigation water. The dilution can improve or decrease the water quality regarding the parameters tested in this study. The quality of the water used for irrigation does not match with the guidelines for good irrigation practice for every case in the region [
17]. There is no spatially up-to-date inclusive and comprehensive information about water qualities used in the different countries available. The soil sensitivity itself is more an inherent characteristic of the soil, independent of the water quality. For a supranational approach, this resulted in the need for an evaluation independent of water quality. In collaboration with regional experts, the currently most important soil-related agricultural risks associated with TWW irrigation were defined based on the assumption that TWW is generally of poorer quality than fresh water regarding several properties like salinity, total dissolved solids, total suspended solids, dissolved organic matter or heavy metals and other pollutants. The soil sensitivity has been related to these risks. Criteria by which the soil sensitivity could be assessed were set. Hence, methods were selected and developed to evaluate the determinable parameters in the context of the appropriate criteria (
Table 1). Finally, the particular sensitivities were weighted, aggregated and displayed as total sensitivity. The results of each assessment were the respective sensitivity grades, which were given on a three-step scale: 1—low sensitivity; 2—medium sensitivity; and 3—high sensitivity. From this, the respective suitability grades were derived in the way that a low sensitivity area has a high suitability for irrigation with TWW and vice versa. The sensitivity and the derived suitability grades were displayed in the maps according to a traffic light labeling (red/yellow/green). Note that the texture calculations are based on the German texture classification following Ad-hoc Arbeitsgruppe Boden [
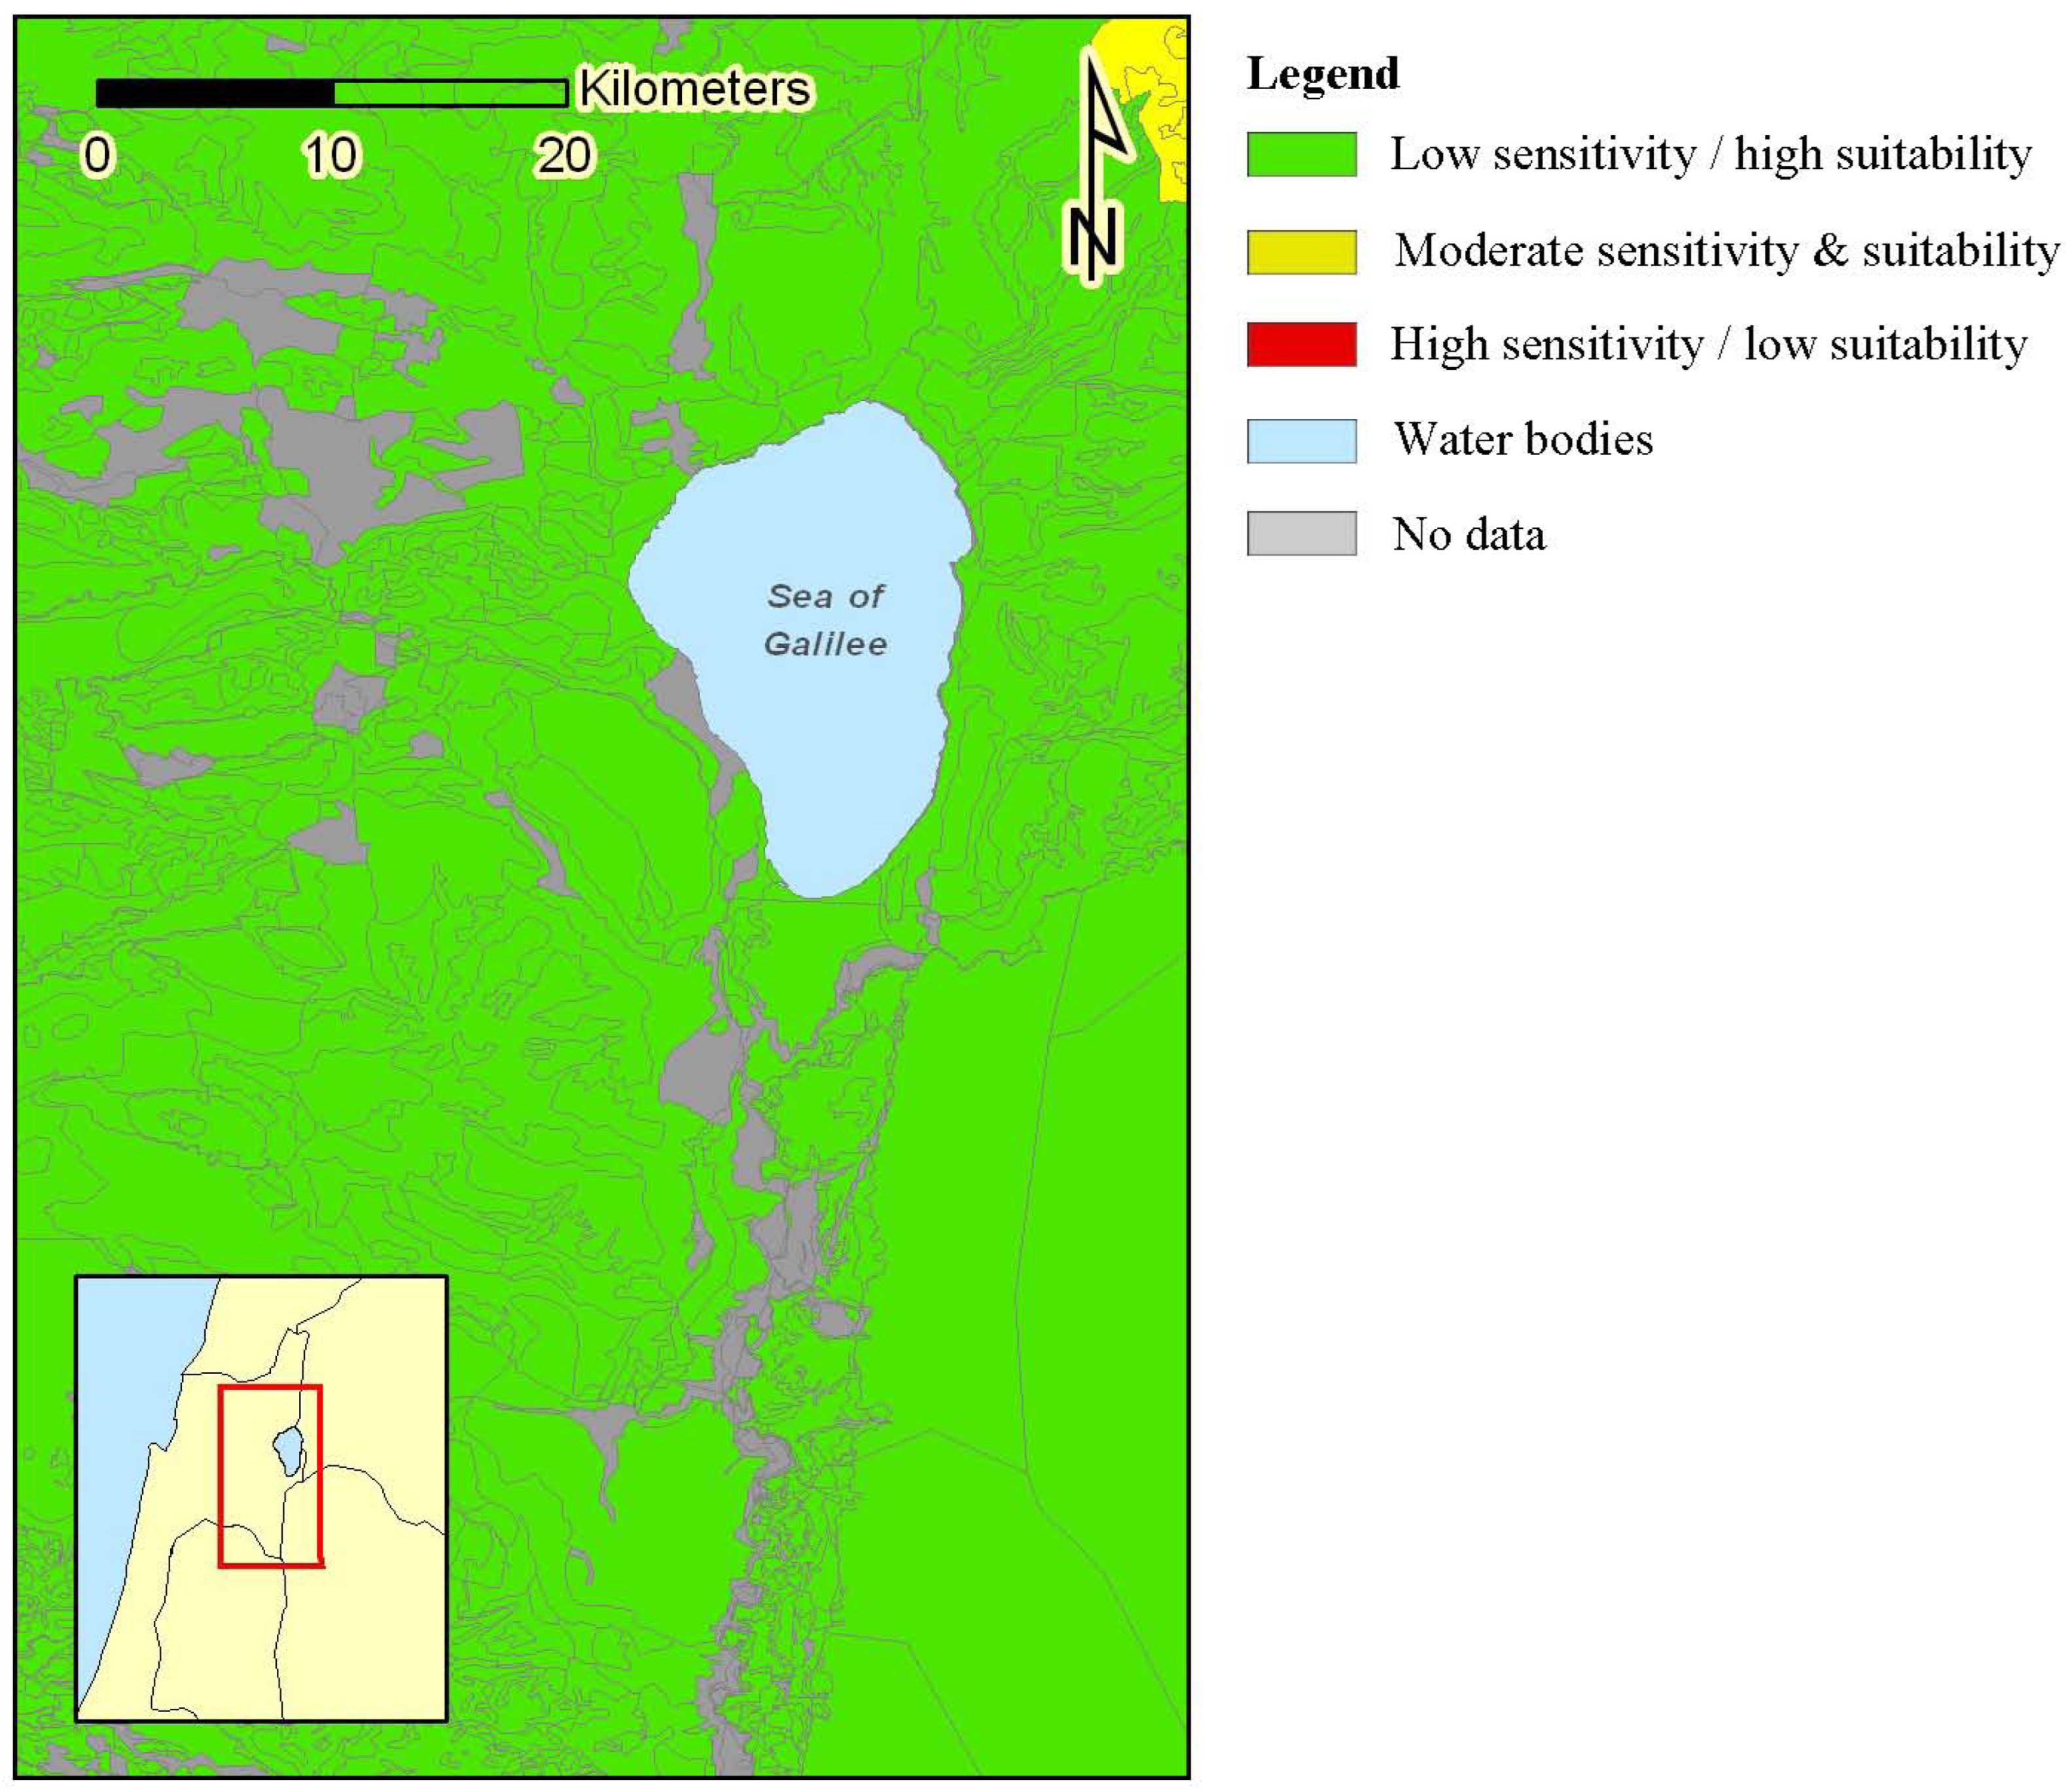
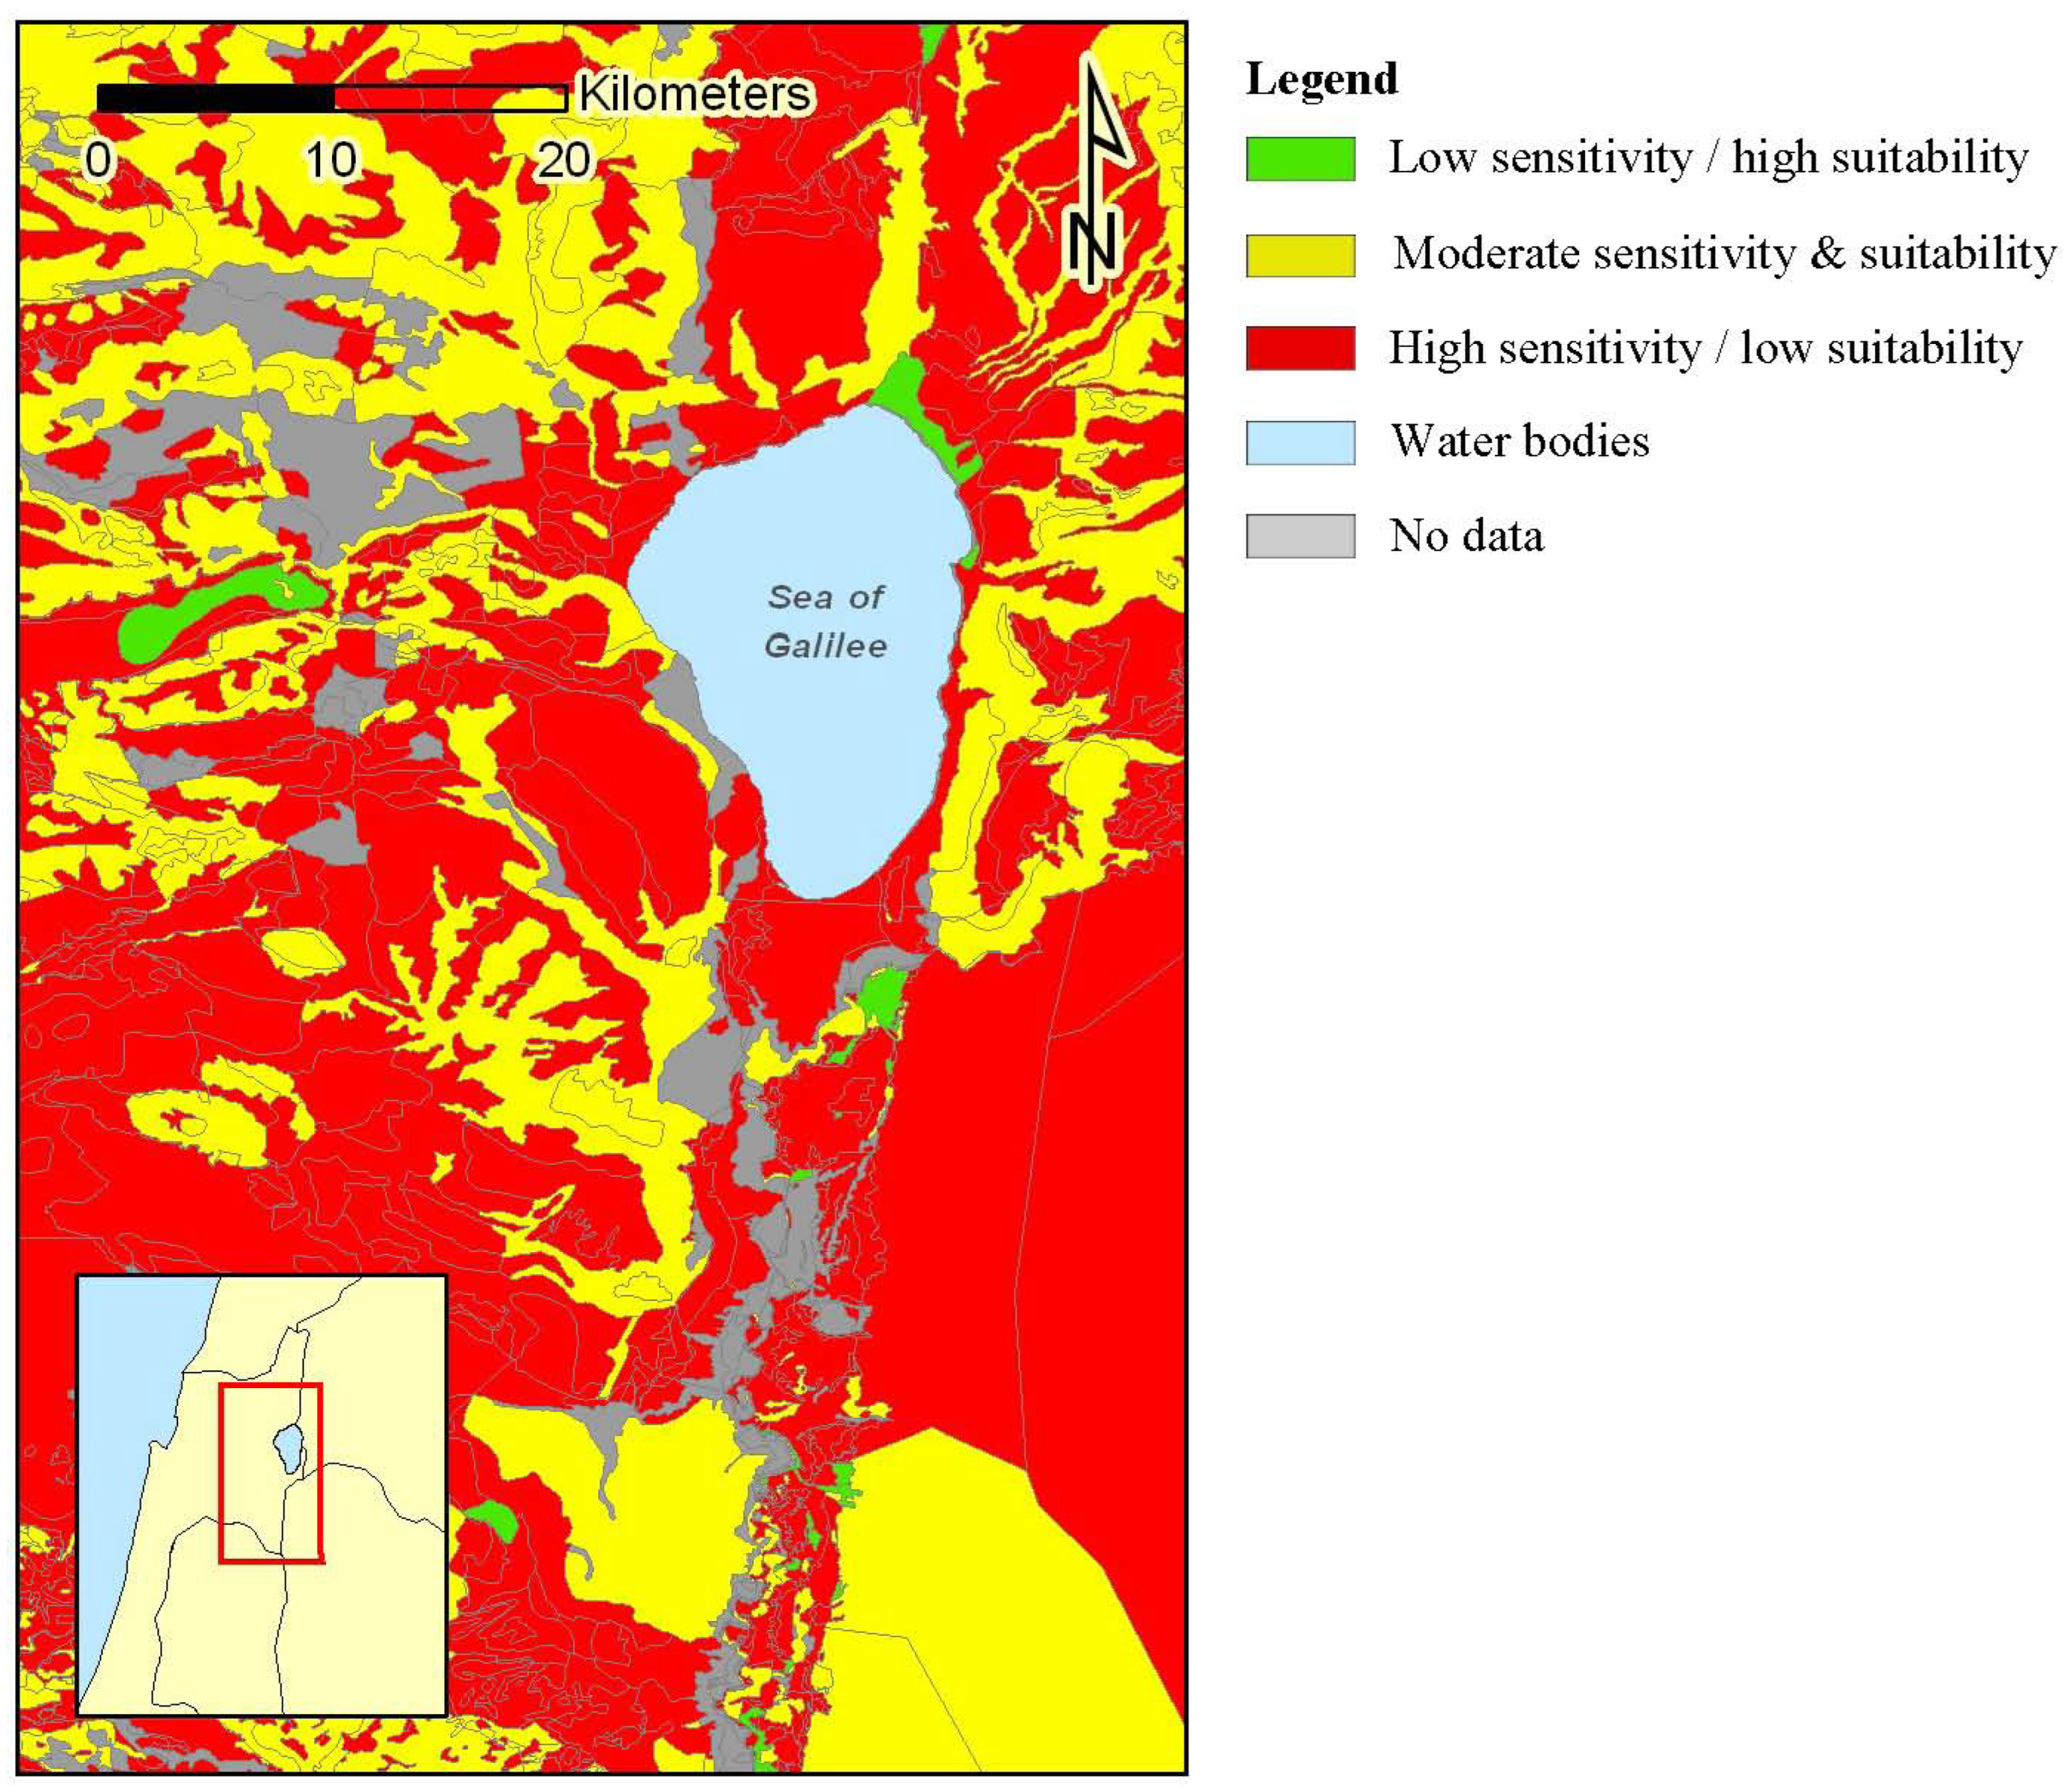
16].
For means of visualization, each following chapter regarding the six individual sensitivities includes a cut-out of the particular sensitivity assessment map (original scale 1:500,000). The cut-out remains the same for all chapters for a better comparison of each single sensitivity. Some maps show very similar sensitivity grades throughout the area, which does not imply that the same is true for the whole investigation area. The supplemental material associated with this article includes a GIS shapefile displaying all single sensitivities and the aggregated sensitivity assessed in this study. Moreover, ArcGIS-Layer Packages are delivered with the supplement for each single and for the aggregated total sensitivity, e.g., to be used with the free GIS data viewer software ArcExplorer (ESRI) (Appendix 1 in Supplementary [
18]).
Table 1.
Overview of the defined risks, criteria, methods and the parameters used.
Table 1.
Overview of the defined risks, criteria, methods and the parameters used.
| Risks | Criteria | Parameters
(required and derived) | Methods |
|---|
| A | Mobilization of inorganic adsorbable pollutants | Buffering capacity for inorganic adsorbable pollutants (e.g., heavy metals) | Texture, OM, pH | Blume & Brümmer
1991 [19]; modified |
| B | Slaking of the upper soil layer | Slaking of the upper soil layers | Texture, OM | Ad-hoc-Arbeitsgruppe Boden 2005 [16]; modified |
| C | Salinization of soils | Salinization of soils | Texture, bulk density, depth of root zone, soil depth, field capacity, saturated hydraulic conductivity, leaching rate | Own method |
| D | Mobilization of boron | Buffering capacity for boron | Texture, OM, pH | Own method |
| E | Groundwater pollution | Buffer capacity for
non-adsorbable substances (e.g., nitrate) | Texture, bulk density, depth of root zone, field capacity, leaching rate | DIN 19732: 1997-06 [20] |
| F | Hydrophobicity | Soil surface area | Texture | Own method |
2.2.1. Risk A: Mobilization of Inorganic Adsorbable Contaminants
Assuming a worst-case risk assessment, the evaluated criteria is the relative bonding strength of cadmium (Cd) in the top soil (≤30 cm), as Cd is the first heavy metal mobilized by decreasing pH values, starting at approximately pH 7.1 (H
2O). The procedure of the assessment follows the method of Blume & Brümmer [
19]. The relative bond is described with values ranging from 1 to 5 and is mainly dependent on pH, the amount of clay minerals and organic matter in the soil. Since soils in the region are rarely acidic, no relative bonds lower than 3.5 were determined. But for the sake of comparability, the original scale was adapted. The original method was slightly modified for the reason of simplification and the lack of more detailed soil property information, for example about iron oxide contents of the assessed soils. Translocation processes due to complexation are not included, neither are possible effects of oxides and hydroxides and previous contaminations of the sites.
The parameters used for the assessment were: soil texture, OM and pH. The initial relative bond of cadmium was derived from the pH-value (
Table 2). Markups on the relative bond value were added for increased OM and clay contents (
Table 3). The final sensitivity grade was derived from the final relative bond value: <4 ≙ high sensitivity, 4 to <5 ≙ moderate sensitivity, ≥5 ≙ low sensitivity (
Table 4). A cut-out of the resulting sensitivity map is shown in
Figure 2.
2.2.2. Risk B: Slaking of the Upper Soil Layer
The sensitivity of the topsoil to slaking is dependent on the silt and fine sand content. Soils with high silt content are more sensitive to slaking and splash effects on the soil surface, which can lead to reduced infiltration and higher runoff rates. The amount of soil OM is also important for stabilizing the soil structure. A higher content of OM has a positive effect on the stability of the soil surface, contents of more than about 2% result in higher stability [
21,
22]. Other parameters, like mineralogy of the clay minerals, oxides/hydroxides, carbonates
etc., are not considered due to the lack of information and the sufficient accuracy of the method at the regarded scale. The assessment method is based on Ad-hoc-Arbeitsgruppe Boden [
16]. The determined sensitivity level is modified in relation to the organic matter content.
The sensitivity towards slaking is not to be mistaken with the potential sensitivity towards soil dispersion as a consequence of irrigation with TWW of poor quality. Irrigation with TWW showing high sodium adsorption ratios (SAR) should generally be avoided on soils with high clay contents [
23]. Because of the unknown spatial variability of quality of the applied TWW, this potential additional soil deterioration risk could not be assessed in this study. The conducted assessment takes into account the potential lateral discharge by enhanced runoff caused from soil slaking and the subsequent adverse effects to the adjacent environment regarding potential elevated concentrations of contaminants or pathogenic germs in the TWW used for irrigation.
The parameters used for the assessment were soil texture and OM. The grade was assessed initially according to the texture of the upper soil layer (0–30 cm) (
Table 5). Furthermore it was modified due to the OM-content of the topsoil (
Table 6). The final sensitivity grades were derived from the values of the previous grades: <2 ≙ low sensitivity, 2 to 3 ≙ moderate sensitivity, >3 ≙ high sensitivity (
Table 7). A cut-out of the resulting sensitivity map is shown in
Figure 3.
2.2.3. Risk C: Salinization of Soils
Salinization is the process of accumulation of salts in soils and soil horizons and is favored by low leaching rates. Leaching rates are dependent on the field capacity of the soil, the hydraulic conductivity, the amount of precipitation and irrigation water applied and evapotranspiration. For the same rates of precipitation and evapotranspiration, more water is leached in a sandy soil than in a clayey soil. Assuming good irrigation practices, sandy soils are usually irrigated more frequently, which leads to higher leaching rates [
6]. The prevention of salt accumulation in fine-grained and low-permeable soils is very difficult [
24]. The lower the field capacity, the lower is the risk of salinization. The drainage of a soil is another important factor regarding salinization, as the dissolved salts have to be leached from the pedon. Higher drainage abilities are assumed if the saturated hydraulic conductivity (K) is high. Furthermore, it is supposed that deeper profile depths (≥1 m) ensure better drainage [
25].
Class limits were set according to Germans standard assessment classifications described in Ad-hoc Arbeitsgruppe Boden (1994) [
26] (parameter field capacity of the rooting zone (FC
RD)) and Ad-hoc-Arbeitsgruppe Boden (2005) [
16] (parameter saturated hydraulic conductivity, K). The influences of the groundwater table and the structure of soil (cracks
etc.) were not considered due to the lack of information and the sufficient accuracy of the method for the regarded scale.
The particular soil sensitivity towards salinization was evaluated for the depth of the effective rooting zone on the basis of an evaluation matrix with the parameters K and FC
RD (
Table 8). The lowest K value of the profile was decisive. If the averaged leaching rate exceeded FC, the risk grade was reduced by one unit. For profile depths <1 m the risk grade was increased by one unit. A cut-out of the resulting sensitivity map is shown in
Figure 4.
2.2.4. Risk D: Mobilization of Boron
Boron is an important plant micronutrient, but the margin between deficiency and toxic concentration is smaller than for all other nutrients. Borate compounds are carried into the wastewater as part of bleaching and disinfection detergents. Boron adsorbing surfaces in soils are aluminum oxides, magnesium hydroxides, clay minerals, calcium carbonate and organic matter. Factors affecting the availability to plants are pH, texture, moisture, temperature, organic matter and clay mineralogy [
27]. Due to the availability of data and the simplification of methodology the most important factors (organic matter, clay content and pH) were selected, classified and combined in an assessment matrix. Boron adsorption on reactive soil surfaces by soils is highly dependent on the pH-value. It increases in the range of pH 3 to 9 and decreases in the range of 10 to 11.5. There is likely a plateau in the adsorption function in between pH 8.5 and 9.5 [
27]. Similar lines of the adsorption functions were shown as well for the adsorption on organic matter and on clay minerals. The assessment is based on the assumption that each factor is treated equally, with additive effect. The higher the clay percentage and the higher the OM content, the higher the B adsorption with regard to the three different pH-classes. The class limits of the pH were in accordance with the maximum of adsorption on clay minerals and organic matter. The assessment included the first 30 cm of the topsoil. The sensitivity was evaluated via an assessment matrix (
Table 9).
A cut-out of the resulting sensitivity map is shown in
Figure 5.
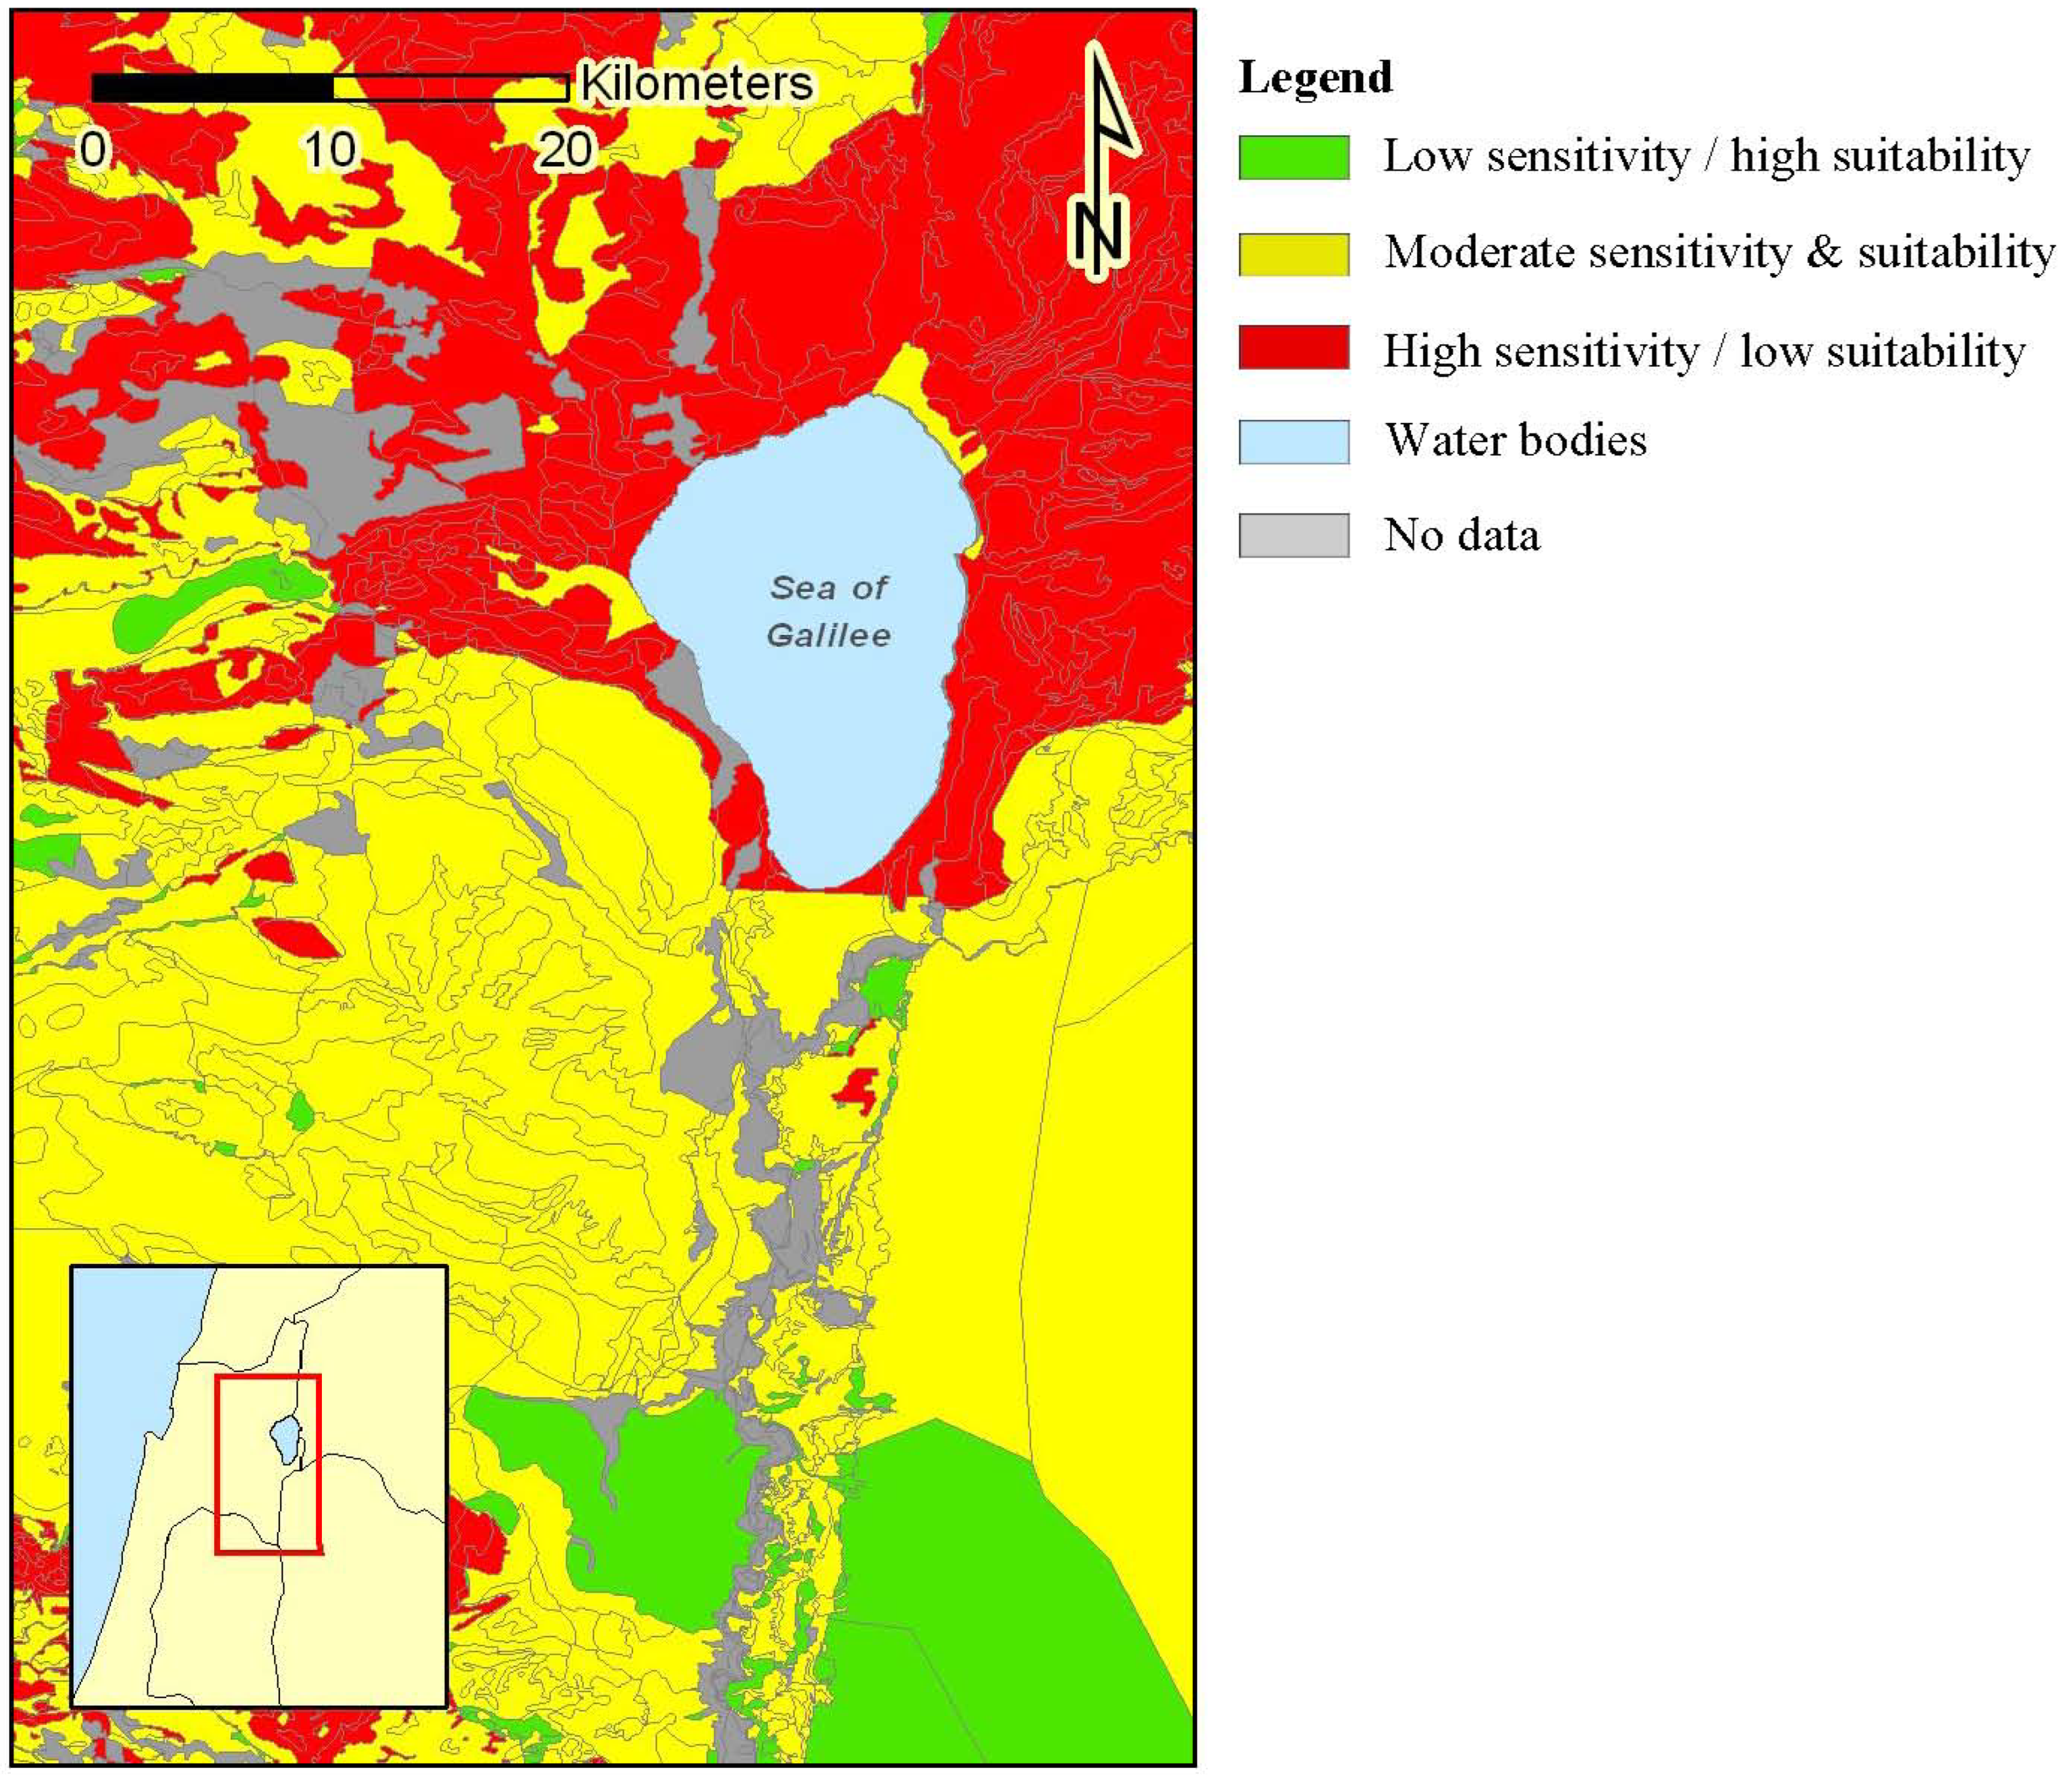
2.2.5. Risk E: Groundwater Pollution
One of the most crucial threats to groundwater quality is contamination with metals, pesticides or other xenobiotics [
3]. However, this risk is very difficult to assess, since most of these substances strongly interact with the soil matrix and are therefore effectively retained or at least strongly retarded in their downward movement. Non-adsorbable substances like nitrate and chloride, on the other hand may also cause problems when leached to the groundwater [
28,
29,
30] and this is largely dependent on the leaching rates at the site. The lower the leaching rate, the longer the retention time of the soil water within the rooting zone and thus a possible uptake of nitrate by plants or denitrification [
2,
29]. While nitrate can be eliminated during wastewater treatment (nitrification-denitrification module), chloride can only be removed by advanced treatment like reverse osmosis. The movement of chloride and nitrate within the soil is similar. Chloride is also taken up by plants, but elevated chloride concentrations cause adverse effects to sensitive plants [
2]. The soil sensitivity towards salinization, including the accumulation of chloride in the vadose zone, was assessed in sensitivity C.
Thus, the exchange rate
nER of the soil water per year [1 a
−1] within the rooting zone allows an assessment of the soil sensitivity towards the mobilization of non-adsorbable substances [
20]. The exchange rate
nER was calculated by the ratio of the leaching rate LR [mm a
−1] and the field capacity of the root zone FC
RD [mm]: LR/FC
RD. The preliminary risk grade was derived from this ratio. The limits were set in modification of the original method (five steps) to provide the three-step scale used: <1 ≙ low sensitivity, 1 to 2 ≙ moderate sensitivity, >2 ≙ high sensitivity.
For the extent of Israel, the West Bank and Gaza, this method has been extended using the information of the Hydrogeological sensitivity map for wastewater irrigation [
15]. This map shows the sensitivity of the groundwater depending mainly on regional geologic formations and is assessed in three grades as well, from grade 1 (low sensitivity) to 3 (high sensitivity). For the area mentioned above, the particular sensitivity grades were set into an assessment matrix for the determination of the total sensitivity (
Table 10). There was no analogical area-wide information available regarding groundwater sensitivity for Jordan. Hence, the final specific sensitivity grades for Jordan were based on
nER only, without any coupling with groundwater sensitivities (
nER < 1 ≙ low sensitivity,
nER = 1 to 2 ≙ moderate sensitivity,
nER > 2 ≙ high sensitivity). A cut-out of the resulting sensitivity map is shown in
Figure 6.
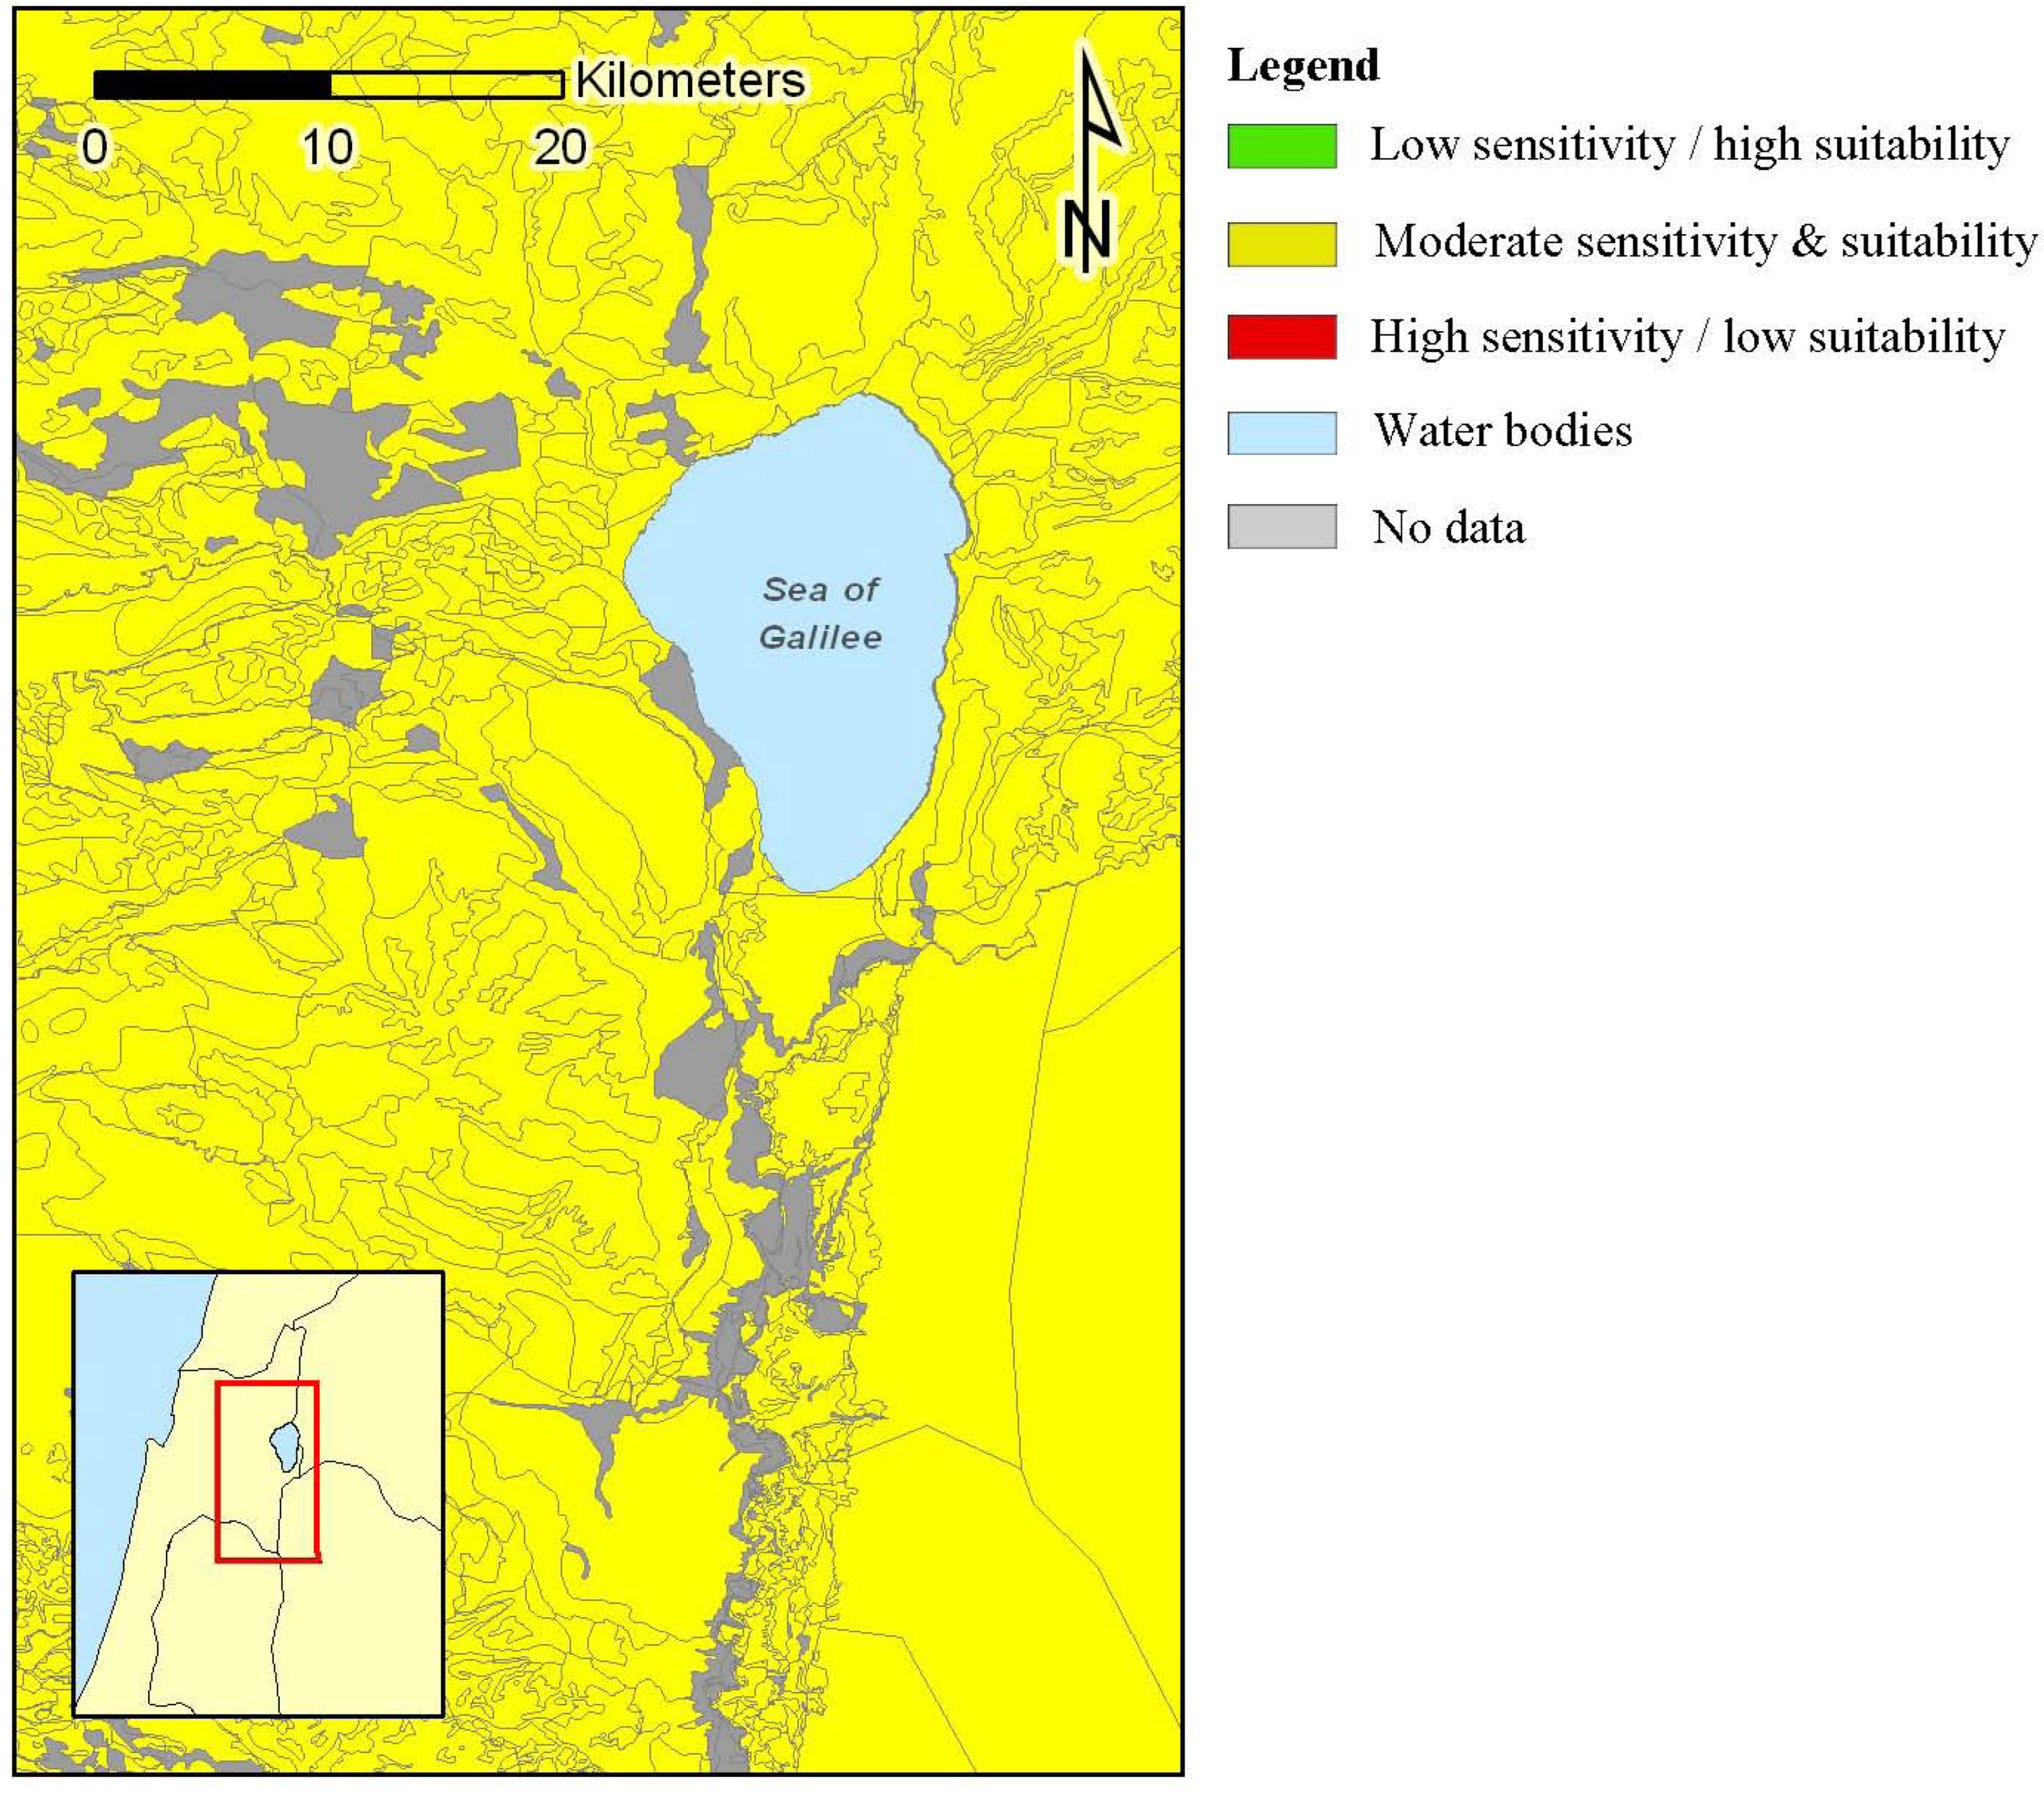
2.2.6. Risk F: Hydrophobicity
The phenomenon of increased occurrence of soil water repellency on TWW irrigated sites has been discussed recently [
31]. It is linked to the presence of dissolved organic matter in the TWW and its amphiphilic characteristics. Coarse soils with a higher sand content often show a higher prevalence of soil water repellency than fine textured, clayey soils [
32,
33,
34]. Furthermore, influencing factors for the intensity of occurrence are the amount and quality of the soil organic matter. For means of simplification and due to the lack of data regarding soil organic matter quality, an approach of classification was specified via the definition of soil texture [
16]: clay content ≥ 80% ≙ low risk, clay content < 10% and sand content ≥ 80% ≙ high risk, all other values ≙ moderate risk. This approach visualizes the general textural sensitivity of the individual site. A cut-out of the resulting risk map is shown in
Figure 7.
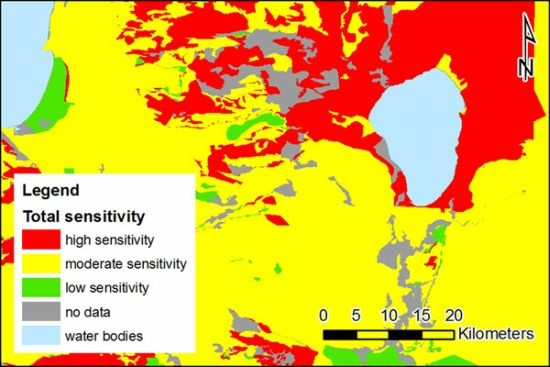
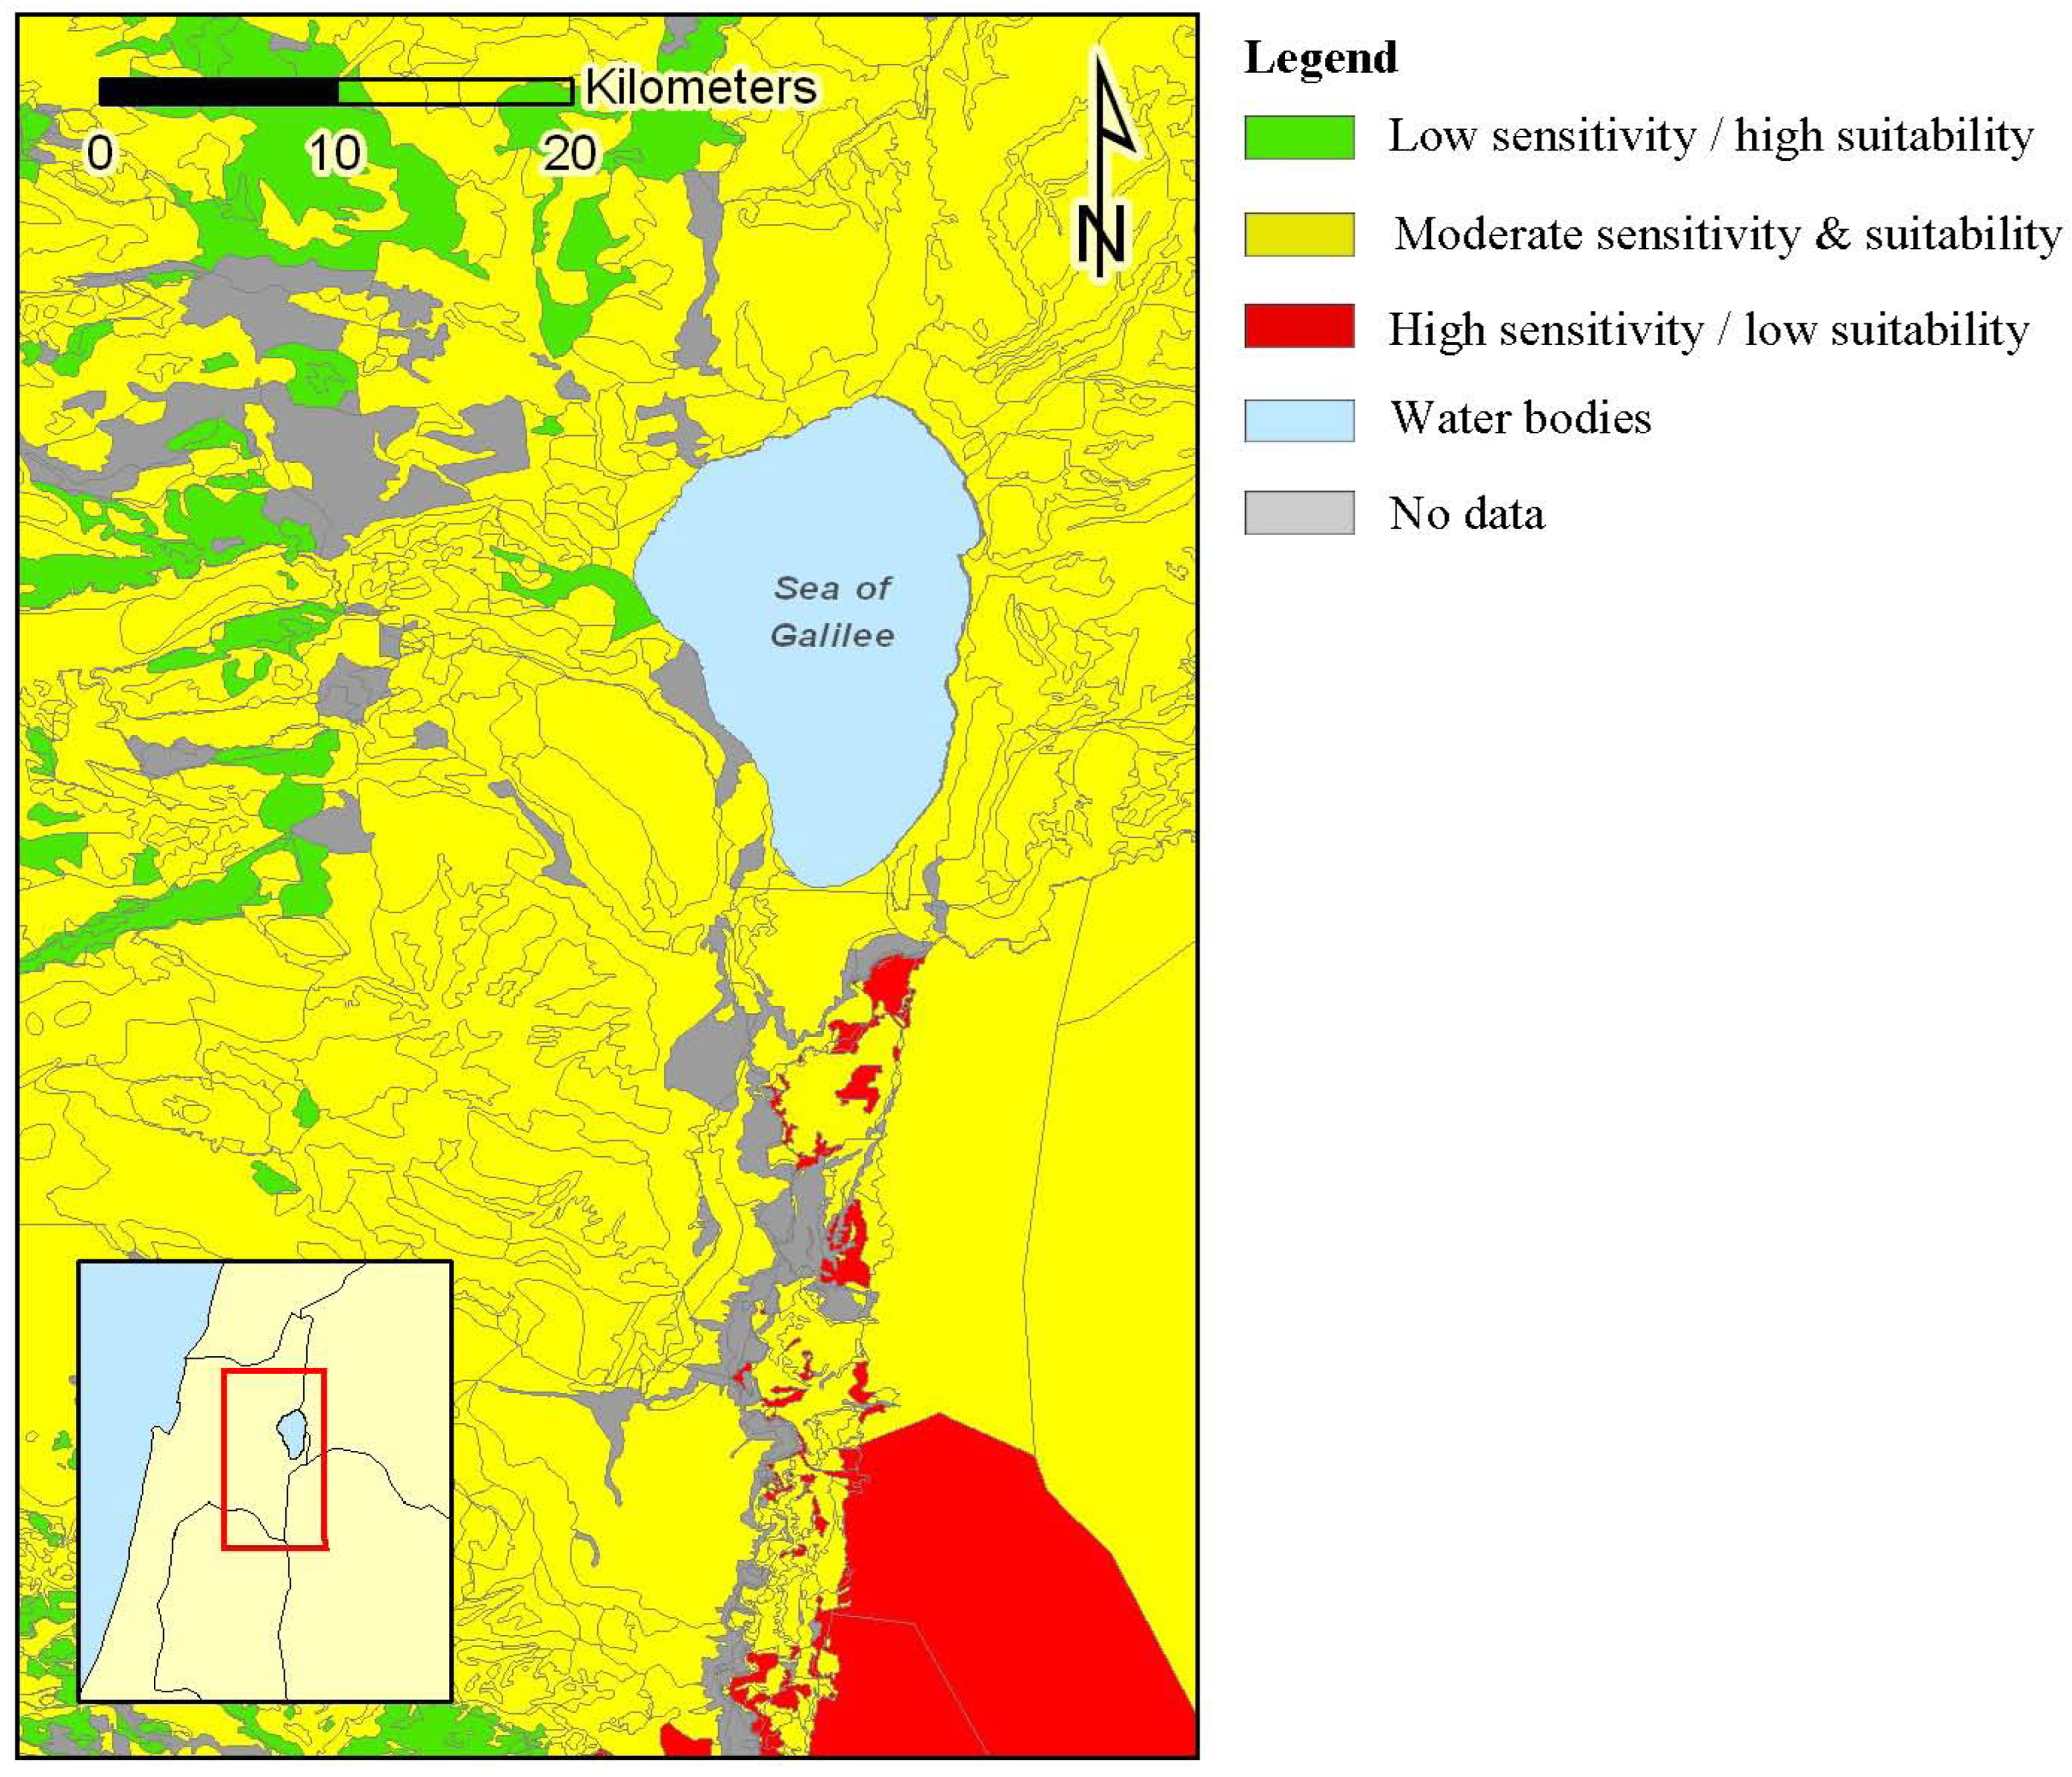
2.2.7. Aggregation of the Single Soil Sensitivities
For compiling an aggregated sensitivity, the single sensitivities were given relative weights according to their relevance in consultation with all regional partners (one expertise from each involved partner in Israel, Jordan, Palestinian Authority (PA) & Germany), as the impact of the sensitivities could not been valued equally. It was generally agreed, that sensitivity C (salinization) and E (groundwater pollution) are given a higher weight since they have a high relevance for assessing the total sensitivity (
Table 11). The sensitivity values of the specific sensitivities were multiplied with their relative weight and summed up. The aggregation of the single weighted sensitivities values resulted in the presentation of the total sensitivity grade by means of the three-step scale. The total sensitivity was set according the following values: <1.6 ≙ low sensitivity, ≥1.6 to <1.9 ≙ moderate sensitivity, ≥1.9 ≙ high sensitivity. The class limits were set with the objective of an equally final spatial distribution of the sensitivity categories. A cut-out of the resulting sensitivity map is shown in
Figure 8. However, this map can only serve as a general overview for the soils’ sensitivities towards TWW irrigation and does not indicate which individual sensitivities are most relevant. Therefore, overall sensitivity analysis must include the comparison with the individual sensitivities.
2.3. Release of Results
The results of the assessment are provided digitally as ArcGIS layer package files and shapefiles, which are available with this publication. The shapefile file format can be viewed with any standard GIS-software. Moreover, the maps will be incorporated into an interactive digital online atlas which is currently being assembled for distribution among the cooperating institutions and stakeholders in the project region.
3. Discussion
Using this approach, the available spatial soil information of major parts of the project area has been brought together for the first time in order to assess the soil sensitivities towards the potential risks associated with TWW use for agricultural irrigation. The database offers a comprehensive and transboundary overview about soil properties and their distribution in the region. Comparable transboundary soil maps displaying the soil units and their properties have not been available previously. However, the resolution and the quality of information regarding the spatial assessment of the particular sensitivities towards TWW irrigation depend on the basic data. Although this assessment has been conducted using the best available data, it is not adequate for displaying the large-scale soil heterogeneities that occur within the mapping units. Moreover, due to averaging of soil property data from different sources while matching them to certain soil units, possible information of spatial heterogeneity have necessarily been equalized. In case of the Soil Association Map of Israel [
10], the transfer of properties from a few profiles to whole associations can only be an approximation. The information of the Harmonized World Soil Database [
14] is less detailed due to its overview scale. For regional and supraregional planning purposes, the sensitivity maps are well suited to provide reasonable information regarding sustainable infrastructural development, but they are not yet suited for farm level decision making. However, the methods presented in this work can be applied to any spatial scale if soil data is available at the desired scale of resolution. On the farm level, for example if a farmer has to decide about the distribution of irrigation water of different quality, large-scale mapping and designation of soil units would be needed. More detailed information about the spatial distribution regarding for example soil texture, pH and OM-content would significantly enhance the quality of the maps.
The methods applied in this assessment have been chosen as they are simple enough to be conducted and understood not only by professionals. They are based on the evaluation of soil properties which are, in most cases, easy to handle, except the generation of leaching rate data, which has to be derived differently. Therefore, the methods presented are transferable to other arid and semiarid regions. The weighting of the particular sensitivities can then be adjusted to the regional requirements.
The weights given to the particular sensitivities A-F for estimating the total sensitivity are based on the personal expertise of local experts and the authorship, reflecting their personal experience. During the alignment process it became clear that certain particular sensitivities were weighted differently. Sensitivity B (slaking of the upper soil layer) has been given higher impact, for example by the expert from the West Bank due to the fact that erosion processes are of major significance there. Boron mobilization is more threatening when TWW of poorer quality is used. Due to this fact, this risk is more of an issue in countries with less sophisticated treatment infrastructure and legislative regulation, like Jordan and the PA. So the final decision was a compromise between different expertises, shared within the authorship.
This assessment was conducted independently from the effective TWW quality, as there was no supraregional spatial information available. The possible adverse impacts on soil and groundwater quality are dependent on quality of the irrigation water used, though. In the three observed countries, the quality of the reused water is very different. Israel has a well-developed infrastructure for wastewater treatment and its reuse and only in a few sites orchards (e.g., dates) are irrigated with only primary treated wastewater. The situation is very different in the PA, where sufficient treatment capacities are currently not available. Therefore, raw or diluted wastewater is often used in the PA for irrigation, The quality of the water reused for irrigation in Jordan, mainly for agriculture located in the Jordan Valley, varies enormously in time and space, depending on the performance of the As-Samra treatment plant and the further dilution of the treated wastewater (TWW) while flowing down the river Zarqa and mixing with water coming from the King Abdullah Canal. There are some farms in the vicinity of the As-Samra treatment plant that use undiluted TWW for irrigation near-by. Even if there are progressive legislative limiting values (Israel, Jordan), the quality of the reused water for irrigation does not match these limits in every case. Due to this fact, we decided not to cite “typical” quality parameters of fresh water (FW), wastewater, treated wastewater, as the parameters are essentially highly variable in space and time. Simplified, we regard fresh water in its chemical composition as a case of TWW without organic matter, inorganic pollutants and usually with lower concentrations of salts. Since other waters with poor quality parameters, such as brackish water, are also used for irrigation in some parts of the region, the assessment can be generalized to reflect the soils’ sensitivities towards irrigation with other "marginal waters". Especially when working on the farm level, it would be advisable to include information on irrigation water quality for further decision-making. Information about previous impacts and initial levels of soil contamination should then also be taken into account.
4. Conclusions
To the best of our knowledge, this is the first supranational study assessing the soil sensitivity and suitability towards the risks of irrigation with TWW. It provides a comprehensive overview and identifies sensitive regions. As it was conducted in one of the regions with the lowest water availabilities worldwide, which is further going to be affected by the impact of climate change, this information will be important for sustainable agriculture and strategic infrastructure planning. The assessment methods are kept simple to provide usability and easy performance. The results are displayed in maps which can be used with common GIS systems. Moreover, the particular sensitivity maps can be distributed analogically. This also contributes to strategic water reuse management and could be implemented in integrated water resource management.


 ,
, 


