Article

“SimDelta”—Inquiry into an Internet-Based Interactive Model for Water Infrastructure Development in The Netherlands

1
Delft University of Technology, Stevinweg 1, 2628 CN Delft, The Netherlands
2
HKV Consultants, Botter 11 nr 29, 8232 JN Lelystad, The Netherlands
3
Deltares, Rotterdamseweg 185, 2629 HD Delft, The Netherlands
*
Author to whom correspondence should be addressed.
Water 2012, 4(2), 295-320; https://doi.org/10.3390/w4020295
Submission received: 7 February 2012 / Revised: 27 February 2012 / Accepted: 8 March 2012 / Published: 23 March 2012
(This article belongs to the Special Issue Flood Risk Management)

Abstract

:
The Dutch Delta Program is currently developing new government policies for flood protection and fresh water supply. Decision support instruments have to address the program’s technical and political complexity. The water system functions are highly interwoven and would benefit from an integrated approach on a national level, with decisions supported by a scientific Systems Analysis. Politically, there is a tendency towards broad participation and decentralization, and decision-making is typically supported by Conflict Resolution methods. To connect these two sides of the Delta Program’s task, an outline is presented of an internet community-based interactive instrument, preliminarily named SimDelta. On-line interactive maps and elements of serious gaming intuitively provide local Delta Program participants insight into the interaction between scenarios, problems, and solutions. SimDelta uses the internet to more frequently and efficiently present conceptual designs by architects and engineers to the Delta Program stakeholders, record their preferences, and “crowdsource” corrections, improvements and new ideas.

Graphical Abstract

1. Water Infrastructure Development Support

Spatial planning methods aim to solve spatial problems by identifying solutions, estimating their effects on various factors or functions, establishing criteria to judge these effects and getting value-based input from the relevant stakeholders, to support policy decisions (definition after Walker [1] and Lund [2]). This can be done with strong or little scientific support, depending on the resources available and the issues at stake.
The case for this paper is the Rhine-Meuse river delta, stretching about 200 kilometers from the Dutch western coast inland and 200 kilometers from south to north. Water management in the Netherlands is advanced. Hundreds of millions of euros per year are spent to maintain and improve the primary system (sea, large rivers and main lakes) [3,4], and several millions on policy support models (Subsection 1.1) and “serious games” (Subsection 1.2).

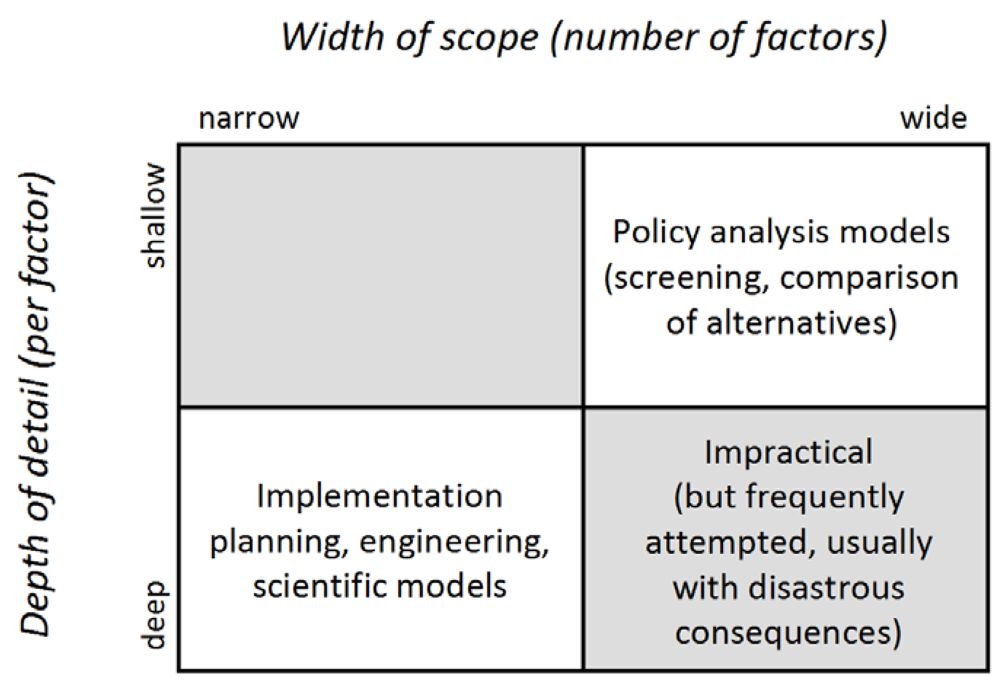
1.1. Water Infrastructure Planning and Policy Models

Most water resource planning efforts aspire to be rational and are therefore similar in their fundamentals [2]. Different approaches originate from different practical problems. Lund divides these along two major aspects: strength of leadership (perhaps better described as centralized versus locally dispersed power) and problem specificity (see Figure 1).
Figure 1. Categorization of planning methods (Section 1.1) by Lund [2]. Serious Games (Section 1.2) could serve as communication tools (arrows added to the original diagram) to connect the planning methods of Systems analysis with Conflict Resolution.
Water 04 00295 g001
Strong leadership and well-defined problems can result in easy-to-use legal requirements. When a detailed planning analysis is too expensive or impractical, projects often use previously established requirements or norms. The flood protection standards in the Netherlands were originally based on a benefit-cost analysis [5], but since then have served as “simple” requirements the system has to meet, to whatever costs. Only rarely are new standards set, based on a new benefit-cost analysis. In the opposite corner of the diagram we find the policy of Muddling Through, a term introduced by Lindblom [6]. In practice often few resources are available to dive deeply into a problem or there is no higher government to set standards. In the Dutch flood protection system, the way in which “multifunctional dikes” have been built and maintained has elements of Muddling Through. At this moment efforts are being undertaken to shift this to the planning methods of Conflict Resolution’ or even Markets, supported by some building codes (Requirements), or Systems Analysis (see Figure 1) [7,8].
A multi-criteria analysis extends further than a benefit-cost analysis by adding non-monetary criteria and weights to the criteria, derived from values held by different stakeholders. Among the used tools are scorecards [1] and utility functions to calculate trade-offs between different objectives [9].
Often enough, water systems are so far developed and political positions are held so firmly, that even when an “objective” systems analysis provides “evidence” for smart investments, still no action is taken, because of Game Theory-like stalemates, modeling uncertainties or communication and visualization difficulties. Lund writes: “where the water resource problem involves fundamental political conflicts among objectives, multi-objective analysis cannot resolve those conflicts, only make them clearer” [2]. In those cases, planners sometimes turn to a planning method that focuses on facilitating constructive negotiations. From this perspective, success is achieved when stakeholders come to agree on a decision, even one not qualified by systems analysis as one of the best. The national Delta Program in the Netherlands has elements of Conflict Resolution in its organization. Regional sub-organizations have been formed to come up with long-term solutions in an intense dialogue with regional and local governments [10]. These solutions, however, are input for the Delta Instruments (see later in this paper), established to determine the effects of the various solutions, in a typical Systems Analysis fashion [11,12]. These effects are brought back to the negotiation, and the future will tell whether the eventual decisions are made based on the outcome of the systems analysis, the negotiations among the stakeholders, or a mix of both. Merging the methods Multi-Criteria Analysis and Conflict Resolution requires particular communication tools, such as serious gaming.

1.2. The rise of “Serious Gaming” in Policy Support

Serious gaming can be defined as “experimental and/or experiential rule based, interactive (modeled) environments, where players learn by taking actions and by experiencing their effects through feedback mechanisms deliberately built into and around the game” [13]. It is still a question how serious gaming relates to policy making support methods and techniques from all corners of Figure 1, such as modeling (systems analysis), stakeholder panels, workshops, and process management (conflict resolution, muddling through). Serious games are descriptive models instead of prescriptive; they reduce the central position desired by classical systems analysis in policy-making. However, exactly by taking this position, games might eventually provide more scientific support in the real political arena.
Serious gaming evolved behind the decision sciences: operations research, systems analysis, and public policy analysis. In the 1950s, economists and social scientists introduced social aspects in the decision sciences, but they remained predominantly mathematically oriented. In the 1970s, systems analysis models started to receive fierce criticism. In 1973, Douglass Lee wrote his Requiem for Large Scale Models, addressing fundamental limitations of computer modeling and naiveté of modelers about the world of politics and planning. Studies from political science, management science, and organizational behavior had demonstrated that policy-making was not comprehensive, rational, and linear, but rather bounded, political and incremental. Lee’s “seven sins” are useful to keep in mind (even though today’s computers are faster than Lee imagined): “hypercomprehensiveness, data hunger and grossness, wrong-headedness, complicatedness, mechanical-ness and expense” [14]. These sins are particularly destructive when not only the modeling results are distrusted, but also the model itself cannot be understood by anyone but the modelers. Here serious gaming stepped in with the humble contribution of “making computer models more transparent” to policy-makers [13].
In 1986, the RAND Corporation’s Garry Brewer, who shared Lee’s criticism of modeling in the 1970s, started to promote Policy Exercise, a tool with roots in early forms of serious gaming. Exercises and system simulations under various future scenarios advanced further with emerging environmental problems and climate change since the 1980s. Many environmental issues had an unprecedented large scale, high degrees of complexity and uncertainty, and needed new forms of communication to facilitate “a constructive negotiation among scientists and between scientists and policy stakeholders” [13].
It seems that serious gaming is an education and communication layer over a planning model, or a bridge between two models, for example multi-criteria analysis (usually preferred by scientists) and conflict resolution (comfortable for many politicians and stakeholders). Mayer suggests that policy gaming “integrates technical-physical complexity with social-political complexity” [13]. Lund writes that “the objectives of a planning method are not limited to decision making, they also include education, documentation and reference, strengthening leadership, and fostering discussion” [2]. These objectives imply communication and education. Serious gaming is not a planning method in itself, but can very well be a significant part of it.

2. Complexity in the Rhine-Meuse Delta

The reviews of planning methods and serious gaming have shown that communication between systems analysis with the “real world” deserves special attention in policy-making. The third and fourth sections of this paper explore available advancements in information and communication technology to support this connection. The next section presents the Dutch Delta Program, currently developing new policies for the interconnected rivers, canals, lakes and estuaries of the Rhine-Meuse delta.

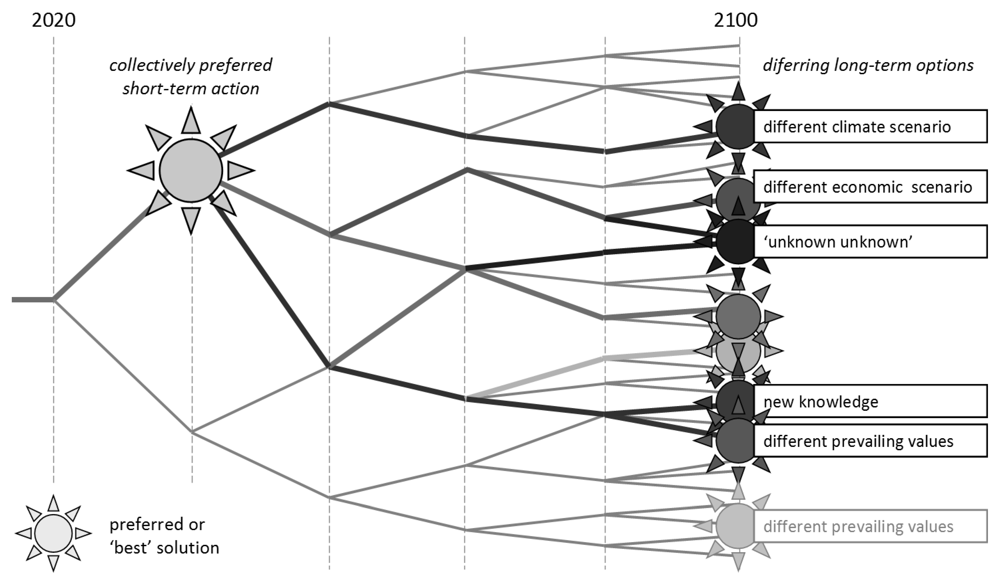
2.1. The Objective: Adaptive Delta Planning

At the end of 2007, a national committee was established to examine climate change threats and to unite and profile the Dutch water sector nationally and internationally. A year later this Delta Committee presented several solutions for flood risk, fresh water supply and water related ecological problems expected in 2050 and 2100 [15]. The report sparked a debate about the proposals, and alternative long-term plans appeared or were dusted off.
Around that time, various scientists in hydraulic modeling and policy analysis wrote about not only the need for more alternatives, but also for smaller time steps and more future scenarios. Not one single best solution, but “portfolios of flood management activities” will most effectively reduce risk [16]. Scenario studies should not only compare different strategies for different future states, but also consider pathways towards the future [17]. The Tipping Point approach investigated when the first problems would emerge under a particular climate change scenario, instead of focussing only on the years 2050 and 2100 [18].
The Dutch government followed-up on the Delta Committee in 2009 by launching the Delta Program. The first publications of this large organization focused on the long term [10], similar to the Delta Committee. However, in 2011 and 2012 the focus shifted to the shorter or mid-term [19]. To bridge the time spans, the Adaptive Management method is being investigated to have “a measure show up, way before it becomes urgent. This gets stakeholders acquainted with uncertainty and empowers the search for additional opportunities related to the problem or the project” [19].
Adaptive Management as a planning method originated in the ecosystem sciences in the 1970s [20,21]. Ecological models are explicitly acknowledged to have many flaws but are proposed to assist negotiation between different alternatives, as knowledge is improved. In Lund’s diagram (Figure 1) the method is therefore located in the Conflict Resolution corner. Its application in the Delta Program seems to be more related to economic systems analyses. In government publications, adaptive management is tied to cost-efficiency [4], for example by bringing in the mathematical Options Theory approach [22]. The advisory board for the Ministry of Infrastructure and Environment wrote in 2008: “adaptive policies evolve over time in response to new information” [23]. Walker’s Dynamic Adaptive Policymaking is “a systematic method for monitoring the environment, gathering information, implementing pieces of the policy over time, and adjusting and re-adjusting to new circumstances” [24]. This is what the Delta Program aspires to, but the question remains how to implement this ambition practically. Figure 2 illustrates how short-term actions relate to long-term options and uncertainties.
The recently adopted Delta Law establishes a Delta Fund in 2012. The fund will finance improvements to the Dutch water infrastructure with structural measures, such as flood defense modifications, altering or adding a river section, building or redesigning civil engineering works such as an operable barrier or a pumping station, improving fresh water supply by adding or modifying a canal, pipeline or storage basin, or non-structural measures, as changing building codes for unembanked areas, pricing fresh water or altering operations of a barrier or pumping station. Between the years 2020 and 2028, 2.4 billion euro is available for new projects, on top of 4 billion euro for maintenance and 3.6 billion euro for already allocated projects [4,19].
Which projects will be chosen for a given financial budget? In a democracy, public projects are selected based on a well-informed representation of a majority of the population. Combining this with adaptive planning, the objective for the Delta Program could be to determine which projects and policies for flood risk and fresh water supply, between 2020 and 2028, will be preferred by a majority, well informed on the wide range of options and scenarios on the long-term, and collectively willing to take the risks that come with each alternative.
This objective contains the technical-physical system, subject to uncertainties in long-term forecasts, and the social-political system, where the pros and cons of possible decisions have to be understood by the many stakeholders.
Figure 2. This conceptual “options tree” illustrates the objective for the Delta Program as stated in this paper. A particular difficulty is how to relate the measures (or actions) to be implemented between 2020–2028 to long term options and uncertainties.
Water 04 00295 g002

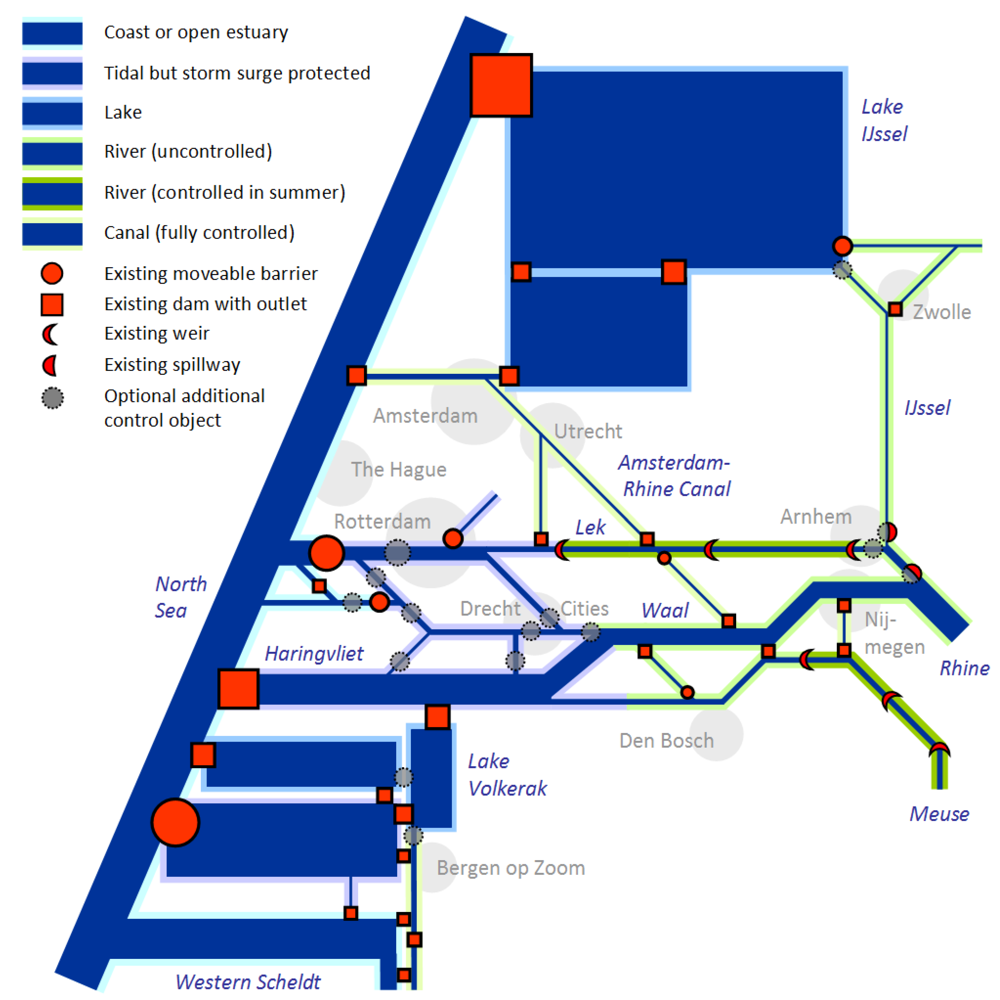
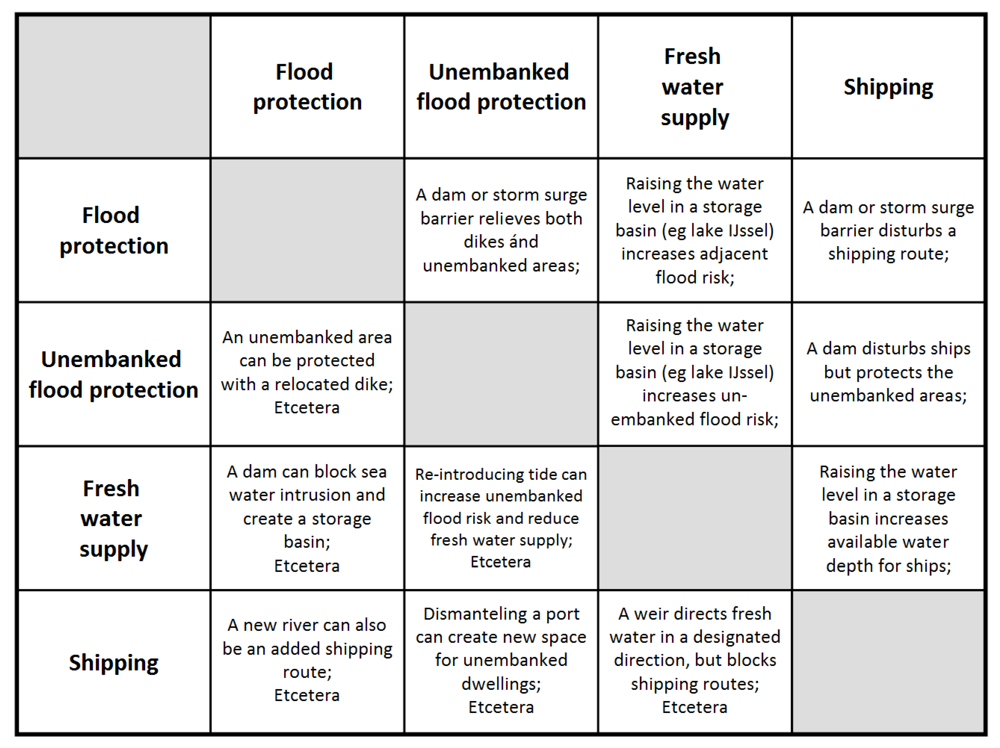
2.2. Technical-Physical Complexity

Starting point for the physical Rhine-Meuse problem and solution space is the current three-dimensional geometry of the water system, including the operational regimes of control objects, such as dam outlets and storm surge barriers. Current available geo-information is vast and the operational regimes of the control objects are clear [25]; if computers were only fast enough, they could model water flows through the system accurately at given boundary conditions. However, hydraulic models have many sources of uncertainty, for example by simplifications in geometry (such as drawn in Figure 3). Control objects may have clear operations policies, but these can be altered and moreover the objects can fail.
River discharge, storm surge characteristics and wind conditions interact with each other in complicated ways. Climate change scenarios add another level of uncertainty and complexity to the hydraulic boundary conditions. When we know the system geometry (including the operation of control objects) and probability distributions of the hydraulic boundary conditions [26], hydraulic models will give us probability distributions of water levels, flows and water quality. A water behavior model is the core required to determine how well water system objectives will be met.
The Delta Program and the Dutch water knowledge institute Deltares are currently developing the Delta Instruments, containing the Delta Model, a comprehensive model of the Dutch water system, effect modules and a comparative framework [27]. The project began by recognizing fifteen functions: flood protection, unembanked dwellings, clean and healthy water, shipping, agriculture, fresh water supply for drinking and industry, cooling water, energy production, raw materials extraction (such as sand and gravel), fishing, water and shore recreation, swimming, nature, archaeology, cultural history, landscape, and embanked (protected by primary dikes) buildings and infrastructure (affected by groundwater and flood risk) [11,12]. For now we can focus on four functions, which we re-phrase in terms of objectives.
Figure 3. Scheme of the Dutch Rhine-Meuse water system. The water types are classified by the possibility to control the water levels and flows. Coastal waters are beyond any human influence, inland canals can be fully controlled.
Water 04 00295 g003
First: minimize flood risk and maximize the acceptance of risk reducing measures. Evaluating flood risk requires flood probabilities and flood consequences. The overall flood probability of a dike section follows from how probability distributions of hydraulic conditions relate to overtopping- and failure probabilities [28]. Flood consequences usually include material damage, casualties [29], and indirect damage [30]. These vary with hydraulic conditions, breach size, and the location of the breach or overtopping. The respective flood probabilities and consequences for multiple dike sections should finally be integrated over the full dike length. This extensive probabilistic task is being conducted for current climate conditions by the VNK program [31,32]. Eventually this approach pro-vides a way to calculate risk reduction that can be “bought” by dike improvements, Room-for-the-River-like measures, or control objects such as a storm surge barrier. Implementing these can cause great local resistance, but could also be welcomed as a landscape improvement or economic boost, when combined with other functions, such as nature development or road improvements.
A simpler approach is the prevailing requirements-based Dutch flood standard system, as dictated by national law [33]. Risk is acceptable as long as dikes meet the prevailing flood standards. When they do not, dikes must be improved, no matter the costs or the amount of risk reduction obtained (at least in theory). The original flood standards were set in the 1960s, and have since for only a few dike rings been altered. Theoretically this should be done when a new optimal acceptable risk is derived by comparing risk reduction to risk-reducing investments [34], but optimality is hard to assess because non-dike strengthening measures and added benefits or indirect costs are usually absent from these analyses.
Second, maximize the acceptance of flood risk in unembanked areas. These areas can be compared to flood prone coasts and valleys world-wide. Flood consequences are usually less severe than when a diked bathtub below sea level would be inundated, and the flood probabilities are usually higher. Unembanked flood risks in the Netherlands are fairly small, but not insignificant [35,36]. Geographically the local risks and the risk reduction measures are fragmented [37] and often not documented. For a systems analysis, a simple requirements-based policy would be practical (for example building codes for a flooding threshold norm of 1/1000 years), but policymakers are currently seeking a cost-benefit approach.
Third: fresh water supply, in which we combine the Delta Model functions fresh and healthy water, agriculture, fresh water supply for drinking and industry, and cooling water. There are many ways to approach this function. A way to formulate the objective is to minimize the risk of fresh water shortage damage. Water intakes transfer fresh water from rivers and lakes to polders, for agriculture and other functions. These are sometimes shut down when the outer water is too salty (or too polluted, or too saturated with algae, etc.), when water levels are too low, or when the water is too warm (for cooling plants). The objective for the fresh water infrastructure could be to minimize the duration of closed water intakes. Complexity lies in the uncertainties in the closure duration calculations and in the damage resulting after closure. Studies are inquiring the possibility to treat fresh water availability in a probabilistic way, similar to flood risk [38].
Fourth: minimize shipping risk, or maximize navigability. Shipping risk is the summed probability of shipping delay times the delay costs, plus the total probability of water depth decrease (in times of drought) times cargo capacity loss costs, integrated over all projected shipping movements [39,40]. A shipping delay can be caused by a dam (with or without locks), a storm surge barrier (with a closing frequency), or a too narrow canal or river. Risks can change with climate, infrastructure, the location of ports or port activities [41], or cargo demand.
Complexity is in the details, such as lock capacities and dredging costs, and of course in the uncertainties of climate and economic scenarios affecting capacities and demands. Risk projections are highly iterative. When for example a dam is built in one branch, ships will take another branch, which will increase resistance to adding a moveable barrier in that branch or to a relocation of port activities, leading to different ships cruising over that branch, and so forth.
These objectives are fairly complex in themselves. Complexity of the system as a whole, increases because of interactions between the functions, such as shown in Figure 4. Furthermore, water infrastructure has more than these objectives, such as ecology and raw materials extraction. Some believe that reasoning from water related objectives alone is too limited, and a proper analysis should include additional functions, such as mobility (road and rail infrastructure) and alternative energy (production and storage) [42].
Figure 4. Some interactions between four main water infrastructure functions.
Water 04 00295 g004
Summarizing, the technical-physical complexity of the Rhine-Meuse delta lies in the water system modeling difficulties, the fragmentation and detail of the objectives, the interaction among the objectives, the uncertainties of future scenarios and therefore the exploding number of iterative cycles when projecting and designing into the future.
Theoretically all of this could be modeled and, in the face of uncertainties, a model user could pick his favorite path into the future. However, there is no single decision-maker; decisions emerge from contributions by a large group of diverse and dynamic stakeholders.

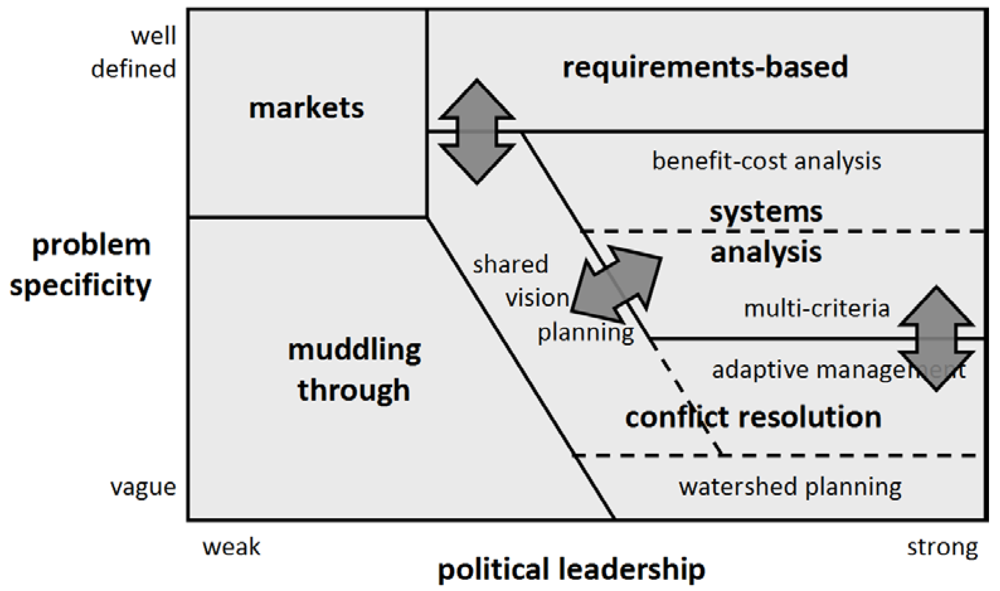
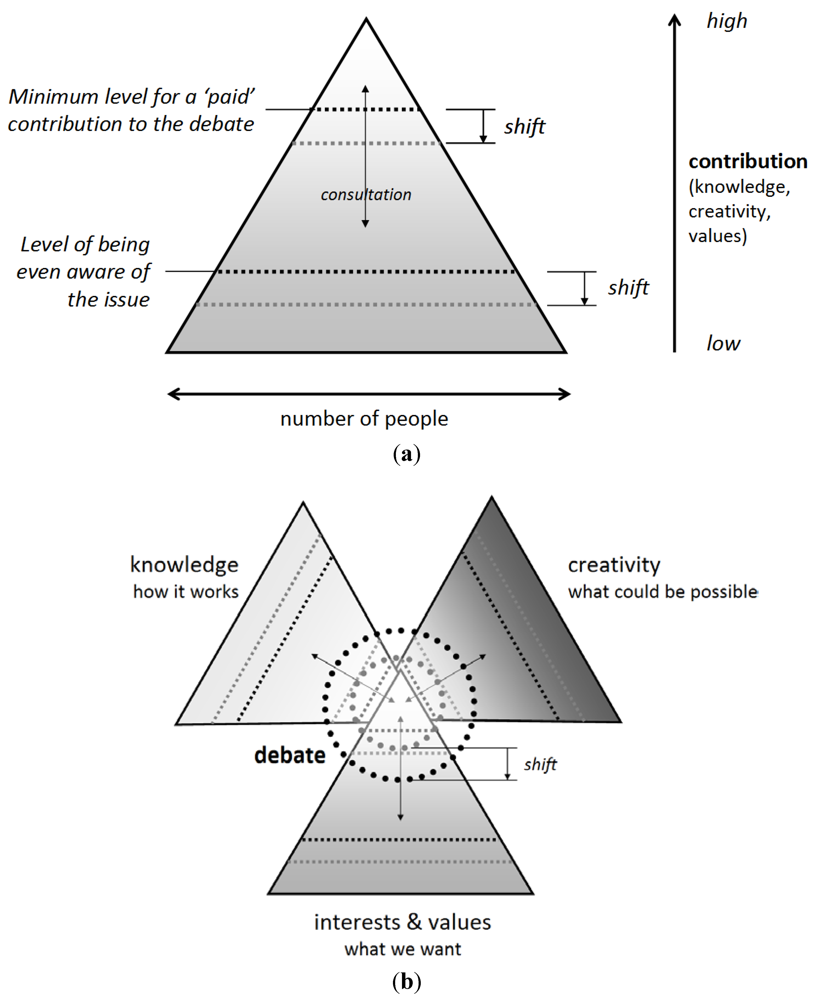
2.3. Socio-Political Complexity

To the complexity analysis we started in the previous section, two socio-political elements can be added: First, non-quantifiable and hidden objectives; Second, the large number of active contributors, providing a large load of knowledge, ideas and preferences.
In policy-making reality, often an alternative chosen is not the best one according to a benefit-cost analysis. For example, some of the Room for the River projects provide safety in a more expensive way than dike enforcements [43]. The argument goes that added “spatial quality” covers this, but it could also be possible that the chosen alternative supports elusive additional objectives, hard or impossible to quantify. Maybe landscape architects are more persuasive than dike experts. Perhaps the Dutch are tired of raising dikes and want to try something different. This was surely the case for the Dutch Delta Plan, developed in the 1960s. The Netherlands Bureau for Economic Policy Analysis (CPB) estimated that raising dikes along Dutch estuaries would have provided the same safety at 10% less costs than building large sea dams to shorten the Dutch coastline, but the government chose for the latter because of additional benefits, some of which were hard to quantify, such as knowledge development, international reputation and expected business development [44].
In theory, non-quantifiable objectives can be modeled in a mathematical systems analysis. For example, the river dike improvements in the early 1990s successfully used “LNC-values” (landscape, nature and culture) in a multi-criteria analysis [45]. Modeled or not, what is eventually needed is a way to shine light on them and make policy discussions as transparent as possible.
A second socio-political aspect is the many involved contributors to planning of the Rhine-Meuse delta. Influential scientists and politicians observe many relevant stakeholders and express the wish for still more involvement. Chairman of the Delta Committee Cees Veerman says: “I believe in the power of the people, in bottom-up innovation”, and: “the whole decision-making-pyramid should be turned upside-down, we should put as much decision-power with the locally involved residents; that is modern governance!” [46].
This inspiring vision has a downside. More participation can lead to high process management costs, higher chances for stalemates, a lower technical level of the discussions and confusion about roles. The Delta Program for example sometimes invites high-school children to workshops. The question is whether they should participate with knowledge and ideas, or be asked about their values.
A centralized government could consult the public, but remain in charge, the way a company does consumer research, but not have the consumers manufacture their products. In the Netherlands however, not only deciding what should be done is being decentralized, also how to do it [10,47]. This makes an integrated national water infrastructure policy harder. Han Meyer, director of the current research project Integrated Planning and Design in the Delta (IPDD), closely related to the Delta Program, writes: “the large amount of interests and stakeholders and the withdrawn role of the central government make a clear policy extremely difficult.” [42].
These two phenomena float on a larger undercurrent described by the theory of Reflexive Modernization. In “modernized modern society”, the emancipation of the individual and the multiplication of possible forms of community weakened institutional boundaries, such as around the nation state and the central government [48]. Necessary components to solve a problem (knowledge, creativity and values—see Figure 5(a,b)) become harder to bring together because they are not static and defined within a small number of institutions, but dynamic and dispersed. Modern process managers handle this by bringing as many people together as often as possible, but this is expensive, lowers the technical quality of the discussions and slows decision making.
Figure 5. (a) Aggregated individual contributions to a public issue such as the Delta Program can be represented by a pyramid shape. Lower are more people, but with less input, such as voters, not even aware of the whole program. Up in the pyramid are fewer people, paid for their input and expected substantive contributions; (b) Participatory design and decision processes stimulate interaction between creativity, knowledge, and values. This happens mostly high in the pyramids. Individuals can be on different levels in the pyramids: the mayor’s contribution can be high in the interests pyramid, low in knowledge and in the middle at creativity. The challenge for the Delta Program is to facilitate the extensive interaction nowadays required, without delaying or flattening outcomes.
Water 04 00295 g005
Sociologists recognize this as a particular problem. Epistemologists Collins and Evans call it “the problem of extension”, which they try to solve by recognizing various levels of expertise in different corners than traditionally acknowledged [49], but without stating that “everyone can become an expert” [50]. Participatory decision processes become cost-efficient when it is clear who is eligible to contribute to which parts of a complex issue. In a workshop, high school kids can seriously disturb a discussion between experts. Then again they deserve to be asked what kind of future they want, and perhaps there could be a cost-effective way to retrieve their ideas and filter them for rare feasible ones, to be elaborated on by the experts.
Summarizing and concluding Section 2: the difficulty of the Rhine-Meuse delta adaptive planning is expressed in two axes of complexity. Physical-technically the system functions are highly interwoven and would benefit from an integrated approach on a national level by a limited number of people with a high level of expertise. Socio-politically there is a tendency in the other direction: more local participation and decentralization of decision-making. The question is how to bring these two together. As Collins and Evans put it: “democracy cannot dominate every domain—that would destroy expertise—and expertise cannot dominate every domain—that would destroy democracy.” [49] Perhaps the answer lies in the framework used by the experts to provide local stakeholders with knowledge they need to express their preferences, and how their preferences and critique are then retrieved.

3. An internet Community-Based Interactive Model: Why and How

The development of the Rhine-Meuse delta is complex, both technical-physically, because of the many different kinds of uncertainties, and socio-politically, because so many people are involved, often with hard-to-quantify and hidden objectives. A practical starting point to handle the technical complexity would be a water system model, producing outcomes for economic analyses and local concepts by engineers and architects. Starting point for the socio-political part could be to put a significant number of stakeholders in a well-informed position to choose between (and criticize) a significant number of alternative solutions to a number of problems. The Delta Program is currently working on this by respectively the Delta Instruments, the regional delta programs and the bridge between the Delta Instruments and the regional stakeholders, the Delta Portal. This paper claims that this bridge is crucial, and deserves innovations from the domains of serious gaming and internet communities.
We will now try to answer two questions. First, which benefits over current policy-support methods would internet-based interactive software provide, and second, if anyone would want to build such a tool for the Rhine-Meuse delta, how to do this and where to start. For simplicity, we will name the proposed “internet community-based gaming-like interactive model” from here on “SimDelta”.

3.1. Benefits of “SimDelta”

The added value of SimDelta to current Delta Program policymaking would be twofold. First: interactive maps can explain a complex system of scenarios, problems and solutions faster and more intuitively than reports and presentations. Second, many stakeholders can be served at lower cost more frequently using the internet than with workshops. Whenever they want and wherever they are, they can explore the Rhine-Meuse problems and solutions, leave comments, drop additional ideas or answer questions by other users.
Let’s recall this paper’s objective for the Delta Program. The planning question could be taken as how to match the supply of possible projects to the demand for them. The successful websites Google, Facebook and E-Bay do just that. These sites mediate supply and demand with a standardized language, easy access, filtered information, and processes that do not get lost after use, but keep improving.
Interactive maps provide both the suppliers (engineers, architects and other designers) and the consumers (the stakeholders) with sufficient understanding of the system to come up with feasible designs and to make well-informed choices. A project can then be chosen for two reasons. It can do well in the systems analysis (the “semi-objective” part), presented with interactive maps and supported by downloadable background documents. A project can also inspire by attractive visualizations, a good “story” and good marketing (the more subjective elusive part), similar to how products, companies and projects are nowadays promoted, increasingly effective over the internet.
Non-interactive communication such as reports, can only transfer and standardize a limited “cognitive load”. The Delta Program so far works with two years (2050 and 2100), two climate scenarios (35 and 85 cm sea-level rise), two economic scenarios and a limited number of alternative solutions. For stakeholders, ranging from members of Parliament to citizens near project locations, it will be hard enough to deal with this number of variables, however limited it is. For the Delta Instruments and for SimDelta it should be no problem to process many alternative-scenario combinations once the frameworks have been set up. When the model is working properly, the limits of the generated data are not set by the model itself, but by the maximum load that can be effectively communicated to the stakeholders.
Future pathways are often represented by decision trees [17], such as made for the Thames estuary. A decision tree for the Delta Program that would fit on an A3-sized paper however would probably not provide enough detail for good decisions. The Thames project leader Tim Reeder writes: “the approach to the Netherlands is more complex [compared to the Thames] (…), regional strategies in different areas, addressing different issues, need to fit on a national scale.” [51]. Under SimDelta lies not a single decision tree, but an entire forest. The way the Netherlands Bureau for Economic Policy Analysis (CPB) handles uncertainty is by presenting a deterministic analysis, and communicating the uncertainty orally, or else the message would become too complicated [52]. In an interactive internet-based model, more scenarios strengthen the analysis, when enough users browse through the solution space to aggregate different reactions to different scenarios. For SimDelta, having many stakeholders is a prerequisite rather than a nuisance.
Of course, there are disadvantages and pitfalls. Lee warns of Large Scale Model Sins [14] and so does Walker (see Figure 6) [53]. The effectiveness of internet platforms and social networks are a whole field of study [54,55]. A single gaming session is often not enough to make stakeholders understand a complex case [56]. Collins and Evans address the problem of “how to use science and technology before there is consensus in the technical community” [49]; lack of scientific consensus can be a problem for SimDelta. Of course, face-to-face contact will always be important. Internet-based gaming-like interactive modeling will never replace decision-making, but can help to streamline and aggregate input.
Figure 6. Policy support models have to be wary of incorporating too much detail—diagram from Walker and Haasnoot [53].
Water 04 00295 g006
Encouragement comes from The Wisdom of Crowds, by James Surowiecky: “large groups of people are smarter than an elite few, no matter how brilliant—better at solving problems, fostering innovation, coming to wise decisions, even predicting the future” [57]. Design theorists promote “crowdsourcing”: “an online, distributed problem solving and production model. Crowdsourcing blends open innovation concepts with top-down, traditional management structures, so that crowdsourcing organizations can effectively tap the collective intelligence of online communities” [58]. “The medium of the Web enables us to harness collective intellect among a population in ways face-to-face planning meetings cannot.” [59]. This collective intellect provides contributions in all three pyramids of Figure 5b: choices (interests and values), criticism (knowledge), and new ideas (creativity).

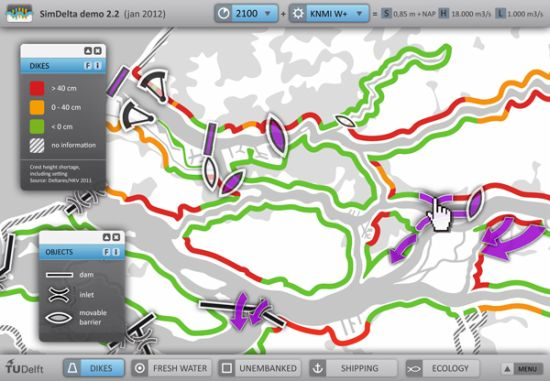
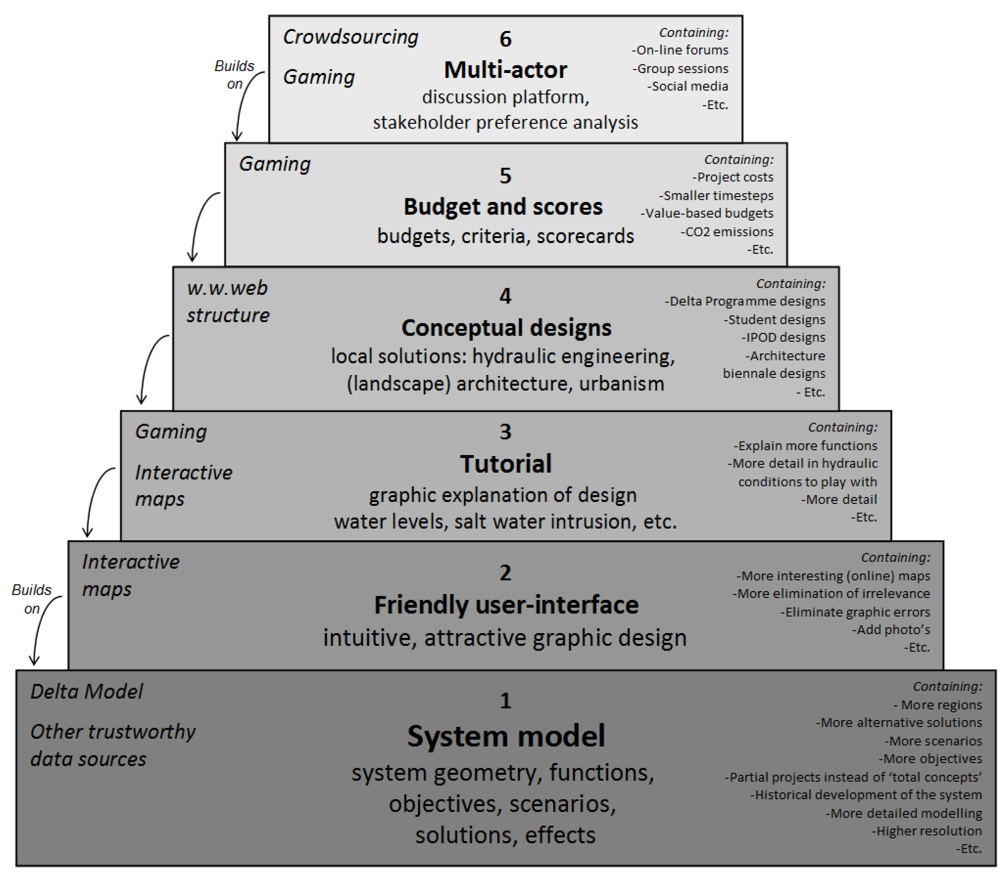
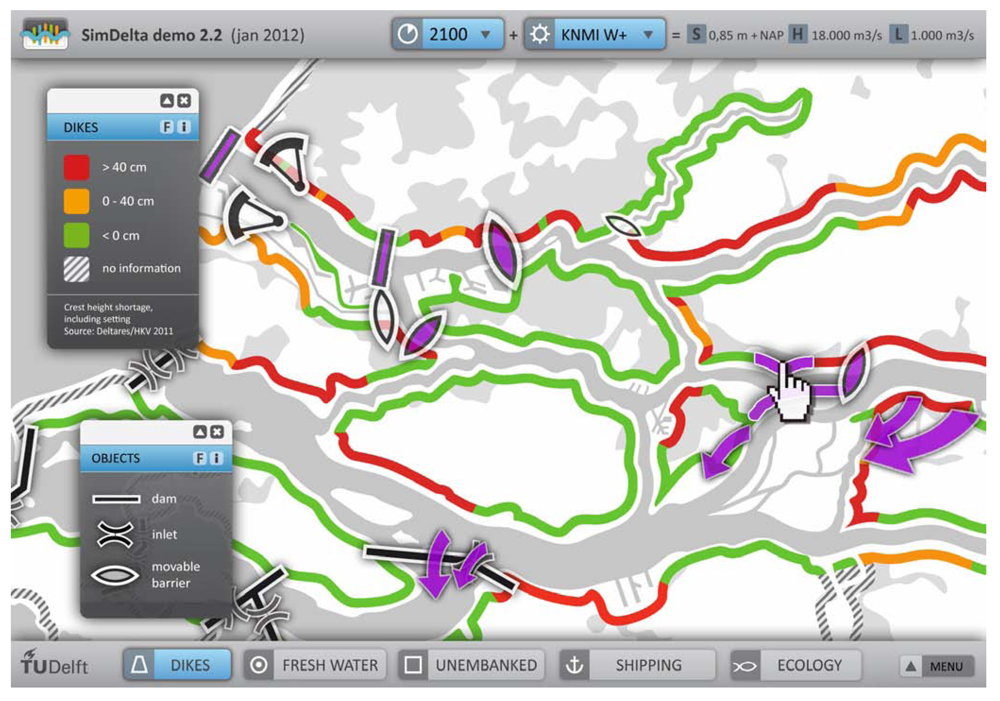
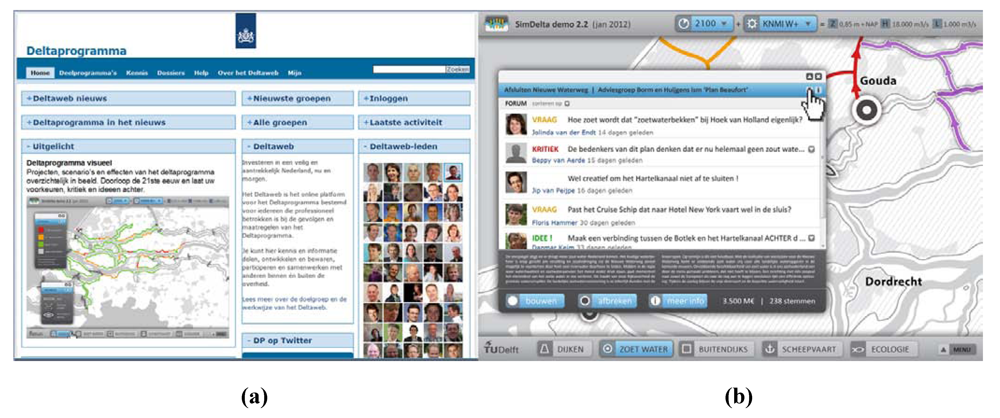
3.2. Features of “SimDelta”

Building an intuitive and attractive interactive model in which stakeholders can pick their favorite projects designed by engineers and architects and see their estimated costs and effects, for a case as large as the entire Dutch water system, stretching far into the 21st century, under various climate and economic scenarios, is an extensive task. The ultimate goal, stakeholder preference analysis (to support democratic decisions on water infrastructure improvements to be implemented in the Netherlands after the year 2020—see the objective in Section 2.1), has to be built on a number of “blocks”.
The base block contains the system model. Various general methods are available for complex systems modeling [1,9]. They relate objectives, functions, measures (alternatives, solutions, projects, strategies, tactics, and so forth), scenarios, effects, etc., to each other. As part of the Delta Instruments project the Deltares institute is currently building the Delta Model (a several million euro project) [11]. The Delta Model is streamlining existing models, connecting different regional models, nesting models of various scales, developing new parts and setting up a data validation procedure. An ideal system model has an open structure, to be able to adopt data sets generated elsewhere. It could indicate various degrees of data validity (for example “class 1—Delta Model-approved”, “class 2—expert guess”). The system model as well as the approved data sets can be continuously expanded by more regions, measures, scenarios, functions, more detail and resolution, and smaller timesteps. Particularly exciting would be to translate the historical development of the system into the systems analysis framework for the future. The Delta Model stops at determining the effects of measures under specific scenarios and passes the effects on to the Delta Program’s regional sub-programs, more closely involved with the stakeholders [12]. It is up to them to (supported by a comparative framework [27]) value the effects and to determine to which extent their objectives are met by particular alternatives. This fits the sequence of blocks (Figure 7), because in SimDelta all users together make their choices and give their criticisms, based on their values and understanding.
Figure 7. To retrieve statistical information on stakeholder preferences with SimDelta, five “blocks” of activities (interactive software development) have to be constructed on top of the Base Block, the system model.
Water 04 00295 g007
Block 2 is an intuitive and attractive user-interface. Between 2005 and 2007, the Dutch project Room for the River developed a software tool, called the Box of Building Blocks (Blokkendoos—here “blocks” are spatial projects), to discuss all 600 possible Room for the River measures with the stakeholders. The software has excellent features, from sand extraction profit calculations to aerial photos. For many stakeholders however the user interface looks old-fashioned and will present too much information in a too technical way. Figure 8 shows an attempt to simplify the Rhine-Meuse system and to make it more attractive to use. It is made with visual design principles such as use of colour codes, icons and other semantics, schematization, simplification, layered information, “use cues”, etc. [60,61,62].
Figure 8. Block 2—intuitive and attractive user-interface. Users can click on objectives and scenarios, build projects or change a policy and immediately see the state of “their delta”.
Water 04 00295 g008
Some people might consider Block 2 just a layer of paint over a serious system model for which one would simply hire a graphic designer at the end of hard modeling work. However, a good user interface requires the difficult tasks of simplification and forcing oneself to identify with an inexperienced user. It takes many iterations to reach a really intuitive user-interface. The best interface designs are made by people who understand both sides the interface connects.
Stakeholders such as politicians do not need to understand detailed physical system complexity to be able to choose among alternative solutions. For example, the absolute or relative design water levels are a step in between problems and solutions; only the flood risk and the pros and cons of safety-improving solutions really matter. However, using the model becomes easier and more fun when some of the underlying system is understood. When a good user interface is in place, this can be used to design a tutorial or “educational plug-in”. The tutorial contains extra images and animations that explain, for example, the origins of the design water levels in the lower river system (which appears to be difficult to many stakeholders). Furthermore, the more users of the model understand some of the backgrounds, the more will discover errors or give suggestions for improvements.
Block 3 will be particularly useful for architects and engineers who contribute to Block 4: conceptual spatial designs, such as multifunctional levees, surge barriers and river expansions. In workshops and meetings where designers meet water experts, time often must be spent explaining how the water system works. Designers” energy can get lost on large scale solutions that are either obvious to water experts, or impossible. The contribution of the designers lies mostly in local solutions (visualized as in Figure 9a–d) or in out-of-the-box large-scale solutions with some sense of reality. Both contributions will be served with a tutorial that explains the system essentials.
Figure 9. Block 4—drawings by engineers and architects: (a) the Nieuwe Merwede river widening combined with nature development (by landscape architect Enno Zuidema and DHV consultants); (b) a flood barrier integrated with a hotel (by architect Anna Dijk); (c) an open Haringvliet (by landscape architect Alphons van Winden for World Wildlife Fund) and (d) a “Parachute Barrier” in the Beneden Merwede (by hydraulic engineer Floris van der Ziel).
Water 04 00295 g009
The first four blocks serve to make the system understandable and show the many projects that could be built in the coming century. It is more fun to navigate through this space when there is a budget to build projects with, and when indicators measure ones performance on the model objectives (as illustrated in Figure 10. The budget will also further sharpen user insight on benefits and costs, and it will be more interesting to monitor his choices, his “willingness to pay”.
Figure 10. Block 5 introduces the gaming elements “budget” and “outcome indicators” (here for example on safety, ecology and other scores).
Water 04 00295 g010
With budget and outcome indicators, SimDelta so far has seven of the nine characteristics of serious games described by Mayer and Zhou. It is “flexible and reusable, immersive, authoritative, transparent, fast and easy, integrative and communicative” [13,56]. The model starts to look like a serious game: an “experimental and/or experiential rule based, interactive environment, where players learn by taking actions and by experiencing their effects through feedback mechanisms deliberately built into and around the game”.
The two remaining characteristics are “dynamic” and “interactive”. “Dynamic” here is defined as “able to show the performance of various alternatives in relation to preferences and behavior of other stakeholders”. “Interactive” means that the model is “able to support the negotiation process among stakeholders” [56]. In other words: the model so far cannot connect various users to each other. The final Block 6 contains the ultimate goal, stakeholder preference analysis, to support decision-making.
Connecting stakeholders through serious gaming is often done by putting a group of people in one room, and have them play and discuss at the same time, happening a couple of times a year. On-line communities with physically separated users can serve more users more frequently and probably against lower costs per stakeholder. However, user input over the internet can get polluted by unserious users. This could be covered by a user admission procedure, or filtered in various ways (a possible filter could be the current ‘Deltaweb’, see Figure 11). It then becomes possible to involve citizens and schools of landscape architecture, urbanism, civil and environmental engineering, nationally and internationally. Live group sessions and on-line communities support each other in various ways.
A mayor represents more than one vote from a particular location and an action group chairman represents a number of voices with a particular background. An advanced model could use user profiles to weight contributions of different users. Even so, SimDelta will never replace a representative democracy. It can only relate user backgrounds to user contributions and thus serve as an opinion poll. Furthermore the crowdsourcing mechanism will contribute to allocating additional design efforts and to determine research agendas.
Figure 11. Block 6—multi-player usability with access through the Deltaweb (a), source: Deltaweb [63]; and a discussion forum (b) to post criticism and new ideas.
Water 04 00295 g011
Crowdsourcing in Block 6 contributes to the inevitable flaws and inaccuracies of Block 1. The accuracy and resolution of the underlying systems model is important, but not necessarily crucial. What ultimately matters are the choices, criticisms and proposed alternative ideas by all participants: each one with a particular level of knowledge, creativity and democratic contribution (see Figure 5b). These people are informed by the system model (block 1), through the layer that makes the system understandable for them (blocks 2 and 3), and possibly “seduced” by architects and designers into non-quantifiable benefits (block 4). They then choose based on their personal knowledge, “gut feeling”, and choices of others (blocks 5 and 6).
If enough stakeholders join the pool, their aggregated contributions will result in either: (1) too much criticism or too many alternative ideas. Analyzing this will give suggestions for further research, development and design priorities; (2) too dispersed choices. This will lead to maintaining the status quo until new elements are introduced in the system, such as new ideas or new scenarios; (3) enough convergence to support the government to decide on a thorough investigation of particular short-term projects (see Figure 2 and Figure 12).
These three possible outcomes more or less correspond to the official government MIRT-research procedure outcomes [12]. The idea of SimDelta is that the outcomes are statistically supported (instead of based on arbitrary conversations among politicians and stakeholders) and graphically understandable (instead of having to rely on a small number of supposedly objective knowledge people). The case will become clearer for more people.
Crowdsourcing is not only used to poll democratic preferences, but also to perpetually self-correct and self-improve. The original systems analysis attempt, to “depoliticize complex and highly political decisions” [13], is revitalized through the contribution of modern internet community technology.
Figure 12. In a SimDelta session budgets and scenarios can vary. Many user sessions together result in a distribution of chosen paths (series of choices) up to 2100. This long-term distribution will probably diverge. If short-term choices converge, they can support a political decision.
Water 04 00295 g012

4. Chances for Success

Technically it is possible to make SimDelta, combining technologies from systems analysis software, interactive websites and serious games. Feasibility might mostly depend on how the concept relates to other methods or groups providing decision support.

4.1. Delta Program Decision Support “Supply”

System engineering specialists model parts of the entire puzzle, such as determining economically optimal flood standards, flood risks or fresh water supply. This group will welcome integrating tools such as the Delta Instruments and SimDelta. They understand and appreciate the systematic thinking, and gladly see their part of the entire puzzle integrated in the larger extent. With an interactive user interface their contribution can be challenged by the comments of users with detailed knowledge of a particular geographical location. Specialists sometimes warn that integrating tools like SimDelta are too complicated and too much work.
Process managers believe that in a well orchestrated process, with enough meetings among officials, stakeholders, specialists and designers, good ideas will eventually find their way to decision makers. Meanwhile, people get to know each other and do “joint fact finding”, enabling a smoother transition from the conceptual phase to the subsequent planning and execution phases [64]. SimDelta will help process managers to understand the system complexity, providing them insight for discussions with specialists. The crowdsourcing of ideas and criticism shapes content, but can also replace part of the process manager’s task of allocating design and development resources.
Spatial planners, landscape architects, engineers, urbanists and architects are obviously better skilled in visualization and generally more creative than modelers and managers. A visual model explaining the water system will help designers to understand the system better, so more could come up with creative alternative solutions in the basic system model block (such as an entire new river where no specialist had thought of before). Second, they will produce better conceptual local designs (Figure 9 and Block 4 in Figure 7) when they understand the overall system better. The part of SimDelta that democratically supports ideas is typically feared by designers to lead to conservative or populist decisions.

4.2. Delta Program Decision Support “Demand”

Decision support is traditionally offered to politicians and other stakeholders, such as companies or interest groups with a single objective like port development or ecology. This primary user group of SimDelta will contribute with the most exciting choices and comments. Politicians and interest groups are interested in the citizens they represent and to whom they have to explain their decisions, so involved citizens could just as well be asked to use SimDelta. Furthermore, while the specialists, managers and designers browse SimDelta to supply ideas and comments, they are at the same time Dutch citizens with interesting opinions.
The more users SimDelta will have, from any corner of society, the more valuable the gathered information will be to the primary stakeholders. In contrast to participation workshops, for SimDelta, serving more stakeholders is hardly more expensive (one of the web 2.0 competitive advantages [65]).
SimDelta provides stakeholders and citizens insight into scenarios, problems and solutions, and also in other stakeholders. This should make them more cooperative, better able to formulate criticism and to present alternative ideas. Politicians believing in Veerman’s “decision-making-pyramid turned upside-down” [46] are expected to welcome statistically sound stakeholder preference analyses to support their decisions, similar to companies being interested in market research to support the launch of a new product.
At the supply and the demand side, some people will believe that the current planning process and our current shared understanding of the system are already clear enough, transparent enough and effective enough. Others are more critical. Some will welcome the process to be demystified, others will feel threatened. For each, SimDelta would not replace current practice, but add to it. E-Bay and Facebook are successful, but flea markets and pubs still exist.

4.3. Concluding Remarks

A water infrastructure system is never finished. Planning support instruments also evolve over time, but the fundamentals will probably remain the same. The comprehensive Dutch Delta Program is supported both by the methods of Systems Analysis, modeling technical and economic aspects on a national level, and Conflict Resolution, to address the many local interests. Adaptive Planning is introduced to deal with changing circumstances. An instrument combining these three methods would model the interaction between scenarios, problems and solutions, be highly open to changes and improvements, and easily accessible by a large group of participants.
Advances in serious gaming and internet communities spark ideas for interactive software to compose one’s own delta, similar to the game “SimCity”. A “SimDelta” would start with the current Dutch water system, and then present feasible solutions to problems showing up under various future scenarios. A click on a solution presents more detailed designs by engineers and architects, to involve hard-to-quantify additional benefits, such as landscape quality, innovative technologies, or smart combinations with other public functions. SimDelta could be used by single users or groups, and would have forums for discussion.
Ideally, all knowledgeable and creative people in the field deliver SimDelta content, and all relevant stakeholders make their choices very seriously. If every participant completes his background profile accurately, SimDelta can provide decision-makers with statistical relationships between stakeholder properties, and their criticisms and preferences. In reality however, such an instrument will never be complete, nor will it be flawless. It takes time to become widely known, and still many people will not want to participate for many thinkable reasons. Interest groups might try to abuse SimDelta. Data accuracy will always be a subject of discussion.
In current policy making, different decision support activities compete with each other. This appears messy, but could also be seen as a democratic balance of power or a healthy competitive market. A new instrument like SimDelta will have to gradually gain support and evolve. A first step to take would be to limit the number of scenarios, problems and solutions, the geographical region to focus on, and the number of stakeholders to engage.

Acknowledgments

Thanks to everyone who contributed with ideas, criticism and reviews, especially Jay Lund, Warren Walker, Floris Hammer, Jos Timmermans, Maurits Ertsen, Maarten-Jan Kallen, Matthijs Kok and Han Vrijling.

Figures

All drawings and diagrams are made by Ties Rijcken unless indicated otherwise.

References

  1. Walker, W.E. Policy analysis: A systematic approach to supporting policymaking in the public sector. J. Multi-Criteria Decis. Anal. 2000, 9, 11–27. [Google Scholar] [CrossRef]
  2. Lund, J.R. Approaches to planning water resources. 2008; unpublished paper. [Google Scholar]
  3. Delta Commission, Working Together with Water: A Living Land Builds for Its Future—Findings of the Deltacommissie 2008; Secretariat Delta Program: The Hague, The Netherlands, 2008.
  4. Kuijken, W. Analyse en Advies Borging Financiering Deltaprogramma (Analysis and Advice to Secure the Delta Programme Budget); Secretariat Delta Committee: The Hague, The Netherlands, 2011. [Google Scholar]
  5. Van Dantzig, D. Economic decision problems for flood prevention. Econometrica 1956, 24, 276–287. [Google Scholar]
  6. Lindblom, C. The science of muddling through. Public Adm. Rev. 1959, 19, 79–88. [Google Scholar]
  7. Stalenberg, B. Design of Floodproof Urban Riverfronts.
  8. Vrijling, J.K. Integral and Sustainable Design of Multifunctional Flood Defences (STW Project Description); Delft University of Technology: Delft, The Netherlands, 2010. [Google Scholar]
  9. Keeney, R.L. Value-Focused Thinking: A Path to Creative Decisionmaking; Harvard University Press: Cambridge, MA, USA, 1996. [Google Scholar]
  10. Delta Programme, Working on the Delta—Investing in a Safe and Attractive Netherlands, Now and in the Future; Ministry of Infrastructure and the Environment, Ministry of Economic Affairs, Agriculture and Innovation: The Hague, The Netherlands, 2010.
  11. Delta Programma, Deltamodel—Functionele Specificaties en Kwaliteitseisen (Delta Model—Functional Specifications and Quality Standards); Ministry of Infrastructure and the Environment: The Hague, The Netherlands, 2011.
  12. Marchand, M. Achtergronddocument Beoordelingskader Deltamodel (Background Document Evaluation Framework Delta Model); Deltares: Delft, The Netherlands, 2010. [Google Scholar]
  13. Mayer, I.S. The gaming of policy and the politics of gaming: A review. Simul. Gaming 2009, 40, 825–862. [Google Scholar]
  14. Lee, D.B. Requiem for large-scale models. J. Am. Inst. Plan. 1973, 39, 163–178. [Google Scholar]
  15. Stive, M.J.F.; Fresco, L.O.; Kabat, P.; Parmet, B.W.A.H.; Veerman, C.P. How the Dutch plan to stay dry over the next Century. Proc. ICE Civil Eng. 2011, 164, 114–121. [Google Scholar] [CrossRef]
  16. Aerts, J.C.J.H.; Botzen, W.; Veen, A.; Krywkow, J.; Werners, S. Dealing with uncertainty in flood management through diversification. Ecol. Soc. 2008, 13, 1–17. [Google Scholar]
  17. Haasnoot, M.; Middelkoop, H.; van Beek, E.; van Deursen, W.P.A. A method to develop sustainable water management strategies for an uncertain future. Sustain. Dev. 2009, 19, 369–381. [Google Scholar]
  18. Kwadijk, J.C.J.; Haasnoot, M.; Mulder, J.P.M.; Hoogvliet, M.M.C.; Jeuken, A.B.M.; van der Krogt, R.A.A.; van Oostrom, N.G.C.; Schelfhout, H.A.; van Velzen, E.H.; van Waveren, H.; de Wit, M.J.M. Using adaptation tipping points to prepare for climate change and sea level rise: A case study in the Netherlands. Wiley Interdiscip. Rev. Clim. Chang. 2010, 1, 729–740. [Google Scholar]
  19. Delta Programme, Working on the Delta—Acting Today, Preparing for Tomorrow; Ministry of Infrastructure and the Environment, Ministry of Economic Affairs, Agriculture and Innovation: The Hague, The Netherlands, 2011.
  20. Holling, C.S. Adaptive Environmental Assessment and Management; United Nations Environment Programme, John Wiley & Sons: Hoboken, NJ, USA, 1978. [Google Scholar]
  21. Lee, K.N. Appraising adaptive management. Conserv. Ecol. 1999, 3, 1–18. [Google Scholar]
  22. Ingham, A.; Ma, J.; Ulph, A. Theory and Practice of Economic Analysis of Adaptation; Tyndall Centre for Climate Change Research: Norwich, UK, 2006. [Google Scholar]
  23. Rahman, S.A.; Walker, W.; Marchau, V. Coping with Uncertainties About Climate Change in Infrastructure Planning—An Adaptive Policymaking Approach. Ecorys and Delft University of Technology: Delft, The Netherlands, 2008. [Google Scholar]
  24. Walker, W.E. Policy Analysis, 1962-2012: From Predict And Act To Monitor And Adapt; Delft University of Technology: Delft, The Netherlands, 2011. [Google Scholar]
  25. Van Overloop, P.-J. Operational Water Management of the Main Waters in The Netherlands; Delft University of Technology: Delft, The Netherlands, 2009. [Google Scholar]
  26. Van Gelder, P.H.A.J.M.; Mai, C.V. Distribution functions of extreme sea waves and river discharges. J. Hydraul. Res. 2008, 46, 280–291. [Google Scholar]
  27. Lamberigts, P.; Marchand, M. Vergelijkingssystematiek Deltaprogramma; Structuur, Inrichting en Gebruik (Comparative Framework Delta Programme; Structure, Content and Usage); Staf Deltacommissaris: Den Haag, The Netherlands, 2011. [Google Scholar]
  28. Kanning, W.; van Gelder, P.H.A.J.M. Partial Safety Factors to Deal with Uncertainties in Slope Stability of River Dikes, in: Uncertainty in Industrial Practice, a Guide to Quantitative Uncertainty Management; Wiley: Hoboken, NJ, USA, 2008. [Google Scholar]
  29. Jonkman, S.N. Loss of Life Estimation in Flood Risk Assessment.
  30. Jonkman, S.N.; Rijcken, T.; Lansen, J. Keteneffecten Japan ook bij Overstromingsrampen in Nederland te Verwachten (Indirect Effects Japan also to be Expected with Dutch Flood Disasters); Magazine nationale veiligheid en crisisbeheersing: The Hague, the Netherlands, 2011; pp. 12–14. May. [Google Scholar]
  31. Rijkswaterstaat, Veiligheid Nederland in Kaart—Hoofdrapport Onderzoek Overstromingsrisico’s (Mapping Flood Safety in the Netherlands); Ministry of Infrastructure and the Environment: The Hague, The Netherlands, 2005.
  32. Projectbureau VNK2. In Veiligheid Nederland in Kaart—de Methode van VNK2 Nader Verklaard, de Technische Achtergronden (Mapping Flood Safety in The Netherlands, Technical Backrounds to the “VNK2” Method); Ministry of Infrastructure and the Environment: The Hague, The Netherlands, 2011.
  33. Technical Advisory Committee on Water Defences, Fundamentals on Water Defences; Ministry of Water Management: The Hague, The Netherlands, 1998.
  34. Van der Most, H. Samenvatting van de Analyse van Slachtofferrisico’s en Maatschappelijke Kosten-Batenanalyse Waterveiligheid 21e Eeuw; Onderzoek ten Behoeve van de Actualisering van Waterveiligheidsnormen (Summary of the Analysis of Casualty Risk and Benefit-Cost Analysis for the Project “Water Safety 21st Century”; Research for New Flood Standards); Deltares: Delft, The Netherlands, 2011. [Google Scholar]
  35. Rijcken, T.; Kok, M.; Vrijling, J.K.; de Hoog, M. Rhine Estuary Closeable but Open—A Systems Approach; Knowledge for Climate: Utrecht, The Netherlands, 2010. [Google Scholar]
  36. Veerbeek, W.; Huizinga, J.; Asselman, N.; Lansen, A.J.; Jonkman, S.N.; van der Meer, R.; van Barneveld, N. Flood risk in Unembanked Areas; Knowledge for Climate: Utrecht, The Netherlands, 2010. [Google Scholar]
  37. De Hoog, M.; Nillesen, A.L. Stedenbouw en Multifunctionele Waterkeringen (Urbanism and Multifunctional Flood Defenses); Knowledge for Climate: Utrecht, The Netherlands, 2010. [Google Scholar]
  38. Zethof, M. Risk-Based Control of Salt Water Intrusion for the Rhine-Meuse Estuary.
  39. Jonkeren, O.; Rietveld, P. Impacts of Low and High Water Levels on Inland Waterway Transport—Literature Review; Knowledge for Climate: Utrecht, The Netherlands, 2009. [Google Scholar]
  40. De Jong, M.; Vellinga, T. Effecten van Afsluitbaar Open Rijnmond op de Scheepvaart (Rhine Estuary Closable but Open, Effects on Shipping); Knowledge for Climate: Utrecht, The Netherlands, 2010. [Google Scholar]
  41. Port of Rotterdam—Port Vision 2030; Port Compass: Rotterdam, The Netherlands, 2011.
  42. Meyer, V.J. Urban Regions in the Delta; Delft University of Technology: Delft, The Netherlands, 2011; p. 37. [Google Scholar]
  43. Ebregt, J.; Eijgenraam, C.J.J.; Stolwijk, H.J.J. Kosten-Batenanalyse Voor Ruimte Voor de Rivier, Deel 2: Kosteneffectiviteit van Maatregelen en Pakketten (Benefit-Cost Analysis for Room for the River, Part 2: Cost Efficiency of Measures and Packages); CPB Netherlands Bureau for Economic Policy Analysis: The Hague, The Netherlands, 2005. [Google Scholar]
  44. Tinbergen, J. Rapport Deltacommissie. Deel 6-6: De Economische Balans van het Deltaplan (Report Delta Commission. Part 6-6: Balance sheet of the Delta Plan); Rijkswaterstaat: The Hague, The Netherlands, 1961. [Google Scholar]
  45. Walker, W.E.; Abrahamse, A.; Bolten, J.; Kahan, J.P.; van de Riet, O.; Kok, M.; Braber, M.D. A policy analysis of dutch river dike improvements: Trading off safety, cost, and environmental impacts. Oper. Res. 1994, 42, 823–836. [Google Scholar] [CrossRef]
  46. DeltaresNetwerk DeltatechnologieRijkswaterstaat WINNInspireren tot Innoveren in de Delta (Inspiration for Innovation in the Delta); Deltares: Delft, The Netherlands, 2009.
  47. Nota Ruimte, Nota Ruimte (National Spatial Planning Policy for The Netherlands); Ministry of Housing, Spatial Planning and Environment: The Hague, The Netherlands, 2004.
  48. Beck, U.; Bonss, W.; Lau, C. The theory of reflexive modernization: Problematic, hypotheses and research programme. Theory Cult. Soc. 2003, 20, 1–33. [Google Scholar]
  49. Collins, H.; Evans, R. Rethinking Expertise, 1st ed; University Of Chicago Press: Chicago, IL, USA, 2007. [Google Scholar]
  50. Miedema, F. Iedereen kan Expert Worden (Everyone can Become an Expert); Academische Boekengids: Amsterdam, The Netherlands, 2011 September; pp. 21–24. [Google Scholar]
  51. Jeuken, A.; Reeder, T. Short-Term Decision Making and Long Term Strategies: How to Adapt to Uncertain Climate Change, Examples from the Thames Estuary and the Rhine-Meuse Delta; Water Governance: The Hague, The Netherlands, 2011 July; pp. 29–35. [Google Scholar]
  52. De Vries, A. Kennis is Macht—Onzekerheid als Troefkaart van het Centraal Planbureau (Knowledge is Power, Uncertainty as Trump Card for the Netherlands Bureau for Economic Policy Analysis); Idee—Tijdschift van het Kenniscentrum van D66: The Hague, The Netherlands, 2010 September; pp. 28–32. [Google Scholar]
  53. Walker, W.E.; Haasnoot, M. White Paper Uncertainty Analysis and Decision-Making under Uncertainty with the Deltamodel; Deltares: Delft, The Netherlands, 2011. [Google Scholar]
  54. Oinas-Kukkonen, H.; Lyytinen, K.; Yoo, Y. Social networks and information systems: Ongoing and future research streams. J. Assoc. Inf. Sys. 2010, 11, 62–68. [Google Scholar]
  55. Ridings, C.; Wasko, M.M.L. Online discussion group sustainability: Investigating the interplay between structural dynamics and social dynamics over time. J. Assoc. Inf. Sys. 2010, 11, 95–121. [Google Scholar]
  56. Zhou, Q.; Bekebrede, G.; Warmerdam, J.; Knepfle, M. Connecting water management and spatial planning through simulation gaming: The experience of the climate game in the Netherlands. In Water Governance and Connective Capacity; Ashgate: Farnham, UK, 2012; in press. [Google Scholar]
  57. Surowiecki, J. The Wisdom of Crowds; Anchor: Harpswell, ME, USA, 2005. [Google Scholar]
  58. Brabham, D.C. Crowdsourcing. 2008. Available online: http://dbrabham.wordpress.com/crowdsourcing (accessed on 13 March 2012).
  59. Brabham, D.C. Crowdsourcing the public participation process for planning projects. Plan. Theory 2009, 8, 242–262. [Google Scholar]
  60. Mijksenaar, P. Visual Function: An Introduction to Information Design; Princeton Architectural Press: New York, NY, USA, 1997. [Google Scholar]
  61. Tufte, E.R. The Visual Display of Quantitative Information, 2nd ed; Graphics Pr: Cheshire, CT, USA, 2001. [Google Scholar]
  62. Luyer, G. Complexiteitsreductie als Fundamentele Kennis Voor de Grafisch Ontwerper (Complexity Reduction as Fundamental Knowledge for the Graphic Designer).
  63. Jansen, D. Deltaweb. 2011. Available online: http://deltaprogramma.pleio.nl/ (accessed on 13 March 2012).
  64. Majone, G. Evidence, Argument, and Persuasion in the Policy Process; Yale University Press: New Haven, CT, USA, 1992. [Google Scholar]
  65. Oreilly, T. What is Web 2.0: Design patterns and business models for the next generation of software. Commun. Strateg. 2007, 1, 17–38. [Google Scholar]

