Article

Scenario Analysis of Nutrient Removal from Municipal Wastewater by Microalgal Biofilms

1
Wetsus—Centre of Excellence for Sustainable Water Technology, P.O. Box 1113, Leeuwarden 8900 CC, The Netherlands
2
Sub-department of Environmental Technology, Wageningen University, P.O. Box 8129, Wageningen 6700 EV, The Netherlands
3
Bioprocess Engineering, Wageningen University, P.O. Box 8129, Wageningen 6700 EV, The Netherlands
*
Author to whom correspondence should be addressed.
Water 2012, 4(2), 460-473; https://doi.org/10.3390/w4020460
Submission received: 27 February 2012 / Revised: 27 March 2012 / Accepted: 13 April 2012 / Published: 27 April 2012

Abstract

:
Microalgae can be used for the treatment of municipal wastewater. The application of microalgal biofilms in wastewater treatment systems seems attractive, being able to remove nitrogen, phosphorus and COD from wastewater at a short hydraulic retention time. This study therefore investigates the area requirement, achieved effluent concentrations and biomass production of a hypothetical large-scale microalgal biofilm system treating municipal wastewater. Three scenarios were defined: using microalgal biofilms: (1) as a post-treatment; (2) as a second stage of wastewater treatment, after a first stage in which COD is removed by activated sludge; and (3) in a symbiotic microalgal/heterotrophic system. The analysis showed that in the Netherlands, the area requirements for these three scenarios range from 0.32 to 2.1 m2 per person equivalent. Moreover, it was found that it was not possible to simultaneously remove all nitrogen and phosphorus from the wastewater, because of the nitrogen:phosphorus ratio in the wastewater. Phosphorus was limiting in the post-treatment scenario, while nitrogen was limiting in the two other scenarios. Furthermore, a substantial amount of microalgal biomass was produced, ranging from 13 to 59 g per person equivalent per day. These findings show that microalgal biofilm systems hold large potential as seasonal wastewater treatment systems and that it is worthwhile to investigate these systems further.

Abbreviations

COD
Chemical Oxygen Demand
SRT
Sludge retention Time
MTR
Maximum Tolerable Risk
VSS
Volatile suspended solids
PAR
Photosynthetic Active Radiation
WWTP
Wastewater Treatment Plant
PE
Person Equivalent

1. Introduction

The conventional treatment of municipal wastewater consists of activated sludge processes with a combination of nitrification and denitrification and biological or chemical phosphorus removal. However, other treatment systems are also used, including systems based on microalgae, eukaryotic microorganisms and prokaryotic cyanobacteria that carry out oxygenic photosynthesis [1]. Microalgae have a high affinity for nitrogen (N) and phosphorus (P), illustrated by the low values reported for half-saturation constants, ranging from 0.56 to 3094 µg N/L, and from 0.001 to 81.9 µg P/L [2,3,4,5]. Microalgae can either grow in suspension (phytoplankton) or on substrata (benthic) in biofilms [6]. Microalgal biofilms are attached microbial consortia of phototrophs and chemotrophs entrapped in an exopolymeric matrix, and are omnipresent in aquatic environments [7,8]. Although not given a lot of attention, microalgal biofilms systems could form interesting wastewater treatment systems. A microalgal biofilm system can operate at short hydraulic retention times due to the ability of the biofilm to retain the biomass. It is also expected that, in contrast to suspended microalgal systems, little or no separation of microalgae and water is required before discharging the effluent [9,10]. Furthermore, no mixing is needed in the system, resulting in a lower energy requirement than for suspended systems.
Algal biofilms systems can be composed of large biofilm panels over which the wastewater flows. These panels can either be placed horizontally, at an angle like the algal turf scrubber [11], or vertically in rows like the twin layer system [12]. Such microalgal biofilms may be used at different stages of the wastewater treatment. A first scenario is using microalgal biofilms as a post-treatment system. In light of the EU Water Framework Directive objective to obtain good chemical and ecological status for all surface waters by 2015, this can be an interesting concept. The high affinity of microalgae for N and P and the lack of requirement of an organic carbon source are advantages over currently available post-treatment systems. A microalgal biofilm can also be used to remove N and P after a highly loaded activated sludge system. The microalgal biofilm then serves as an alternative for nitrification and denitrification and chemical or biological P removal. This scenario holds the advantages of a higher net heterotrophic biomass yield, and a lower energy input for aeration compared to a conventional wastewater treatment system.
A third option is applying an algal-bacterial biofilm to treat the wastewater directly. This scenario makes use of a symbiotic relationship that may develop when using microalgae and heterotrophs together. During this symbiosis the microalgae produce oxygen (O2) that is needed by aerobic heterotrophs, and the carbon dioxide (CO2) that is released by these heterotrophs is in turn used by the microalgae. In this manner no external O2 supply is needed, which saves the energy otherwise required for aeration of the activated sludge system.
Previous studies have shown that microalgal biofilms systems can achieve good removal of N and P from wastewater. Removal capacities over 90% were measured for ammonium (NH4+), nitrate (NO3) and over 80% for phosphate (PO43−) [12,13,14], and up to 75% of the Chemical Oxygen Demand (COD) was removed from diluted swine manure in an algal-bacterial biofilm [14]. However, the feasibility of the application of microalgal biofilms in wastewater treatment will be determined by more factors than the removal capacity. These factors include the achieved effluent concentrations, biomass production and the area requirement. Especially the latter is a point of concern, as algal systems are known for their relatively large area requirement. Unfortunately, little is known about these aspects of microalgal biofilms and how the three different scenarios mentioned above compare.
This study aims to get insight in the feasibility of using microalgal biofilms for municipal wastewater treatment. A scenario analysis will be performed for the three different concepts of using microalgal biofilms in municipal wastewater treatment. This analysis compares the area requirement, achieved effluent concentrations and biomass production under the conditions of municipal wastewater treatment in the Netherlands. In addition, this study seeks to determine what knowledge is still lacking in order to be able to make a final conclusion on the feasibility of microalgal biofilms in wastewater treatment.

2. Material and Methods
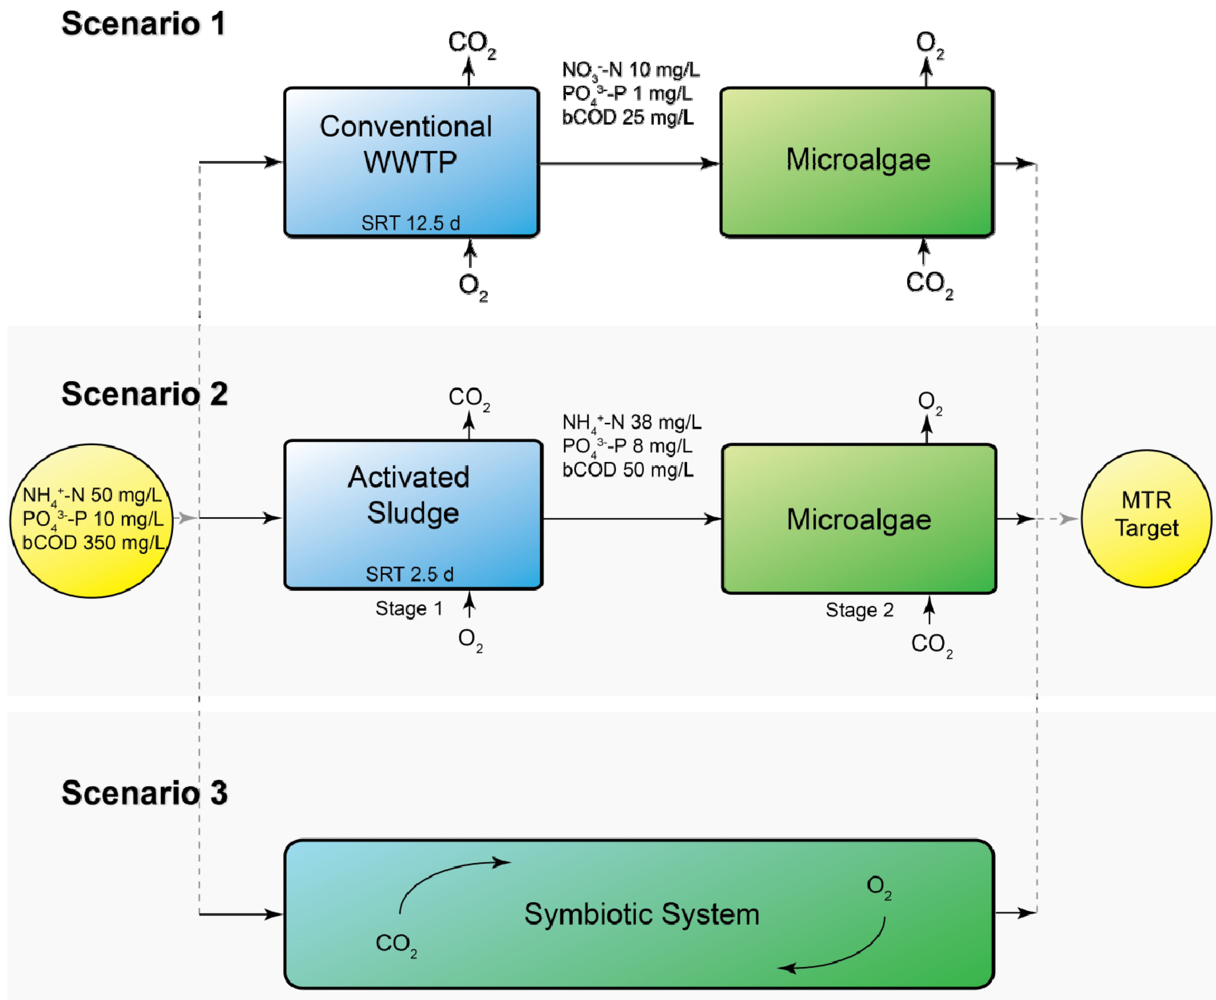
2.1. Scenarios

Three different scenarios were defined in which microalgae are integrated in a municipal wastewater treatment plant (WWTP), as shown in Figure 1.
In Scenario 1 the microalgal biofilm system is used as a post-treatment system for effluent from an activated sludge process. In Scenario 2 the first stage of wastewater treatment removes the bulk of the COD. Nitrification is prevented in this stage by operating at a short sludge retention time (SRT; 2.5 days). The second stage consists of a microalgal biofilm system removing N and P. In contrast to Scenario 1, N is mainly present as NH4+ rather than NO3. In Scenario 3 the microalgae are used in a symbiotic process of algae and bacteria. N is removed by combined nitrification and denitrification and via assimilation by microalgae, COD is removed by heterotrophs, and P is mainly assimilated by microalgae.
In all scenarios the target effluent values were 2.2 mg/L total N and 0.15 mg/L total P. These values are the maximum tolerable risk (MTR) guidelines which are used by the Dutch water boards, as the classification of the good chemical and ecological status of surface water of the Water Framework Directive is not yet known.
Figure 1. Schematic overview of the three different scenarios of using microalgal biofilms in municipal wastewater treatment. The incoming wastewater and target effluent MTR values of 2.2 mg/L N and 0.15 mg/L P are equal for all scenarios. The sludge retention time (SRT) is shown for the activated sludge compartments of Scenarios 1 and 2.
Water 04 00460 g001

2.2. Calculations and Parameters

2.2.1. Microalgae

The WWTP in this study was located in the Netherlands and receives wastewater from 100,000 inhabitants producing 130 L per person equivalent (PE) per day. In the Netherlands, microalgal systems offer the highest potential at tourist locations during the period late spring-early autumn, when an increased wastewater production is accompanied by the highest irradiation of the year. Therefore, only the period late spring-early autumn was considered in this analysis, corresponding with the tourist season. The microalgal biofilm system therefore receives irradiation summed over the months May until October. The microalgae utilize 43% of this irradiation, equivalent to the photosynthetic active radiation (PAR, 400–700 nm). The variation of irradiance during the day and over these months has not been taken into account, but will be discussed subsequently. The summed irradiation was equal to 4773 mol photons/m2 (see Appendix A).
An important parameter of the microalgal system is the quantum requirement of the photosynthetic process. This is the efficiency with which the microalgae take up light energy and convert it to chemical energy, i.e., new biomass, while releasing O2. Under low light intensities, approximately 10 PAR photons are required for the liberation of one molecule of O2[15,16]. At higher light intensities, photosaturation takes place and part of the absorbed light is lost in the form of heat. Considering this photosaturation effect, a vertical positioning of the microalgal biofilm system is proposed and a minimal quantum requirement of 20 PAR photons per O2 is envisioned [17]. This corresponds to a maximum oxygen quantum yield ( Water 04 00460 i007) of 0.05 O2/photon. With Water 04 00460 i007 the amount of O2 produced per photons received per m2 of ground area is calculated:
Water 04 00460 i001
with Ro,A,algae the areal oxygen production by microalgae [mol/m2/d]; PFD the photon flux density [mol photons/m2/d].
The following stoichiometrical reactions are used for microalgae, with either nitrate (assumed in Scenario 1) or ammonium (assumed in Scenarios 2 and 3) as nitrogen source:
Water 04 00460 i002
The areal amount of biomass produced (Px,A,algae) is calculated with Equation 2 or 3; 1.42 mol O2 coincides with 1 mol of biomass (on C-basis) in case of NO3 uptake or 1.18 mol O2 with 1 mol of biomass in case of NH4+ uptake. This biomass is assumed to be present in a biofilm kept at optimal thickness through regular harvesting of the biofilm. Keeping the biofilm at this thickness will reduce respiration losses and ensure an optimal nutrient uptake capacity.
It is expected that the microalgal biofilm will be composed of a mixed culture of microalgae, due to varying conditions with respect to temperature, and N and P concentrations. We assumed an average microalgal biomass composition for this mixed culture, of 7.8% N and 1.4% P (w/w, based on algal biomass of CH1.78O0.36N0.12P0.01) [18,19,20]. With the amount of biomass produced known and the fraction of N and P present in the biomass, the uptake of N and P from the wastewater is calculated. The following calculation shows the uptake of N, but the calculation of the P uptake is equivalent:
Water 04 00460 i003
with RN,A,algae the areal N uptake rate by microalgae [g/m2/d]; Px,A,algae the areal microalgal biomass production rate [g/m2/d] and fN,algae the fraction of N in the microalgal biomass [g/g].
Using the desired amount of N or P removed, the area was calculated as:
Water 04 00460 i004
with A the area [m2] and Q the flowrate [m3/d].

2.2.2. Heterotrophs

It was assumed that biomass production in the activated sludge process is only accounted for by the heterotrophic biomass converting COD. The following formula is used [21]:
Water 04 00460 i005
with Px,sludge the sludge production [g VSS/d]; Ysludge the biomass yield [g VSS/g bCOD], SRT the sludge retention time [d]; fd the fraction remaining as cell debris [g VSS/g VSS] and kd the decay coefficient [d−1].
The sludge in the WWTP was assumed to have an average composition of 12% N and 2% P (w/w based on sludge biomass of C1H1.4O0.4N0.2) [21]. With the amount of biomass produced known and the fraction of N and P present in the biomass, the uptake of N (RN,sludge) and P from the wastewater is calculated. Calculation shown here for N:
Water 04 00460 i006
Additional calculations of O2 and CO2 production and consumption, and a list of all parameters can be found in Appendix A.

3. Results

Table 1 shows the area requirement of the microalgal biofilm and the corresponding effluent concentrations for the different scenarios. The area requirements are based on the calculated uptake capacities of 1.85 g N/m2/d and 0.34 g P/m2/d in Scenario 1 and 2.2 g N/m2/d and 0.41 g P/m2/d in Scenarios 2 and 3. The area requirement of the post-treatment system of Scenario 1 is the smallest with 0.32 m2/PE, followed by the symbiotic system of Scenario 3 requiring 0.76 m2/PE. The large area requirement of 2.1 m2/PE of Scenario 2 in comparison to Scenarios 1 and 3 was due to the larger amount of N that needed to be assimilated by the microalgae in this scenario.
Table 1. The required ground area and effluent concentrations of N and P of a microalgal biofilm system treating wastewater from 100,000 inhabitants in the Netherlands during May to October for the three different scenarios.
ScenarioArea requirement(m2/PE)Effluent total N(mg/L)Effluent total P(mg/L)
Scenario 10.325.390.15
Scenario 22.102.201.40
Scenario 30.762.206.07
The limiting nutrient was found to be P for Scenario 1 and N for Scenarios 2 and 3. The calculations were therefore performed for P reaching the desired MTR value in Scenario 1 and for N reaching the desired value for Scenarios 2 and 3. Consequently, in the P limiting Scenario 1, the N concentration remained above target with 5.39 mg N/L, while in the N limiting Scenarios 2 and 3 the P concentration remained above target. The latter two also did not comply with current EU effluent discharge requirements of 1 mg P/L. Consequently, the desired effluent values for both N and P could not be reached simultaneously.
In Scenario 3, a symbiotic relationship between microalgae and heterotrophs was assumed to develop. The O2 production by the microalgae and the O2 consumption by the heterotrophs were balanced, by adjusting the fraction of N that was removed by combined nitrification and denitrification and the fraction that was assimilated by microalgae. Figure 2 shows that the O2 in the system was balanced when 70% of the NH4+ was converted by the heterotrophs (nitrification-denitrification) and the remaining 30% by the microalgae. With this balance, the microalgae supply all O2 for the heterotrophs, and aeration is theoretically not needed. However, it can also be seen from Figure 2 that the CO2 production and consumption could not be balanced at the same time. Approximately 40% additional CO2 needs to be supplied or fixed by the microalgae from the air.
Figure 2. The consumption of CO2 by microalgae alongside the production of CO2 by heterotrophs, and the production of O2 by microalgae alongside the consumption of O2 by heterotrophs in the symbiotic system of Scenario 3. The amounts are expressed in gram per person equivalent (PE) per day.
Water 04 00460 g002
Figure 3 shows the amount of activated sludge and microalgal biomass produced in the three different scenarios. The microalgal biomass per PE was based on the calculated microalgal biomass production of 24 g/m2/d in Scenario 1 and 28 g/m2/d in Scenarios 2 and 3. In Scenario 1 similar amounts of activated sludge and microalgal biomass were produced. Scenario 2 had the largest microalgal biomass production of 59 g/PE/d, because larger amounts of nutrients needed to be assimilated in this scenario.
Figure 3. The microalgal biomass and activated sludge in the three scenarios for a WWTP of 100,000 inhabitants in the Netherlands from May to October. The amount of activated sludge is expressed in grams volatile suspended solids (VSS) and the amount of microalgae in grams dry weight, both per person equivalent (PE) per day.
Water 04 00460 g003

4. Discussion

4.1. Effluent Concentrations

The results of this scenario analysis showed that it was not possible to simultaneously remove the N and P in the wastewater to the target values of 2.2 mg N/L and 0.15 mg P/L. In the post-treatment scenario P, while in Scenarios 2 and 3 N was limiting the microalgae growth. Indeed, given the ratio of N:P in wastewater, N will always be the limiting nutrient, if the molar ratio of C:N:P of 100:12:1 represents the real average elemental composition of microalgae grown in such systems. However, elemental composition in microalgae is known to be highly variable. Compositions with C:P ratios between 34:1 and 418:1, and N:P ratios between 3.5:1 and 38:1 are reported in literature for different species of microalgae [20,22]. Also the growth conditions, with respect to nutrient and/or light limitation, influence the elemental composition. Molar N:P ratios as low as 3:1 have been reported under N limiting conditions, while under conditions of P limitation a N:P ratio of 100:1 is possible [23,24]. At low growth rates, the N:P ratio of the biomass composition can sometimes match the supply ratio. Especially luxury uptake of P with storage as polyphosphate, is known to take place in microalgae [25,26]. This luxury uptake might make it possible to not only achieve MTR quality with respect to N, but also with respect to P.
In the scenario analysis only N and P removal by microalgal assimilation was taken into account. Additional removal of P by precipitation with cations like Ca2+ and Mg2+ is also possible. This precipitation occurs at higher pH levels caused by microalgae changing the CO2/HCO3/CO32−equilibrium when more CO2 is taken up than can be supplied via absorption from the atmosphere [9,26]. With such a pH rise expected within the biofilm, it is likely that in practice a larger P removal occurs than was calculated.

4.2. Area Requirement

This study found area requirements for the three scenarios between 0.32 and 2.1 m2/PE. A conventional WWTP is estimated to have an area requirement around 0.2–0.4 m2/PE. Hence, with 0.32 m2/PE, the microalgal post-treatment requires a similar area to that of the activated sludge plant. The two-stage system of Scenario 2 requires the largest area of 2.1 m2/PE. However, the first activated sludge stage will be considerably smaller than in a conventional WWTP, because nitrification is absent. In addition, more sludge is produced, and this sludge will have a higher energy value. This implies that more methane can be produced when digesting the sludge anaerobically.
The symbiotic system of Scenario 3 has an area requirement of 0.76 m2/PE, which is smaller than the area of the system of Scenario 2, and similar to the conventional WWTP combined with microalgal post-treatment in Scenario 1. Moreover, this system has the advantage that the O2 production by microalgae and O2 consumption by heterotrophs can be balanced. This balance implies no need for an external oxygen supply, giving energy and cost savings. Although very attractive, the technology required to support a symbiotic biofilm system still needs to be developed.
The area requirements are based on the calculated uptake capacities of 1.85 g N/m2/d and 0.34 g P/m2/d in the post-treatment scenario and 2.2 g N/m2/d and 0.41 g P/m2/d in Scenarios 2 and 3. These calculated uptake capacities are higher than the 0.1–0.6 g N/m2/d and 0.006–0.09 g P/m2/d measured in lab-scale biofilm systems [13,14], but lower than the 0.7–2.1 g P/m2/d measured in other pilot scale microalgal biofilms systems [11,27]. This indicates that the calculated uptake capacities in this study can be considered a good average estimation.
The area requirement calculated for the different microalgal systems depends on the elemental composition of microalgal biomass, as well as on the irradiance and the photosynthetic efficiency. As mentioned above, the elemental composition can vary in microalgae. Clearly a higher N and P content in the microalgae will result in a lower area requirement, while a lower content will increase the required area. This again illustrates the importance of knowing the real elemental composition of the microalgae when growing on wastewater.
The effect of irradiance on the area requirement can only be changed by either moving the system to another location, or by applying artificial illumination. However, the addition of artificial light yields no substantial area reduction. If all produced biomass, both activated sludge as well as microalgal biomass, would be converted into biogas to produce electricity for artificial light, the area reduction for the three scenarios is at most 0.8% (see Appendix B). This extremely low reduction is related to the energy losses in the process of methanogenesis, in converting biogas into electricity, electricity into light and light into new biomass via photosynthesis. Clearly these large scale microalgae based processes can only be fueled by sunlight.
In this analysis the oxygen quantum efficiency was assumed to be 0.05 mol O2/mol photons. This value is not reached in horizontal microalgal systems, but has been reached in vertical panel photobioreactors [17]. This efficiency has been determined with light as the limiting substrate. However, it is likely that CO2 limitation will occur when the biofilm is only exposed to ambient air. Modeling of microalgal biofilms has shown that CO2 limitation can easily occur, the level of limitation depending on the bulk pH and alkalinity [28]. Therefore, the assumed efficiency can only be reached in a vertical biofilm system, if CO2 limitation can be prevented. Using heterotrophic microorganisms to directly supply the CO2 to the microalgae as in Scenario 3, may therefore be a very attractive way to accomplish this.

4.3. Seasonal Variation in Temperature and Light Intensity

Both microalgal growth and uptake of N and P decrease at lower temperatures and light intensity [29]. Therefore, the capacity of the microalgal system will change throughout the day and the seasons. Low uptake of nutrients by microalgae during winter may be one of the main limitations of the application of microalgal wastewater treatment systems in a country like the Netherlands. In this scenario analysis, the system was assumed to be running only in the tourist season, from May until October. The application of the microalgal system in places where a much higher capacity is needed during summer is the most interesting application of this technology in The Netherlands. The microalgal system will provide additional capacity during summer, whereas during winter the existing WWTP capacity will be sufficient. Such a microalgal system may be applied on the islands in the Wadden Sea of the Netherlands, being a tourist location during summer. On the island Ameland for example, wastewater production during summer can be more than three times the amount during the rest of the year. With these conditions a microalgal biofilm system is an interesting option to treat the additional wastewater in summer, instead of increasing the size of the wastewater treatment plant to be able to treat the summer wastewater load.

4.4. Daily Variation in Light Intensity

The microalgae production was based on the total irradiation received in five months, and therefore the diurnal light cycle was not taken into account. In general, uptake of N and P by microalgae changes throughout the day and is faster during daytime than in the dark [24,25]. N-limited microalgae, on the other hand, are known to take up either NO3 or NH4+ in the dark. Uptake of NH4+ can be more than 50% of the daylight value in N-limited microalgae [30]. Consequently, when N is the limiting nutrient for microalgae in the treatment of municipal wastewater, considerable uptake of N during darkness might be expected. In addition, the wastewater loading rate of N and P is expected to be lower during the night, possibly compensating for the reduced nutrient uptake.

4.5. Application of Microalgal Biomass

When using microalgal biofilm systems in wastewater treatment, substantial amounts of microalgal biomass are produced. In Scenario 1 the microalgal biomass production was 24 g/m2/d based on the consumption of NO3 and in Scenarios 2 and 3 the production was 28 g/m2/d based on the consumption of NH4+. These biomass productions are slightly higher than biomass production of 11–18 g/m2/d measured in pilot photobioreactors [31,32] and in the range of biomass production of 24–31 g/m2/d measured in other biofilm pilot systems [11,27]. With this biomass production, a WWTP for 100,000 inhabitants with the microalgal post-treatment of Scenario 1 produces 200 ton (dry weight) microalgal biomass during the five summer months of operation. In Scenarios 2 and 3 this amount of biomass is even larger. With such a substantial amount of biomass, it is important to find an efficient way to harvest the biomass, and a proper destination.
To ensure an actively growing biofilm, and to prevent washout of valuable biomass with the effluent, the biofilm will need to be harvested regularly. This regular harvesting will reduce respiratory biomass losses or even cell death, which otherwise would lead to release of N and P from the biofilm. Two ways of harvesting can be distinguished, passive and active. Passive harvesting entails collecting the microalgal biomass that naturally detaches from the top of the biofilm when it ages. This might involve the addition of a settler tank, resulting in extra area requirement. Active harvesting techniques currently applied to remove biofilms in other systems include pH shock [33], backwashing and scraping. Active harvesting appears more attractive as it gives the possibility to harvest very regularly, hereby reducing the respiratory losses as much as possible.
Nitrogen was shown to be the limiting nutrient when integrating microalgal biofilms in the wastewater treatment (Scenarios 2 and 3). In this case, it might be possible to accumulate lipids in the microalgal biomass, as microalgae start to accumulate these under conditions of N-limitation [34,35]. To achieve this N-starvation and induce lipid accumulation the C:N ratio should be twice as high as was assumed in the scenario analysis. Although this increased ratio would result in an area requirement twice as large, the amount of produced biomass will also be doubled and thus larger amounts of lipids may be produced. In Scenario 1 these lipids would approximately amount to 79 ton during the five summer months of operation (see Appendix C). However, further research is still needed to induce the accumulation of specific desired lipids, to obtain a stable (mixed) culture of the desired species in the system, and to set up the biorefinery needed to extracts these lipids as well as valorize the remaining biomass constituent [30,31].
Depending on the microalgal biomass composition other products might also be possible. Using the biomass as fertilizer is very attractive but is only possible when no heavy metals or other recalcitrant compounds are present in the wastewater and accumulated by microalgae. Anaerobic digestion for biogas production is another possibility, although afterwards still autotrophic N and P removal or recovery will be necessary. The CO2 that is produced during digestion might be recycled to the microalgal biofilm system as an additional CO2 supply [36,37].

5. Conclusions

This study investigated the potential of a hypothetical microalgal biofilm system as a seasonal wastewater treatment system in the Netherlands. The analysis showed that the area requirement of the microalgal biofilm system was 0.32 m2/PE for a post-treatment system, 2.10 m2/PE for a two stage wastewater treatment system and 0.76 m2/PE for a one-stage symbiotic system. In addition, it was found that microalgae growing on wastewater treatment plant effluent are P limited and microalgae growing on untreated or partially treated wastewater are N limited. The microalgae will produce a substantial amount of biomass. For the application of microalgal biofilms in countries such as the Netherlands, further research should look into the effect of the daily variation of both the wastewater flows and of the irradiation and temperature. In addition, the destination of the produced biomass is an important topic for future studies. Finally, real (pilot) tests should be performed to establish if indeed a photosynthetic efficiency of 0.05 mol O2/mol photons can be reached and whether CO2 limitation will occur.

Acknowledgements

This work was performed in the TTIW-cooperation framework of Wetsus, Centre of Excellence for Sustainable Water Technology [38]. Wetsus is funded by the Dutch Ministry of Economic Affairs, the European Union Regional Development Fund, the Province of Fryslân, the City of Leeuwarden and the EZ/Kompas program of the “Samenwerkingsverband Noord-Nederland”. The authors like to thank the participants of the research theme “Advanced waste water treatment” and the steering committee of STOWA for the discussions and their financial support.

References

  1. Brock, T.D.; Madigan, M.T.; Martinko, J.M.; Parker, J. Biology of Microorganisms, 9th ed; Prentice-Hall: Upper Saddle River, NJ, USA, 2000. [Google Scholar]
  2. Halterman, S.G.; Toetz, D.W. Kinetics of nitrate uptake by freshwater algae. Hydrobiologia 1984, 114, 209–214. [Google Scholar]
  3. Collos, Y.; Vaquer, A.; Souchu, P. Acclimation of nitrate uptake by phytoplankton to high substrate levels. J. Phycol. 2005, 41, 466–478. [Google Scholar]
  4. Eppley, R.W.; Rogers, J.N.; McCarthy, J.J. Half-Saturation constants for uptake of nitrate and ammonium by marine phytoplankton. Limnol. Oceanogr. 1969, 14, 912–920. [Google Scholar]
  5. Hwang, S.J.; Havens, K.E.; Steinman, A.D. Phosphorus kinetics of planktonic and benthic assemblages in a shallow subtropical lake. Freshw. Biol. 1998, 40, 729–745. [Google Scholar]
  6. Stevenson, R.J.; Bothwell, M.L.; Lowe, R.L. Algal Ecology: Freshwater Benthic Ecosystems; Academic Press Elsevier: San diego, CA, USA, 1996. [Google Scholar]
  7. Di Pippo, F.; Ellwood, N.; Guzzon, A.; Siliato, L.; Micheletti, E.; de Philippis, R.; Albertano, P. Effect of light and temperature on biomass, photosynthesis and capsular polysaccharides in cultured phototrophic biofilms. J. Appl. Phycol. 2011, 24, 1–10. [Google Scholar]
  8. Sekar, R.; Nair, K.V.K.; Rao, V.N.R.; Venugopalan, V.P. Nutrient dynamics and successional changes in a lentic freshwater biofilm. Freshwater Biol. 2002, 47, 1893–1907. [Google Scholar]
  9. Roeselers, G.; Loosdrecht, M.; Muyzer, G. Phototrophic biofilms and their potential applications. J. Appl. Phycol. 2008, 20, 227–235. [Google Scholar]
  10. Schumacher, G.; Blume, T.; Sekoulov, I. Bacteria reduction and nutrient removal in small wastewater treatment plants by an algal biofilm. Water Sci. Technol. 2003, 47, 195–202. [Google Scholar]
  11. Craggs, R.J.; Adey, W.H.; Jenson, K.R.; St. John, M.S.; Green, F.B.; Oswald, W.J. Phosphorous removal from wastewater using algal turf scrubber. Water Sci. Technol. 1996, 33, 191–198. [Google Scholar]
  12. Shi, J.; Podola, B.; Melkonian, M. Removal of nitrogen and phosphorus from wastewater using microalgae immobilized on twin layers: An experimental study. J. Appl. Phycol. 2007, 19, 417–423. [Google Scholar]
  13. De Godos, I.; González, C.; Becares, E.; García-Encina, P.; Muñoz, R. Simultaneous nutrients and carbon removal during pretreated swine slurry degradation in a tubular biofilm photobioreactor. Appl. Microbiol. Biotechnol. 2009, 82, 187–194. [Google Scholar]
  14. González, C.; Marciniak, J.; Villaverde, S.; León, C.; García, P.A.; Munoz, R. Efficient nutrient removal from swine manure in a tubular biofilm photo-bioreactor using algae-bacteria consortia. Water Sci. Technol. 2008, 58, 95–102. [Google Scholar]
  15. Ley, A.C.; Mauzerall, D.C. Absolute absorption cross-sections for Photosystem II and the minimum quantum requirement for photosynthesis in Chlorella vulgaris. BBA—Bioenergetics 1982, 680, 95–106. [Google Scholar]
  16. Bjorkman, O.; Demmig, B. Photon yield of O2 evolution and chlorophyll fluorescence characteristics at 77 K among vascular plants of diverse origins. Planta 1987, 170, 489–504. [Google Scholar]
  17. Qiang, H.; Faiman, D.; Richmond, A. Optimal tilt angles of enclosed reactors for growing photoautotrophic microorganisms outdoors. J. Ferment. Bioeng. 1998, 85, 230–236. [Google Scholar]
  18. Duboc, P.; Marison, I.; Stockar, U.V. Quantitative calorimetry and biochemical engineering. In Handbook of Thermal Analysis and Calorimetry; Kemp, R.B., Ed.; Elsevier: Amsterdam, The Netherlands, 1999; Volume 4. [Google Scholar]
  19. Healey, F.P. Inorganic nutrient uptake and deficiency in algae. Crit. rev. microbiol. 1973, 3, 69–113. [Google Scholar]
  20. Ahlgren, G.; Gustafsson, I.B.; Boberg, M. Fatty-acid content and chemical—Composition of fresh-water microalgae. J. Phycol. 1992, 28, 37–50. [Google Scholar]
  21. Metcalf, I.; Eddy, H. Wastewater Engineering: Treatment and Reuse, 4th ed; McGraw-Hill: Columbus, OH, USA, 2003. [Google Scholar]
  22. Ho, T.Y.; Quigg, A.; Finkel, Z.V.; Milligan, A.J.; Wyman, K.; Falkowski, P.G.; Morel, F.M.M. The elemental composition of some marine phytoplankton. J. Phycol. 2003, 39, 1145–1159. [Google Scholar]
  23. Goldman, J.C.; McCarthy, J.J.; Peavey, D.G. Growth rate influence on the chemical composition of phytoplankton in oceanic waters. Nature 1979, 279, 210–215. [Google Scholar]
  24. Elrifi, I.R.; Turpin, D.H. Steady-state luxury consumption and the concept of optimum nutrient ratios: A study with phosphate and nitrate limited Selenastrum minutum (Chlorophyta). J. Phycol. 1985, 21, 592–602. [Google Scholar]
  25. Klausmeier, C.A.; Litchman, E.; Simon, A.L. Phytoplankton growth and stoichiometry under multiple nutrient limitation. Limnol. Oceanogr. 2004, 49, 1463–1470. [Google Scholar]
  26. Powell, N.; Shilton, A.N.; Pratt, S.; Chisti, Y. Factors Influencing luxury uptake of phosphorus by microalgae in waste stabilization ponds. Envir. Sci. Technol. 2008, 42, 5958–5962. [Google Scholar]
  27. Christenson, L.B.; Sims, R.C. Rotating algal biofilm reactor and spool harvester for wastewater treatment with biofuels by-products. Biotechnol. Bioeng. 2012. [Google Scholar]
  28. Liehr, S.K.; Eheart, J.W.; Suidan, M.T. A modeling study of the effect of pH on carbon limited algal biofilms. Water Res. 1988, 22, 1033–1041. [Google Scholar]
  29. Goldman, J.C.; Carpenter, E.J. A Kinetic approach to the effect of temperature on algal growth. Limnol. Oceanogr. 1974, 19, 756–766. [Google Scholar]
  30. Vona, V.; Rigano, V.D.M.; Esposito, S.; Carillo, P.; Carfagna, S.; Rigano, C. Growth, photosynthesis, and respiration of Chlorella sorokiniana after N-starvation. Interactions between light, CO2 and NH4+ supply. Physiol. Plantarum 1999, 105, 288–293. [Google Scholar] [CrossRef]
  31. Hulatt, C.J.; Thomas, D.N. Energy efficiency of an outdoor microalgal photobioreactor sited at mid-temperature latitude. Bioresource technol. 2011, 102, 6687–6695. [Google Scholar]
  32. Min, M.; Wang, L.; Li, Y.; Mohr, M.J.; Hu, B.; Zhou, W.; Chen, P.; Ruan, R. Cultivating Chlorella sp. in a pilot-scale photobioreactor using centrate wastewater for microalga biomass production and wastewater nutrient removal. Appl. Biochem. Biotech. 2011, 165, 123–137. [Google Scholar] [CrossRef]
  33. Knuckey, R.M.; Brown, M.R.; Robert, R.; Frampton, D.M.F. Production of microalgal concentrates by flocculation and their assessment as aquaculture feeds. Aquacult. Eng. 2006, 35, 300–313. [Google Scholar]
  34. Converti, A.; Casazza, A.A.; Ortiz, E.Y.; Perego, P.; del Borghi, M. Effect of temperature and nitrogen concentration on the growth and lipid content of Nannochloropsis oculata and Chlorella vulgaris for biodiesel production. Chem. Eng. Process. 2009, 48, 1146–1151. [Google Scholar] [CrossRef]
  35. Solovchenko, A.; Khozin-Goldberg, I.; Didi-Cohen, S.; Cohen, Z.; Merzlyak, M. Effects of light intensity and nitrogen starvation on growth, total fatty acids and arachidonic acid in the green microalga Parietochloris incisa. J. Appl. Phycol. 2008, 20, 245–251. [Google Scholar] [CrossRef]
  36. Muñoz, R.; Guieysse, B. Algal-bacterial processes for the treatment of hazardous contaminants: A review. Water Res. 2006, 40, 2799–2815. [Google Scholar]
  37. Mussgnug, J.H.; Klassen, V.; Schlüter, A.; Kruse, O. Microalgae as substrates for fermentative biogas production in a combined biorefinery concept. J. Biotechnol. 2010, 150, 51–56. [Google Scholar]
  38. Wetsus Centre of Excellence for Sustainable Water Technology Home Page. Available online: http://www.wetsus.nl (accessed on 16 April 2012).

Correction

  • Supplementary File 1::

    PDF-Document (PDF, 163 KB)

  • Share and Cite

    MDPI and ACS Style

    Boelee, N.C.; Temmink, H.; Janssen, M.; Buisman, C.J.N.; Wijffels, R.H. Scenario Analysis of Nutrient Removal from Municipal Wastewater by Microalgal Biofilms. Water 2012, 4, 460-473. https://doi.org/10.3390/w4020460

    AMA Style

    Boelee NC, Temmink H, Janssen M, Buisman CJN, Wijffels RH. Scenario Analysis of Nutrient Removal from Municipal Wastewater by Microalgal Biofilms. Water. 2012; 4(2):460-473. https://doi.org/10.3390/w4020460

    Chicago/Turabian Style

    Boelee, Nadine C., Hardy Temmink, Marcel Janssen, Cees J. N. Buisman, and René H. Wijffels. 2012. "Scenario Analysis of Nutrient Removal from Municipal Wastewater by Microalgal Biofilms" Water 4, no. 2: 460-473. https://doi.org/10.3390/w4020460

    Article Metrics

    Back to TopTop