How Much for Water? Economic Assessment and Mapping of Floodplain Water Storage as a Catchment-Scale Ecosystem Service of Wetlands


Abstract
:
1. Introduction

2. Materials and Methods
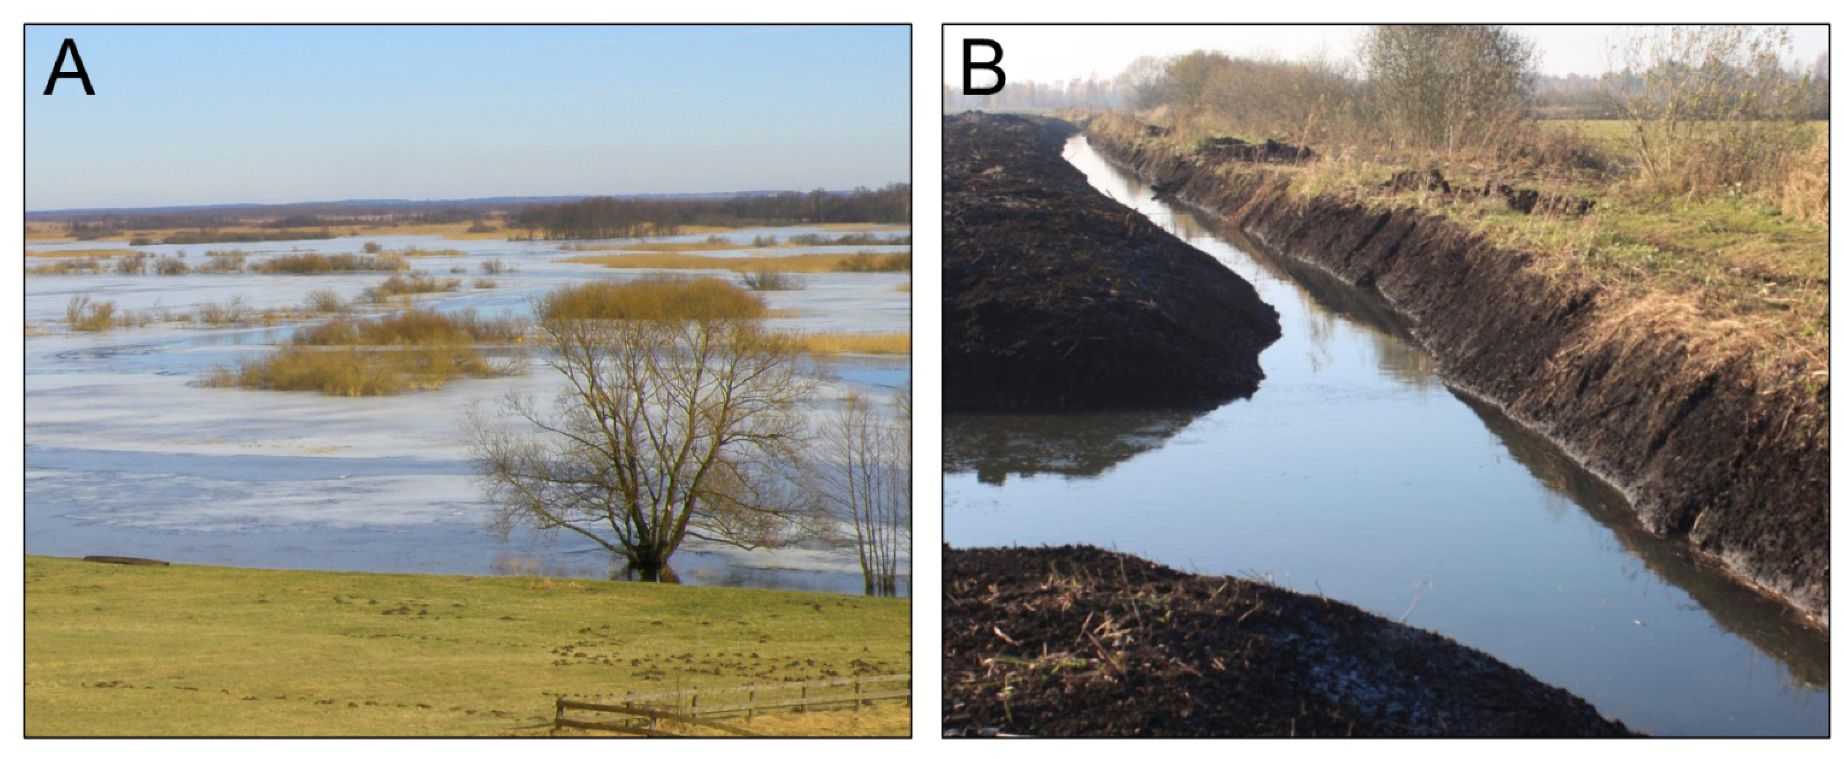
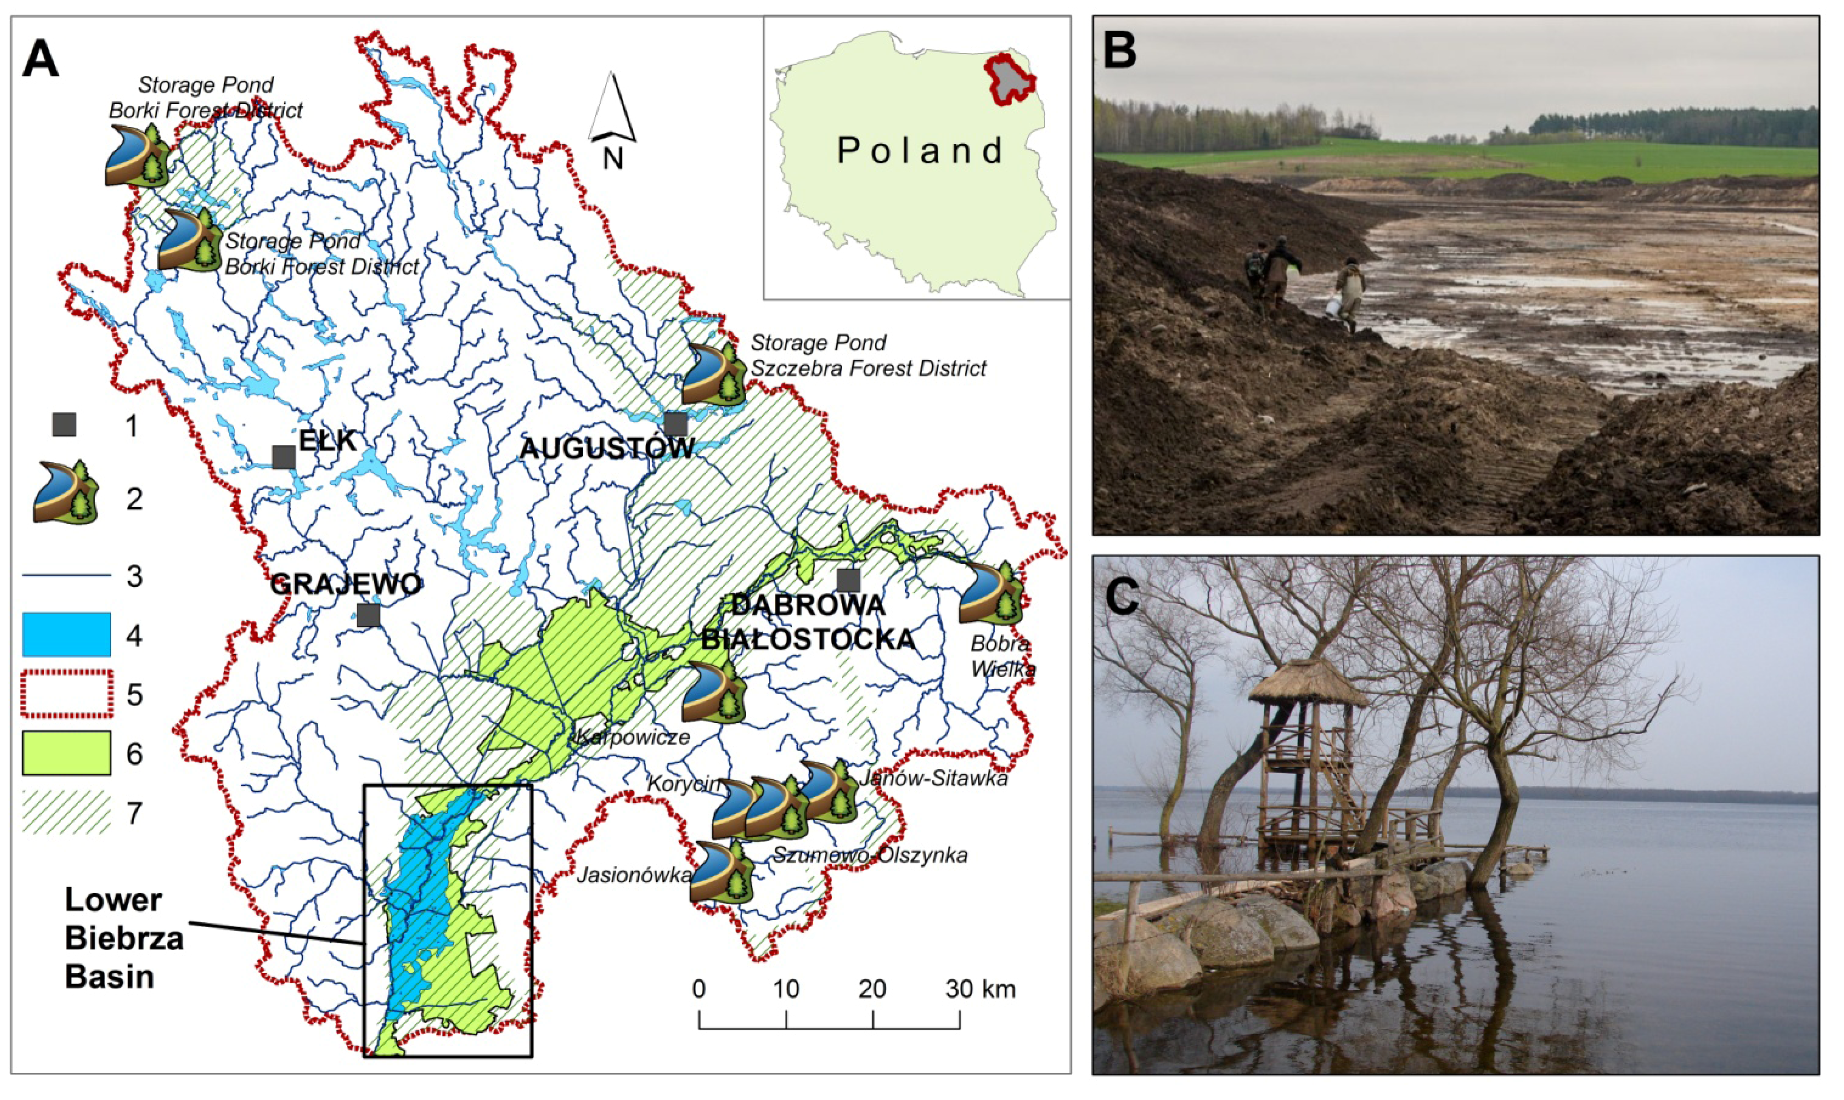
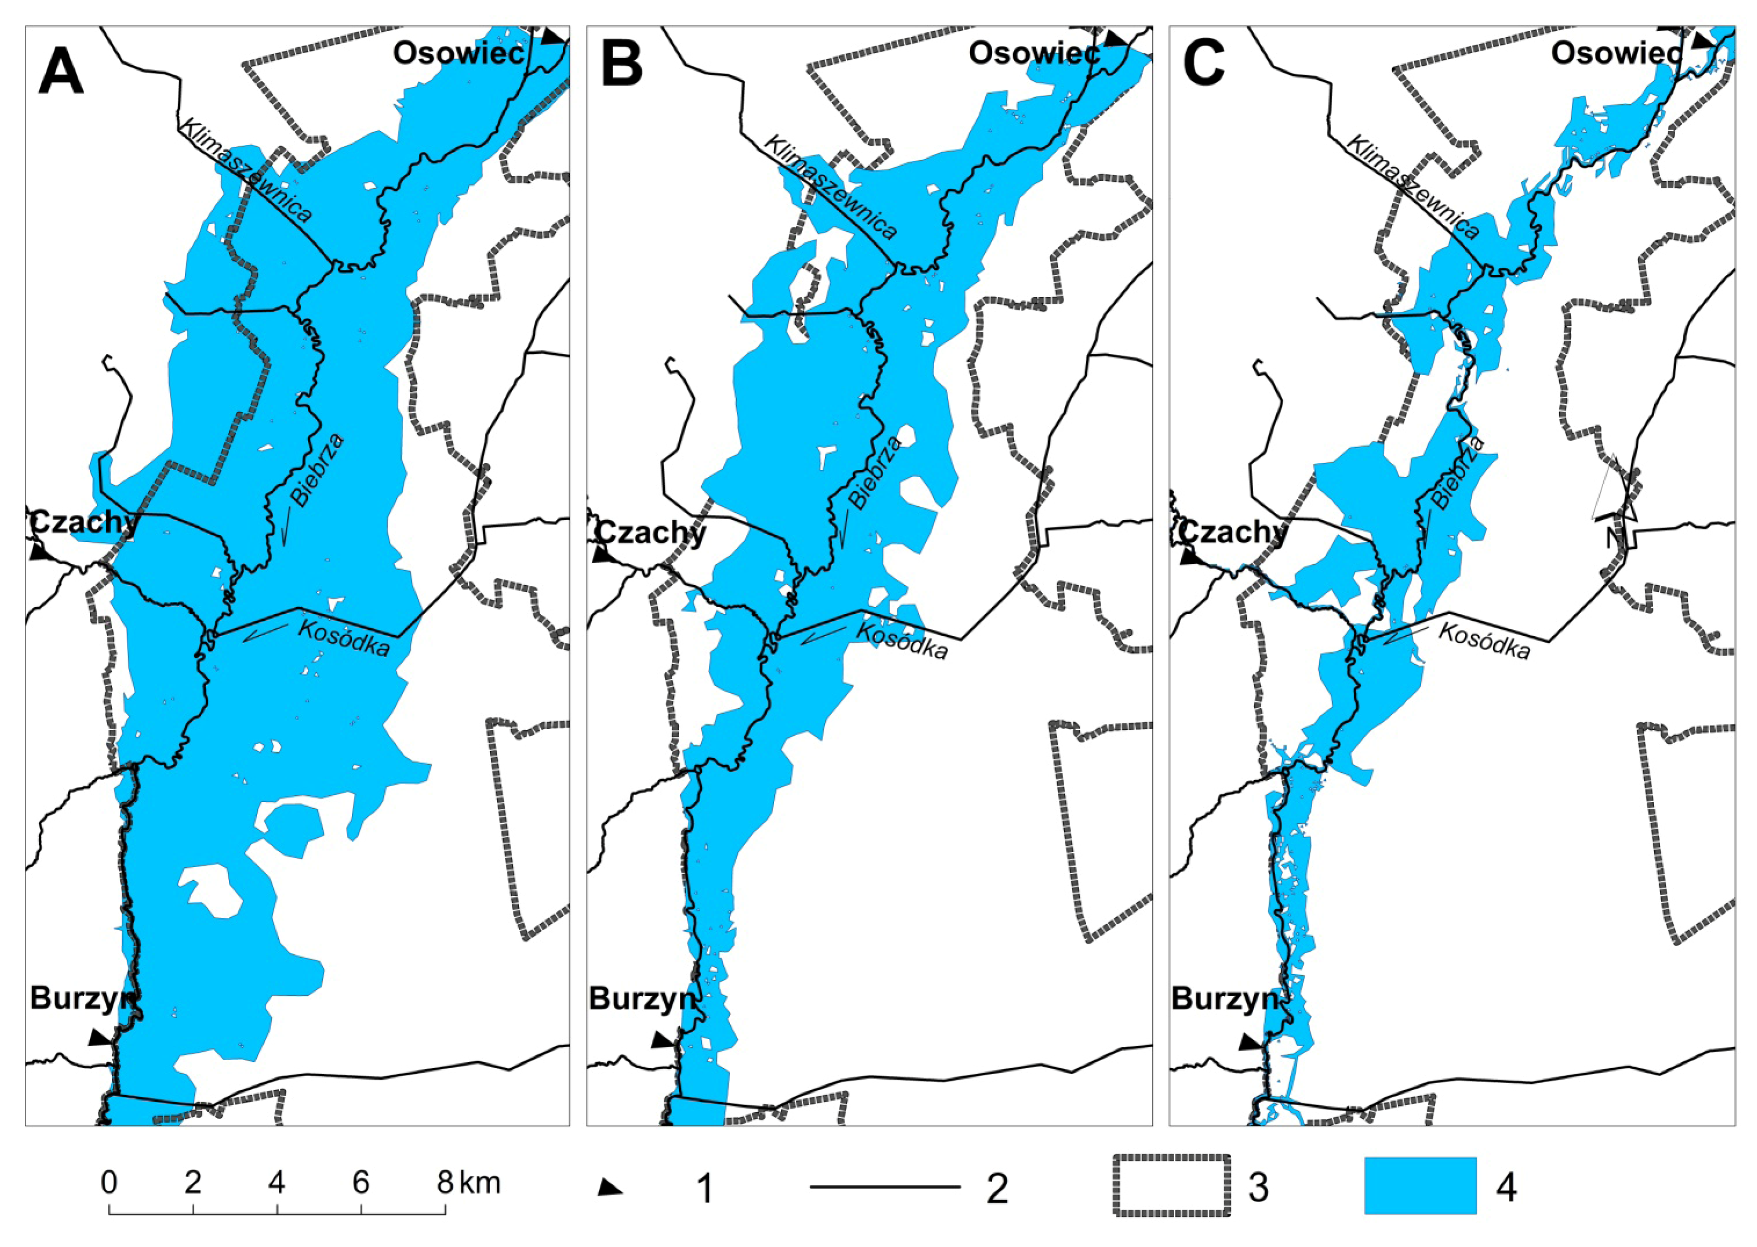
2.1. Wetlands of the Lower Biebrza Basin—Nature and Agriculture

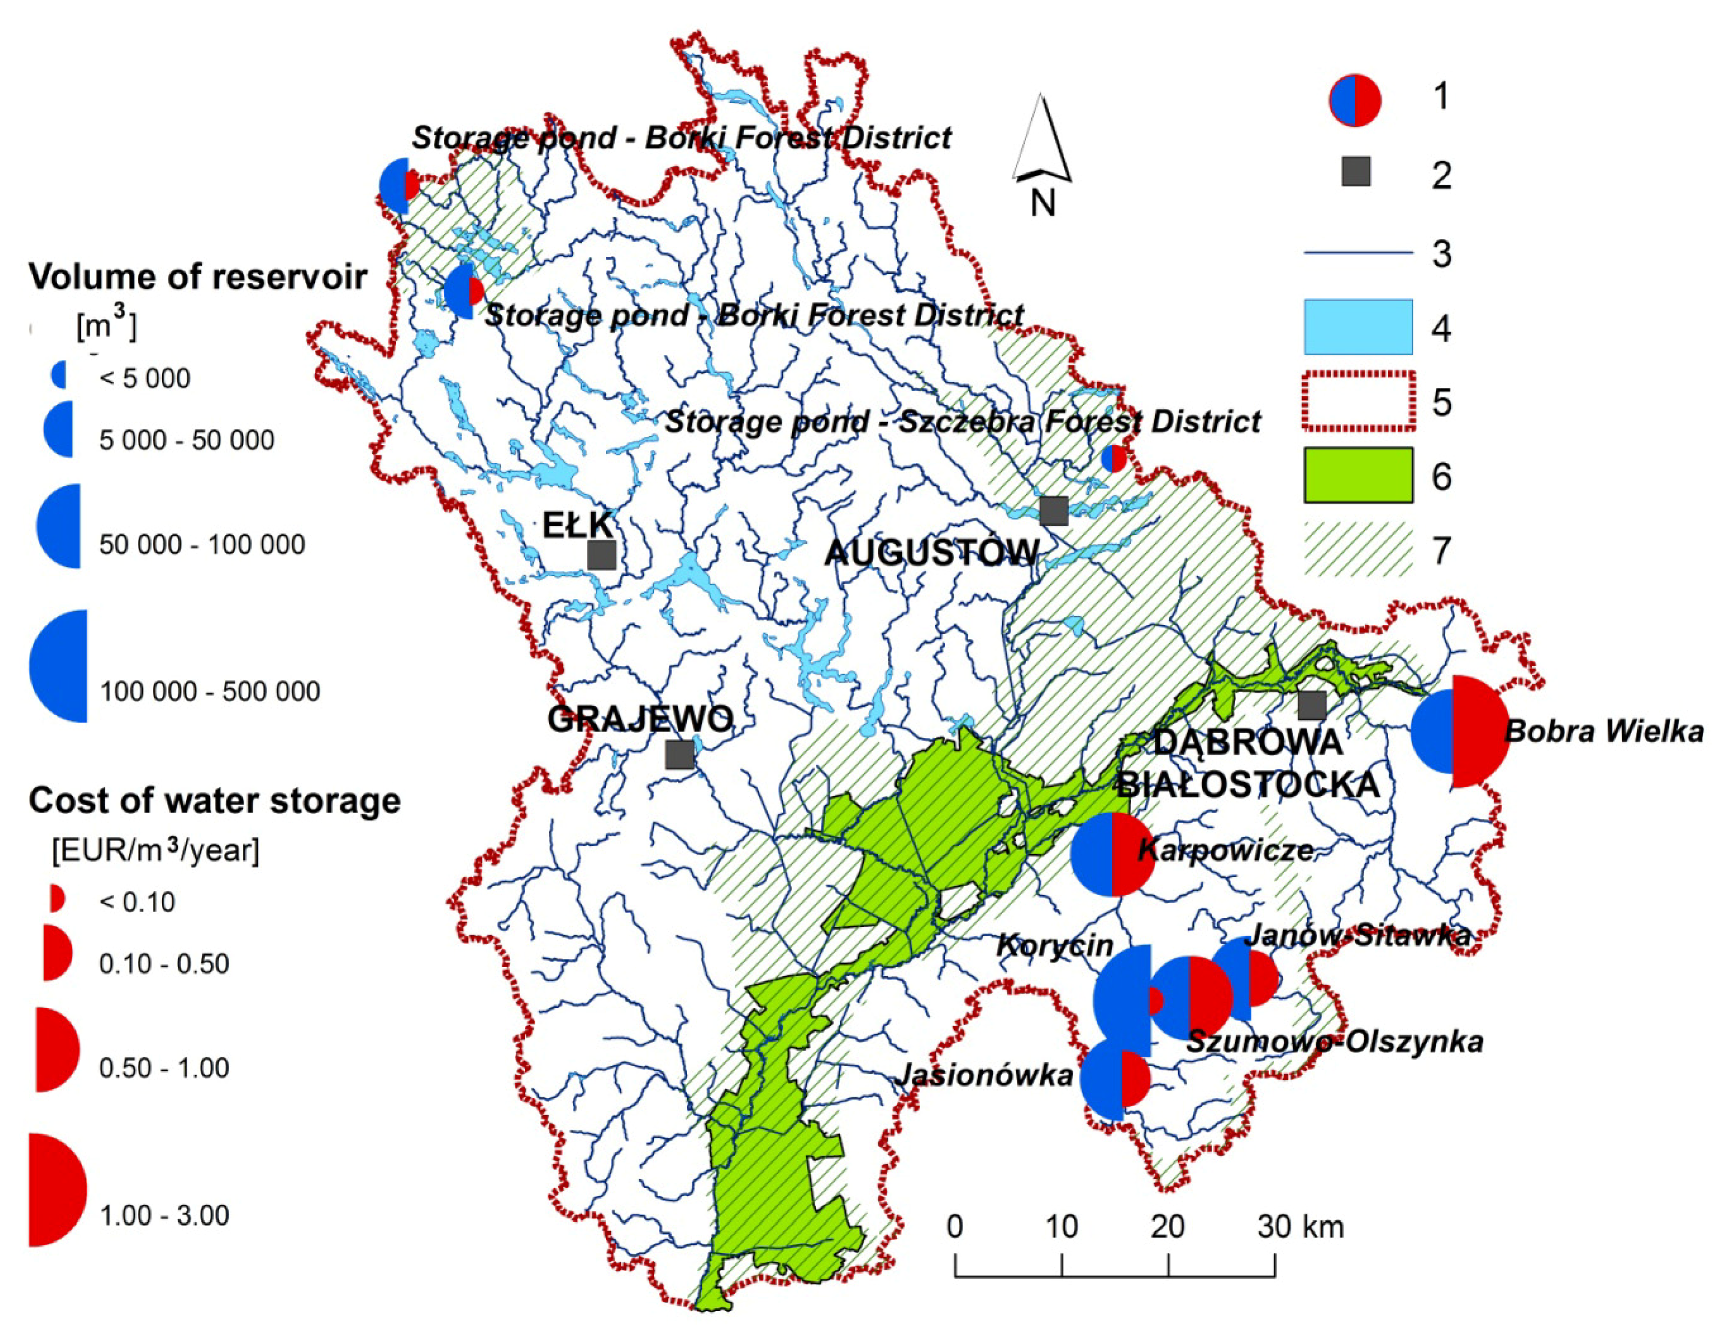
2.2. Economic Assessment of Water Storage Cost in the Catchment of the Biebrza


| Reservoir | Year | Volume [M m3] | Approx. cost of design and construction [PLN] | Approx. cost of design and construction [EUR] * | Unit cost of water storage [EUR·m−3·year−1] |
|---|---|---|---|---|---|
| Korycin | 2002 | 0.481 | 1,500,000 | 375,000 | 0.04 |
| Karpowicze | 2009 | 0.077 | 5,489,150 | 1,372,288 | 0.81 |
| Janów-Sitawka | 2006 | 0.087 | 1,300,000 | 325,000 | 0.17 |
| Bobra Wielka | 2012 | 0.063 | 14,700,000 | 3,675,000 | 2.67 |
| Jasionówka | 2001 | 0.067 | 581,328 | 145,332 | 0.10 |
| Szumowo–Olszynka | 2012 | 0.080 | 5,500,000 | 1,375,000 | 0.78 |
| Storage Pond–Borki Forest District | n.a. | 0.020 | n.a. | n.a. | 0.07 ** |
| Storage Pond–Borki Forest District | n.a. | 0.024 | n.a. | n.a. | 0.07 ** |
| Storage Pond-Szczebra Forest District | n.a. | 0.001 | n.a. | n.a. | 0.07 ** |
| Statistics | - | Ʃ = 0.90 | Ʃ = 29,070,478 | Ʃ = 7,267,620 | avg = 0.53 |
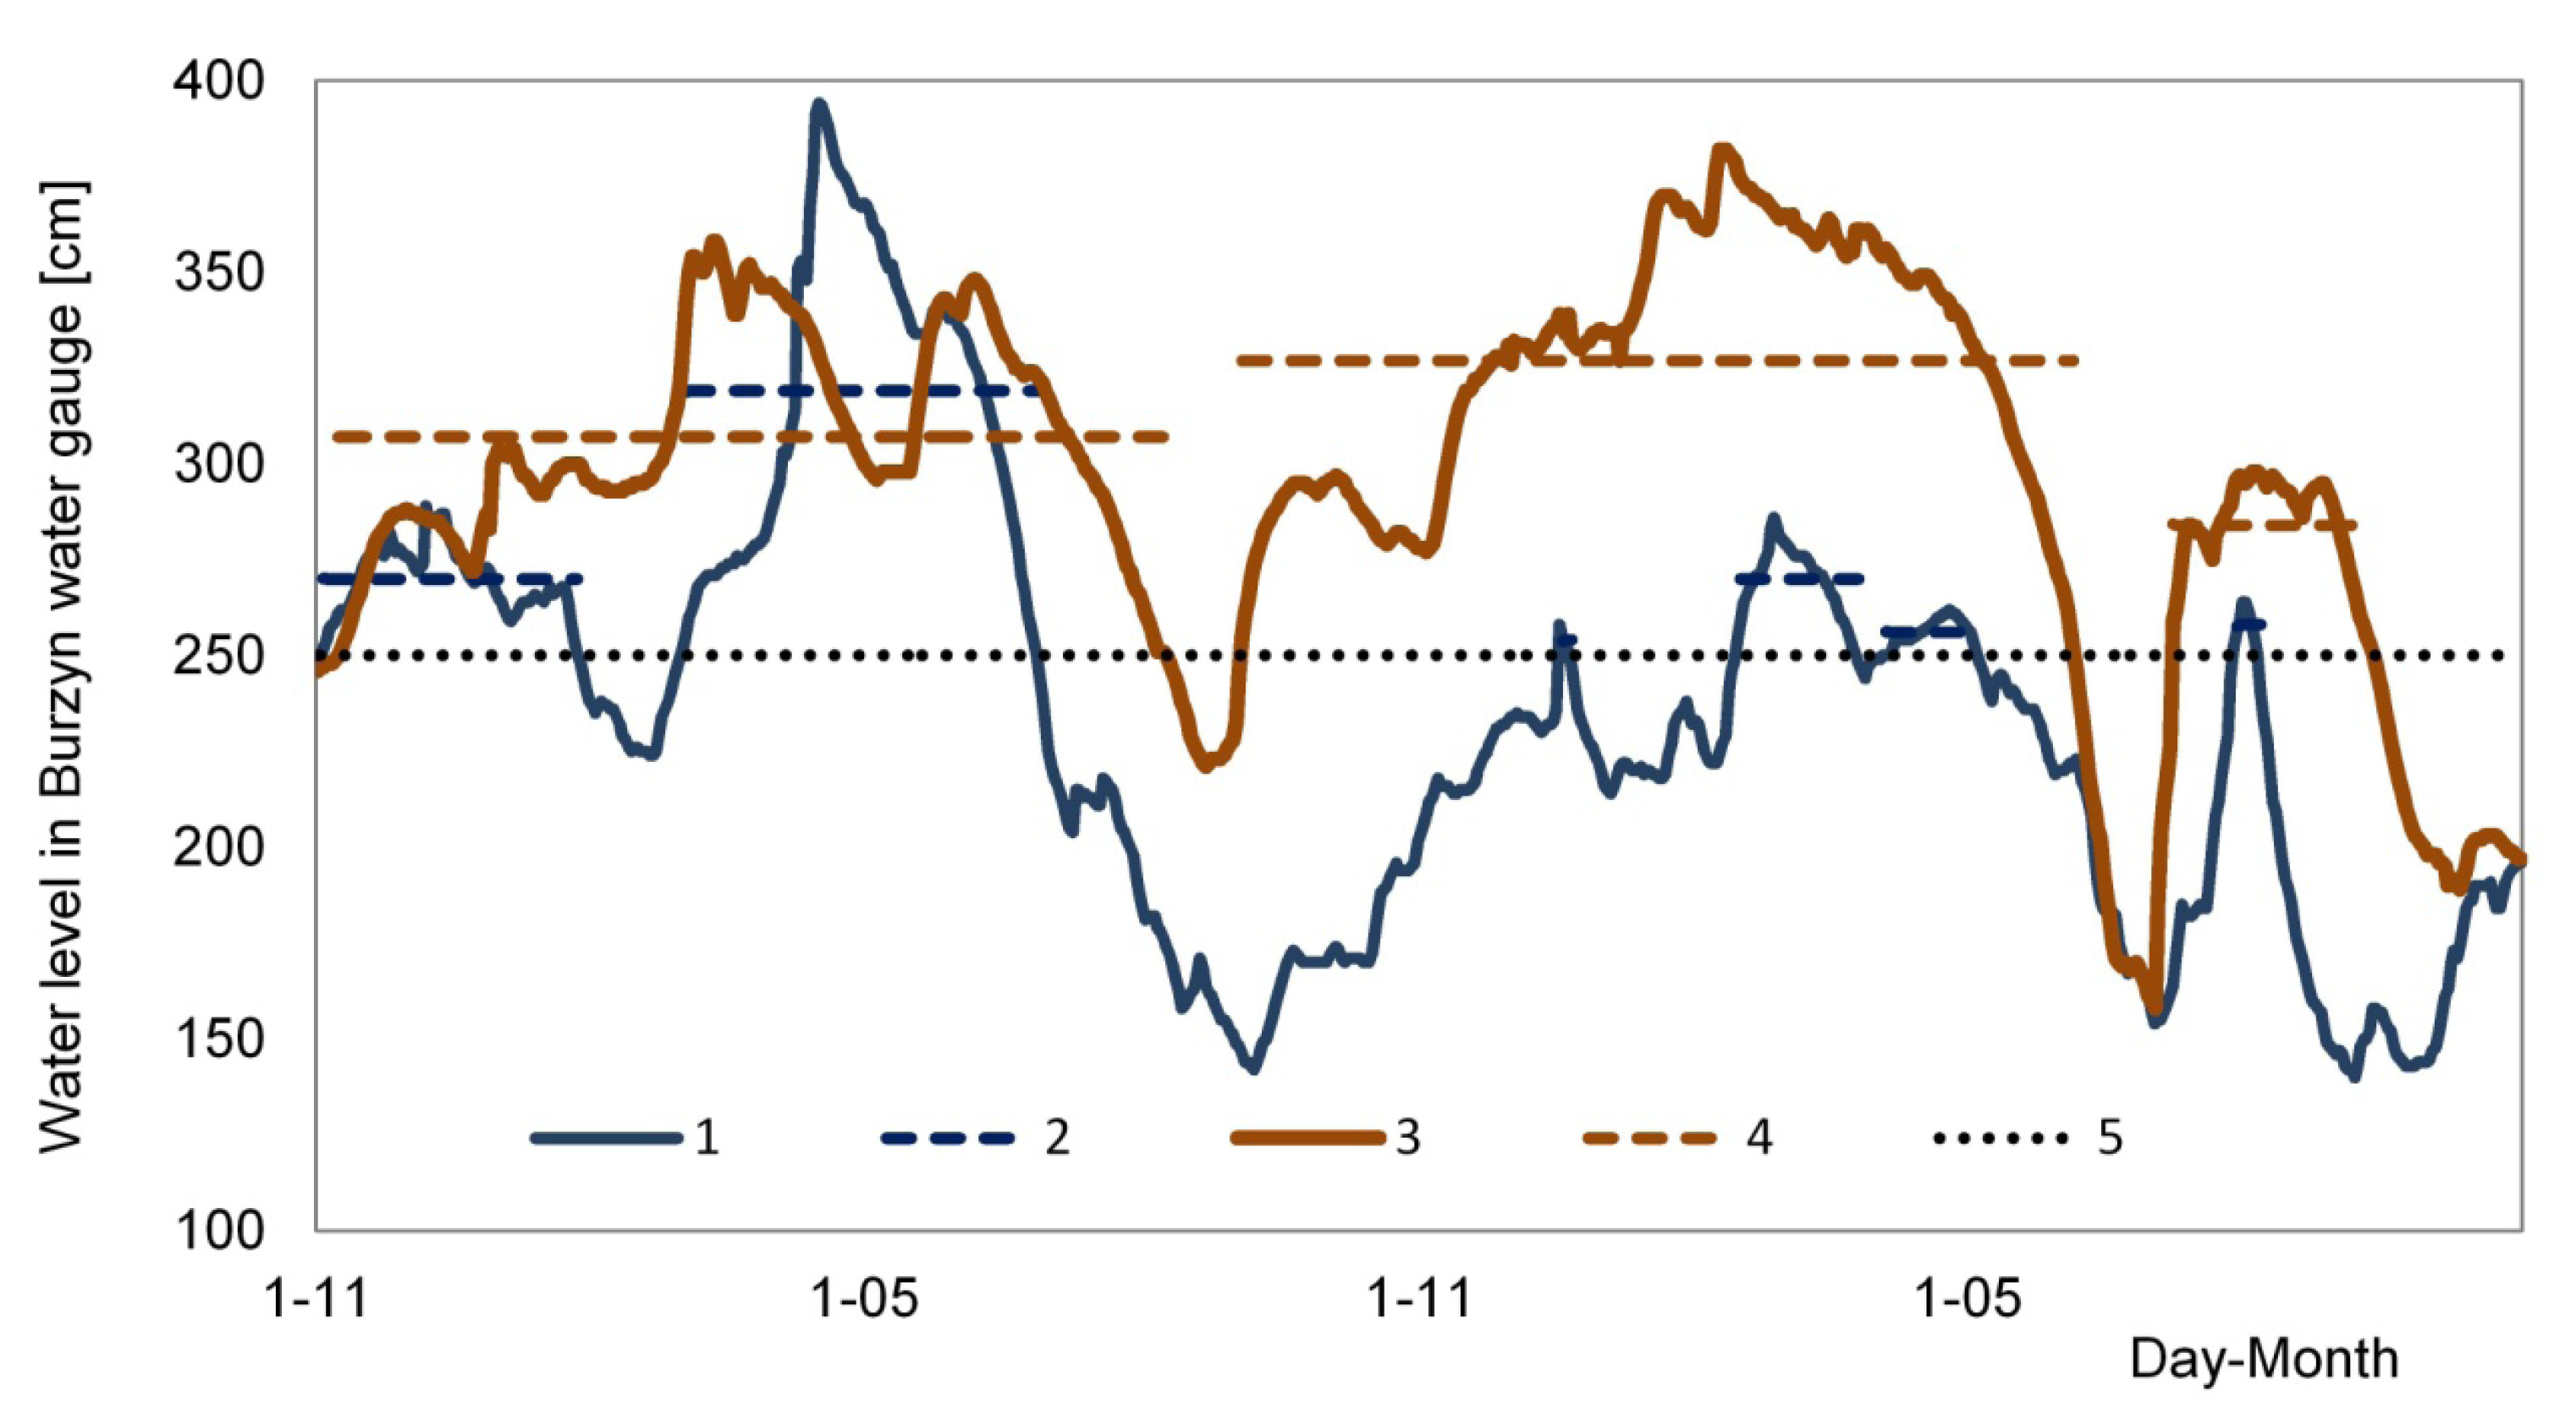
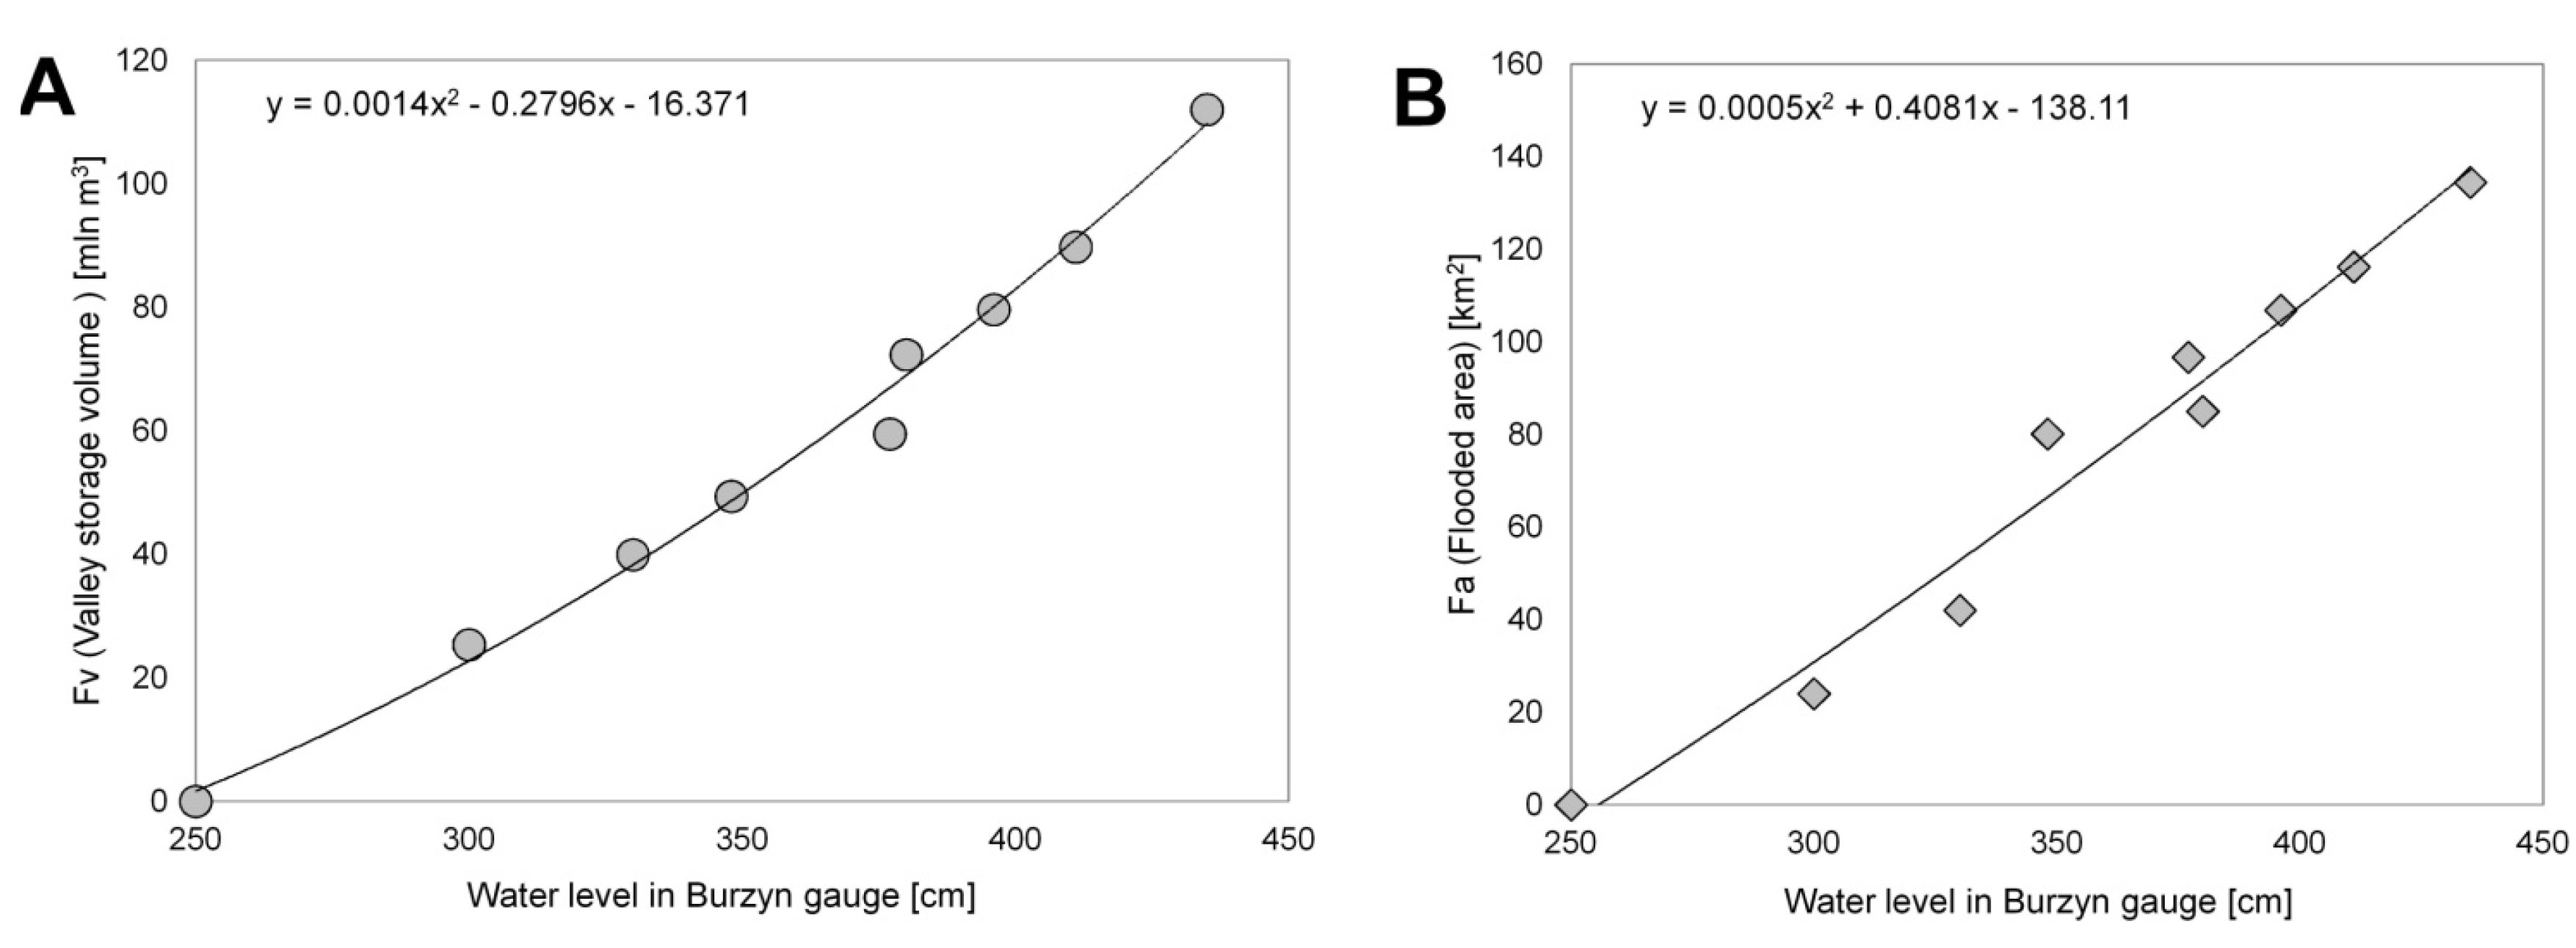
2.3. Floodplain Storage Volume Assessment


2.5. Economic Assumptions of the Analysis
3. Results
3.1. Unit Cost of Water Storage in Artificial Reservoirs in the Catchment of Biebrza

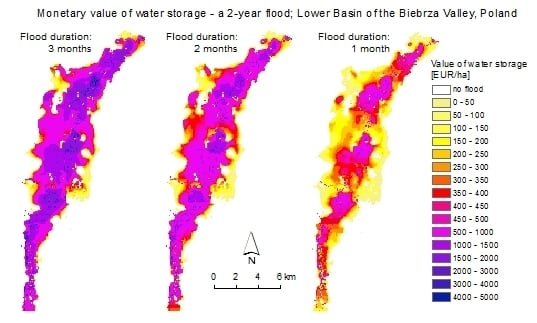
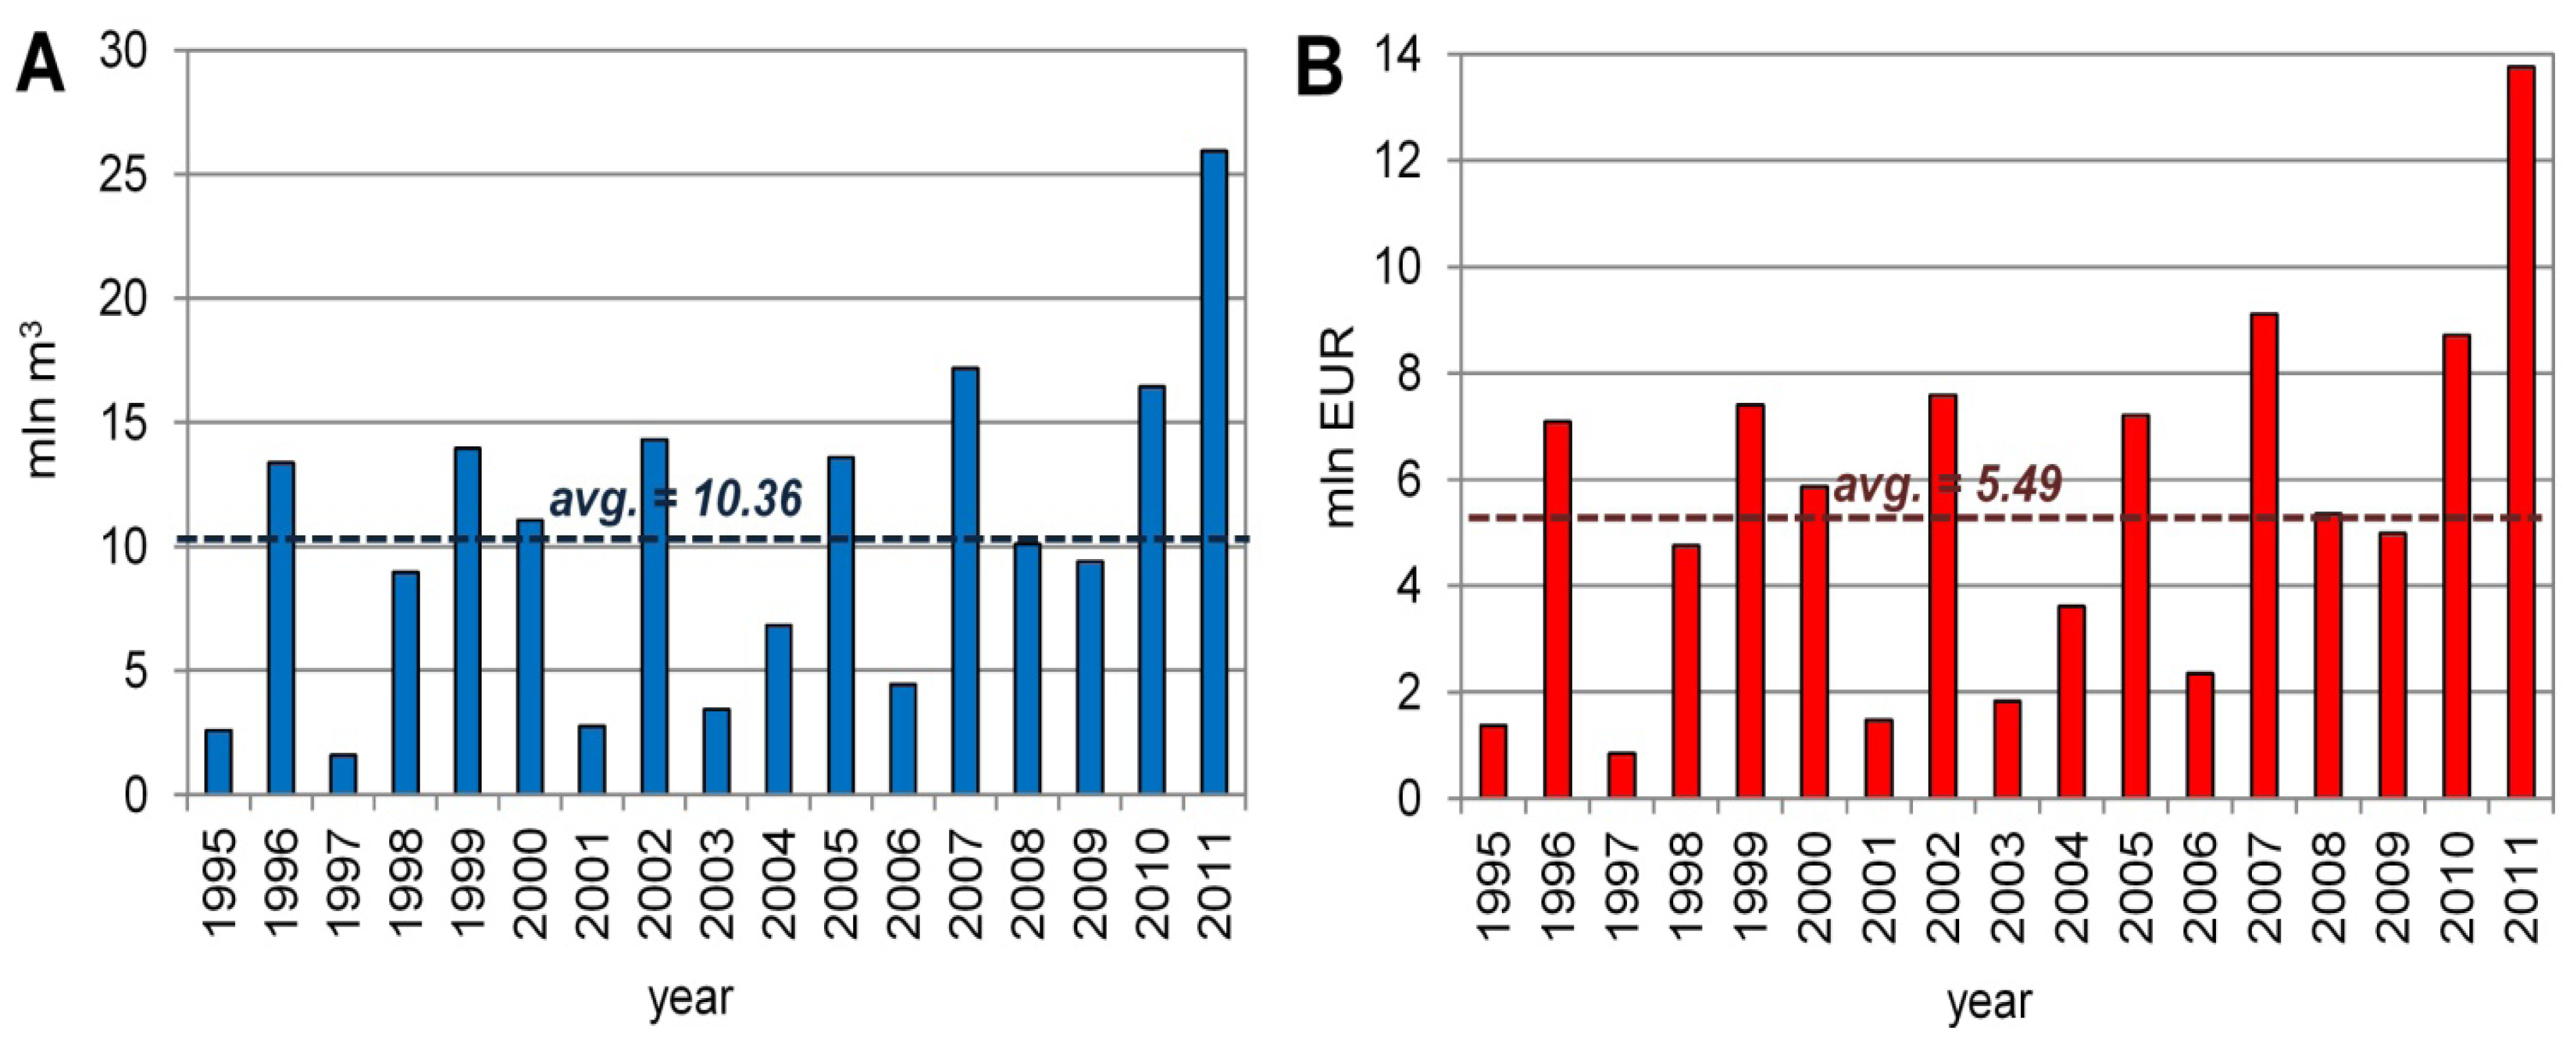
3.2. Hydroeconomy of Water Storage in the Floodplainof the Biebrza
| Date of flood start | Average water level | Flood duration [days] | Tf | Season | Fv [mln m3] | Fa [km2] | StWet [mln m3] |
|---|---|---|---|---|---|---|---|
| 3 Nov. 1995 | 270 | 85 | 0.23 | winter/spring | 10.23 | 6.99 | 2.59 |
| 2 Mar. 1996 | 319 | 118 | 0.32 | winter/spring | 36.76 | 35.19 | 13.34 |
| 17 Dec. 1996 | 254 | 4 | 0.01 | winter/spring | 2.83 | 1.10 | 0.03 |
| 14 Feb. 1997 | 270 | 40 | 0.11 | winter/spring | 10.14 | 6.89 | 1.21 |
| 4 May 1997 | 256 | 32 | 0.09 | winter/spring | 3.80 | 0.00 | 0.33 |
| 5 Aug. 1997 | 258 | 9 | 0.02 | summer/autumn | 2.36 | 0.96 | 0.06 |
| 5 Jun. 1998 | 296 | 193 | 0.53 | summer/autumn | 14.28 | 21.04 | 8.97 |
| 19 Jul. 1999 | 302 | 258 | 0.71 | summer/autumn | 16.58 | 24.86 | 13.96 |
| 11 May 2000 | 296 | 155 | 0.42 | winter/spring | 23.35 | 21.05 | 11.06 |
| 5 Jan. 2001 | 262 | 10 | 0.03 | winter/spring | 6.57 | 3.02 | 0.19 |
| 7 Feb. 2001 | 266 | 17 | 0.05 | winter/spring | 8.18 | 4.77 | 0.41 |
| 19 Feb. 2001 | 260 | 10 | 0.03 | winter/spring | 5.66 | 2.03 | 0.16 |
| 5 Mar. 2001 | 264 | 7 | 0.02 | winter/spring | 7.59 | 4.13 | 0.16 |
| 15 May 2001 | 269 | 65 | 0.18 | winter/spring | 9.63 | 6.35 | 1.86 |
| 11 May 2002 | 293 | 217 | 0.59 | winter/spring | 21.63 | 19.22 | 14.32 |
| 5 May 2003 | 271 | 106 | 0.29 | winter/spring | 10.91 | 7.72 | 3.45 |
| 9 Jan. 2004 | 271 | 21 | 0.06 | winter/spring | 10.83 | 7.65 | 0.68 |
| 7 Jun. 2004 | 291 | 147 | 0.40 | summer/autumn | 12.53 | 18.12 | 5.98 |
| 15 Oct. 2004 | 254 | 45 | 0.12 | summer/autumn | 1.22 | 1.00 | 0.17 |
| 29 Jun. 2005 | 305 | 236 | 0.65 | summer/autumn | 17.64 | 26.61 | 13.60 |
| 17 Jan. 2006 | 272 | 21 | 0.06 | winter/spring | 11.04 | 7.87 | 0.69 |
| 14 May 2006 | 279 | 77 | 0.21 | winter/spring | 14.44 | 11.53 | 3.36 |
| 28 Oct. 2006 | 259 | 50 | 0.14 | summer/autumn | 2.69 | 1.51 | 0.39 |
| 20 May 2007 | 306 | 192 | 0.53 | winter/spring | 29.15 | 27.19 | 17.16 |
| 23 Aug. 2007 | 253 | 12 | 0.03 | summer/autumn | 0.86 | 1.60 | 0.03 |
| 3 Jun. 2008 | 300 | 197 | 0.54 | summer/autumn | 15.72 | 23.43 | 10.10 |
| 9 May 2009 | 292 | 142 | 0.39 | winter/spring | 21.57 | 19.16 | 9.34 |
| 7 Jul. 2009 | 254 | 14 | 0.04 | summer/autumn | 1.21 | 1.00 | 0.05 |
| 31 Jul. 2009 | 251 | 4 | 0.01 | summer/autumn | 0.43 | 2.40 | 0.01 |
| 9 Aug. 2010 | 307 | 275 | 0.75 | summer/autumn | 18.30 | 27.69 | 16.44 |
| 5 Jun. 2011 | 327 | 276 | 0.76 | summer/autumn | 26.15 | 40.57 | 23.68 |
| 8 Jul. 2011 | 284 | 67 | 0.18 | summer/autumn | 10.43 | 14.61 | 2.26 |


| Qp50% Flood duration [months] | 1 | 2 | 3 |
|---|---|---|---|
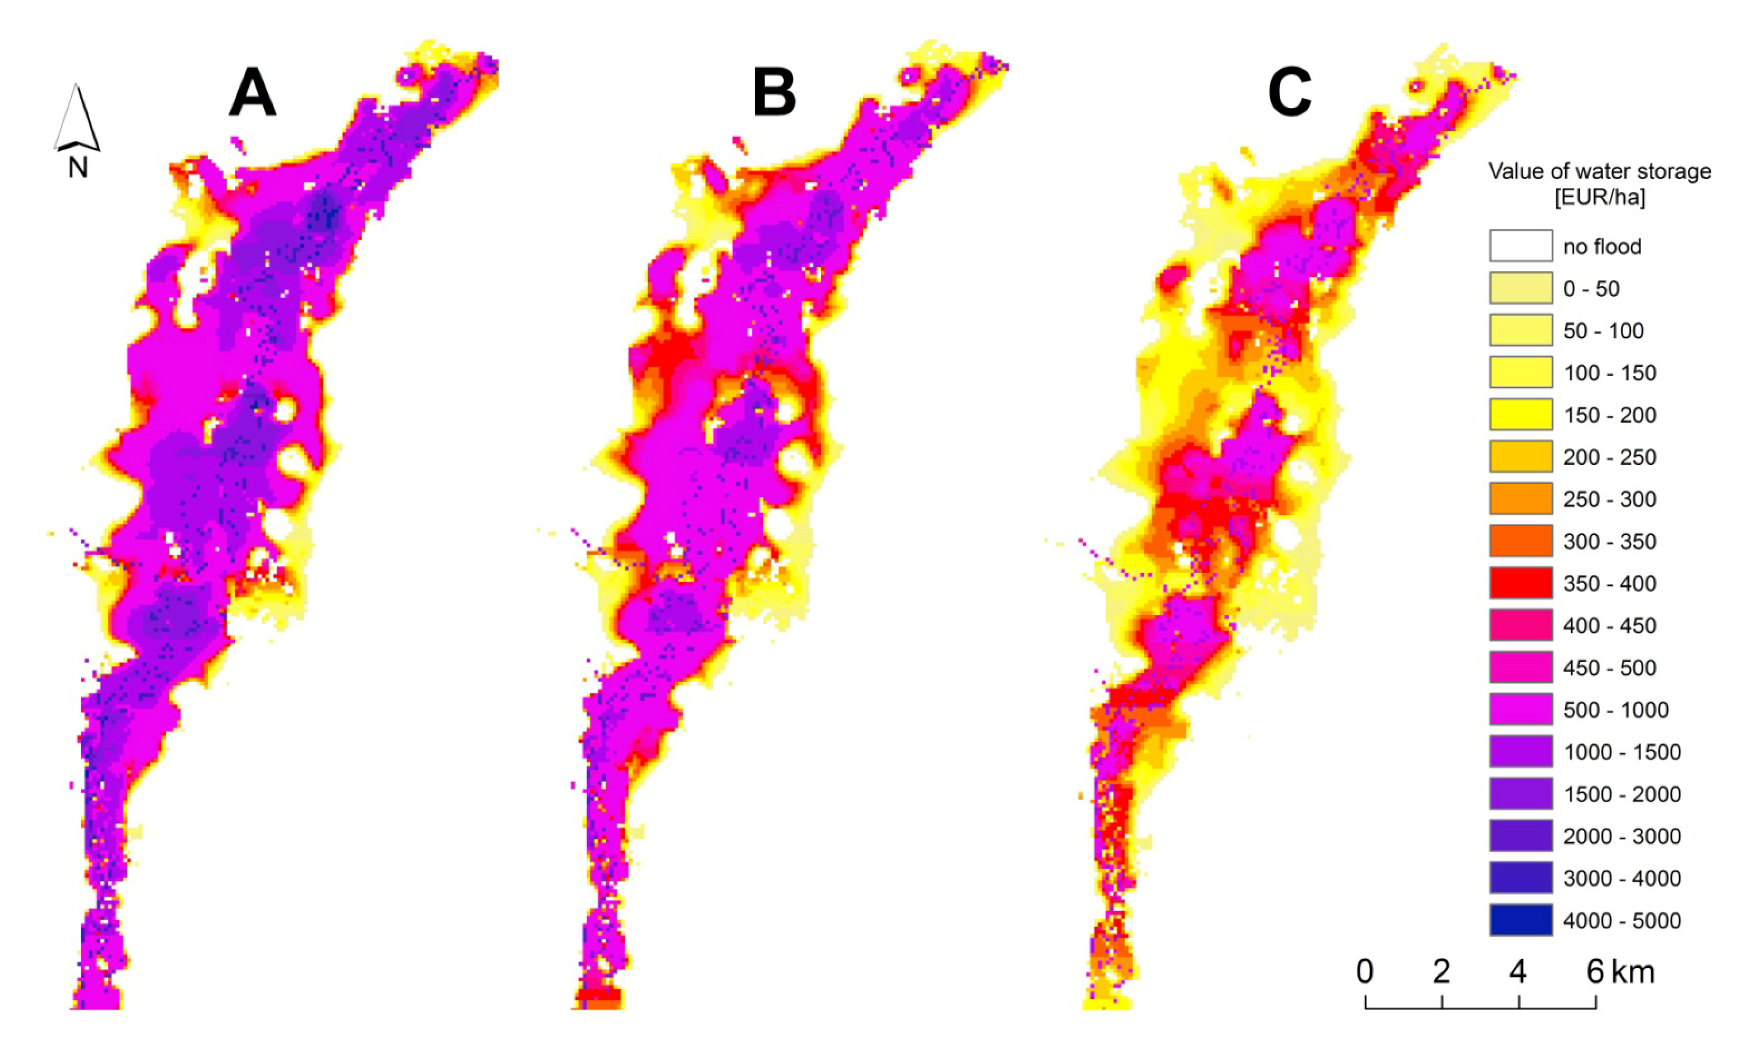
| Average storage value [EUR·ha−1] | 311.58 | 623.06 | 951.18 |
| Total value of water storage [M EUR] | 2.52 | 5.04 | 7.73 |
4. Discussion
5. Conclusions
Acknowledgments
Conflicts of Interest
References
- Acreman, M.C. Wetlands and Water Storage: Current and Future Trends and Issues; Ramsar Convention Secretariat: Gland, Switzerland, 2012. [Google Scholar]
- Blackwell, M.S.A.; Maltby, E. Ecoflood Guidelines: How to Use Floodplains for Flood Risk Reduction; 4 European Commission D.G. Research: Brussels, Belgium, 2006. [Google Scholar]
- Maltby, E. Functional Assessment of Wetlands: Towards Evaluation of Ecosystem Services; Woodhead Publishing Ltd.: Cambridge, UK, 2009; p. 672. [Google Scholar]
- Turner, R.K.; van den Bergh, J.C.J.M.; Soderqvist, T.; Barendregt, A.; van der Straaten, J.; Maltby, E.; van Ierland, E.C. Ecological-economic analysis of wetlands: Scientific integration for management and policy. Ecol. Econ. 2000, 35, 7–23. [Google Scholar] [CrossRef]
- Webler, T.; Kastenholz, H.; Renn, O. Public participation in impact assessment: A social learning perspective. Environ. Impact Assess. 1995, 15, 443–463. [Google Scholar] [CrossRef]
- Joosten, H.; Clarke, D. Wise Use of Mires and Peatlands—Background and Principles Including a Framework for Decision Making; IMCG Cooperation, International Peat Society (IPS): Saarijarvi, Finland, 2002. [Google Scholar]
- Grygoruk, M.; Mirosław-Świątek, D.; Kardel, I.; Okruszko, T.; Michałowski, R.; Kwiatkowski, G. Analysis of Past-Present Hydrological Phenomena of the Biebrza Valley; Report 4.4.2. for HABIT-CHANGE Project 2CE168P3; Biebrza National Park: Osowiec-Twierdza, Poland, 5 December 2011; p. 29. Available online: http://www2.ioer.de/download/habit-change/HABIT-CHANGE_4_4_2%20hydrologic_phenomena.pdf (accessed on 14 July 2013).
- Grygoruk, M.; Biereżnoj-Bazille, U.; Mazgajski, M.; Sienkiewicz, J. Climate-Induced Challenges for Wetlands: Revealing the Background for Adaptive Management of Ecosystems in the Biebrza Valley, Poland. In 58th Advances in Global Change Research, 58, Managing Protected Areas in Central And Eastern Europe Under Climate Change; Rannow, S., Neubert, M., Eds.; Springer: Berlin-Heidelberg, Germany, 2014; ISBN ISBN 978-94-007-7959-4. (in press) [Google Scholar]
- Mioduszewski, W.; Okruszko, T. Protection of natural wetlands—The examples of conflicts. J. Water Land Dev. 2012, 16, 35–42. [Google Scholar]
- Jabłońska, E.; Kotkowicz, M.; Manewicz, M.; Nawrocki, P.; Pawlaczyk, P. Inventory and Environmental Assessment of River Training in Łódzkie, Podkarpackie, Małopolskie, Świętokrzyskie, Warmińsko-Mazurskie, Zachodniopomorskie, Opolskie, Wielkopolskie, Mazowieckie i Podlaskie Regions in 2010–2012…; (in Polish). WWF Poland report on River Conservation in Poland: Warsaw, Poland, 17 April 2013; p. 124. Available online: http://awsassets.wwfpl.panda.org/downloads/raport_wwf_polska_prace_utrzymaniowe.pdf (accessed on 16 July 2013).
- Regional board for drainage and irrigation in Białystok (Wojewódzki zarząd melioracji i urządzeń wodnych w Białymstoku). In Programme of Irrigation for Podlaskie Voivodeship for Years 2007–2013; (in Polish). Wojewódzki Zarząd Melioracji i Urządzeń Wodnych: Białystok, Polish, 2008; p. 76.
- Biswas, A.K.; Tortajada, C. Appraising the Concept of Sustainable Development: Water Management and Related Environmental Challenges; Oxford University Press: Oxford, UK, 2004; p. 223. [Google Scholar]
- McDonnell, R. Challenges for integrated water resources management: How do we provide the knowledge to support truly integrated thinking? Int. J. Water Resour. Dev. 2008, 24, 131–143. [Google Scholar] [CrossRef]
- Wassen, M.J.; Okruszko, T.; Kardel, I.; Chormański, J.; Świątek, D.; Mioduszewski, W.; Bleuten, W.; Querner, E.P.; El Kahloun, M.; Batelaan, O.; et al. Eco-Hydrological Functioning of the Biebrza Wetlands: Lessons for the Conservation and Restoration of Deteriorated Wetlands. In Wetlands: Functioning, Biodiversity Conservation and Restoration; Bobbink, R., Beltman, B., Verhoeven, J.T.A., Wigham, D.F., Eds.; Springer-Verlag: Berlin, Germany, 2006; pp. 285–310. [Google Scholar]
- Ignar, S.; Maksymiuk-Dziuban, A.; Mirosław-Świątek, D.; Chormański, J.; Okruszko, T.; Wysocki, P. Temporal variability of selected flood parameters in the Biebrza River valley. Ann. Warsaw Univ. Life Sci. SGGW 2011, 43, 135–142. [Google Scholar]
- Chormański, J.; Okruszko, T.; Ignar, S.; Batelaan, O.; Rebel, K.T.; Wassen, M.J. Flood mapping with remote sensing and hydrochemistry: A new method to distinguish the origin of flood water during floods. Ecol. Eng. 2011, 37, 1334–1349. [Google Scholar] [CrossRef]
- Byczkowski, A.; Kiciński, T. Frequency and duration of floods in the Biebrza river valley. Zesz. Probl. Post. Nauk Roln. 1983, 255, 75–87. (in Polish). [Google Scholar]
- Polakowski, M.; Broniszewska, M.; Jankowiak, Ł.; Ławicki, Ł.; Siuchno, M. Numbers and dynamics of spring migration of geese in the Biebrza Basin. Ornis Pol. 2011, 52, 169–180. [Google Scholar]
- Tyszka, J. Estimation and economic valuation of the forest retention capacities. J. Water Land Dev. 2009, 13, 149–159. [Google Scholar]
- Świątek, D.; Chormański, J. The Verification of the Numerical River Flow Model by Use of Remote Sensing. In Wetlands: Monitoring, Modelling and Management; Okruszko, T., Maltby, E., Szatyłowicz, J., Świątek, D., Kotowski, W., Eds.; Taylor & Francis Group: London, UK, 2007. [Google Scholar]
- Świątek, D.; Szporak, S.; Chormański, J.; Okruszko, T. Hydrodynamic model of the Lower Biebrza River flow—A tool for assessing the hydrologic vulnerability of a floodplain to management practices. Ecohydrol. Hydrobiol. 2008, 2–4, 331–337. [Google Scholar]
- Chormański, J.; Mirosław-Świątek, D.; Michałowski, R. A hydrodynamic model coupled with GIS for flood characteristics in the Biebrza riparian wetland. Oceanol. Hydrobiol. St. 2009, 38, 65–73. [Google Scholar]
- Mirosław-Świątek, D.; Utratna, M. Automatic system of registration of water level on floodplains in the lower basin of Biebrza river. Sci. Rev. Eng. Environ. Sci. 2012, 21, 20–32. [Google Scholar]
- Kaczmarek, Z.; Trykozko, E. Application of the method of quantiles of estimation of the Pearson distribution. Acta Geoph. Polon. 1964, 12, 5–12. [Google Scholar]
- Chrzanowska, W. Evaluation of the Surface Water Storage in the Lower Biebrza Basin. Ph.D. Thesis, Warsaw University of Life Sciences—SGGW, Warsaw, Poland, 15 February 2013. [Google Scholar]
- Szporak, S.; Mirosław-Świątek, D.; Chormański, J. The flood extent in the Lower Biebrza Basin calculated by the 1D flow model for different land use scenarios. Ann. Warsaw Univ. Life Sci. SGGW 2008, 40, 45–54. [Google Scholar]
- Gerard, M.; El Kahloun, M.; Mertens, W.; Verhagen, B.; Meire, P. Impact of flooding on potential and realised grassland species richness. Plant Ecol. 2008, 194, 85–98. [Google Scholar]
- Junk, W.J.; Bayley, P.B.; Sparks, R.E. The flood pulse concept in river-floodplain systems. Can. Spec. Publ. Fish. Aquat. Sci. 1989, 106, 110–127. [Google Scholar]
- Okruszko, T.; Duel, H.; Acreman, M.; Grygoruk, M.; Flörke, M.; Schneider, C. Broad scale ecosystem services of European wetlands—Overview of the current situation and future perspectives under different climate and water management scenarios. Hydrol. Sci. J. 2011, 53, 1501–1517. [Google Scholar]
- Rychłowski, A. Analysis of Variable Costs of Production. (in Polish). Available online: http://ksow.pl/fileadmin/user_upload/podlaskie/pliki/Analiza_zmiennych_koszt%C3%B3w_produkcji.pdf (accessed on 25 May 2013).
- Burkhard, B.; Crossman, N.; Nedkov, S.; Petz, K.; Alkemade, R. Mapping and modelling ecosystem services for science, policy and practice. Ecosyst. Serv. 2013, 2, 1–3. [Google Scholar]
- Maes, J.; Egoh, B.; Willemen, L.; Liquete, C.; Vihervaara, P.; Schagner, J.P.; Grizzetti, B.; Drakou, E.G.; Notte, A.L.; Zulian, G.; et al. Mapping ecosystem services for policy support and decision making in the European Union. Ecosyst. Serv. 2012, 1, 31–39. [Google Scholar] [CrossRef]
- Sullivan, T.J. Combining ecosystem service and critical load concepts for resources management and public policy. Water 2012, 4, 905–913. [Google Scholar] [CrossRef]
- Bateman, I.J.; Harwood, A.R.; Mace, G.M.; Watson, R.T.; Abson, D.J.; Andrews, B.; Binner, A.; Crowe, A.; Day, B.H.; Dugdale, S.; et al. Bringing ecosystem services into economic decision-making: Land use in the United Kingdom. Science 2013, 341, 45–50. [Google Scholar] [CrossRef]
- Lawton, R.N.; Rudd, M.A. Strange bedfellows: Ecosystem services, conservation science, and central government in the United Kingdom. Resources 2013, 2, 114–127. [Google Scholar] [CrossRef]
- Karamouz, M.; Noori, N.; Moridi, A.; Ahmadi, A. Evaluation of floodplain variability, considering impacts of climate change. Hydrol. Process. 2010, 25, 90–103. [Google Scholar] [CrossRef]
- Schneider, C.; Flörke, M.; Gerling, G.; Duel, H.; Grygoruk, M.; Okruszko, T. The future of European floodplain wetlands under a changing climate. J. Water Clim. Chang. 2011, 2–3, 106–122. [Google Scholar]
- Richter, B.D.; Thomas, G.A. Restoring environmental flows by modifying dam operations. Ecol. Soc. 2007, 12. Article 12. [Google Scholar]
- Biswas, A.K. Integrated water resources management—Is it working? Int. J. Water Resour. Dev. 2008, 1, 5–22. [Google Scholar] [CrossRef]
- Hoekstra, A.Y.; Chapagain, A.K.; Aldaya, M.M.; Mekonnen, M.M. The Water Footprint Assessment Manual: Setting the Global Standard; Water Footprint Network, Earthscan Ltd.: London, UK; Washington, USA, 2011; p. 228. Available online: http://www.waterfootprint. org/downloads/TheWaterFootprintAssessmentManual.pdf (accessed on 20 July 2013).
© 2013 by the authors; licensee MDPI, Basel, Switzerland. This article is an open access article distributed under the terms and conditions of the Creative Commons Attribution license (http://creativecommons.org/licenses/by/3.0/).
Share and Cite
Grygoruk, M.; Mirosław-Świątek, D.; Chrzanowska, W.; Ignar, S. How Much for Water? Economic Assessment and Mapping of Floodplain Water Storage as a Catchment-Scale Ecosystem Service of Wetlands. Water 2013, 5, 1760-1779. https://doi.org/10.3390/w5041760
Grygoruk M, Mirosław-Świątek D, Chrzanowska W, Ignar S. How Much for Water? Economic Assessment and Mapping of Floodplain Water Storage as a Catchment-Scale Ecosystem Service of Wetlands. Water. 2013; 5(4):1760-1779. https://doi.org/10.3390/w5041760
Chicago/Turabian StyleGrygoruk, Mateusz, Dorota Mirosław-Świątek, Weronika Chrzanowska, and Stefan Ignar. 2013. "How Much for Water? Economic Assessment and Mapping of Floodplain Water Storage as a Catchment-Scale Ecosystem Service of Wetlands" Water 5, no. 4: 1760-1779. https://doi.org/10.3390/w5041760