One-Year Surveillance of the Chemical and Microbial Quality of Drinking Water Shuttled to the Eolian Islands


Abstract
:1. Introduction
2. Materials and Methods
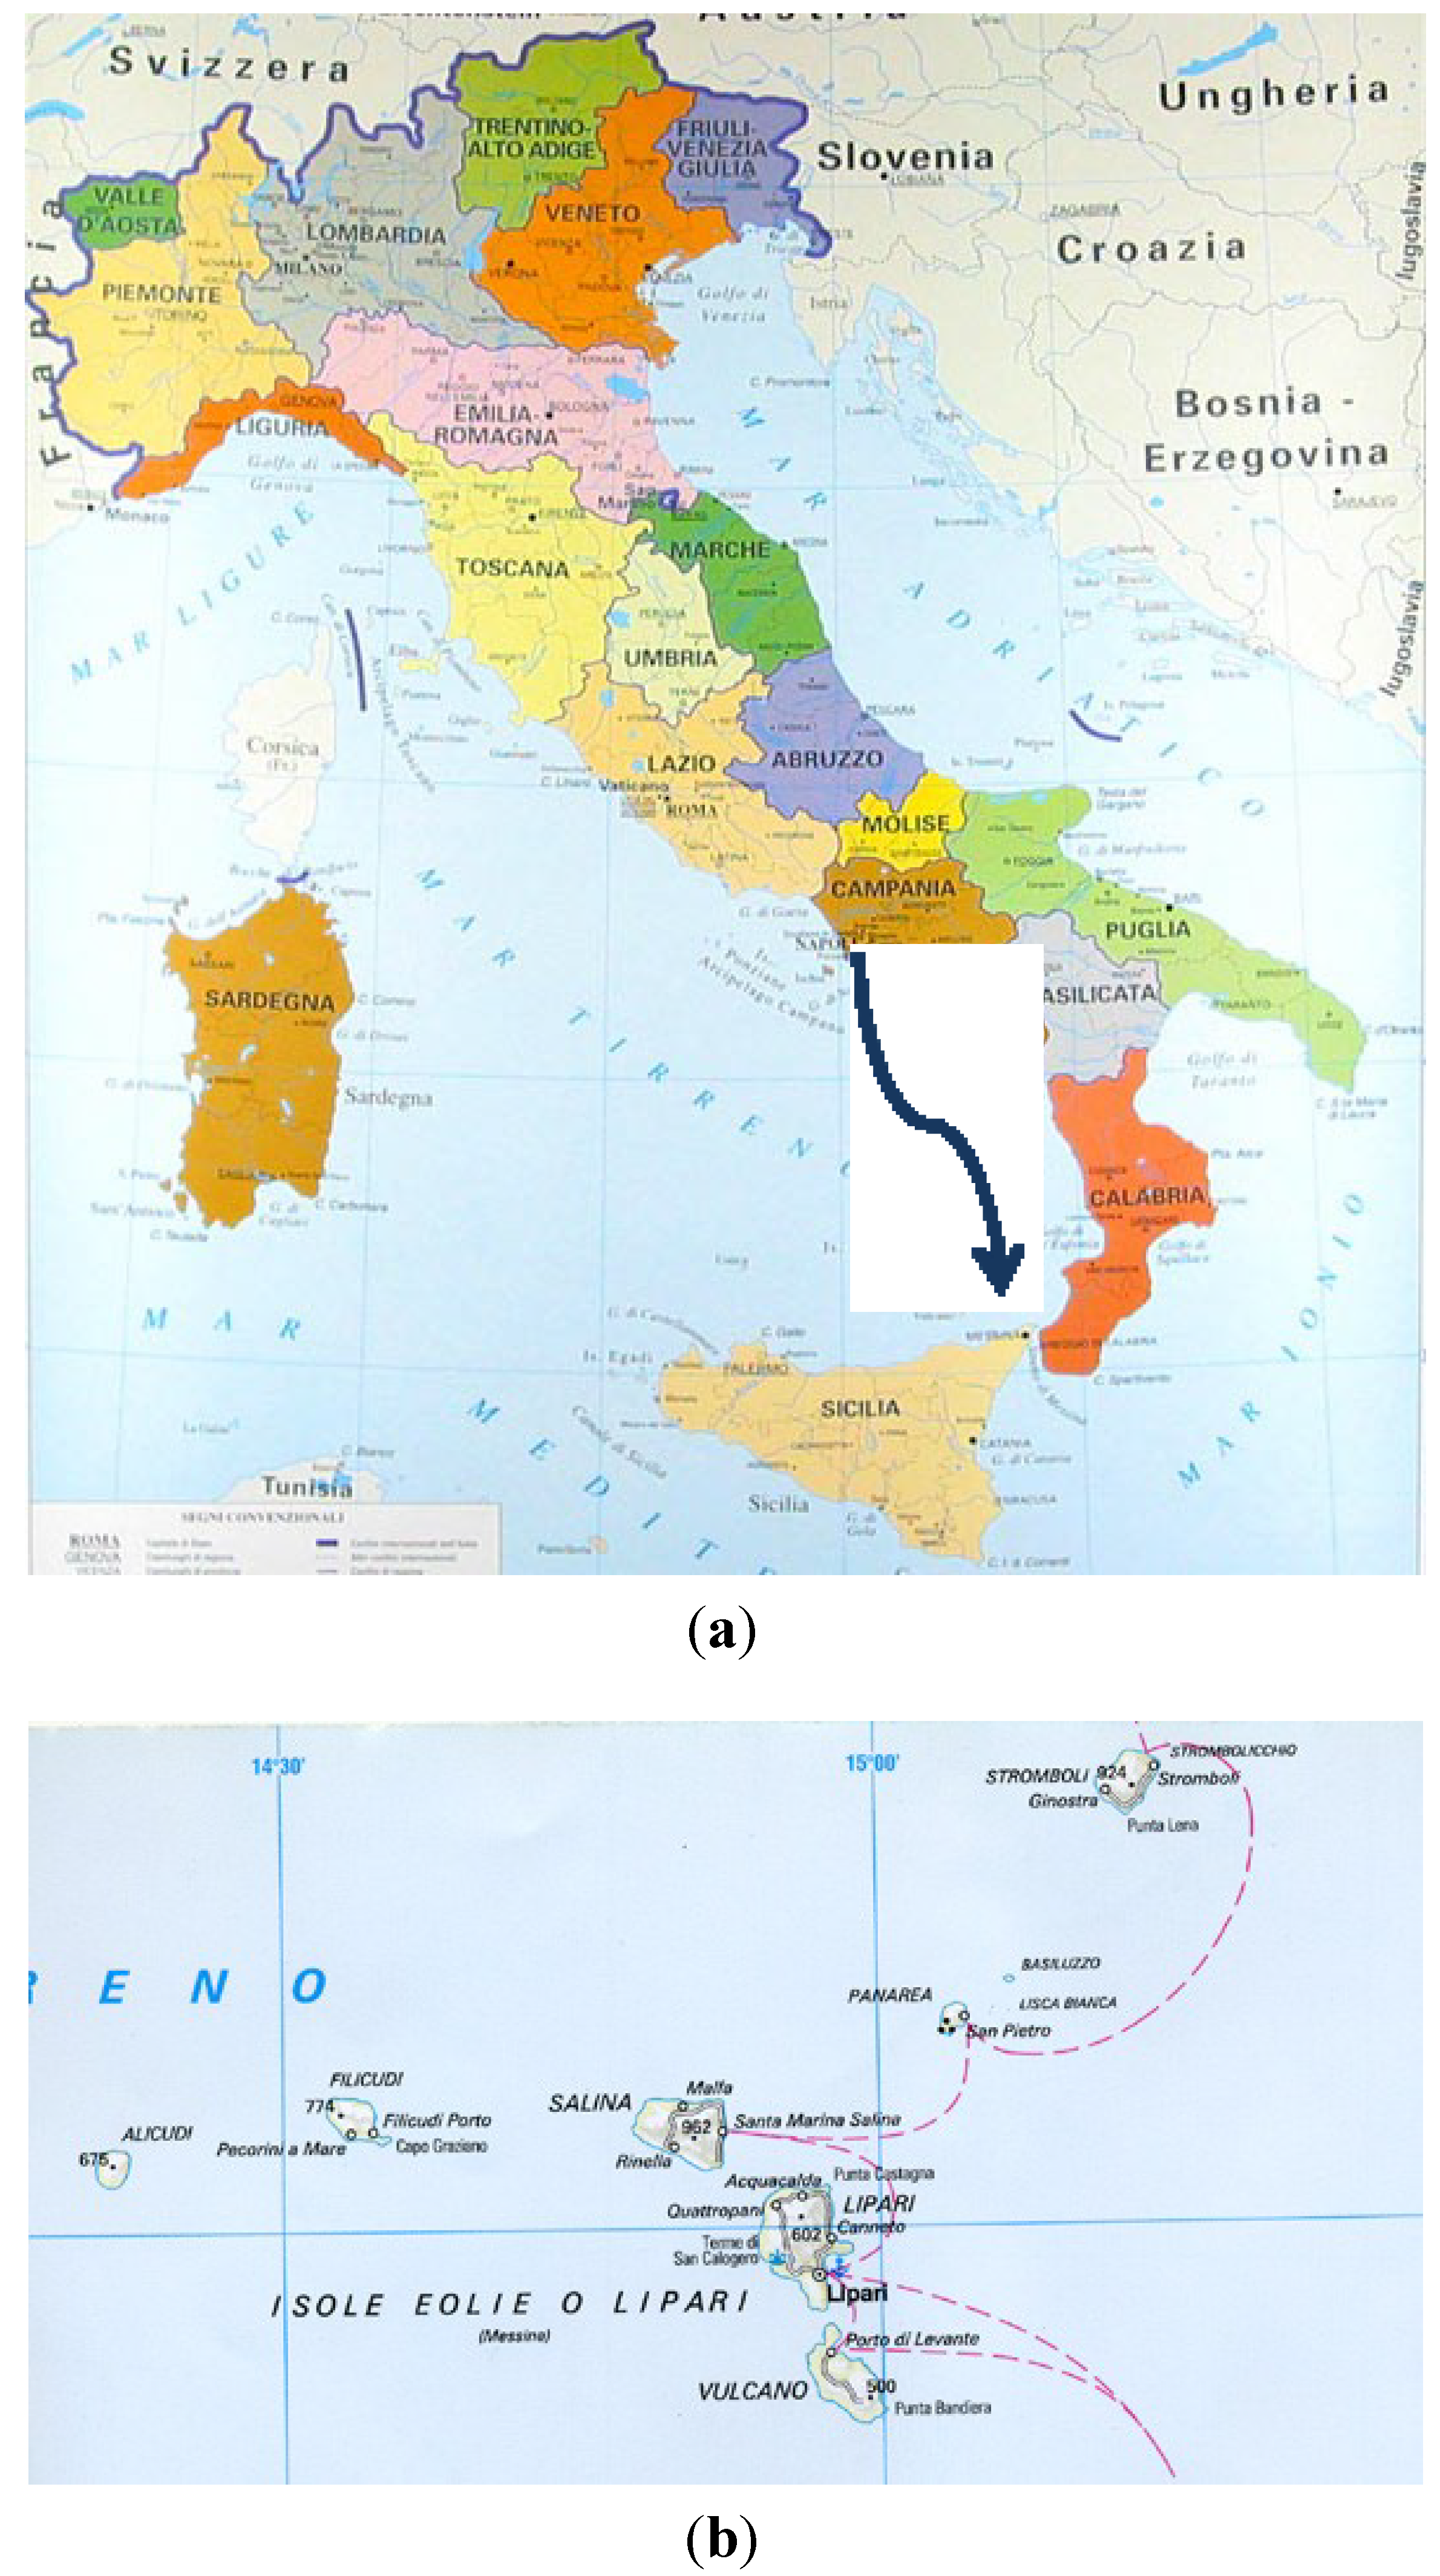
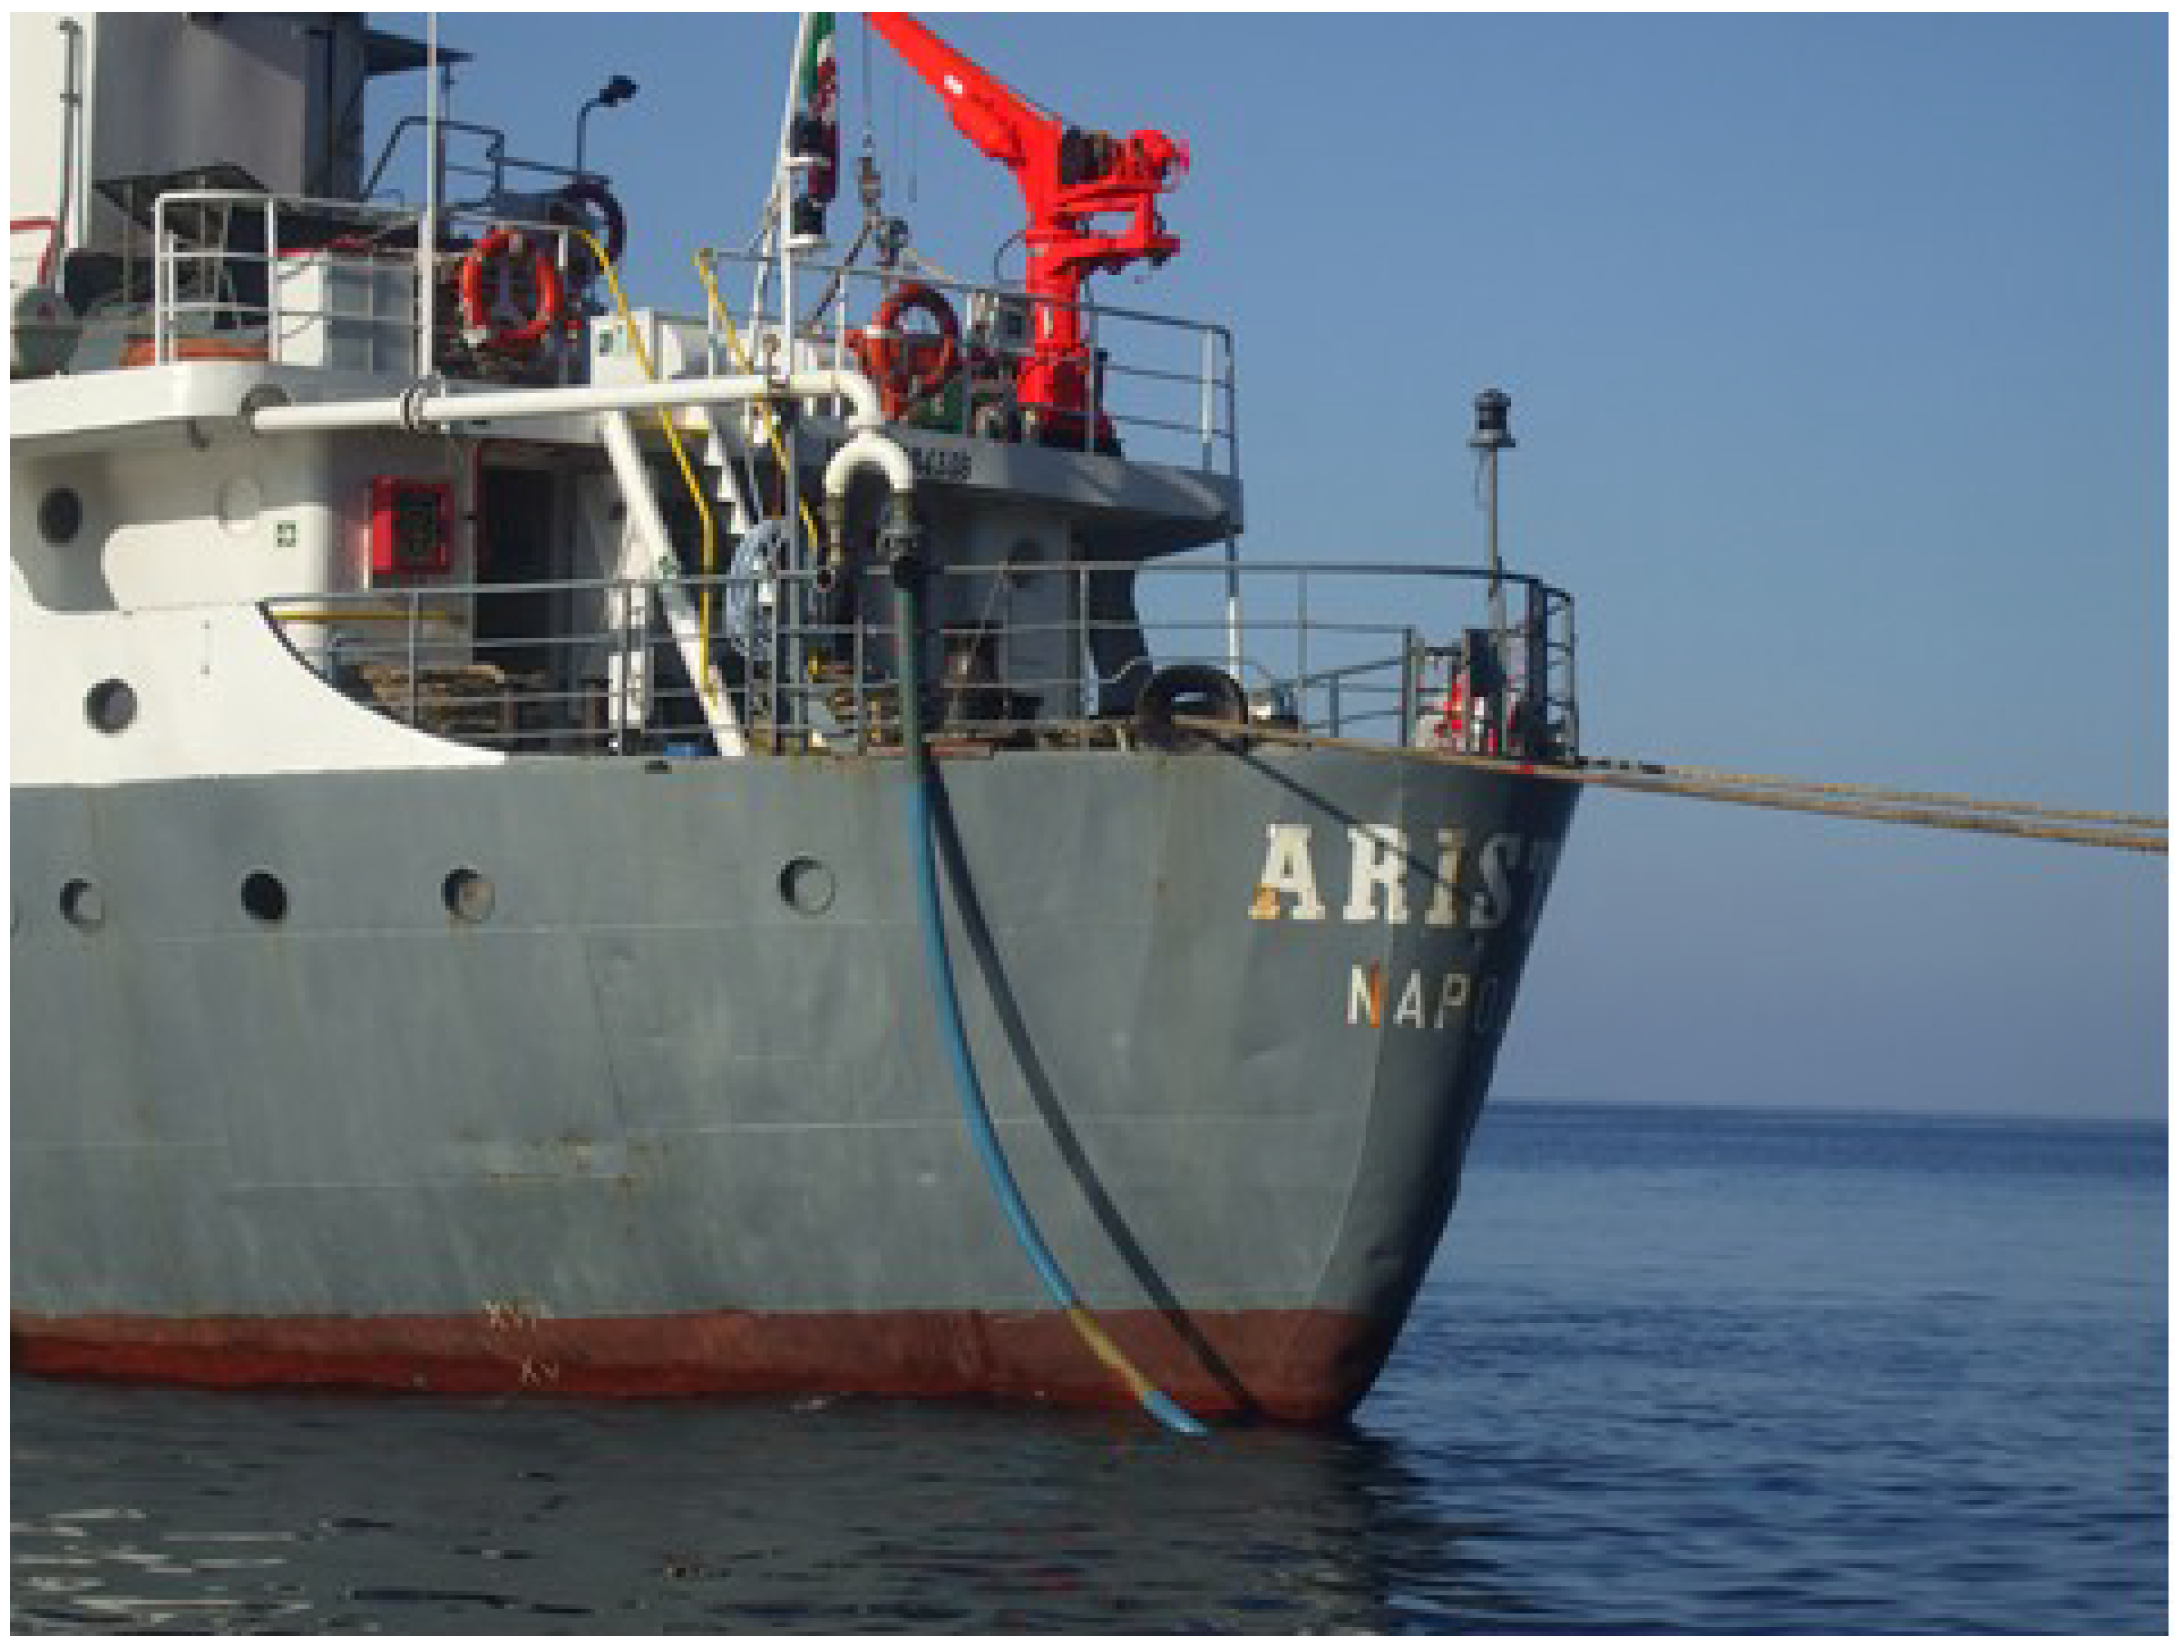
2.1. Sample Collection
2.2. Physico-Chemical Analyses
2.3. Microbiological Analyses
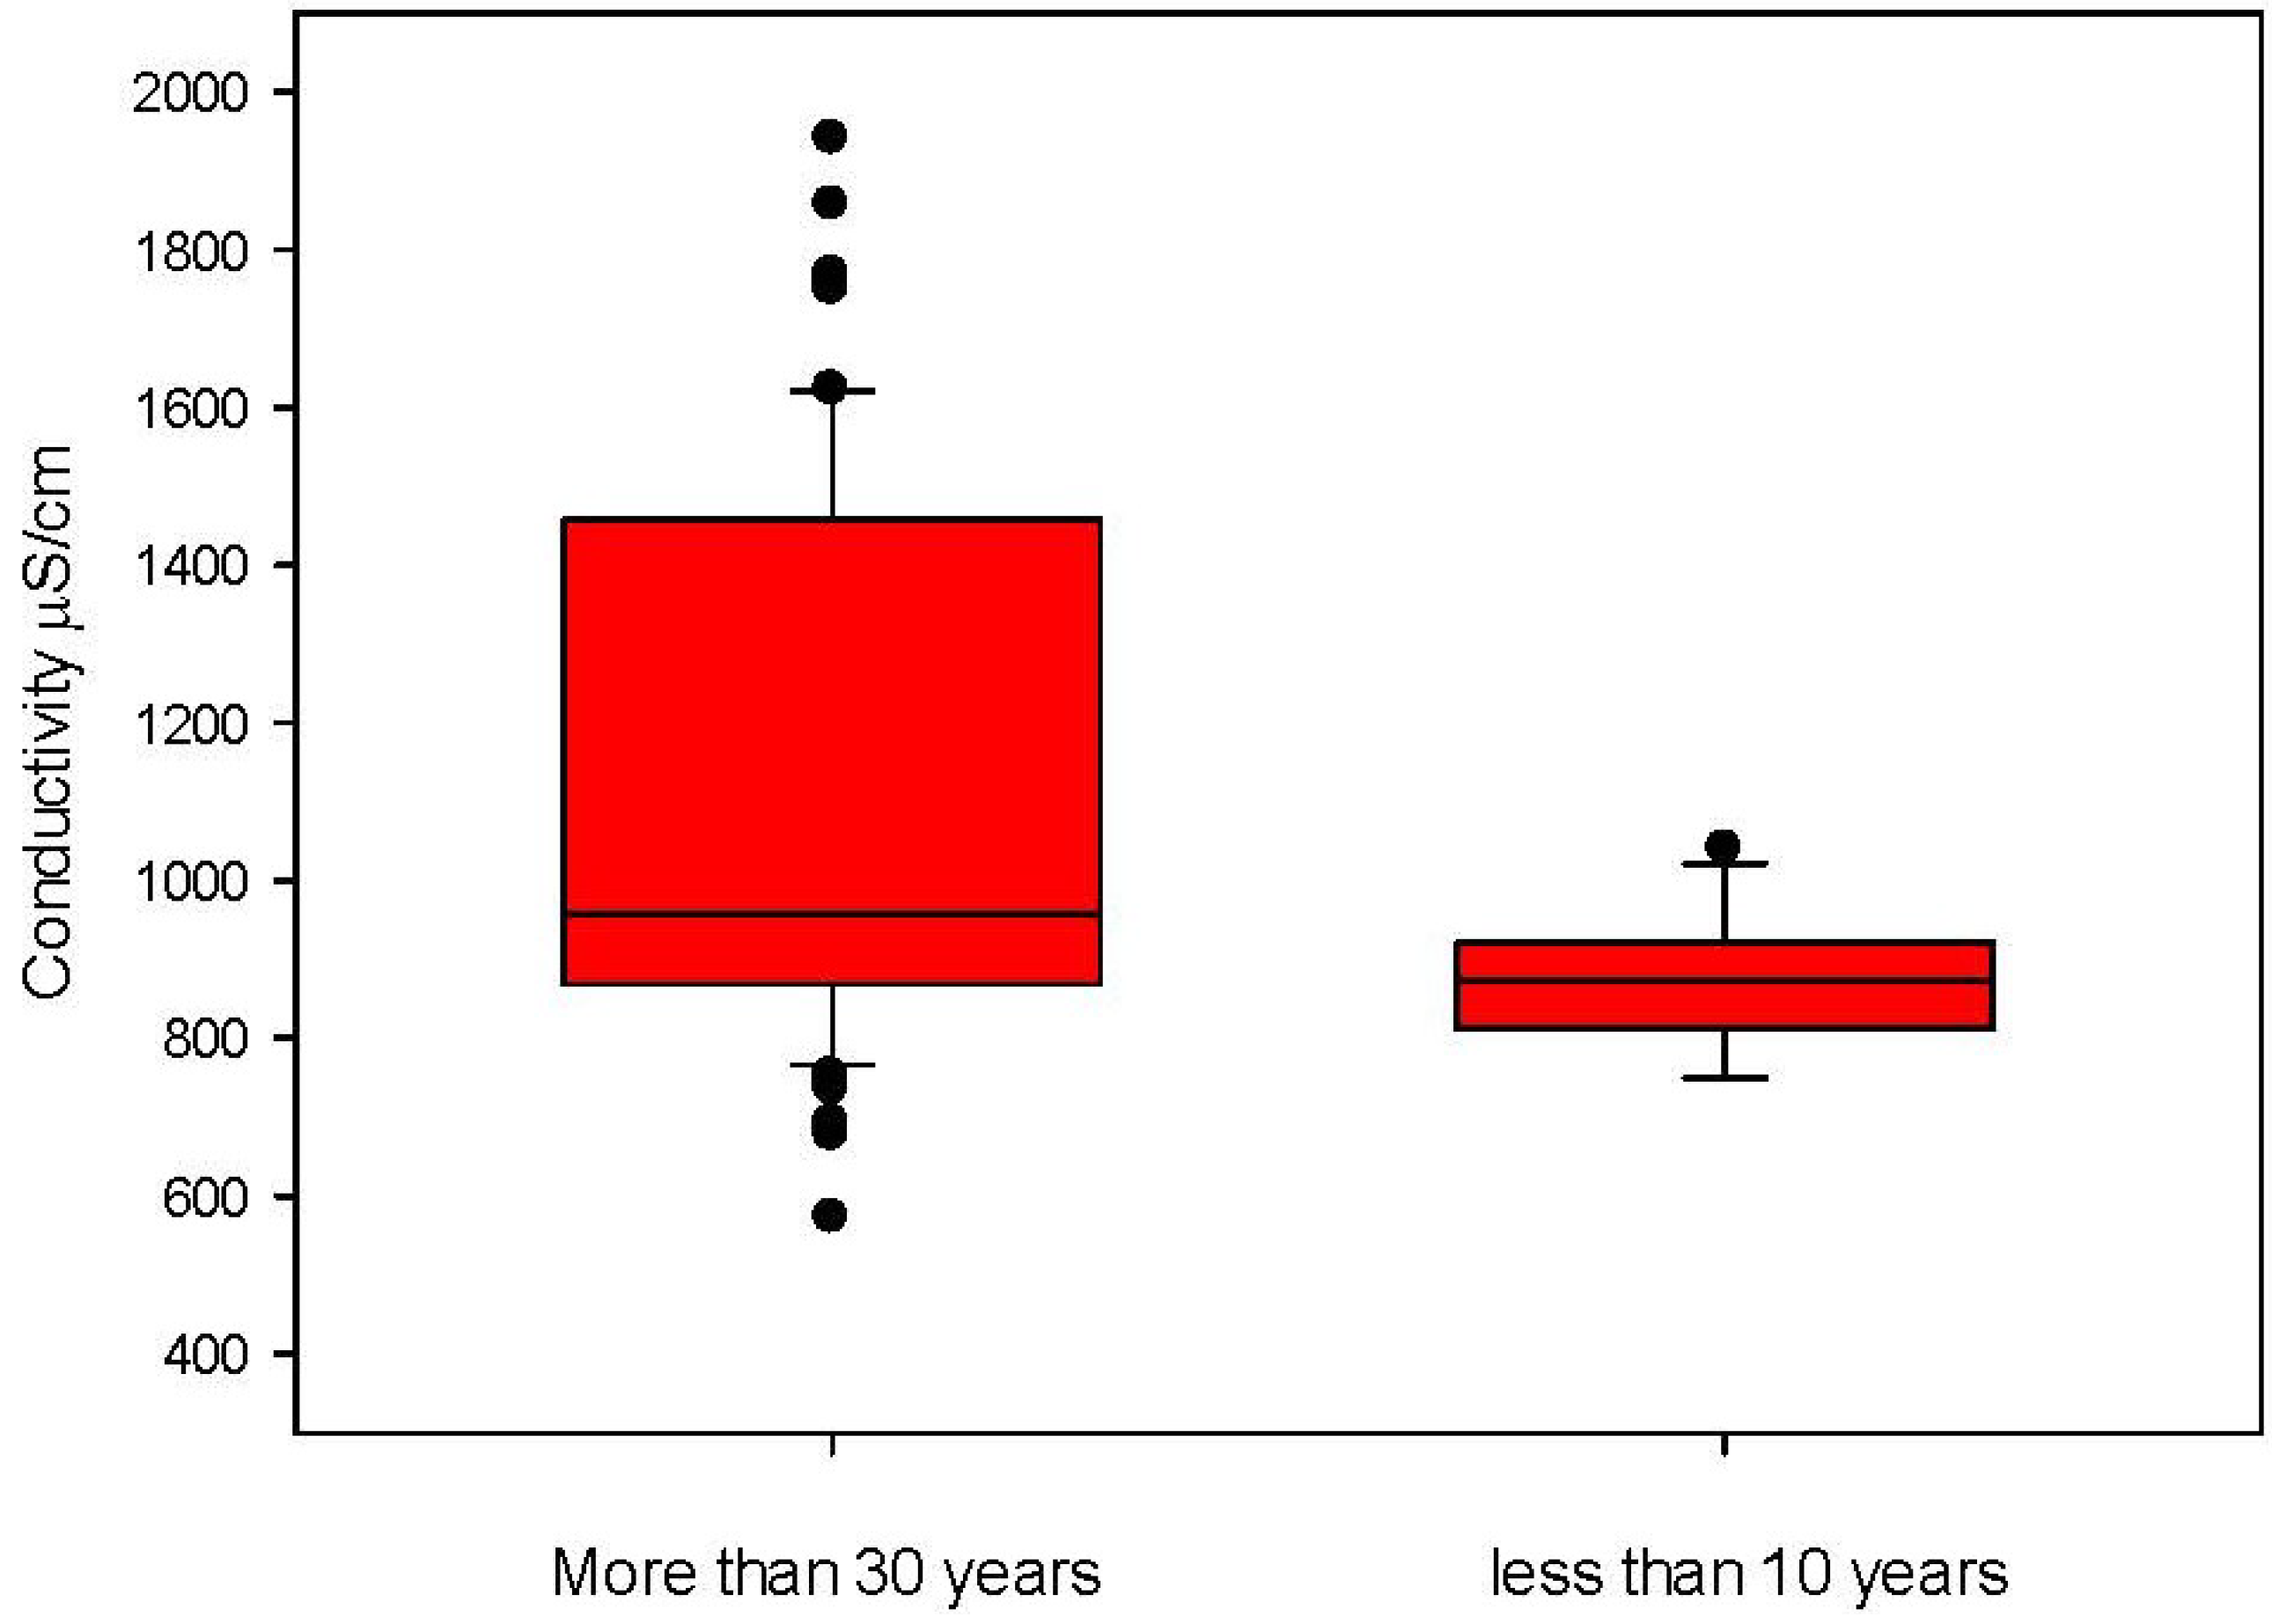
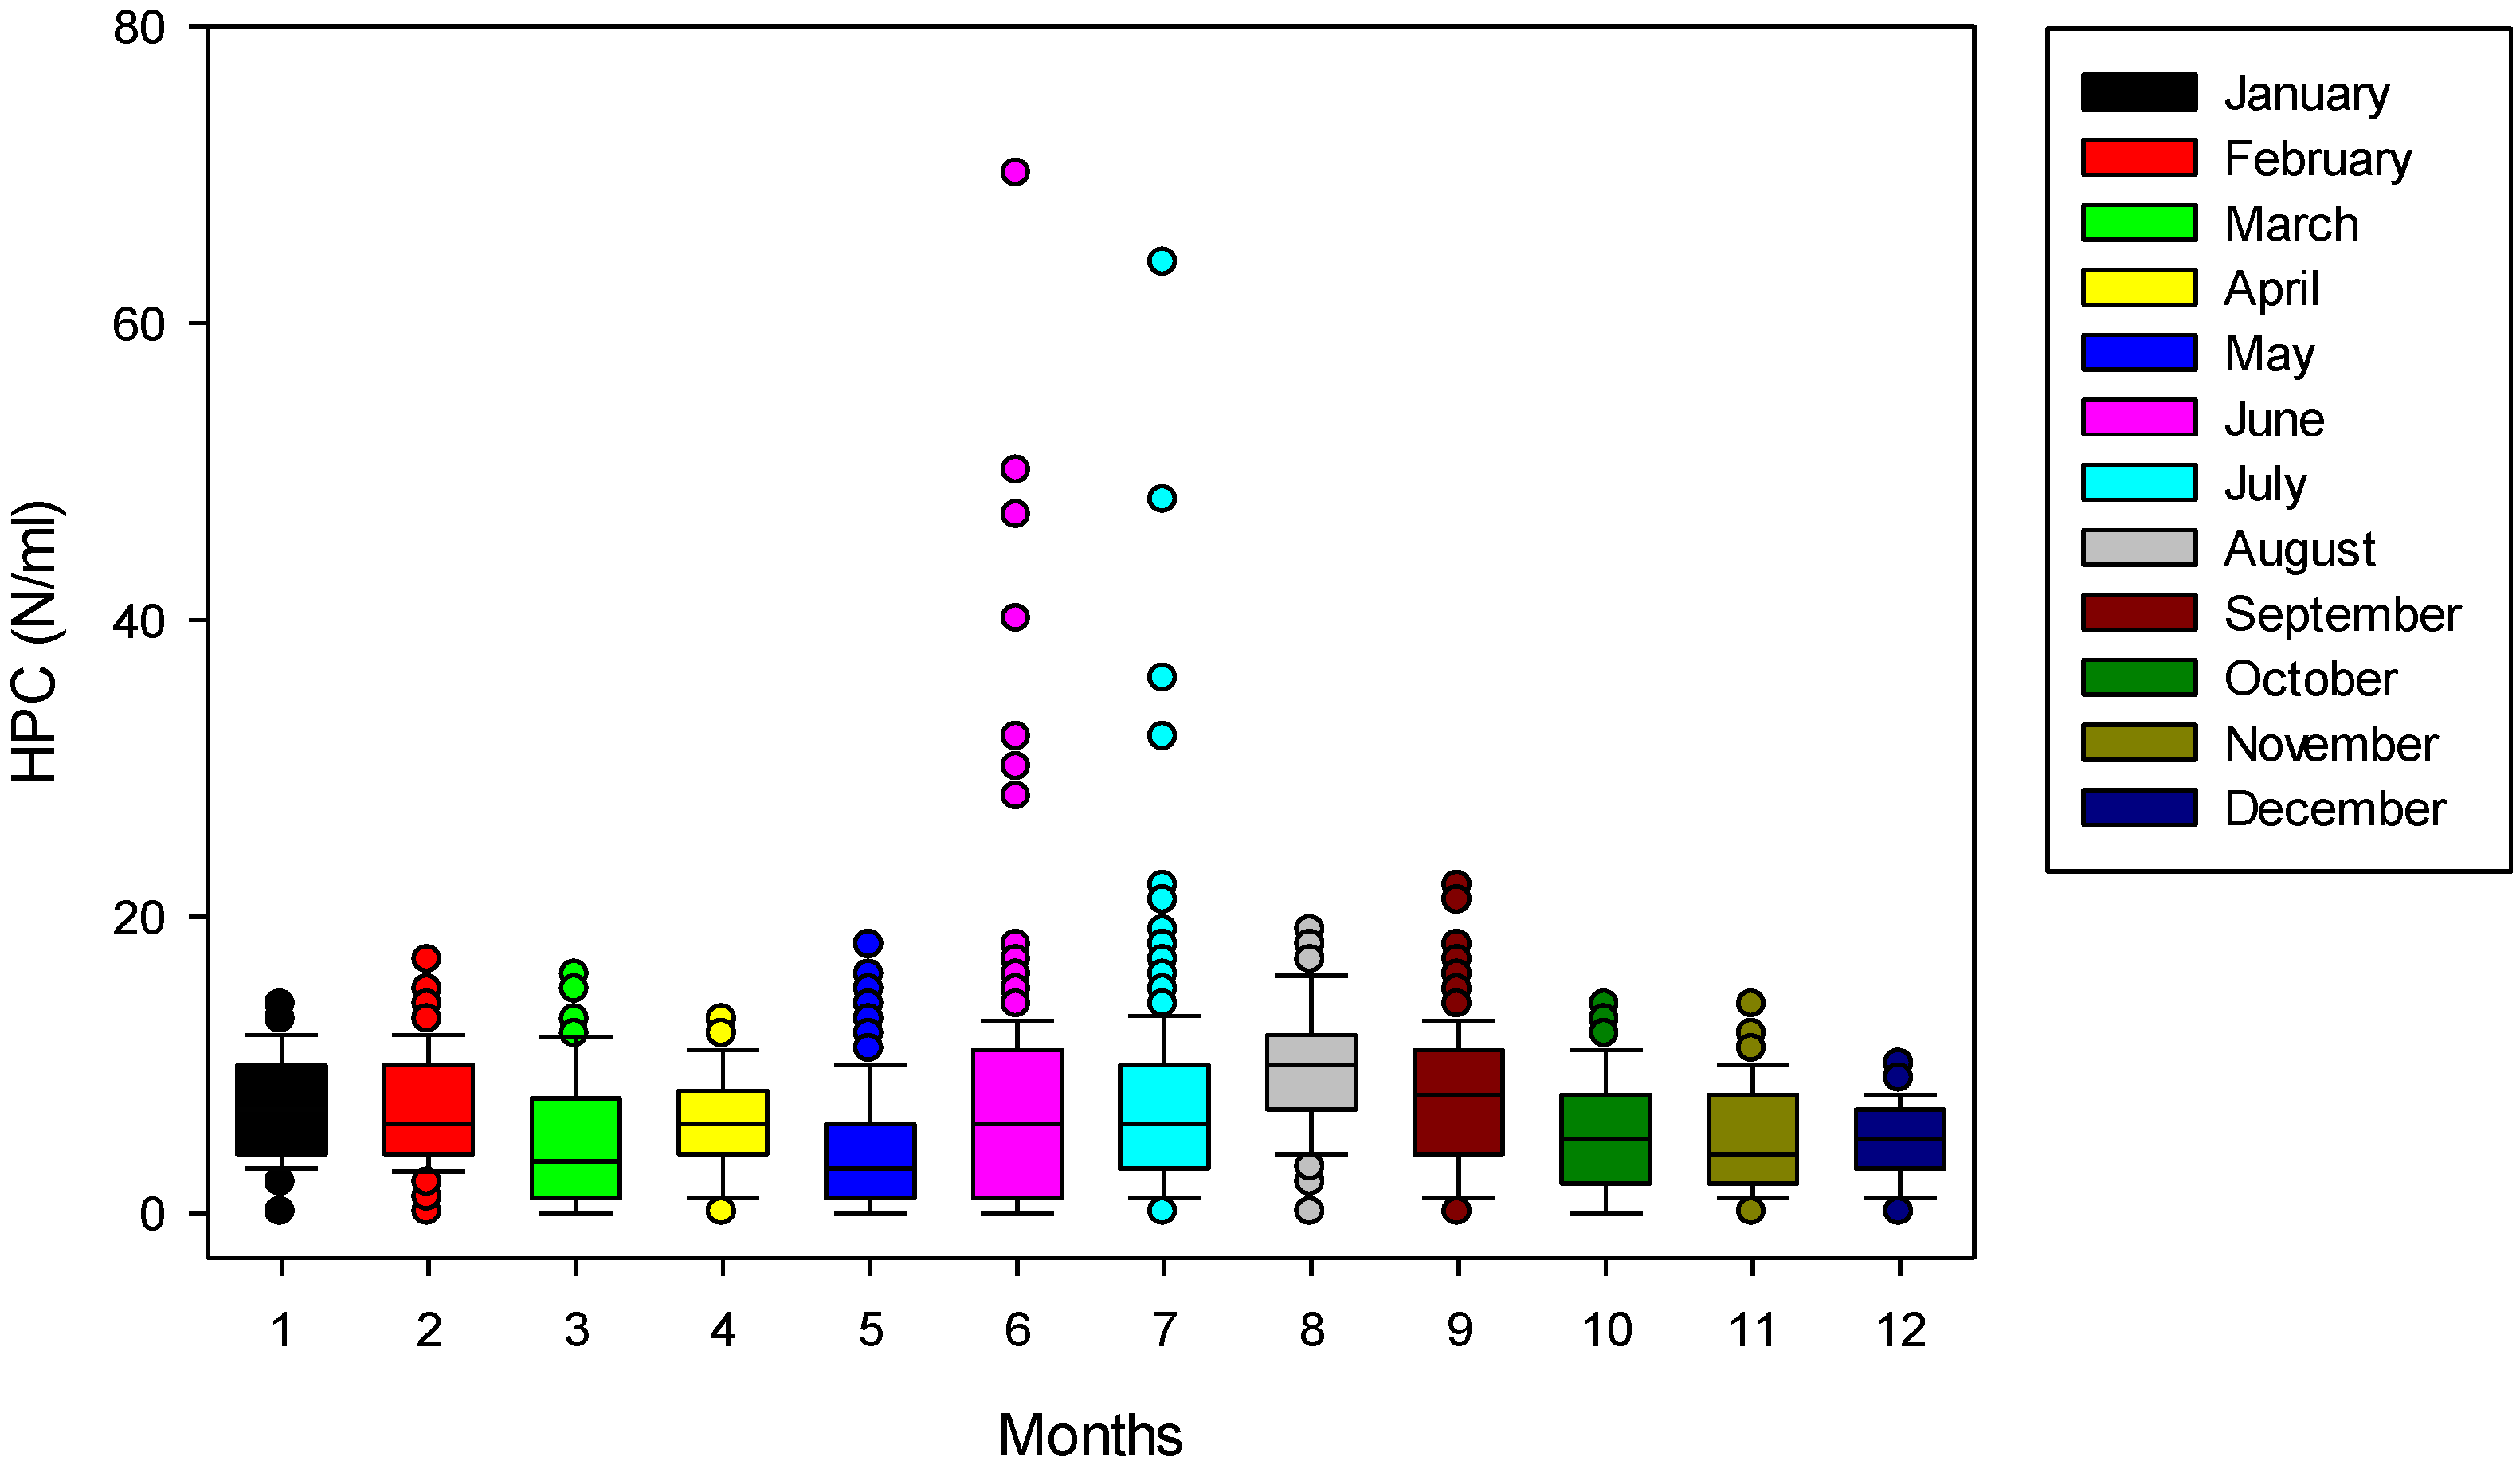
3. Results and Discussions

| Parameter | Method | Unit | Mean | SD | Legislative Decree 31/01 * |
|---|---|---|---|---|---|
| Water Temperature | APAT CNR-IRSA 2100 MAN 29/2003 | (°C) | 13.2 | 0.8 | - |
| Chemical Oxigen Demand (COD) | ISS.BEB.027 REV 00 | (mg/L O2) | 0.1 | 0.01 | 5.0 |
| Electric Conductivity | APAT CNR IRSA 2030 MAN 29/2003 | (µS/cm) | 812 | 342 | 2500 |
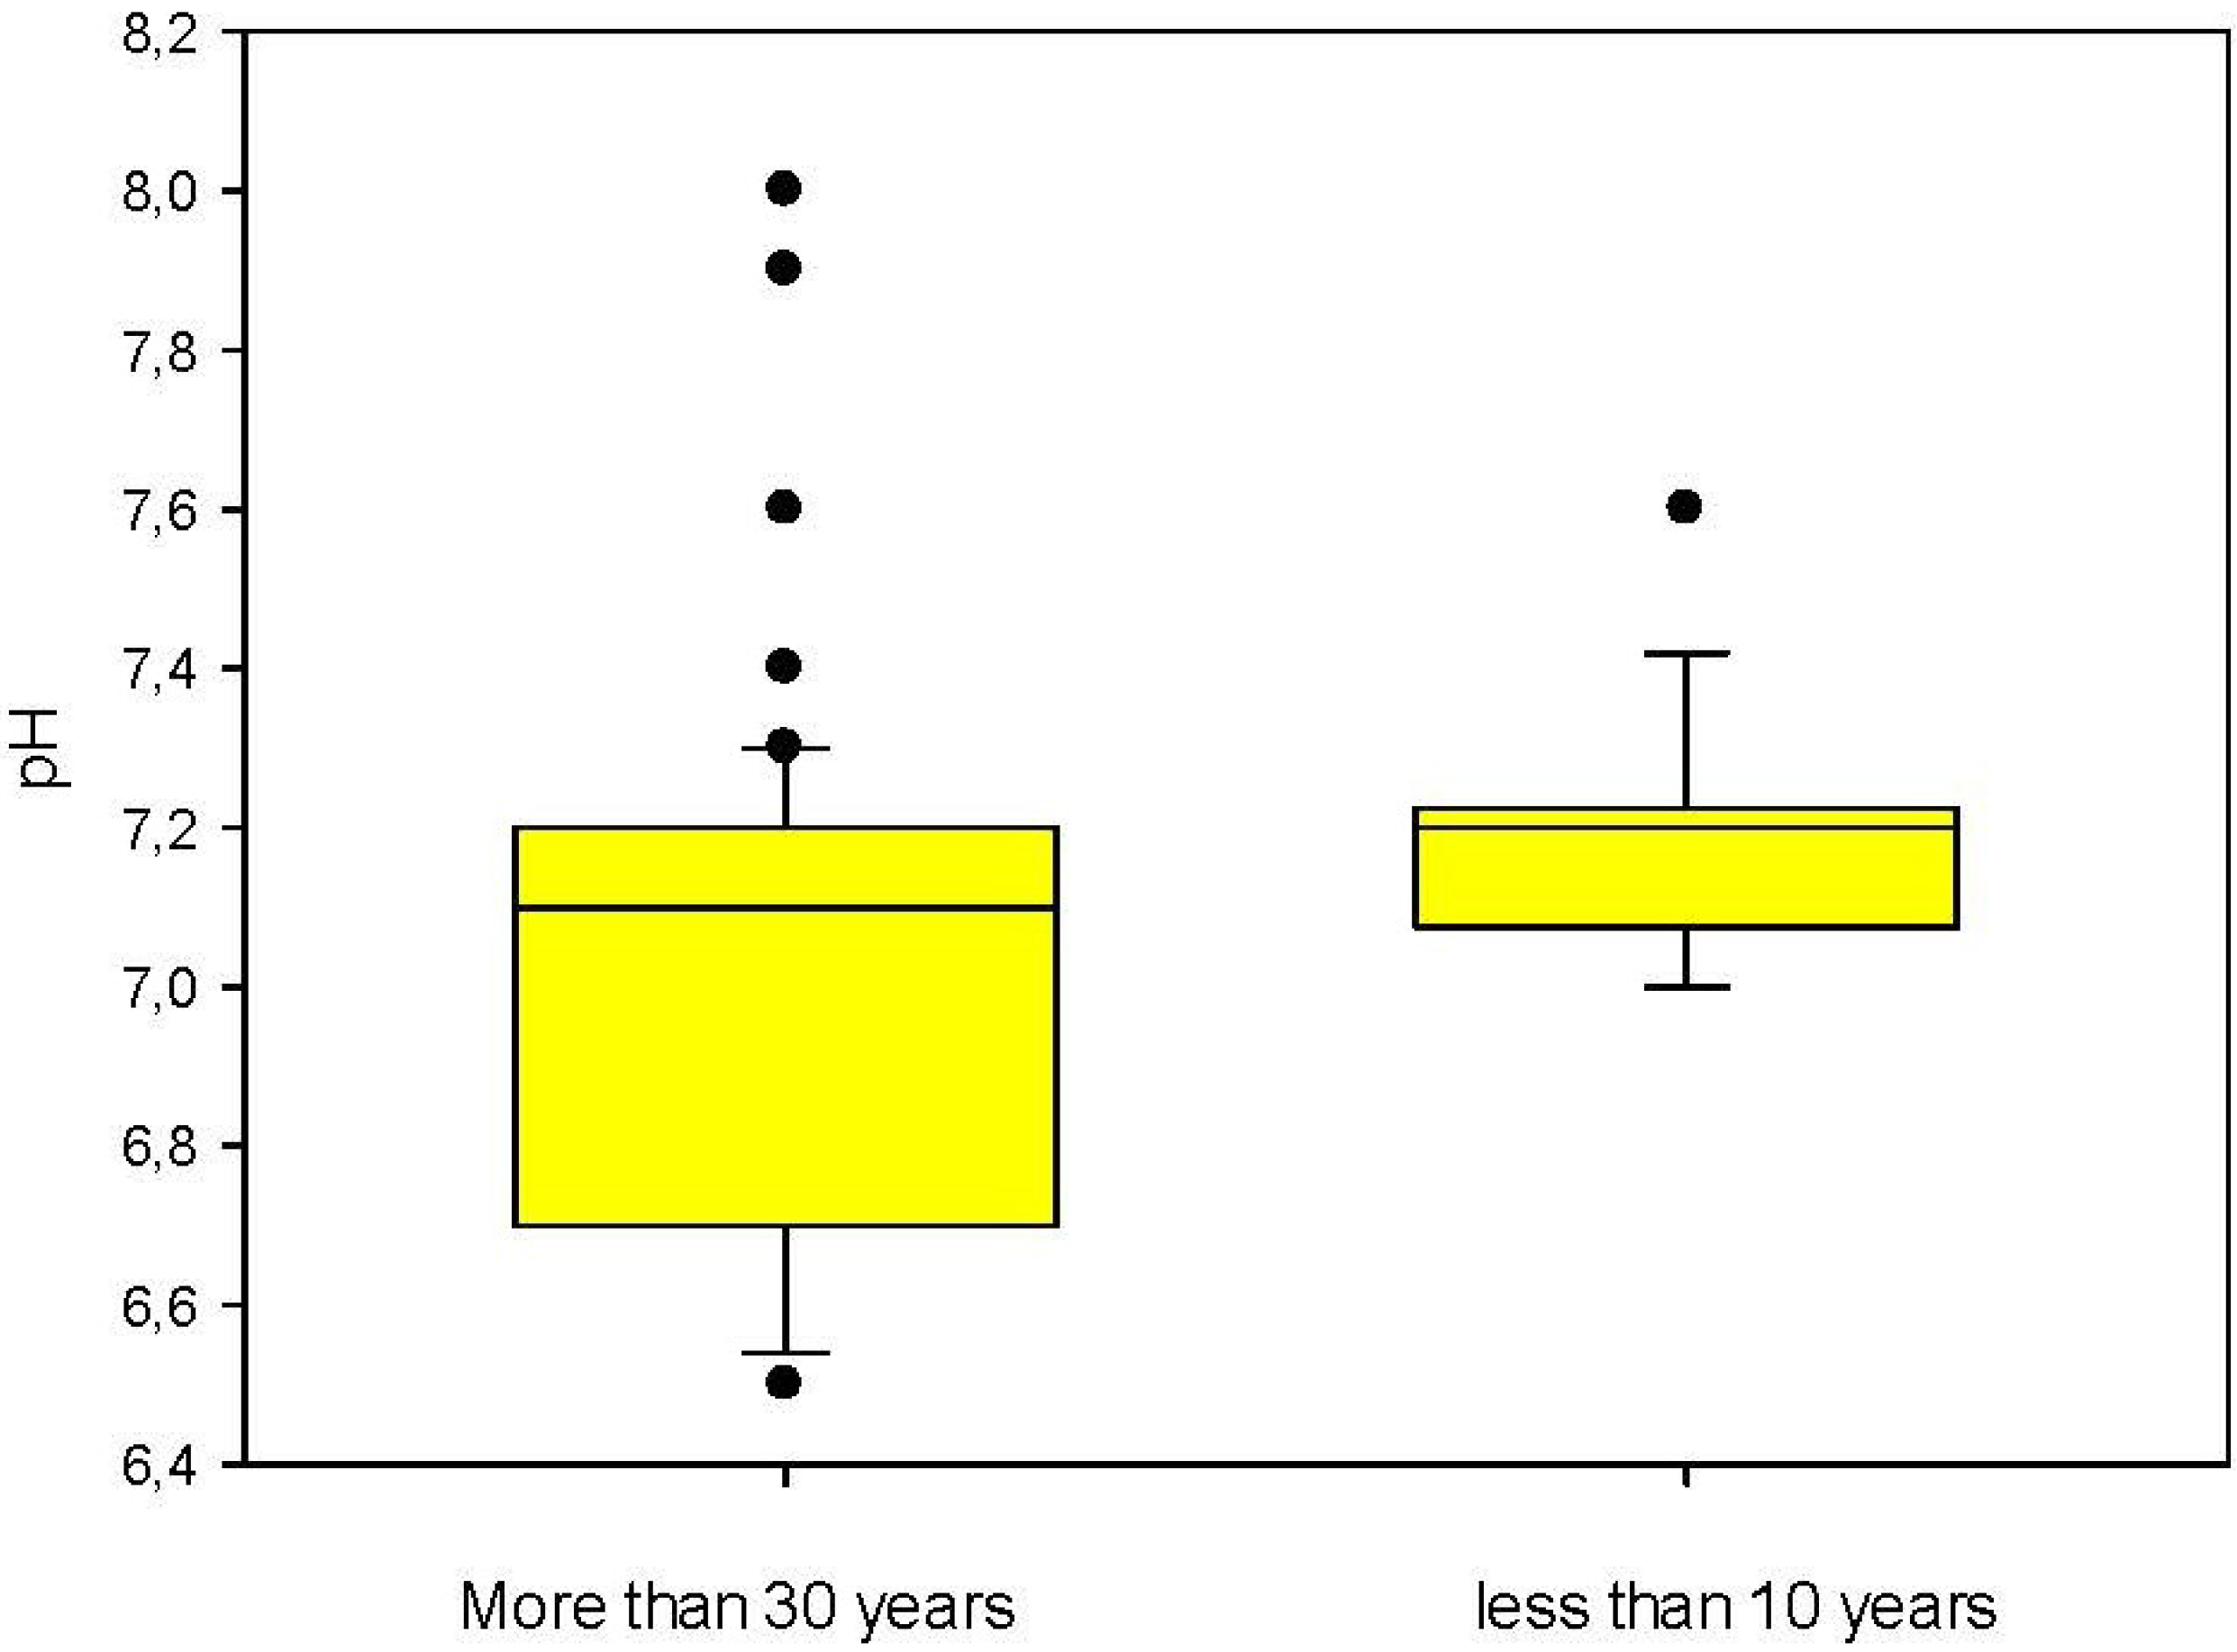
| pH | APAT CNR IRSA 2060 MAN 29/2003 | - | 7.9 | 0.2 | 6.5–9.5 |
| Total hardness | APAT CNR IRSA 2040 MAN 29/2003 | (°F) | 35.5 | 25.6 | 15–50 |
| Fixed residue at 180 °C | ISS.BFA.032.REV 00 | (mg/L) | 350 | 35 | 1500 |
| Ammonium | APAT CNR IRSA 4030 MAN 29/2003 | (mg/L) | <0.02 | - | 0.50 |
| Bromates | ISTISAN 03 | (µg/L) | <1 | - | 10 |
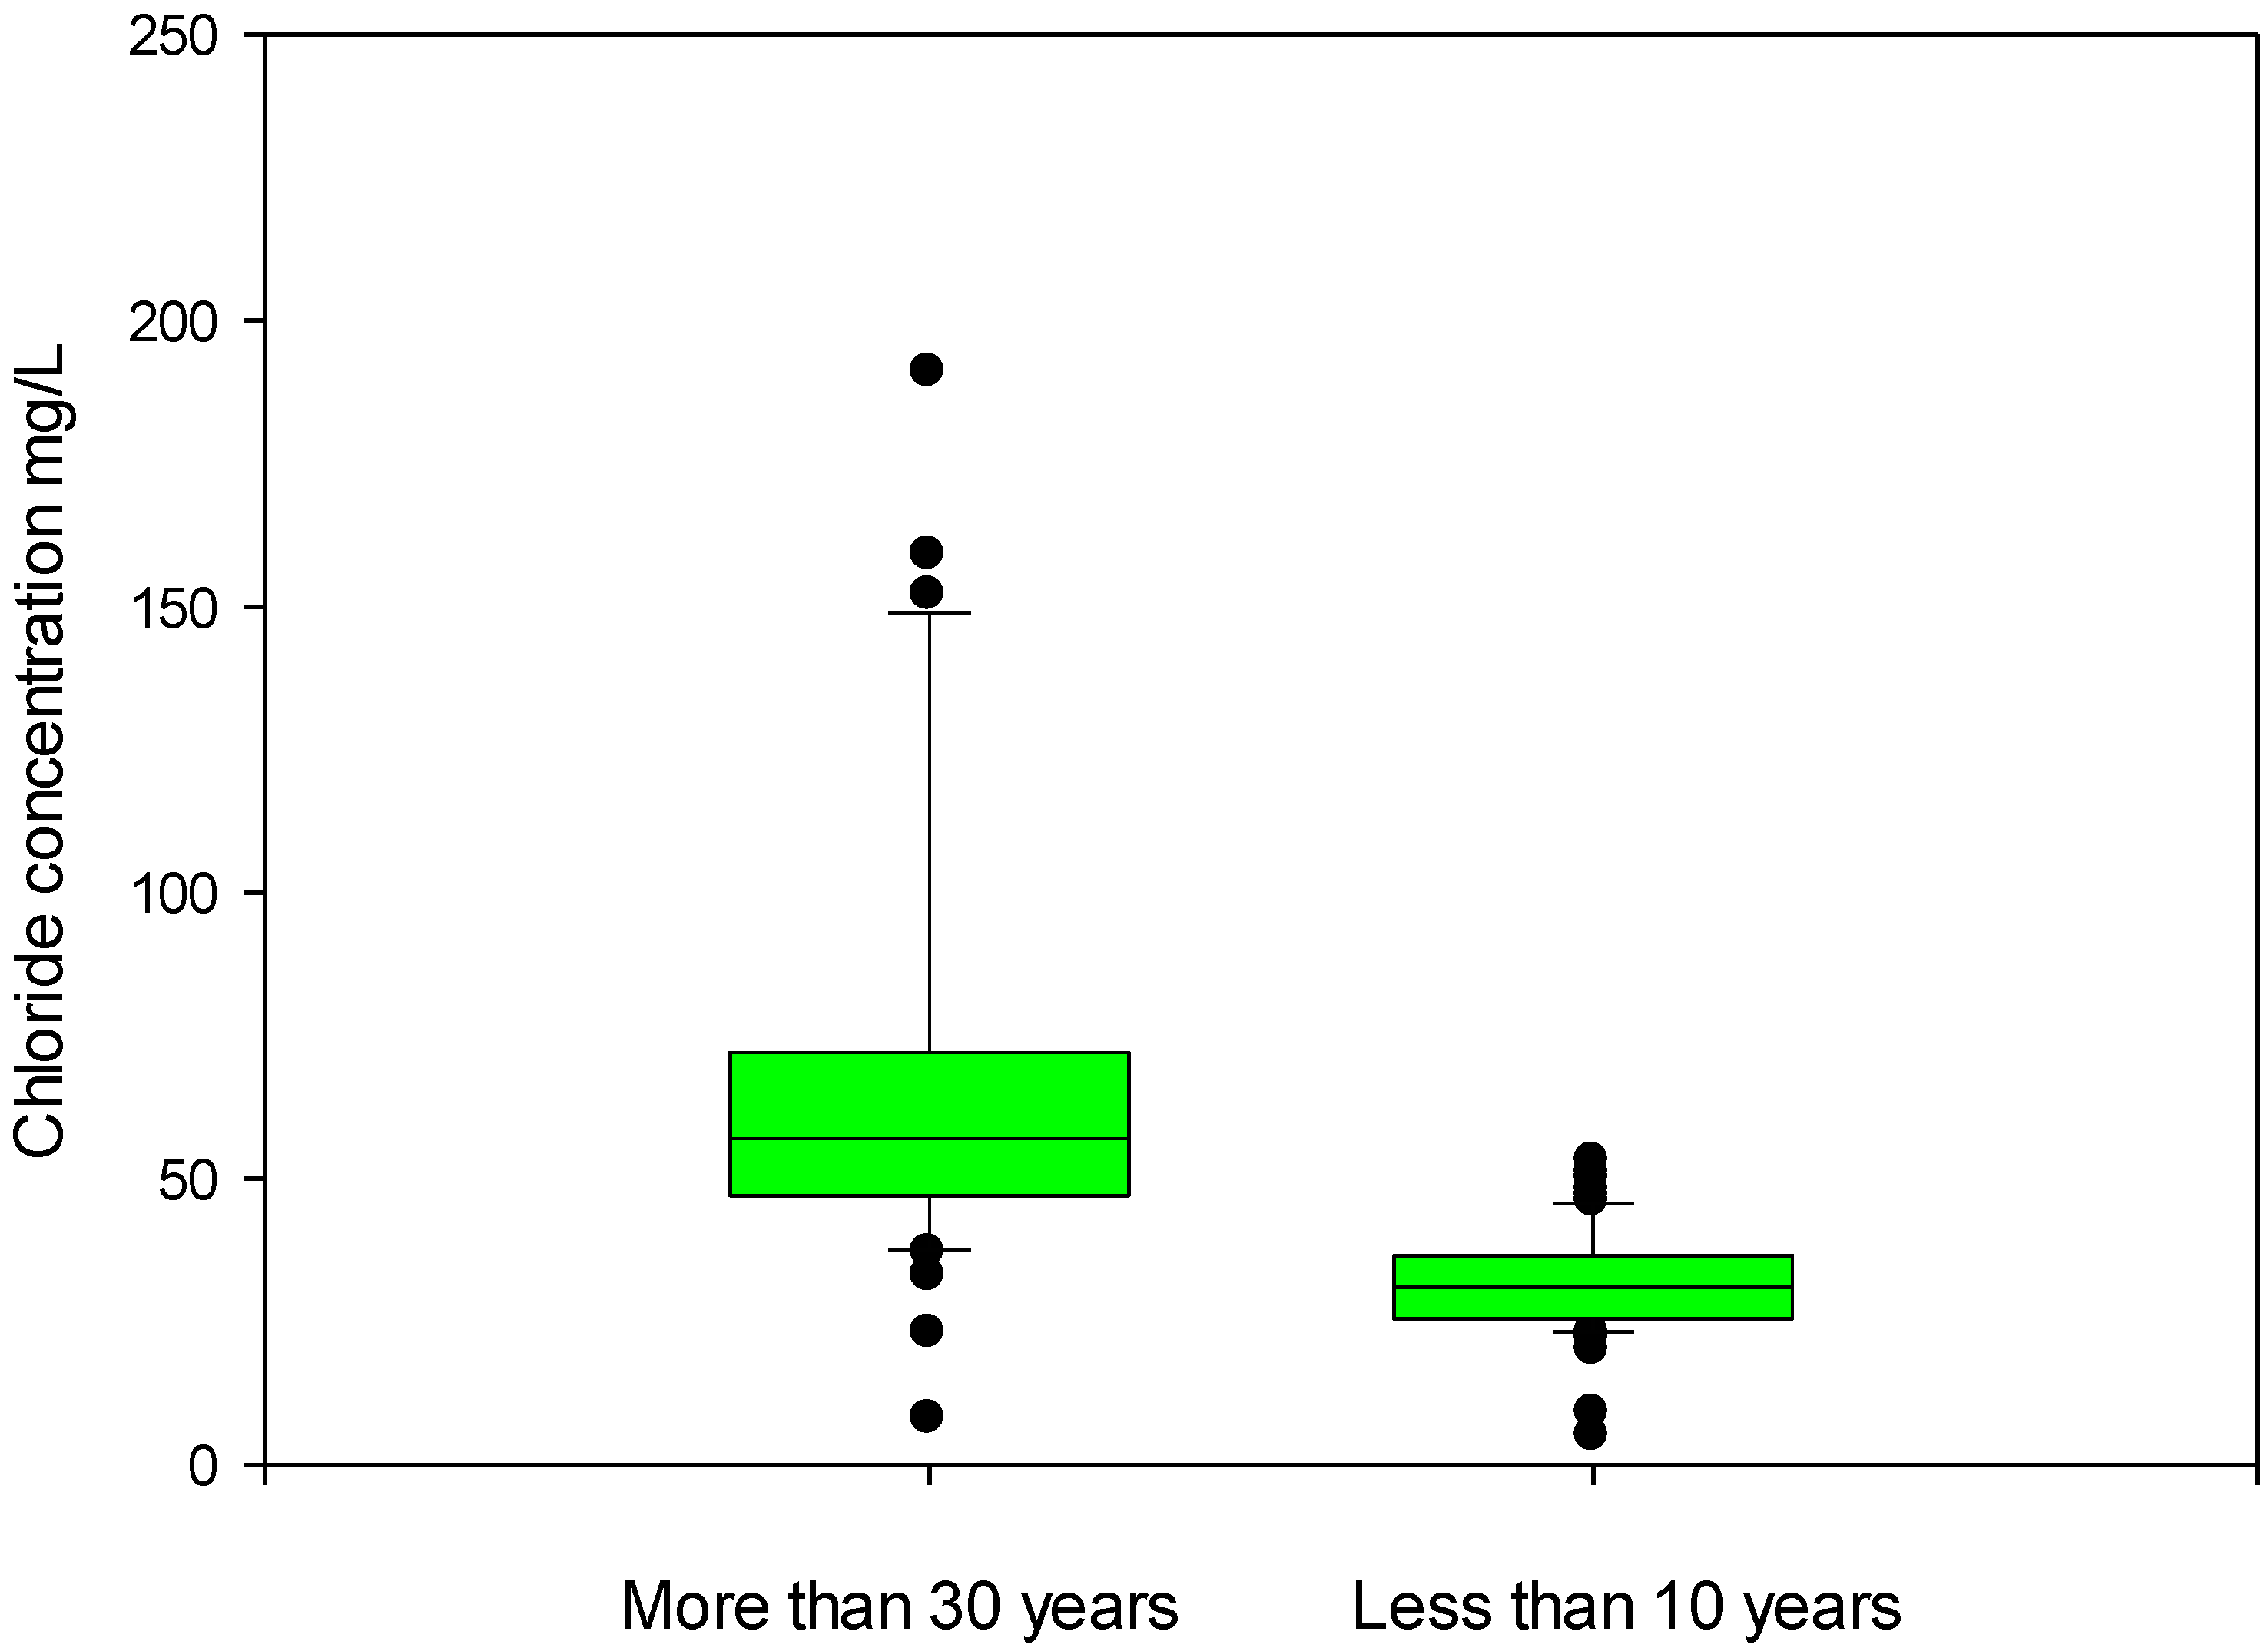
| Chlorides | APAT CNR IRSA 4020 MAN 29/2003 | (mg/L) | 52.68 | 37 | 250 |
| Fluorides | APAT CNR-IRSA 4020 MAN 29/2003 | (mg/L) | 0.14 | 2.02 | 1.50 |
| Nitrates | APAT CNR IRSA 4020 MAN 29/2003 | (mg/L) | 10 | 2.2 | 50 |
| Nitrites | APAT CNR IRSA 4020 MAN 29/2003 | (mg/L) | <0.02 | - | 0.50 |
| Al | APAT CNR IRSA 3050 MAN 29/2003 | (µg/L) | 4 | 2.1 | 200 |
| As | APAT CNR IRSA 3080 MAN 29/2003 | (µg/L) | <1 | - | 10 |
| Cd | APAT CNR-IRSA 3120 MAN 29/2003 | (µg/L) | 2.2 | 0.3 | 5.0 |
| Cr | APAT CNR-IRSA 3150 MAN 29/2003 | (µg/L) | <1 | - | 50 |
| Cu | APAT CNR-IRSA 3250 MAN 29/2003 | (mg/L) | 0.01 | 0.8 | 1 |
| Fe | APAT CNR IRSA 3160 MAN 29/2003 | (µg/L) | 3 | 0.8 | 200 |
| Mn | APAT CNR IRSA 3190 MAN 29/2003 | (µg/L) | 1 | 0.1 | 50 |
| Na | potentiometric | (mg/L) | 15 | 2.4 | 200 |
| Pb | APAT CNR-IRSA 3230 MAN 29/2003 | (µg/L) | <1 | - | 10 |
| Benzene | EPA-S021B | (µg/L) | <0.01 | - | 1.0 |
| Epichlorohydrin | EPA-S260 B/96 | (µg/L) | <0.01 | - | 0.1 |
| THMs | EPA-S260 B/96 | (µg/L) | <0.01 | - | 30 |


4. Conclusions
Acknowledgments
Conflicts of Interest
References
- Bates, A.J. Water as consumed and its impact on the consumer—Do we understand the variables? Food Chem. Toxicol. 2000, 38, S29–S36. [Google Scholar] [CrossRef]
- Leclerc, H.; Schwartzbrod, L.; Dei-Cas, E. Microbial agents associated with waterborne diseases. Crit. Rev. Microbiol. 2002, 28, 371–409. [Google Scholar] [CrossRef]
- Theron, J.; Cloete, T.E. Emerging waterborne infections: Contributing factors, agents, and detection tools. Crit. Rev. Microbiol. 2002, 28, 1–26. [Google Scholar] [CrossRef]
- Payment, P. Health Effects of Water Consumption and Water Quality. In Handbook of Water and Wastewater Microbiology; Academic Press: San Diego, CA, USA, 2003; pp. 209–219. [Google Scholar]
- NRC (National Research Council). Drinking Water Distribution Systems: Assessing and Reducing Risks; The National Academies Press: Washington, DC, USA, 2006. [Google Scholar]
- Kirmeyer, G.J.; Friedman, M.; Martel, K.; Howie, D.; LeChevallier, M.; Abbaszadegan, M.; Karim, M.; Funk, J.; Harbour, J. Pathogen Intrusion into the Distribution System; American Water Works Association Research Foundation: Denver, CO, USA, 2001. [Google Scholar]
- Yoshida, T.; Yamauchi, H.; Sun, G.F. Chronic health effects in people exposed to arsenic via the drinking water: Dose–response relationships in review. Toxicol. Appl. Pharmacol. 2004, 198, 243–252. [Google Scholar] [CrossRef]
- De Roda Husman, A.M.; Bartram, J. Chapter 7 global supply of virus-safe drinking water. Perspect. Med. Virol. 2007, 17, 127–162. [Google Scholar] [CrossRef]
- Berger, P.S.; Clark, R.M.; Reasoner, D.J.; Rice, E.W.; Santo Domingo, J.W. (US EPA) Water, Drinking. In Encyclopedia of Microbiology, 3rd ed.; Elsevier Ltd.: San Diego, CA, USA, 2009; ISBN: 978-0-12-373944-5. [Google Scholar]
- Iannece, P.; Motta, O.; Tedesco, R.; Carotenuto, M.; Proto, A. Determination of perchlorate in bottled water from Italy. Water 2013, 5, 767–779. [Google Scholar] [CrossRef]
- Bennett, G.F. Risk Assessment for Chemicals in Drinking Water; Howd, R.A., Fan, A.M., Eds.; Wiley Interscience, JohnWiley and Sons: Hoboken, NY, USA, 2008; ISBN: 978-0-471-72344-8. [Google Scholar]
- Hall, M.; Chen, Y.; Ahsan, H.; Slavkovich, V.; van Geen, A.; Parvez, F.; Graziano, J. Blood arsenic as a biomarker of arsenic exposure: Results from a prospective study. Toxicology 2006, 225, 225–233. [Google Scholar] [CrossRef]
- Nriagu, J.O.; Bhattacharya, P.; Mukherjee, A.B.; Bundschuh, J.; Zevenhoven, R.; Loeppert, R.H. Arsenic in soil and groundwater: An overview. Trace Met. Contam. Environ. 2007, 9, 3–60. [Google Scholar]
- Lindberg, A.L.; Rahman, M.; Persson, L.Å.; Vahter, M. The risk of arsenic induced skin lesions in Bangladeshi men and women is affected by arsenic metabolism and the age at first exposure. Toxicol. Appl. Pharmacol. 2008, 230, 9–16. [Google Scholar] [CrossRef]
- Kazia, T.G.; Araina, M.B.; Baiga, J.A.; Jamalia, M.K.; Afridia, H.I.; Jalbanib, N.T.; Sarfraza, R.A.; Qadir Shaha, A.; Niaza, A. The correlation of arsenic levels in drinking water with the biological samples of skin disorders. Sci. Total Environ. 2009, 407, 1019–1026. [Google Scholar]
- Kwok, R.K. A review and rationale for studying the cardiovascular effects of drinking water arsenic in women of reproductive age. Toxicol. Appl. Pharmacol. 2007, 222, 344–350. [Google Scholar] [CrossRef]
- Attuazione della direttiva 98/83/CE relativa alla qualità delle acque destinate al consumo umano. Decreto Legislativo 2 febbraio 2001, No. 31. In Gazzetta Ufficiale; No. 52; Istituto Poligrafico e Zecca dello Stato S.p.A.: Roma, Italy, 3 March 2001.
- Belli, M.; Centioli, D.; de Zorzi, P.; Sansone, U.; Capri, S.; Pagnotta, R.; Pettine, M. Metodi analitici per le acque. In Manuali e Linee Guida dell’ Agenzia per la Protezione dell’Ambiente e per i Servizi Tecnici (APAT); Rapporti 29/2993; I.G.E.R. srl: Roma, Italy, 2004. [Google Scholar]
- Kay, D.; Fleisher, J.M.; Salmon, R.L.; Jones, F.; Wyer, M.; Godfree, A.; Zelenauch-Jacquotte, Z.; Shore, R. Predicting likelihood of gastroenteritis from sea bathing: Results from randomized exposure. Lancet 1994, 344, 904–909. [Google Scholar]
- Bonde, G.J. Bacteriological methods for estimation of water pollution. Health Lab. Sci. 1966, 3, 124–128. [Google Scholar]
- Pruss, A. Review of epidemiological studies on health effects from exposure to recreational water. Int. J. Epidemiol. 1998, 27, 1–9. [Google Scholar] [CrossRef]
- Elmund, G.K.; Allen, M.J.; Rice, E.W. Comparison of Escherichia coli, total coliform, and fecal coliform populations as indicators of wastewater treatment efficiency. Water Environ. Res. 1999, 71, 332–339. [Google Scholar] [CrossRef]
- US-Environmental Protection Agency. Bacterial Water Quality Standards for Recreational Waters (Freshwater and Marine Water); Office of Water: Washington, DC, USA, 2003.
- World Health Organization. Heterotrophic Plate Counts and Drinking-water Safety: The Significance of HPCs for Water Quality and Human Health; Bartram, J., Cotruvo, J., Exner, M., Fricker, C., Glasmacher, A., Eds.; WHO: Geneva, Swedish; IWA Publishing: London, UK, 2003. [Google Scholar]
© 2014 by the authors; licensee MDPI, Basel, Switzerland. This article is an open access article distributed under the terms and conditions of the Creative Commons Attribution license (http://creativecommons.org/licenses/by/3.0/).
Share and Cite
Proto, A.; Zarrella, I.; Capacchione, C.; Motta, O. One-Year Surveillance of the Chemical and Microbial Quality of Drinking Water Shuttled to the Eolian Islands. Water 2014, 6, 139-149. https://doi.org/10.3390/w6010139
Proto A, Zarrella I, Capacchione C, Motta O. One-Year Surveillance of the Chemical and Microbial Quality of Drinking Water Shuttled to the Eolian Islands. Water. 2014; 6(1):139-149. https://doi.org/10.3390/w6010139
Chicago/Turabian StyleProto, Antonio, Ilaria Zarrella, Carmine Capacchione, and Oriana Motta. 2014. "One-Year Surveillance of the Chemical and Microbial Quality of Drinking Water Shuttled to the Eolian Islands" Water 6, no. 1: 139-149. https://doi.org/10.3390/w6010139