1. Introduction
An adequate water supply and an appropriate water quality level are key elements in the good health and well-being of humans and ecosystems, and in social and economic development. Water quality is becoming a global concern as a result of the significant role that it plays in economic and social development. The degradation of water translates directly into social and economic impacts and the deterioration of the environment. Even though there have been successes on the local scale in the improvement of water quality, no data suggests that an overall improvement on a global scale has been achieved [
1].
The environmental impacts associated with land use change have been widely researched and range from changes in atmospheric composition to the extensive modification of ecosystems. Land cover changes could affect regional climates by altering the surface energy and water balances. Furthermore, human activities have transformed the hydrological cycle by providing freshwater for irrigation and for industrial and domestic consumption.
Anthropogenic factors have also increased the nutrient loading within water bodies and have caused an overall degradation in the quality of water in freshwater ecosystems, as well as in coastal ecosystems. The changes in land use have been associated with the loss of biodiversity through the modification, fragmentation or loss of habitats, the degradation of the soil and water resources, and the overexploitation of endemic or native species. Anthropogenic activities account for approximately one-third to one-half of the global ecosystem production, and with the continued demands made on the environment by the population and development, even more pressure will be brought to bear on the biosphere [
2,
3,
4,
5,
6]. Most water pollution issues have been caused by population pressure and intensified economic activity in sub-basins which, in their turn, have resulted in alterations to the land use patterns [
7,
8,
9].
A study completed by Tong and Chen (2002) concluded that most water quality properties correlate with land use types. Other research studies have also provided evidence of a strong relationship between land use type and the water quality characteristics in a catchment area [
7,
10].
Most studies have focused on the relationship between land use and water quality within different regions or catchments across the world [
7,
8]. The relationships between different water quality parameters and land cover or land use change have therefore been extensively researched. Consequently, studies have progressed from merely identifying relationships to predicting future water quality in relation to land cover change or determining and comparing the accuracy or uncertainty of various river water quality modeling techniques such as the Partial Least Squares (PLS) Regression model [
11,
12,
13,
14].
This study has consequently focused upon the quantification of these relationships between selected water quality parameters and land cover change with the application of the PLS regression model to formulate model equations for the prediction of water quality. This study, therefore, puts forward a practical application of these formulated model equations for the prediction of water quality within a specific catchment. It presents the importance of the formulation of PLS model equations to promote informed and accurate decision making within the water management sector but also presents a practical application of these within a catchment which has been plagued by immense land cover or land use change which has been accompanied with poor and uninformed decision-making processes.
2. Study Area
South Africa is deemed to be a semi-arid country due to the scarcity of its water resources. The country has been included in the worldwide trend of inefficient management of water, which has been accompanied with an overall deterioration in the quality of water. This downward trend of water quality still persists even though water is described as a vital resource in maintaining life and sustaining agriculture, manufacturing, transportation and other economic activities, and it is consequently the most poorly managed resource in the world [
15,
16,
17,
18,
19,
20].
The current and anticipated future growth rates of the population and trends in future socio-economic development indicate that South Africa’s freshwater resources will be unable to sustain the current patterns of water use and discharge. South Africa could experience a water crisis in the not-too-distant future if the situation is not addressed properly. At present, multiple water management areas are experiencing a water deficit. The natural ecosystems, as well as the region’s and the country’s freshwater resources, are put under immense pressure by various sectors and users, which lead to the overall deterioration of water resources [
21].
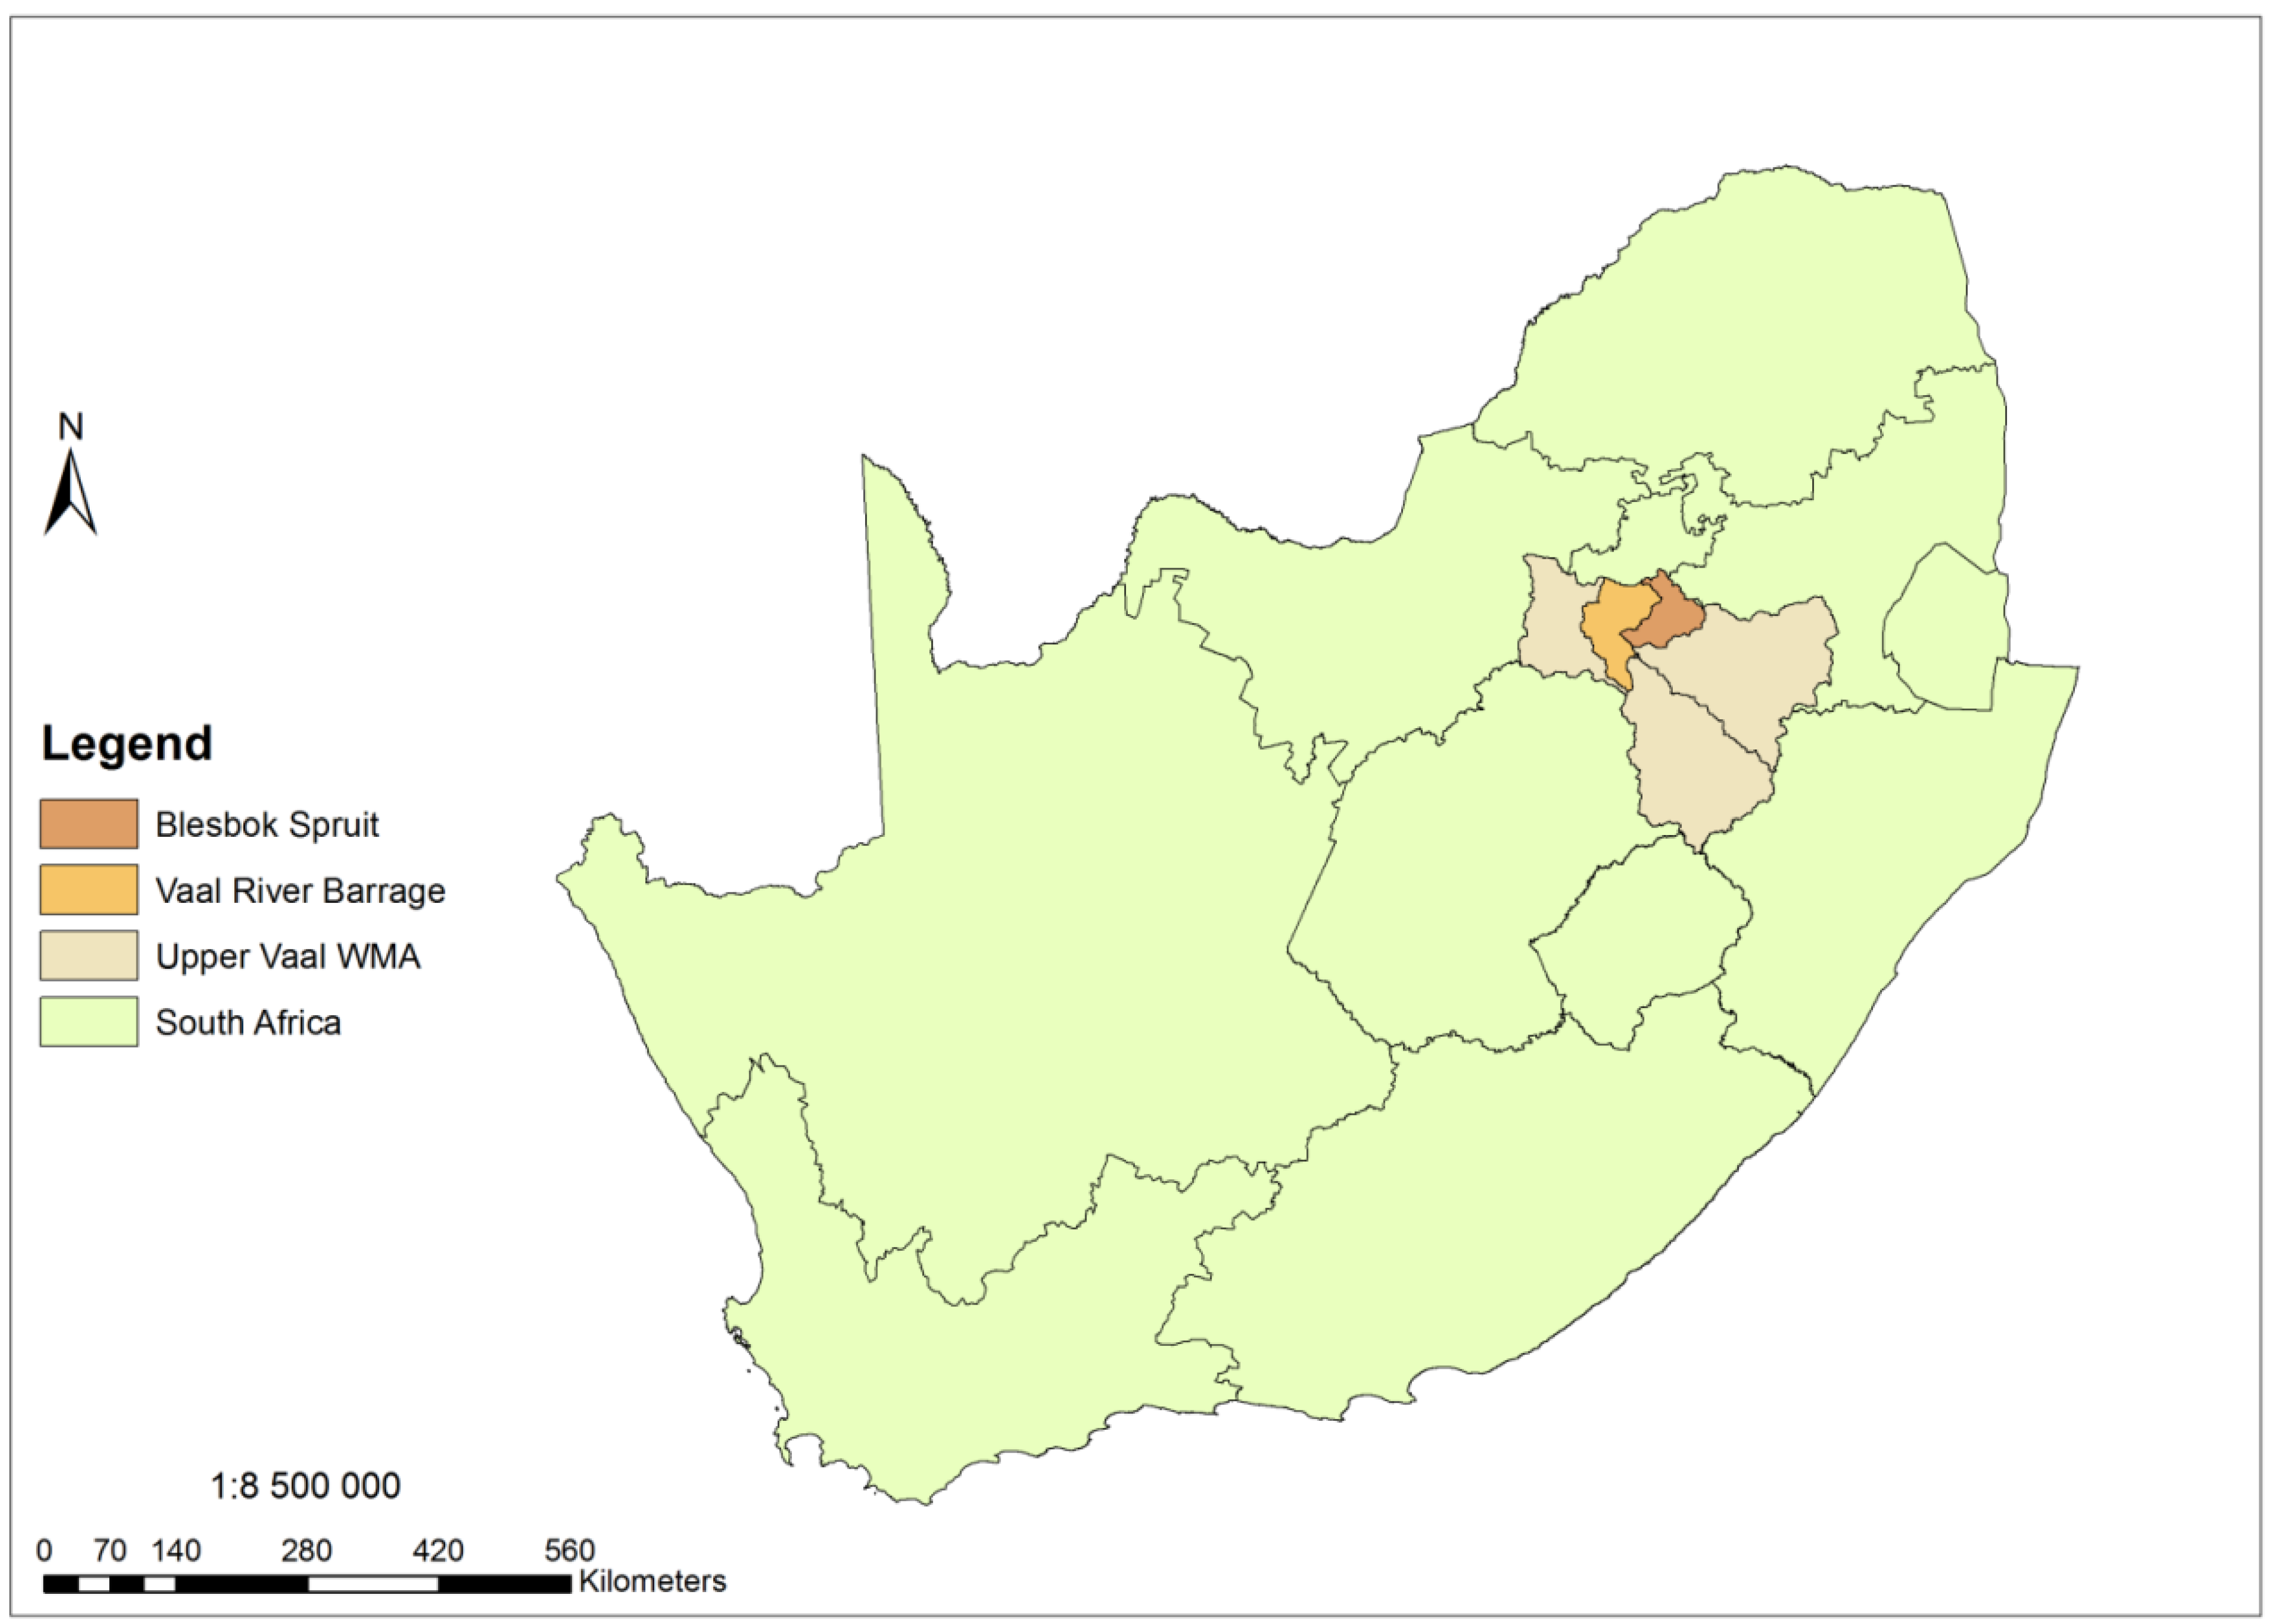
The Blesbok Spruit catchment, which is the main focus of this research paper, is located in the eastern region of the Gauteng Province, South Africa, within the Upper Vaal Water Management Area (WMA) which is one of the nineteen water management areas that have been identified in the National Water Resource Strategy of South Africa. More specifically, the Blesbok Spruit catchment forms part of the Vaal River Barrage secondary catchment as illustrated in
Figure 1. The Gauteng region is known for being the most densely populated province in South Africa and characterized by dense urban areas as well as high levels of industrial and mining activity [
22].
The Blesbok Spruit catchment contains the Gauteng province’s major wetland system which has an area of approximately 1858 km
2, extends 21 km along the Blesbok Spruit, is known to support 250 species of birds and is a habitat to many species of fauna and flora which form an integral part of the ecosystem. The Blesbok Spruit wetland has been recognized as a wetland of international importance and consequently been given Ramsar status since 1986 [
22,
23,
24,
25]. The catchment is enclosed by large areas of formal and informal urban developments. Approximately 45% of the catchment is considered to be urbanised while the remainder constitutes of mining, industrial and agricultural activities.
The quality of the Blesbok Spruit catchment’s water resources has declined immensely due to discharge of mining effluent and sewage, as well as other pollution associated with the urbanization, industrial and agricultural growth over the past decades within the catchment. It was consequently put on the Montreaux Record in 1996 and is now characterized by poor water quality, a continuing decline of ecological health and a declining bird population [
22,
23,
24,
25]. The degradation of the Blesbok Spruit wetland in terms of its ecological health is of prime importance and needs to be deemed as significant as the wetland could aid in the destruction of coliform organisms and enhance the pollution assimilation capacities of urban drains but also contribute to the buffering capabilities of the catchment [
26]. Furthermore, the Blesbok Spruit catchment, which includes all of the associated ecological systems, is of prime importance as it has cumulative negative environmental impacts, has significant human health effects for the region as well as the other receiving catchments within the Upper Vaal WMA.
Figure 1.
Location of the Blesbok Spruit Catchment within South Africa.
Figure 1.
Location of the Blesbok Spruit Catchment within South Africa.
Due to the noted ecological importance as well as the large scale degradation of the Blesbok Spruit catchment, numerous scientific research have been conducted in an attempt to create an understanding of the extent of the degradation, the possible sources of pollution, impacts and consequences of the degradation of the catchment and lastly to develop effective management plans for the identified areas of concern. Previous research, which has been conducted within this catchment, includes specialized studies focused upon the effects of acid mine drainage on the upper reaches of the catchment [
27], the impacts of contaminated soils [
28], the extent associated impacts of the degradation of the catchment’s water resources [
29], and the development of possible strategies to reduce long term liabilities of the Grootvlei gold mine, which is one of the prime sources for the degradation of the Blesbok Spruit wetland and in turn the catchment [
30]. Furthermore, an assessment of the health-related microbiological water quality of the Blesbok Spruit has also been completed and it was established that the water is not suitable for drinking or domestic purposes and full contact recreation would pose infection to users [
31]. Lastly, focus is also placed on reviewing the current state of the Blesbok Spruit wetland in an attempt to have it removed from the Montreux Record and reinstated as a Ramsar wetland [
32].
The extent to which the water has worsened, as well as associated impacts of the degradation of the catchment’s water resources have been identified by previous research as point sources such as mine water decants which cause salinity problems, diffuse runoff from mining activities in the north of the catchment on the Witwatersrand, urban runoff from the large numbers of formal and informal settlements resulting in fecal contamination as well as high nutrients due to poor or failing waste infrastructure, discharges from industries such as South African Pulp and Paper Industries (SAPPI) and lastly return effluents from waste water treatment works and mine water decants [
27,
28,
29,
30,
31]. The consequences of the degradation include high salinity levels, the presence of metals such as arsenic and cyanide, diurnal temperature changes, microbial contamination (potential water borne diseases and high nutrients) and elevated water temperatures. The Department of Water Affairs has consequently rated the Blesbok Spruit River as a class D/E river which can be described as to be of a very poor standard [
27,
28].
The natural landscape of the Blesbok Spruit catchment has therefore been transformed and manipulated physically and chemically in order to meet society’s needs. The changes of land cover and land use have consequently been accompanied by various impacts on a specific region’s hydrological responses and ultimately its water resources [
33,
34,
35]. Increasing demands from society as well as economic pressures will be accompanied with further land cover changes within the region and contribute to severe future water availability and possibly water quality problems in the near future [
34,
35].
The predominant methodologies implemented by previous research have been a combination of qualitative and quantitative methods. Qualitative methods, which include literature and observations, were aimed at describing the current state of the catchment as well as the development of management plans to be implemented by authorities. Quantitative methods included basic descriptive statistics aimed at identifying temporal trends of water quality over short periods of time, and were used to identify possible pollution sources and areas of concern. Previous research have therefore merely focused upon the establishment of the current state of catchment, the establishment of possible pollution sources and consequences and lastly the development of management plans which can be implemented to promote sustainability within the catchment.
This research therefore proposed that the interactions between hydrological responses, in terms of water quality, and land use needs to be quantified in order for the catchment or region to improve upon its water resource planning and management through the application of PLS regression analysis and formulated model equations.
This research investigated the hydrological responses, more specifically in terms of water quality, in the case of land cover change within the Blesbok Spruit catchment due to its ecological importance but also for its definite widespread negative cumulative impacts on the environment and human health. Relationships and unique model equations were established, formulated and applied in a possible future land cover change scenario to predict the future water quality of the catchment, which has not been completed for the catchment by any previous research. The results can ultimately be used to determine what sustainable measures need to be taken in terms of land cover change to promote a more sustainable Blesbok Spruit catchment through improving its ecological state.
3. Materials and Methods
In order to establish the hydrological responses in terms of water quality in the case of land cover change, the research made use of rainfall, evaporation, water flow and water quality data for the period from July 2000 to June 2012 as well as land cover data for 1994, 2000, 2005 and 2009. The data in question were obtained from various sources.
3.1. Rainfall, Water Flow and Evaporation Data
The rainfall data were obtained from the South African Weather Service for the period from July 2000 to June 2012. Daily readings at 08:00 a.m. were used to calculate the average value for the month. The average monthly rainfall figures were obtained for each of the two weather stations. Sample stations which had long periods of no recorded data were excluded to ensure good quality data and sound results. Water flow, as well as evaporation data, were obtained from the Department of Water Affairs (DWA) for the period, July 2000 to June 2012. The daily average water flow rate in cubic meters per second was measured at all of the river water flow sample stations over this time period. Monthly water flow values were calculated for each the stations. Monthly evaporation values were calculated for the stations. Sample stations which had large data inconsistencies, as well as long time periods of no recorded data, were excluded in order to improve accuracy and the quality of the data.
3.2. Water Quality Data
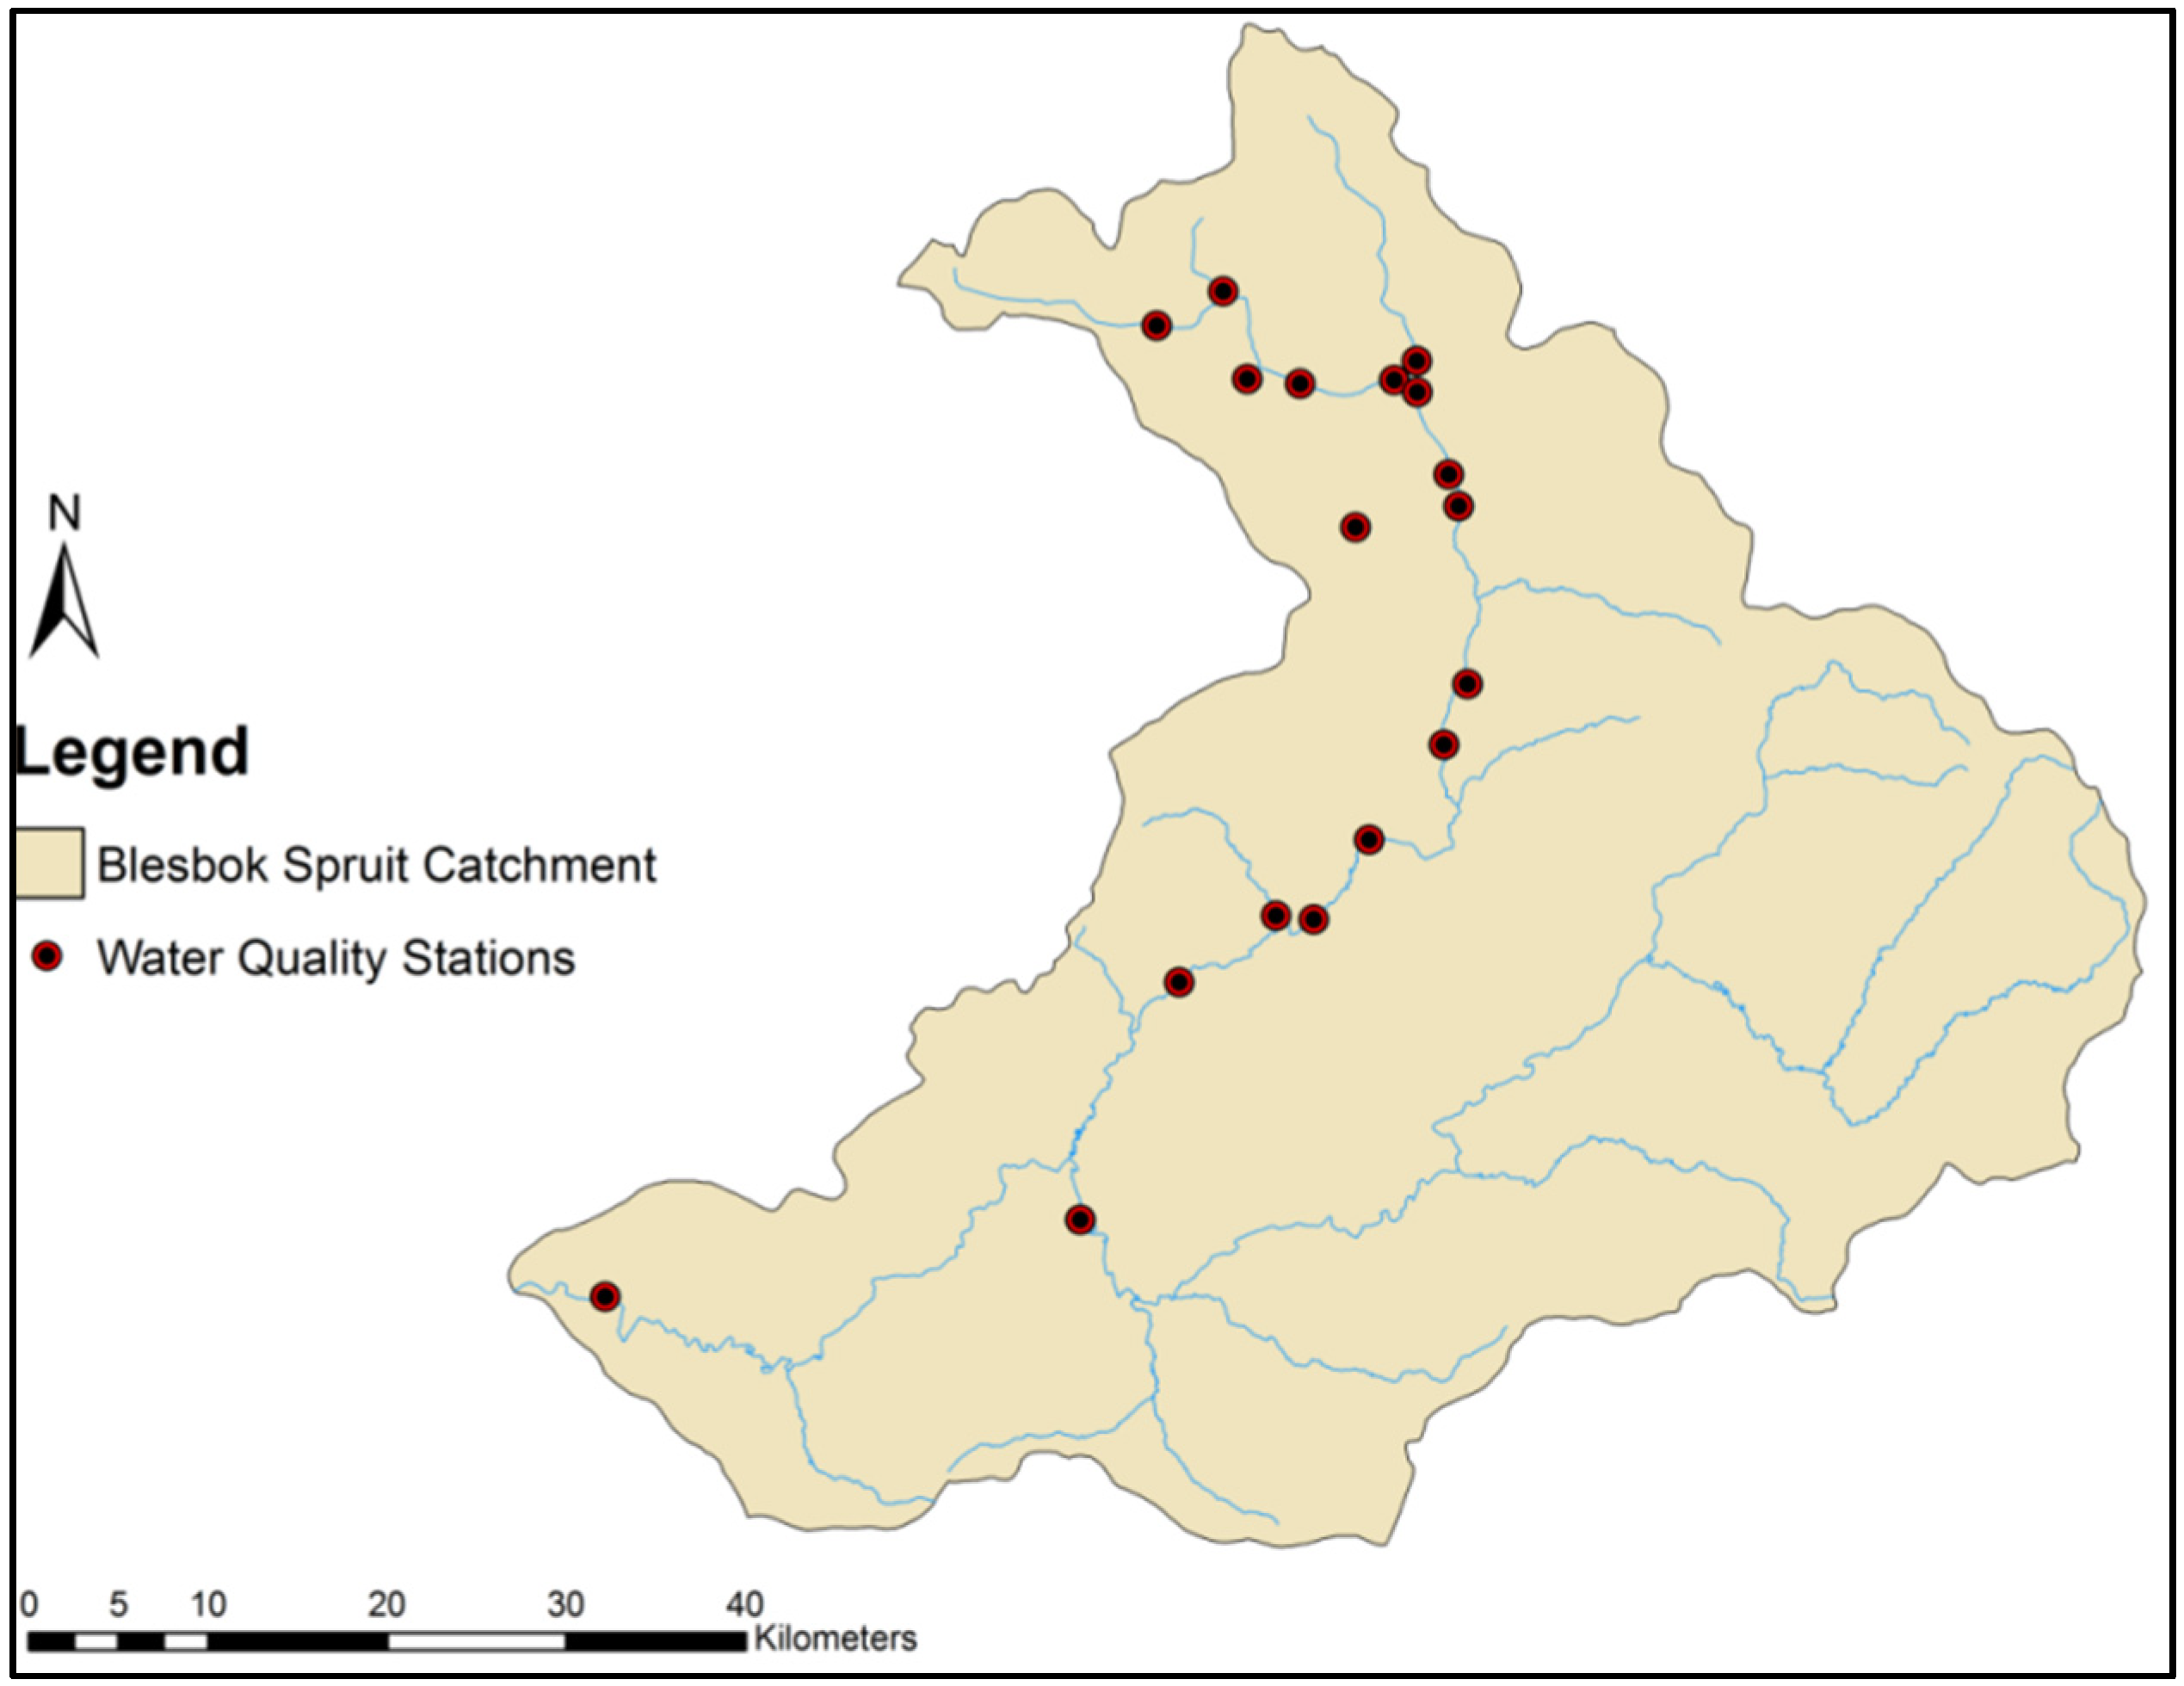
Water quality data were obtained from all of the available Rand Water (water services provider for the Upper Vaal WMA) at sample points situated in the Blesbok Spruit catchment for the period, July 2000 to June 2012. A total of 18 water quality sample stations, provided a complete dataset of water quality data and were consequently used for this research. The locations of these are set out in
Figure 2.
Figure 2.
All the available Rand Water quality sampling stations used within the Blesbok Spruit catchment.
Figure 2.
All the available Rand Water quality sampling stations used within the Blesbok Spruit catchment.
The water quality data obtained from these sampling points were measured monthly, weekly and, in some cases, daily, throughout the year, but at no scheduled time and on no fixed day or week. A monthly average was calculated for each of the water quality parameters used at each station.
Sampling stations that had inadequate data recordings were excluded from this research. Sampling stations were excluded in the case of the station having recorded less than four measurements within a year. Some water quality sampling stations were also not included in this research due the station having measured less than four parameters with less than four recorded measurements within a year. The “Four by Four” (4 × 4) rule was therefore followed as recommended by the Canadian Council of Ministers for the Environment. This rule ensures that only sampling stations that regularly monitor the relevant parameter are included and eliminates stations that have only three monitoring phases per year. This research was therefore limited to these sampling stations which had adequate replication in an attempt to ensure high quality data and representation within the Blesbok Spruit catchment.
A wide variety of water quality parameters was used in order to obtain a holistic and accurate view of a water body’s water quality in terms of environmental and human health [
36]. Water quality parameters to be used in this research were selected according to a selection process and were selected according to the following rules:
- (1)
The water quality parameter needs to have available national or regional water quality indices or guidelines;
- (2)
The water quality parameter must have been commonly measured and reported by the Rand Water water quality sampling stations within the Blesbok Spruit catchment;
- (3)
The water quality parameter needs to have a representation percentage of a minimum of 100%, 50% in the case of biological parameters, within the Blesbok Spruit catchment;
- (4)
Water quality parameters which are characterized by the occurrence or measurement of non-detectable values needs to be excluded due to the possibility of bias.
This research made use of relevant national and regional water quality standards and guidelines. The Vaal River Barrage in-stream water quality guidelines were predominantly used. In the event of a water quality parameter not having a regional standard, the appropriate South African national water quality standard was used and indicated accordingly. Water quality parameters were therefore excluded on the basis of the availability of international, national and regional guidelines.
Water quality parameters were further selected according to how commonly they have been measured or reported in the developed water quality database. A total of 47 water quality parameters were identified. Further refinement of the database was however needed in order to ensure that the selected parameters were adequately represented across the whole catchment [
36]. A minimum regional coverage for each parameter was consequently needed and chosen to refine the water quality database. This research required a parameter to be represented at 100% within the catchment to be included in the water quality database. Furthermore, due to the importance of biological parameters as indicators of environmental health and possible human health issues, this research chose a minimum regional coverage of 50%. The further refinement process reduced the amount of water quality parameters to a total of 24.
Lastly, water quality parameters were assessed and selected according to non-detects and zero values due to this possibly attributing to a bias in the equation [
36,
37]. Parameters that were characterized by non-detectable values due to concentrations within the water body being below the detection limit (either method or instrumental) were identified and excluded from the water quality database. The possibility of bias in terms of specific water quality parameters were therefore addressed with the exclusion of these from the water quality database.
Subsequently a total of 16 water quality parameters were identified, according to the described rules, for this research and include the following:
Physical parameters: pH and Electrical Conductivity (EC);
Chemical parameters: Alkalinity, calcium, chloride, sodium, magnesium, nitrate, sulfate, ammonia, phosphate and Chemical Oxygen Demand (COD);
Biological parameters: Chlorophyll a, Faecal coliform, Dissolved Oxygen (DO) and Dissolved Organic Carbon (DOC).
The relevant national and regional water quality standards and guidelines were applied in the establishment of water quality status of the Blesbok Spruit catchment. The following color classification was used according to the relevant water quality standards and catchment guidelines as shown in
Table 1.
Table 1.
Applied color classification of water quality standard.
Table 1.
Applied color classification of water quality standard.
| Water Quality Standard | Color Class |
|---|
| Ideal | Blue |
| Acceptable | Green |
| Tolerable | Yellow |
| Unacceptable | Red |
3.3. Land Cover Data
National land cover data were obtained from the Agricultural Research Center (ARC) for 1994, 2000, 2005, while land cover data for 2009 were obtained from the South African National Biodiversity Institute (SANBI) [
38,
39]. These land cover datasets were developed to establish the land cover for the whole of South Africa (no other datasets are available) and were consequently used in order to establish land cover changes for the Blesbok Spruit catchment. The land cover data from 1994 was included in the research in order to obtain a baseline land cover characteristic for the catchment. Land cover data from 2000, 2005 and 2009 were used in the Partial Least Squares (PLS) correlation and regression analysis.
The national land cover data used the “Standard Land Cover Classification Scheme” as the reference system to compile a 49-class legend. This full classification scheme, is based on a hierarchical framework designed to suit the South African environment and incorporates known land cover types, which can be identified in a consistent and repetitive manner from high resolution satellite imagery such as LandSat TM and SPOT [
40].
In their turn, the class definitions ensured that the data were standardized, and that broad generic classes were subdivided into more specific user-defined subclasses. The classification used by the land cover data was designed to conform to internationally-accepted classification standards and conventions to ensure cross-border compatibility and integration with existing national and international land cover classification systems and datasets.
The classes based on these land cover datasets consists of Level I classes as defined within the “Standard Land Cover Classification”, and only a selected subset of Level II subclasses.
This research made use of the five class legend, used by the 2005 land cover dataset, in order to describe the land cover. The seven class legend for the land cover of 1994, 2000 and 2009 needed to be converted to the five class legend used for 2005 during the data analysis in order to obtain uniformity. The five land cover classes were based on the Level I and II classes and include the following:
The five class legend land cover was consequently used in order to establish the land cover change over the time period, to determine relationships between water quality and land cover. It is important to note that the “other” land cover class constitutes of natural, degraded and water bodies land cover classes. “Other” land cover is predominantly constituted of natural land cover followed by water bodies and degraded land cover classes.
Shortcomings were also identified regarding the use of national land cover data supplied by ARC and SANBI. These included possible inaccuracies as well as low spatial resolution or cell size regarding the 2005 land cover dataset. The accuracy of the land cover data could have been decreased due to the project being completed by multiple stakeholders. Over- or under-estimations of land cover or the inaccurate identification of land cover could therefore have taken place [
40,
41]. A logical error test was consequently completed through the completion of a sensitivity analysis between the datasets to establish whether significant errors were present. A sensitivity test was completed by ARC between 1994, 2000 and 2005. Consequently this research completed a sensitivity analysis regarding land cover classes between the 2005 and 2009 datasets. Very few errors were however identified through this testing process. Errors were corrected when necessary.
Mixed classes or classification structure is also a recognized limitation of land use data. Mixed classes or classification structure was not a limitation in this study due to the use of a hierarchical classification design namely the “Standard Land Cover Classification Scheme for Remote Sensing Applications in South Africa” as described previously [
40,
42,
43].
Lastly, these land cover datasets are but a single “snapshot” of a period in time. Owing to the dynamic nature of the land cover and land use, this issue also needs to be taken into account when identifying patterns and making conclusions. One should, therefore, look at all of the used datasets holistically to ensure objective and optimum results.
3.4. Data Analyses
The types of data analyses carried out on the data in question included the following. Temporal trend analyses and basic descriptive statistical analyses (data summaries) were completed on average monthly rainfall, water flow, evaporation and water quality data to identify significant variations and to identify possible relationships between all of the mentioned variables for the period of July 2000 to June 2012. Rainfall and evaporation data measured by the weather and evaporation sampling stations were correlated with water quality data from water quality stations located within close proximity thereof. Water flow data measured by the water flow sampling stations were correlated with water quality data measured by the water quality sampling stations located at the same location or downstream of the applicable water flow sampling station.
A temporal trend analysis was also completed between water quality and land cover for the periods of 2000, 2005 and 2009 upon which the PLS model equations are built on.
A multi-variate statistical analysis in the form of PLS correlation and regression analysis was completed between the selected water quality parameters and the five class legend land cover for the periods of 2000, 2005 and 2009. The PLS analysis is a proven effective variance-based structural equation model approach which is recommended for small sample sizes or in the case when the number of explanatory variables exceeds the number of observation and high level of multicollinearity [
44,
45]. The use of PLS is recommended as it addresses multi-variable problems such as the ill-effect of multiplex between variables in the case of predicting water quality [
45,
46,
47,
48].
The PLS model is constituted of a structural part which reflects relationships between latent variables and a measurement component which shows how they are related but also shows weight relations which can be used to estimate case values of latent variables [
49]. The crucial part of PLS analysis is the estimation of the weight relations. PLS uses a two-step estimation process to determine weights which are used to calculate this aggregation and are determined in a manner similar to principal-component analysis for reflective or regression analysis for formative indicators.
This is followed by inside approximation which determines improved case values as weighted average of neighboring latent variables (e.g., η'2' = w3η1' + w4ξ1' + w5ξ'2 + w6ξ'3). Due to PLS being a limited information approach, it has the advantage that it “involves no assumptions about the population or scale of measurement” [
50] (p. 443) and consequently works without distributional assumptions and with nominal, ordinal, and interval scaled variables. The possible problem of consistency is addressed by having a large number of indicators which consequently limits the influence of weights on the parameters of the path model [
51].
The application of the PLS analysis enabled the prediction of water quality according to land cover changes with the development of a PLS regression model and associated algorithm. PLS regression models therefore facilitated the establishment of unique equations for each water quality parameter at each water quality sampling station.
Average concentrations were calculated for each selected water quality parameter in terms of the period over which the land cover dataset was established. The average annual concentration levels of the water parameters of the studied region were therefore calculated for 2000, 2005 and 2009 (includes full seasonal year i.e., July 2000/2004/2008 to June 2001/2005/2009), and paired with the land cover class percentages for those same time periods. This was completed for each water quality sampling station.
A PLS correlation and regression analysis was completed between the percentage of each specific land cover class and the calculated concentration level of each of the selected water quality parameters at each water quality station for the years 2000, 2005 and 2009 in order to establish the respective relationships between the land cover classes and the selected water quality parameters.
An overall average was calculated with the use of all of the water quality sampling stations for each of the identified water quality parameters, for the years 2000, 2005 and 2009 to coincide with land cover data, in order to obtain a generalized water quality status as well as formulate a generalized model equation for the Blesbok Spruit catchment as a whole. PLS regression model equations were established to quantify the overall hydrological responses for each selected water quality parameter to land cover change and to predict the concentration levels of these parameters in the event of such change.
These model equations are consequently used to predict the specific concentration of all the identified water quality parameters according to the percentage land cover in the Blesbok Spruit catchment. A simulation was subsequently completed in order to quantify and predict concentrations of the selected water quality parameters in accordance with a possible land cover change scenario for the years 2015, 2020, 2030 and 2050.
It should be noted that these formulated model equations were based on only three periods (2000, 2005 and 2009) due to limited datasets. This is therefore an identified shortcoming which can be improved upon in future research upon the completion of the 2014 land cover dataset.
4. Results and Discussion
The water quality of the Blesbok Spruit catchment is of great concern in the light of the largely tolerable and unacceptable water quality standards. The quality of the water in this catchment has been hugely degraded and is poor since almost all of the water quality parameters have proved to be either tolerable or unacceptable in terms of the Vaal River Barrage in-stream water quality guidelines.
4.1. Water Quality
The water quality within the Blesbok Spruit catchment is of an inferior quality with the only water quality parameters that were accorded ideal or acceptable water quality ratings, being nitrate, pH and magnesium as shown in
Table 2. The catchment is, therefore, highly degraded in terms of the quality of its water so that the main problem areas need to be identified to bring about an improvement in the quality of the water in the region.
The presence of high levels of
Faecal coliform is an indication that the water body has been significantly exposed to waste and that high levels of various pathogens could be present in the water [
52].
Faecal coliform has various impacts on aquatic ecosystems. Human waste is the major cause of water pollution in southern Africa because it contains parasites and bacteria that can cause diseases [
53]. When human wastes are deposited in a water body, this leads to the enrichment of the nutrients in the water, the growth of algae and the stimulation of other aquatic biota. Plants use up most or all of the oxygen in the water and cause the fish in the aquatic ecosystem to die [
54]. Thus, this water quality parameter could also be associated with the eutrophication of the water body.
In the case of human health impacts,
Faecal coliform could cause diseases such as gastro-enteritis, cholera, salmonellosis, dysentery and typhoid fever. These diseases develop as a result of the presence of bacterial pathogens such as
Salmonella ssp.,
Shigella ssp. and
Vibrio Cholerae which are transmitted via the fecal/oral route through poorly treated or contaminated drinking water [
55,
56]. Thus,
Faecal coliform is used as an indication as to whether these bacterial pathogens are present in the water body [
56,
57,
58]. For the catchment to improve upon its sustainability or for it to limit further degradation of its water resources and the region as a whole, the main negative influences in terms of land cover need to be established.
Table 2.
The average concentration of the selected significant water quality parameters for the Blesbok Spruit catchment as well as their compliance to set water quality standards and guidelines.
Table 2.
The average concentration of the selected significant water quality parameters for the Blesbok Spruit catchment as well as their compliance to set water quality standards and guidelines.
| Water Quality Parameter | Blesbok Spruit |
|---|
| pH (pH units) | 7.86 |
| EC (mS/m) | 103.62 |
| Alkalinity (CaCO3 mg/L) 1 | 170.55 |
| Calcium (mg/L) | 78.32 |
| Chloride (mg/L) | 90.21 |
| Sodium (mg/L) | 85.38 |
| Magnesium (mg/L) | 28.09 |
| Nitrate (mg/L) | 0.92 |
| Sulfate (mg/L) | 235.30 |
| Ammonia (mg/L) | 1.00 |
| Phosphate (mg/L) | 0.52 |
| COD (mg/L) | 36.78 |
| Chlorophyll a (µg/L) | 29.28 |
| Faecal coliform (Counts/100 mL) | 9850.85 |
| DO (mg/L) | 5.11 |
| DOC (mg C/L) 2 | 10.37 |
4.2. Land Cover
Firstly, rainfall, evaporation and water flow data were included in the research as these variables may have influences on water quality. A Pearson correlation as well as a PLS correlation analysis was completed between these variables to determine the significance of their effects on water quality. The research established that the effects of rainfall, evaporation and water flow to be not of significance over the time period (p < 0.05; n = 132). The research subsequently concluded that land cover will have the most significant impact on water quality as it is the main determinant regarding the type and significance of the relationships and is consequently the main focus.
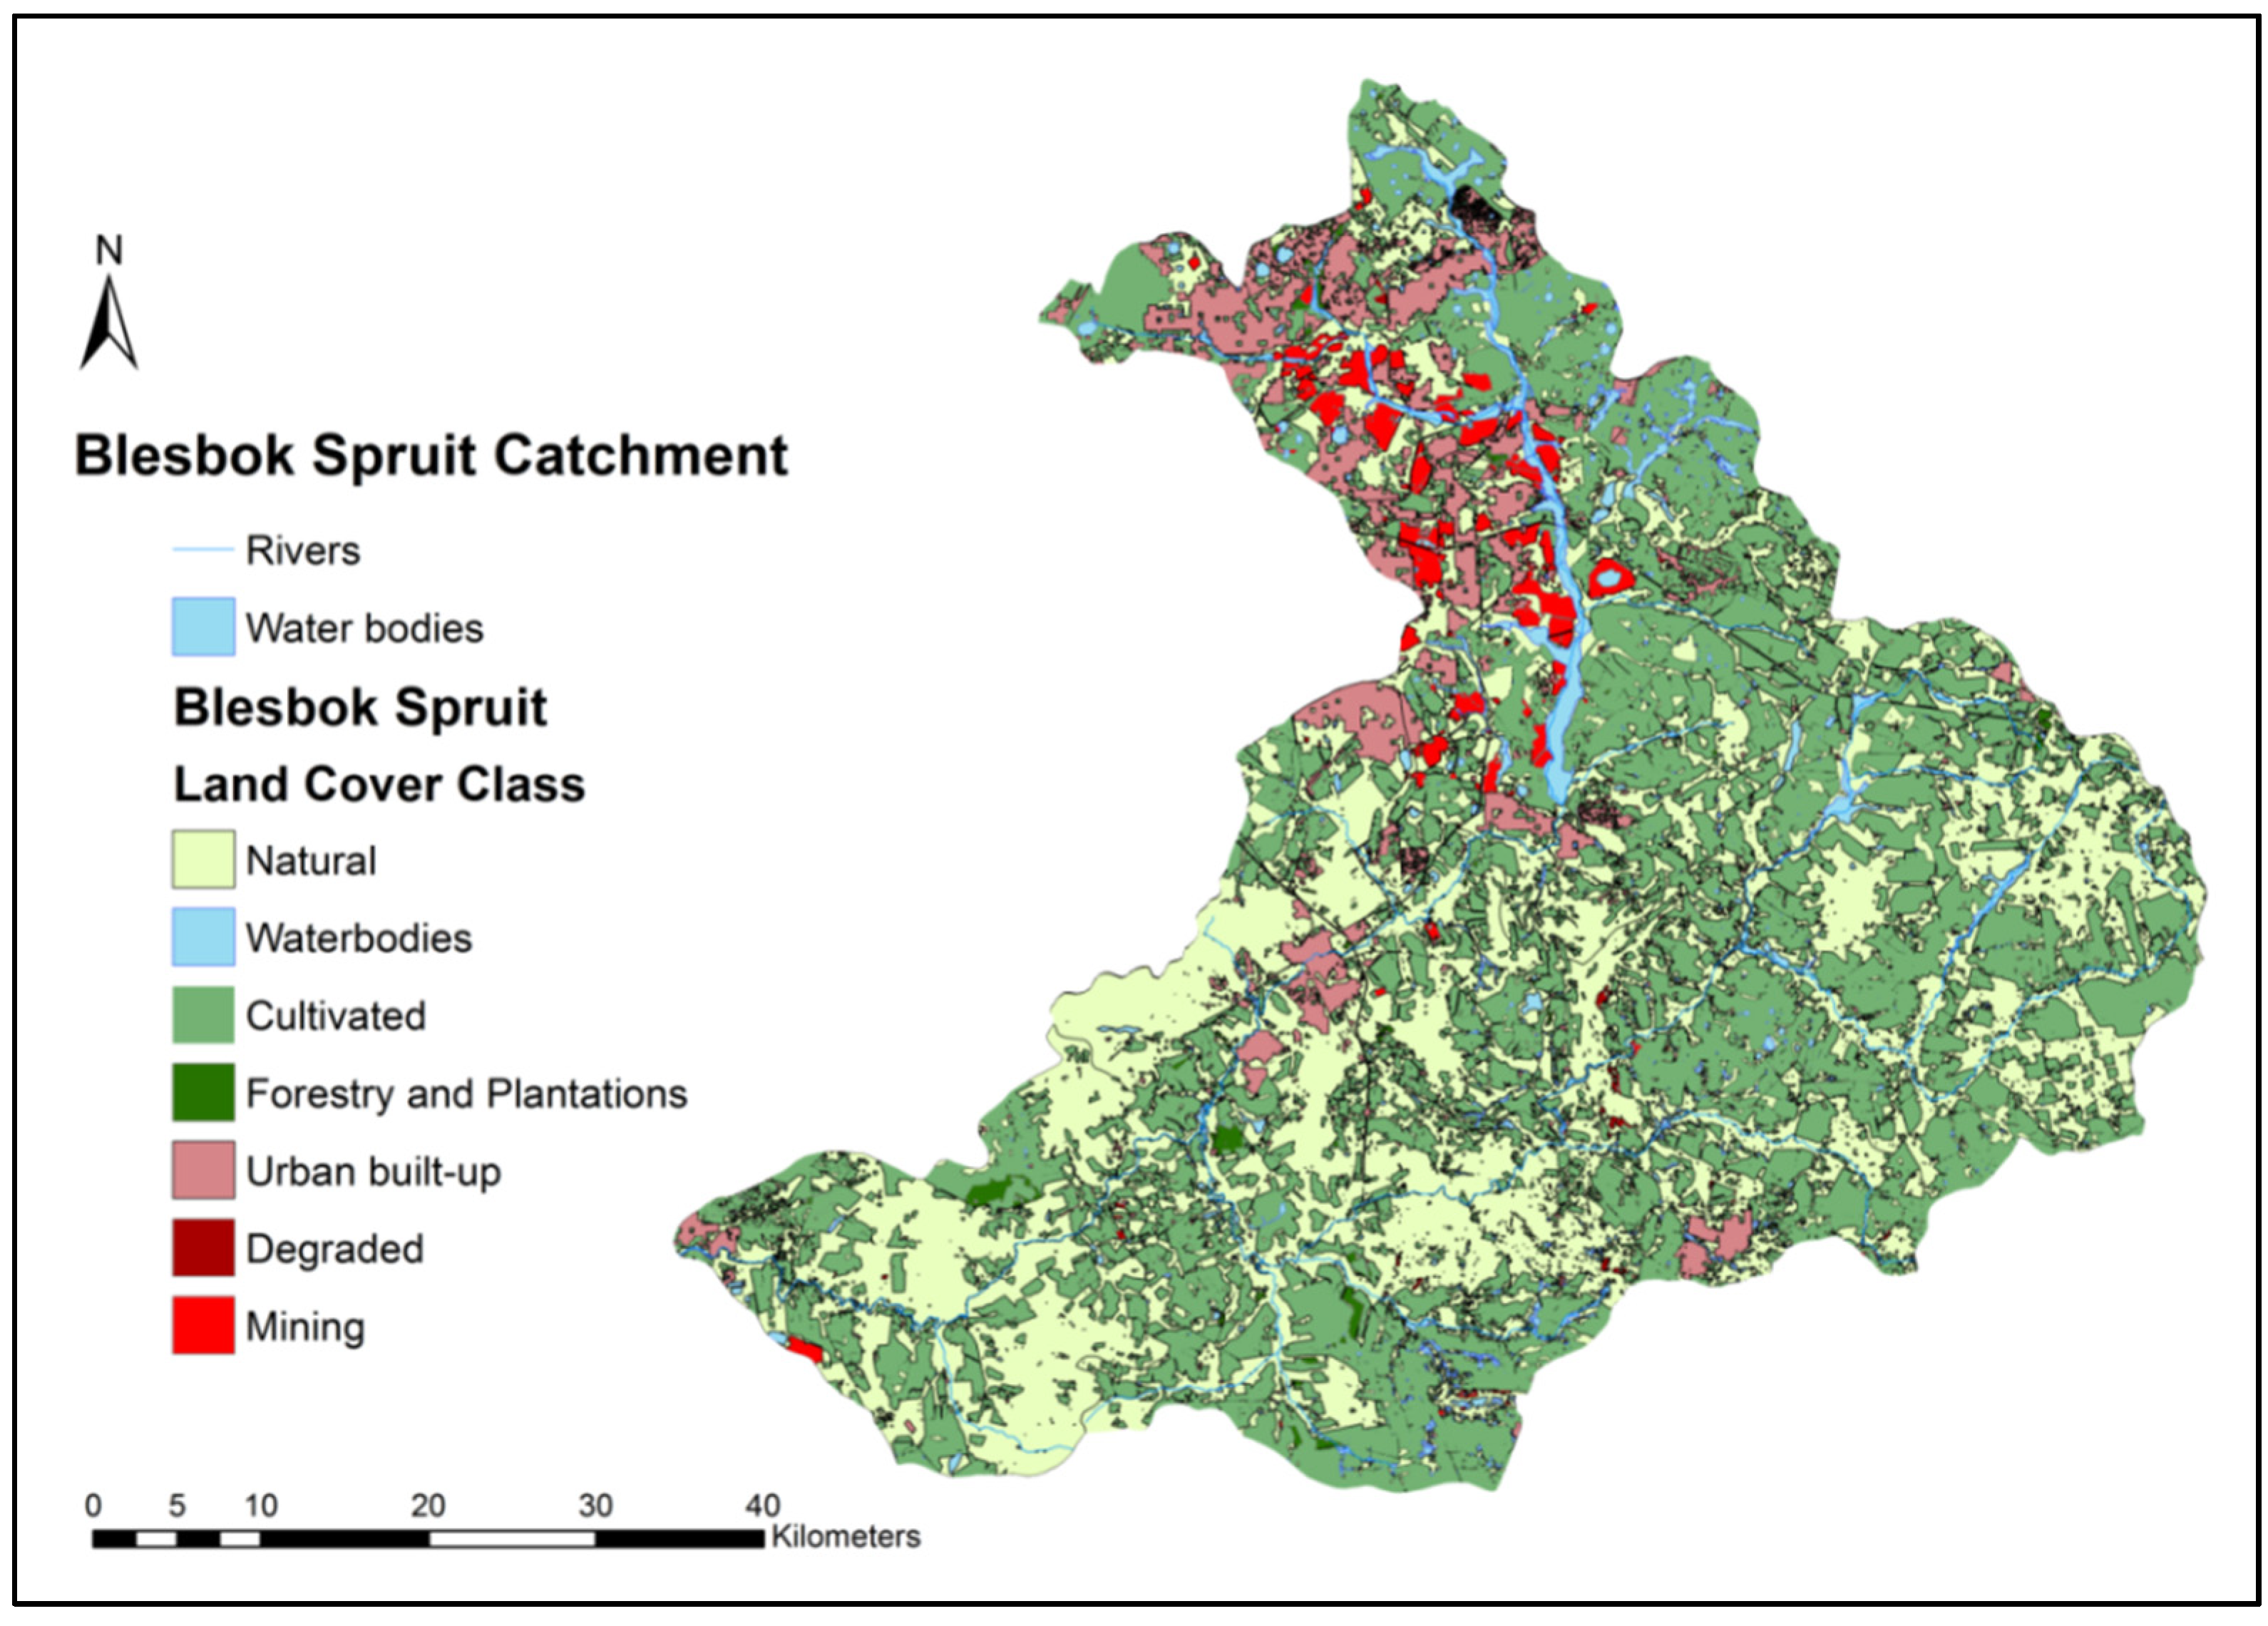
As indicated in
Figure 3, the cultivated land cover class constitutes 61.90% of the total area of the Blesbok Spruit catchment, followed by the urban build-up class, which makes up 19.55% of the area, and the “other” land cover category, occupying 15.19% of the area. Mining (2.49%), as well as forestry and plantations (0.86%) land cover areas, also constitute a portion of the total area of the Blesbok Spruit catchment.
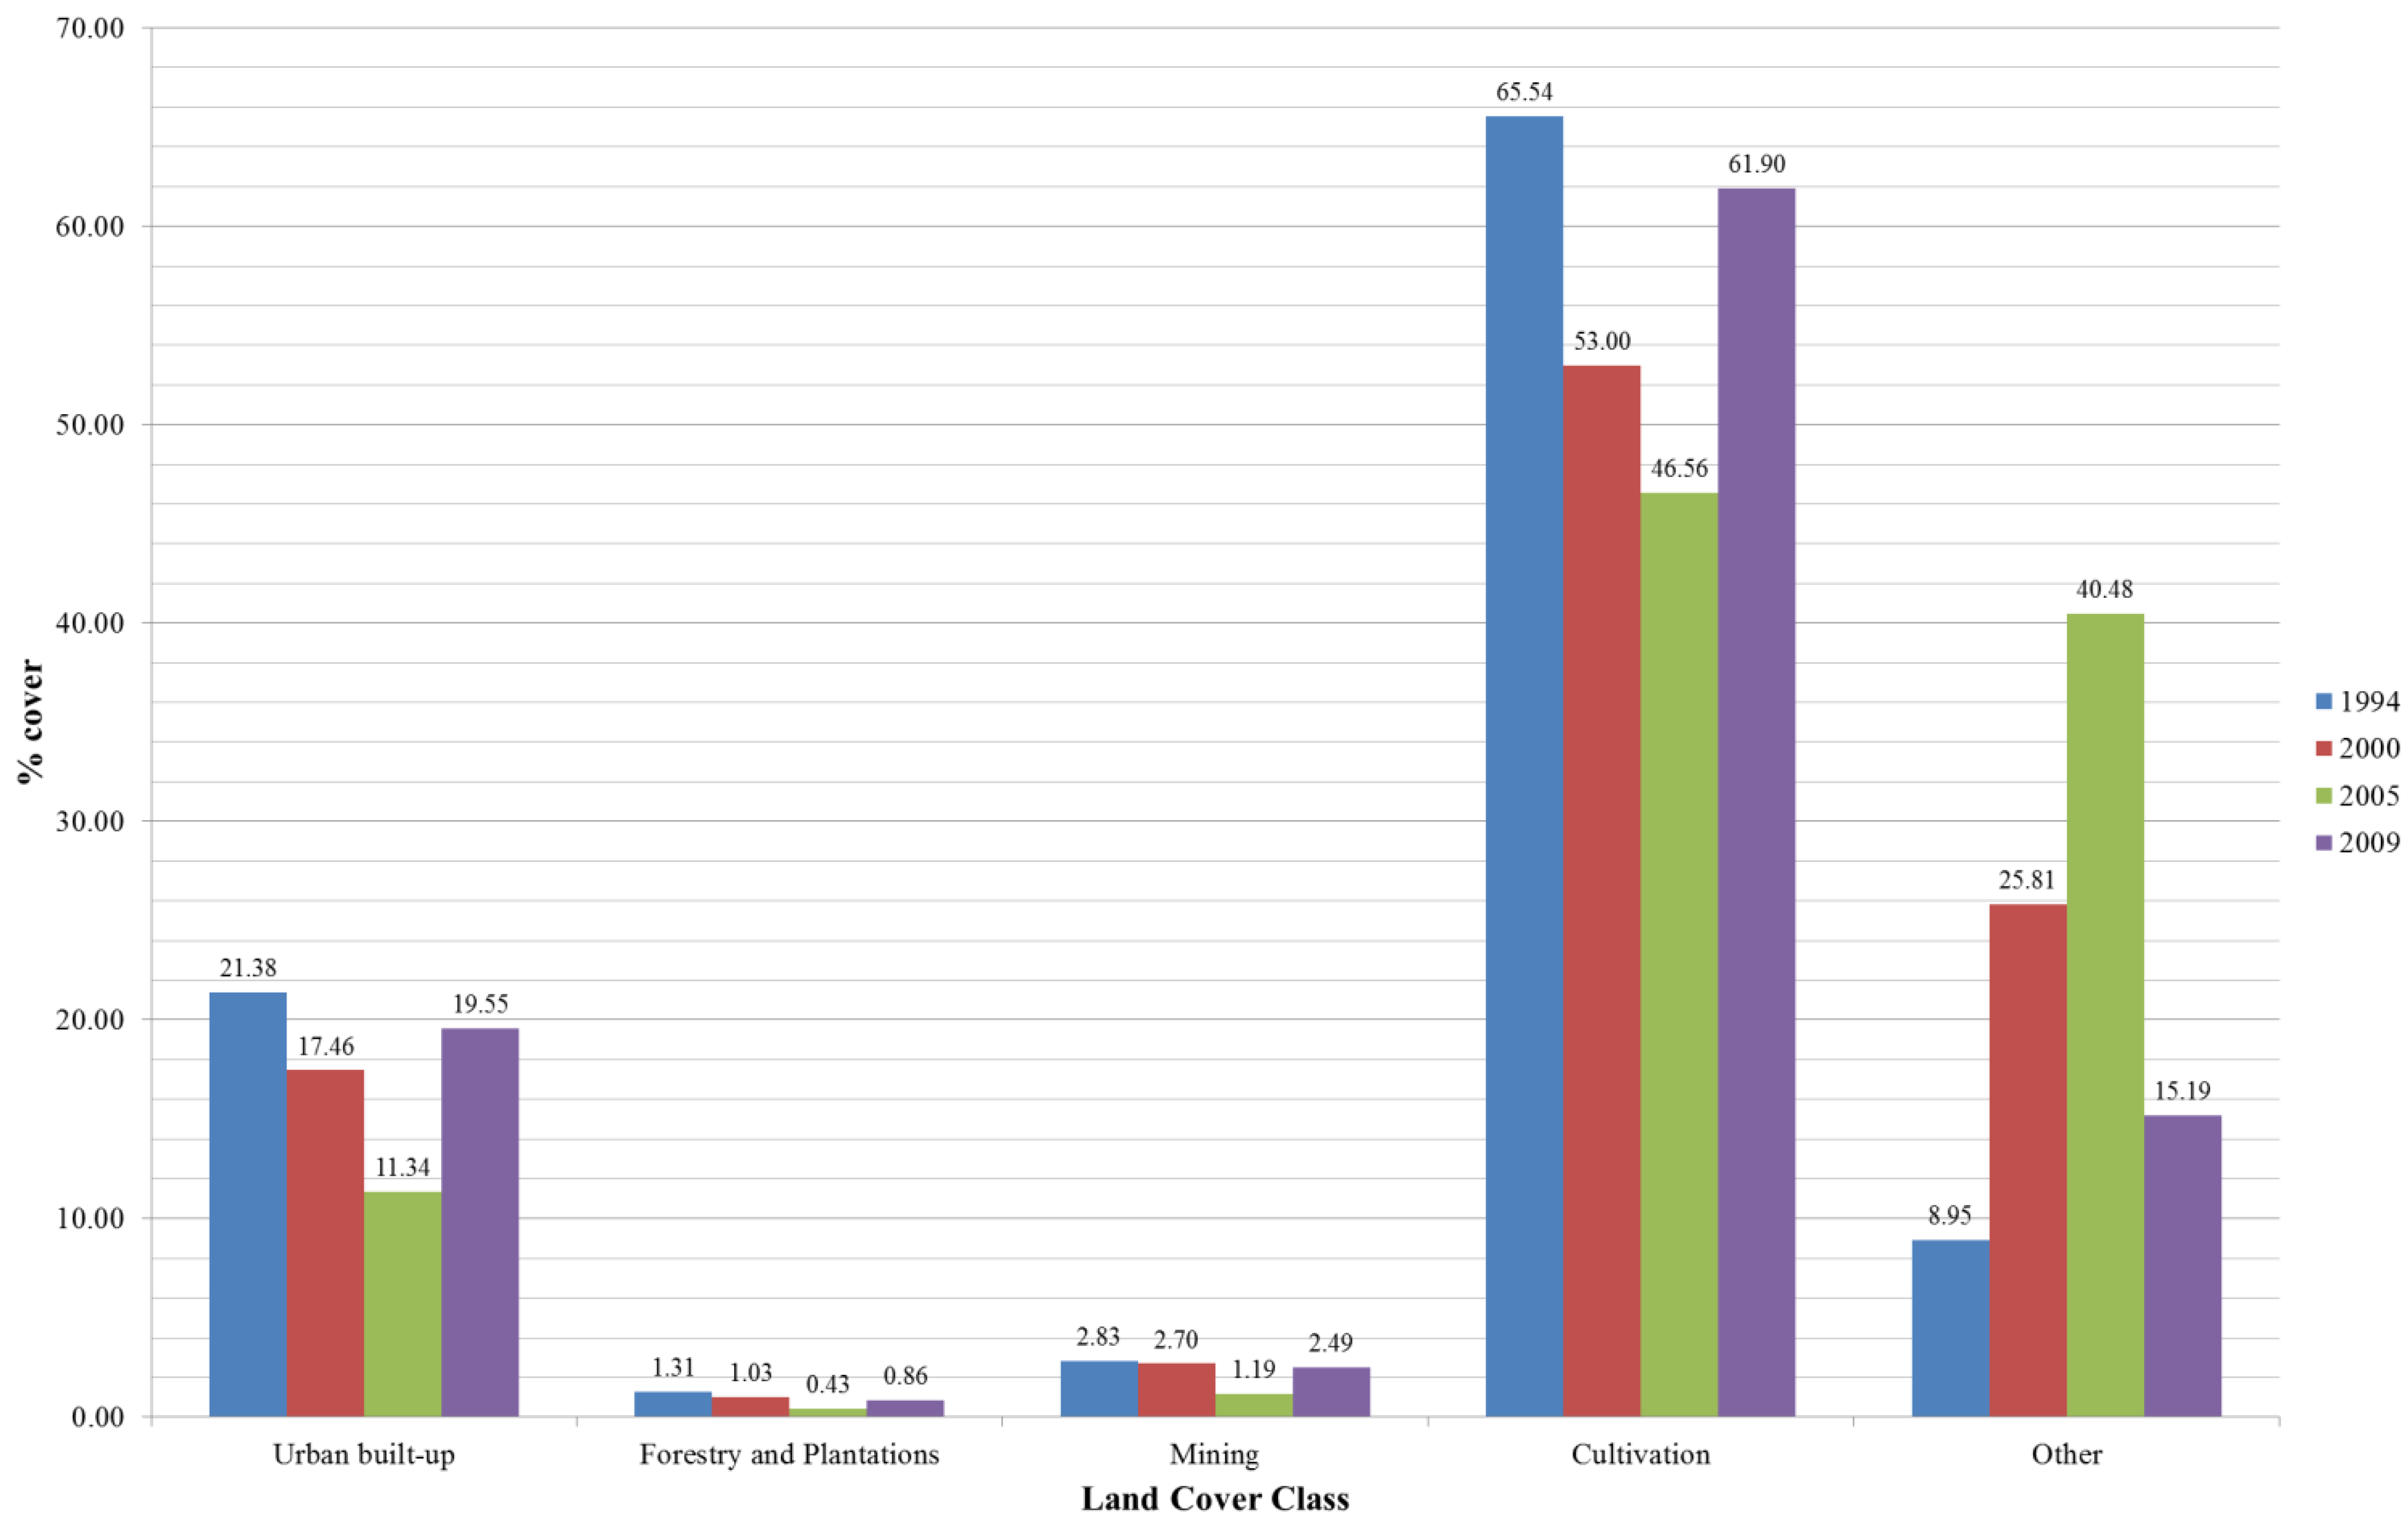
As indicated in
Figure 4, this catchment experienced moderate variations in its land cover over the study period. Urban build-up, forestry and plantations, mining, as well as cultivated land cover classes all experienced the same variations in terms of firstly, a decline in their areal extent from 1994 to 2005, and secondly, an increase in their areal extent from 2005 to 2009 but showed an overall increase over the study period.
Figure 3.
The land cover of the Blesbok Spruit catchment in 2009.
Figure 3.
The land cover of the Blesbok Spruit catchment in 2009.
Figure 4.
Trends in land cover change within the Blesbok Spruit catchment from 1994 to 2009.
Figure 4.
Trends in land cover change within the Blesbok Spruit catchment from 1994 to 2009.
Recent land cover trends include a gradual increase in the “other” land cover category owing to the transformation of the cultivated, forestry and plantations, as well as mining land cover classes. Furthermore, since 2005, the catchment has also been experiencing an upward trend in its urban build-up land cover. The economic activities within the Blesbok Spruit catchment are still focused primarily upon agriculture, followed by urban development and mining.
The situation within the Blesbok Spruit can therefore be mainly attributed to the too rapid growth of urban build-up areas, and possibly a case of where the population growth within the region exceeds the rate of development in the collection of waste water and its sewage treatment facilities.
4.3. Quantification of Hydrological Responses
The Blesbok Spruit catchment is characterized by very poor water quality standards, due mainly to the cultivated, urban build-up, as well as mining land cover within the region. The main agents for the increased concentrations in the water quality parameters can be determined by establishing the nature of the relationships between the respective variables, as presented in
Table 3.
Table 3.
Partial Least Squares (PLS) correlation matrix obtained between water quality parameters and land cover classes for the Blesbok Spruit catchment 3 (p < 0.05; n = 3).
Table 3.
Partial Least Squares (PLS) correlation matrix obtained between water quality parameters and land cover classes for the Blesbok Spruit catchment 3 (p < 0.05; n = 3).
| Variables | Urban Build-Up | Forestry and Plantations | Mining | Cultivated | Other |
|---|
| Urban build-up | 1.000 | 0.863 | 0.931 | 0.933 | −0.983 |
| Forestry and Plantations | 0.863 | 1.000 | 0.988 | 0.623 | −0.756 |
| Mining | 0.931 | 0.988 | 1.000 | 0.737 | −0.849 |
| Cultivated | 0.933 | 0.623 | 0.737 | 1.000 | −0.983 |
| Other | −0.983 | −0.756 | −0.849 | −0.983 | 1.000 |
| pH | −0.664 | −0.951 | −0.891 | −0.350 | 0.516 |
| EC | −0.658 | −0.188 | −0.339 | −0.885 | 0.785 |
| Alkalinity | −0.799 | −0.993 | −0.963 | −0.528 | 0.675 |
| Calcium | −0.436 | 0.078 | −0.078 | −0.731 | 0.593 |
| Chloride | −0.887 | −0.533 | −0.658 | −0.994 | 0.957 |
| Sodium | −0.258 | −0.710 | −0.592 | 0.108 | 0.077 |
| Magnesium | −0.327 | 0.195 | 0.039 | −0.646 | 0.494 |
| Nitrate | −0.049 | 0.463 | 0.319 | −0.405 | 0.230 |
| Sulfate | −0.460 | 0.052 | −0.105 | −0.749 | 0.614 |
| Ammonia | 0.551 | 0.054 | 0.209 | 0.815 | −0.694 |
| Phosphate | 0.434 | −0.080 | 0.076 | 0.730 | −0.592 |
| COD | −0.981 | −0.748 | −0.843 | −0.985 | 1.000 |
| Chlorophyll a | −0.907 | −0.571 | −0.692 | −0.998 | 0.969 |
| Faecal coliform | 0.929 | 0.614 | 0.730 | 1.000 | −0.981 |
| DO | −0.954 | −0.672 | −0.780 | −0.998 | 0.993 |
| DOC | −0.215 | −0.679 | −0.556 | 0.152 | 0.033 |
As indicated in
Table 3, numerous positive and negative relationships could be observed between land cover and the concentration levels of the selected water quality parameters within the catchment. Relationships of 95% significance include the following. Negative relationships are present between alkalinity and mining land cover, chloride and cultivated land cover, as well as between COD,
Chlorophyll a and DO and cultivated land cover. An increase of cultivated land cover will consequently be accompanied with negative environmental impacts on the affected aquatic organisms due to a decrease in DO in the water body.
Furthermore, significant positive relationships are present between COD and DO and “other” land cover but also between Faecal coliform and cultivated land cover. An increase in natural areas or rehabilitated areas will consequently be of benefit for the catchment as it will be accompanied with an increase in DO. However, an increase in “other” land cover or more specifically degraded land cover or poorly rehabilitated old mining operations or the complete absence thereof will be accompanied with an increase of COD which will consequently lead to nutrient enrichment of the catchment’s water bodies and possibly eutrophic conditions.
More importantly, the unacceptable Faecal coliform concentration levels were found to be attributed mainly to the cultivated land cover class, followed by urban build-up and mining land cover classes, as well as forests and plantations. This is of great concern, as Faecal coliforms are accompanied with significant human health issues as described previously. Measures need to be put in place to reduce Faecal coliforms within the catchment by focusing on the identified land cover classes.
Therefore, the relationships obtained by the PLS analysis coincide with and support the findings by previous studies [
27,
28,
29,
30,
31,
32]. Urban build-up, mining as well as cultivated land cover were established to have the greatest negative impact upon the catchment’s water quality. This research also found that undesirable or unintended negative impacts can be accompanied with the re-transformation of natural land cover areas especially in the case of mining. The transformation of mining land cover into “other” land cover due to the closing of mining operations can be accompanied with undesirable consequences such as the increase in the concentration of EC, chloride, sulfate, COD and
Chlorophyll a.
4.4. Future of the Blesbok Spruit Catchment
The future quality of the water in the catchment could be predicted with varying degrees of confidence with the aid of the formulated model equations with the use of PLS regression analysis, as presented in
Table 4. Predictions could be made with a significant degree of certainty for the concentration levels of all of the selected water quality parameters, except for calcium, sodium, magnesium, nitrate, sulfate, ammonia, phosphate and DOC.
As discussed in the previous section, the Blesbok Spruit catchment has experienced an overall increase in the extent of its urban build-up, forestry and plantations, mining, as well as “other” land cover classes, but an overall decline in the extent of its cultivated land cover from 1994 to 2009. These increases are expected to take place as a result of the economic growth and development of the region but also as a result of an increase in the “other” types of land cover due to the transformation of predominantly cultivated and mining land cover.
A scenario for predicting the future conditions of this region was developed. It assumed a further increase of 0.5% per year in the proportion of the urban build-up land cover class, 0.1% in that of forests and plantations, 0.1% in that of mining land, as well as 0.2% in that of the “other” land cover classes and a decline in the proportion of the cultivated land cover class as a percentage of the total area of the catchment.
Table 5 presents predictions for the various time periods in terms of this scenario, which is based on recently-observed land cover trends. The unique model equations, as presented in
Table 4, were used to determine the hydrological response of each water quality parameter to changes in the respective land cover classes.
Table 4.
Model equations and the respective adjusted R2 values for each of the selected water quality parameters related to each land cover class 4 for the Blesbok Spruit catchment.
Table 4.
Model equations and the respective adjusted R2 values for each of the selected water quality parameters related to each land cover class 4 for the Blesbok Spruit catchment.
| Water Quality Parameter | Model Equation | R2 Value |
|---|
| pH | pH = 4.2 × Urban build-up − 3.45 − 02 × Forestry and Plantations − 1.52 − 02 × Mining − 2.17 − 03 × Cultivated + 1.30 − 03 × Other | 0.45 |
| EC | EC = 146.11 − 0.53 × Urban build-up − 4.94 × Forestry and Plantations − 2.18 × Mining − 0.31 × Cultivated + 0.19 × Other | 0.42 |
| Alkalinity | Alkalinity = 204.56 − 0.50 × Urban build-up − 4.72 × Forestry and Plantations − 2.08 × Mining − 0.30 × Cultivated + 0.18 × Other | 0.65 |
| Calcium | Calcium = 108.39 − 0.31 × Urban build-up − 2.90 × Forestry and Plantations − 1.28 × Mining − 0.18 × Cultivated + 0.11 × Other | 0.18 |
| Chloride | Chloride = 132.04 − 0.57 × Urban build-up − 5.34 × Forestry and Plantations − 2.36 × Mining − 0.34 × Cultivated + 0.20 × Other | 0.78 |
| Sodium | Sodium = 48.27 − 6.20 − 03 × Urban build-up − 5.83 − 02 × Forestry and Plantations − 2.57 − 02 × Mining − 3.66 − 03 × Cultivated + 2.19 − 03 × Other | 0.07 |
| Magnesium | Magnesium = 31.01 − 1.78 − 02 × Urban build-up − 0.168 × Forestry and Plantations − 7.40 − 02 × Mining − 1.05 − 02 × Cultivated + 6.30 − 03 × Other | 0.10 |
| Nitrate | Nitrate = 1.07 − 5.17 − 04 × Urban build − up − 4.86 − 03 × Forestry and Plantations − 2.14 − 03 × Mining − 3.06 − 04 × Cultivated + 1.83 − 04 × Other | 0.01 |
| Sulphate | Sulphate = 368.61 − 1.51 × Urban build-up − 14.14 × Forestry and Plantations − 6.24 × Mining − 0.89 × Cultivated + 0.53 × Other | 0.20 |
| Ammonia | Ammonia = 0.42 + 6.42 − 03 × Urban build-up+6.03 − 02 × Forestry and Plantations + 2.66 − 02 × Mining + 3.79 − 03 × Cultivated − 2.27 − 03 × Other | 0.29 |
| Phosphate | Phosphate = 0.20+4.60 − 03 × Urban build-up + 4.32 − 02 × Forestry and Plantations + 1.91 − 02 × Mining + 2.72 − 03 × Cultivated − 1.63 − 03 × Other | 0.18 |
| COD | COD = 44.81 − 0.29 × Urban build-up − 2.70 × Forestry and Plantations − 1.19 × Mining − 0.17 × Cultivated + 0.10 × Other | 0.96 |
| Chlorophyll a | Chlorophyll a = 59.63 − 0.48 × Urban build-up − 4.50 × Forestry and Plantations − 1.98 × Mining − 0.28 × Cultivated + 0.17 × Other | 0.81 |
| Faecal coliform | Faecal coliform = −3 260.38 + 142.67 × Urban build-up + 1 340.30 × Forestry and Plantations + 591.40 × Mining + 84.31 × Cultivated − 50.41 × Other | 0.85 |
| DO | DO = 7.21 − 1.76 − 02 × Urban build-up − 0.17 × Forestry and Plantations − 0.07 × Mining − 1.04 − 02 × Cultivated + 6.20 − 03 × Other | 0.90 |
| DOC | DOC = 6.98 − 2.86 − 03 × Urban build-up − 2.68 − 02 × Forestry and Plantations − 1.18 − 02 × Mining − 1.69 − 03 × Cultivated + 1.01 − 03 × Other | 0.05 |
As indicated in
Table 6, the Blesbok Spruit catchment is expected to experience some positive effects issuing from the decline in the areal extent of cultivated land cover within the catchment. However, of concern is the fact that increased concentration levels are expected in respect of certain water quality parameters such as
Faecal coliform. Water quality parameters that are expected to experience a decline in their concentration levels include EC, alkalinity, calcium, chloride, sodium, magnesium, nitrate, sulfate, COD,
Chlorophyll a as well as DO. Sodium, magnesium, nitrate, as well as DOC, are expected to undergo minor changes in their concentrations. In terms of EC, alkalinity, calcium, chloride and sulfate, it is expected that the decline in the concentrations of these water quality parameters will be insignificant as they would tend to maintain their initial standards, namely unacceptably high or tolerable concentration levels. The expectation, however, that COD, as well as
Chlorophyll a, would decline in their concentration levels and that the nature of this change would be deemed to be of an acceptable standard is promising. This will be possible only in 2030; however, on account of the decline in the extent of cultivated land cover.
Table 5.
Predictions of land cover in the event of a 0.5% per year increase in the extent of urban build-up land cover within the Blesbok Spruit catchment.
Table 5.
Predictions of land cover in the event of a 0.5% per year increase in the extent of urban build-up land cover within the Blesbok Spruit catchment.
| Prediction of Land Cover (%) |
|---|
| Land Cover Class | 2015 | 2020 | 2030 | 2050 |
|---|
| Urban build-up | 22.55 | 25.05 | 30.05 | 40.05 |
| Forestry and plantations | 1.46 | 1.96 | 2.96 | 4.96 |
| Mining | 3.09 | 3.59 | 4.59 | 6.59 |
| Cultivation | 56.51 | 52.01 | 43.01 | 25.01 |
| Other | 16.39 | 17.39 | 19.39 | 23.39 |
Table 6.
Predictions of water quality parameter concentration levels in the event of a 0.5% per year increase in the extent of urban build-up land cover within the Blesbok Spruit catchment showing water quality color classification indicators in terms of the Vaal River Barrage in-stream water quality guidelines.
| Prediction of Concentration Levels of Water Quality Parameters |
|---|
| Water Quality Parameter | 2015 | 2020 | 2030 | 2050 | R2 value |
|---|
| pH (pH units) | 7.58 | 7.56 | 7.51 | 7.42 | 0.45 |
| EC (mS/m) | 105.77 | 102.48 | 95.90 | 82.73 | 0.42 |
| Alkalinity (CaCO3 mg/L) 5 | 166.07 | 162.93 | 156.64 | 144.08 | 0.65 |
| Calcium (mg/L) | 84.71 | 82.78 | 78.92 | 71.19 | 0.18 |
| Chloride (mg/L) | 88.46 | 84.90 | 77.79 | 63.57 | 0.78 |
| Sodium (mg/L) | 47.79 | 47.75 | 47.68 | 47.52 | 0.07 |
| Magnesium (mg/L) | 29.64 | 29.53 | 29.31 | 28.86 | 0.10 |
| Nitrate (mg/L) | 1.03 | 1.02 | 1.02 | 1.00 | 0.01 |
| Sulfate (mg/L) | 253.16 | 243.74 | 224.90 | 187.21 | 0.20 |
| Ammonia (mg/L) | 0.91 | 0.95 | 1.03 | 1.20 | 0.29 |
| Phosphate (mg/L) | 0.55 | 0.58 | 0.64 | 0.75 | 0.18 |
| COD (mg/L) | 22.81 | 21.01 | 17.42 | 10.24 | 0.96 |
| Chlorophyll a (µg/L) | 22.94 | 19.95 | 13.96 | 1.99 | 0.81 |
| Faecal coliform (Counts/100 mL) | 7679.27 | 8571.98 | 10,357.39 | 13,928.21 | 0.85 |
| DO (mg/L) 5 | 5.86 | 5.75 | 5.53 | 5.09 | 0.90 |
| DOC (mg C/L) | 6.63 | 6.74 | 6.71 | 6.63 | 0.05 |
The hydrological responses in terms of water quality that are considered to be matters of concern include the increase in the concentration levels or counts of ammonia, phosphate, Faecal coliform, as well as the decline in the concentrations of DO within the catchment. The concentration levels of ammonia, phosphate, as well as Faecal coliform, are expected to be unacceptably high, and to be accompanied by numerous negative environmental effects, as well as significant human health issues, especially in the case of Faecal coliform. These increased concentrations are predominantly due to increases in the extent of the urban build-up and mining land cover within the catchment.
The present quality of the water within the Blesbok Spruit catchment is poor and is expected to remain so into the future. This could primarily be attributed to the domination of the urban build-up, mining, cultivated and “other” land cover classes. The present quality of the water in the catchment points to the fact that the waste-water and sewage-water-treatment infrastructures and facilities are either not well maintained or inadequate owing to the unacceptably high and tolerable standards of some of the water quality parameters such as Faecal coliform and ammonia. Furthermore, the unacceptably high concentrations of sulfate within the catchment are also indicative of either poor quality water issuing as waste water from the mines or the absence of the correct decommissioning measures in terminating mining operations.
Furthermore, as indicated in this scenario, the increase in the extent of the “other” land cover category (especially degraded or natural) in the attempt to rehabilitate land cover areas such as those devoted to mining and cultivation will not be sufficient to improve upon the quality of the water within the region. The reason behind this is the fact that changes (reductions) in the concentration levels of some of the water quality parameters, such as nitrate, have thus far proved to be insignificant. The transformation of land cover areas into “other” categories of land cover is expected, therefore, to be accompanied by undesirable consequences or effects.
5. Conclusions
Land cover and land use have been deemed by numerous scientific studies to have an impact on water quality. We know, for instance, that a change in land cover could have a negative impact on the quality of the water in that the former causes an increase or reduction in the concentration levels of the relevant water quality parameters. These impacts are site or region-specific, however, and affect the respective water quality parameters in varying degrees. The degree to which or extent of the approximate increase or reduction in the concentration levels of the affected water quality parameters have not been quantified or predicted, however by previous studies within South Africa.
Owing to the environmental, social and economic importance of the Blesbok Spruit catchment, research was conducted to quantify and predict future hydrological responses in terms of water quality in association with a change in land cover within the catchment. The quantification of hydrological change in terms of water quality in turn allowed for the prediction of concentration levels in the selected water quality parameters in terms of the proportion percentage of the land cover class within the catchment. The PLS regression model proved to be of great use in formulating model equations for the accurate prediction of water quality within the specific catchment.
The quantification and prediction of hydrological responses in terms of water quality should allow for the future cost-effective treatment of water within the region and for the effective planning and management of water resources. Through these means, it would be possible to improve the catchment’s sustainability and lastly, to facilitate informed decision-making within the catchment.
The Blesbok Spruit catchment is characterized by very poor water quality standards, due mainly to the cultivated, urban build-up, as well as mining land cover within the region. The Blesbok Spruit catchment is a densely-populated region characterized by economic growth and development. The integrity of the once Ramsar listed major wetland with its accompanied buffering capabilities as well as the Blesbok Spruit catchment as a whole has been compromised by the discharge of mining effluent, sewage as well as the other pollution associated with the urbanization, industrial and agricultural growth over the past decades within the catchment. This region is therefore faced with major water quality problems and sustainability issues that need to be monitored more closely in order to enable the development of effective and innovative solutions. The quality of the water in the catchment therefore needs to be addressed as a matter of urgency to ensure that the future economic growth and development within the catchment is not limited or even forced to decline.
For the catchment to improve upon its present and future status in terms of water quality, the present waste-water and sewage-water-treatment facilities need to be well maintained or upgraded to ensure that water is treated effectively and to the right standard. Furthermore, additional water-treatment facilities need to be developed as the poor quality of the water in the region at present, especially in terms of Faecal coliform, is an indication that the present facilities are ineffectual in treating the present volumes of waste and sewage water within the catchment. Mining operations need to be monitored more closely and water quality standards and guidelines need to be enforced to ensure that these mining operations comply and do not lead to further degradation. The proclamation of future mining developments within the catchment also needs to be considered as this will exacerbate the already poor quality of the water and lead to additional environmental impacts.
This study therefore proved that the application of the PLS regression analysis is very useful and successful for the quantification and prediction of water quality in relation to land cover change. It is however recommended that this research be improved upon with the use of additional land cover datasets. PLS regression analysis can therefore be a key tool for improved decision-making within the water management sector within South Africa but also in other catchments or drainage regions of the world.


