1. Introduction
The last two decades have witnessed the global mining industry moving towards sustainable development, which is characterized as “technically appropriate, environmentally sound, financially profitable, and socially responsible” [
1,
2,
3]. The characteristics have been imposing new requirements on mine water management practices.
As a fundamental and indispensable asset, water plays a vital role in mining activities for product washing, dust suppression, drilling, human consumption, and numerous other uses. Mining industries consume large quantities of water. In Australia, the mining industry consumed 540 GL of water, in 2010–2011, which accounted for 4% of Australia’s total water consumption [
4]. It is estimated that by 2020, water demand by mineral and coal processing will exceed 750 GL per year [
5]. However, Australia is a relatively dry country, and newly enacted a plan to increase water allocations to environmental flows by decreasing sustainable diversion limits in agriculture [
6]. The competition for water among water use sectors is intensifying, especially when surface water and groundwater are already highly allocated [
7]. In addition, mine sites usually locate in remote and arid areas, making water demand even more significant. As a result of rapid increase in mineral production, intensifying competition with other water uses, locations of mine sites, and significant climate variability, there is strong pressure of securing water supply to the mining industry. Security of water supply can reduce the risks associated with reduction in revenue from loss of production, and the risks of purchasing water at a high price in drought periods.
Water excess needs to be well managed, either to be compliantly discharged into receiving water bodies, or to be stored for future use in dry years. Communities around mine sites tend to concern about water availability and security, and may voice discontent with mine companies if they regard the mines as excessive water users or environment offenders. As a result, we need to identify better mine water management practices for reducing raw water use, increasing water use efficiency, and eliminating environmental impacts in a precondition of securing mining production.
Therefore, responsible water management is a key ingredient in ensuring that its contribution to sustainable development is positive over the long term. Some efforts have been made to understand mine water use systems and some management practices have been conducted over the last two decades. In order to move towards sustainable development, mining companies chose different management options. For instance, in terms of improving water use efficiency, the companies may recycle water, reduce evaporation, and reduce the water content in concentrates and tailings. However, quantifying the effects of these practices remains difficult partly because mine water use has cumulative impacts [
8]. The identification of good mine water management practices is critical for mine water managers to adopt more rational and sustainable management solutions by referring to good management cases. However, the optimal selection of mine water management practices requires one comprehensively evaluate management options against a number of requirements, thus, becomes a problem in multiple criteria decision-making (MCDM) [
9,
10,
11,
12]. MCDM methodologies formally incorporate the concerns from decision makers about a set of conflicting criteria into the management planning process. The promising methodologies have recently been applied into the risk management of mine water disasters [
13,
14] and mine water strategy evaluation [
15], but little work can be found on evaluating mine water management practices in the literature.
Considering this research gap, this paper presents a case study of the evaluation of sustainable water management practices in 16 mines located in the Bowen Basin in Queensland, Australia. Currently major mining activities in the basin are coal mining and coal seam methane gas production. There are plans to significantly increase production through current mine expansions and by developing new mines. Therefore, it is significant to evaluate how sustainable current water management is in the mines in this area. Water is required to be managed at all stages of the life cycle of mining operations [
1]. The focus is the evaluation of mine water management practices at the mine operating stage in this work. The other stages, such as final closure and decommissioning, are not considered here.
To help mine water managers figure out the decision hierarchy, a conceptual framework is developed with three criteria at the mine operating site: input, operational activity and output. Each criterion includes several indicators. An evaluation method is proposed with an analytic hierarchy process (AHP) plus a technique for order performance by similarity to ideal solution (TOPSIS) [
16,
17]. The AHP method is used to determine the weights for evaluation criteria [
18]. The ranking of these mine water management practices is calculated with fuzzy TOPSIS method, which is expressed in linguistic values parameterized with triangular fuzzy numbers [
19]. We also perform a sensitivity analysis on preference weights of the stakeholders or decision makers and provide measures for assessing the sensitivity of practice ranking outcomes to changes in these weights.
The paper is organized as follows. In the next section, we propose a conceptual framework for developing a decision problem hierarchy and the AHP-fuzzy TOPSIS method for evaluating mine water management practices.
Section 3 presents the application of the decision hierarchy and the evaluation method into the case study in the Bowen Basin. The evaluation results of mine water management practices and results from the sensitivity analysis are presented.
Section 4 presents the conclusions of this paper.
2. Methods
Mine sites may differ in geographical features, water supply sources, water demands, water use efficiencies, water management strategies, and mine operation types. In order to compare water management practices in heterogeneous sites, we proposed a conceptual framework with a hierarchical criterion structure. Decision makers then can select one or more specific indices or indicators to represent one criterion, in order to form a decision hierarchy. The sustainable mine water management practices were evaluated using the AHP-fuzzy TOPSIS method. The weights assigned to these indices can be derived from stakeholder preferences over criteria in the form of relative weights on a pair-wise comparison basis using the AHP method. The performance ratings of mine water management practices were obtained with the Fuzzy TOPSIS method. In view of different preferences of stakeholders or managers, the sensitivity analysis was performed. The relative methods are described in this section.
2.1. A Conceptual Framework for the Decision Hierarchy of Sustainable Mine Water Evaluation
Water issues traditionally cross a number of management boundaries in a mine site. The water within mining activities is either raw water or worked (mine-affected) water. Here, raw water is water that is received as an input and has not been used in a task. Worked water is water that has been through a task [
20]. A life-of-mine approach is required to manage mine water but the emphasis of this paper is on the mine operating period. At this stage, it is fundamentally important to fully understand all possible water sources, water volume and quality needs of the mine activities, the extent of worked water used, mine site water inventories, and cumulative impacts of mine discharges on the environment. Following the operational model of mine water system [
21], a mine water system can be divided into three functional elements: water input, water output, and operational activity (or use-treat-store activity). A conceptual framework was proposed for the decision hierarchy of sustainable mine water evaluation as shown in
Figure 1.
Figure 1.
A conceptual framework for forming decision hierarchy for sustainable mine water evaluation.
Figure 1.
A conceptual framework for forming decision hierarchy for sustainable mine water evaluation.
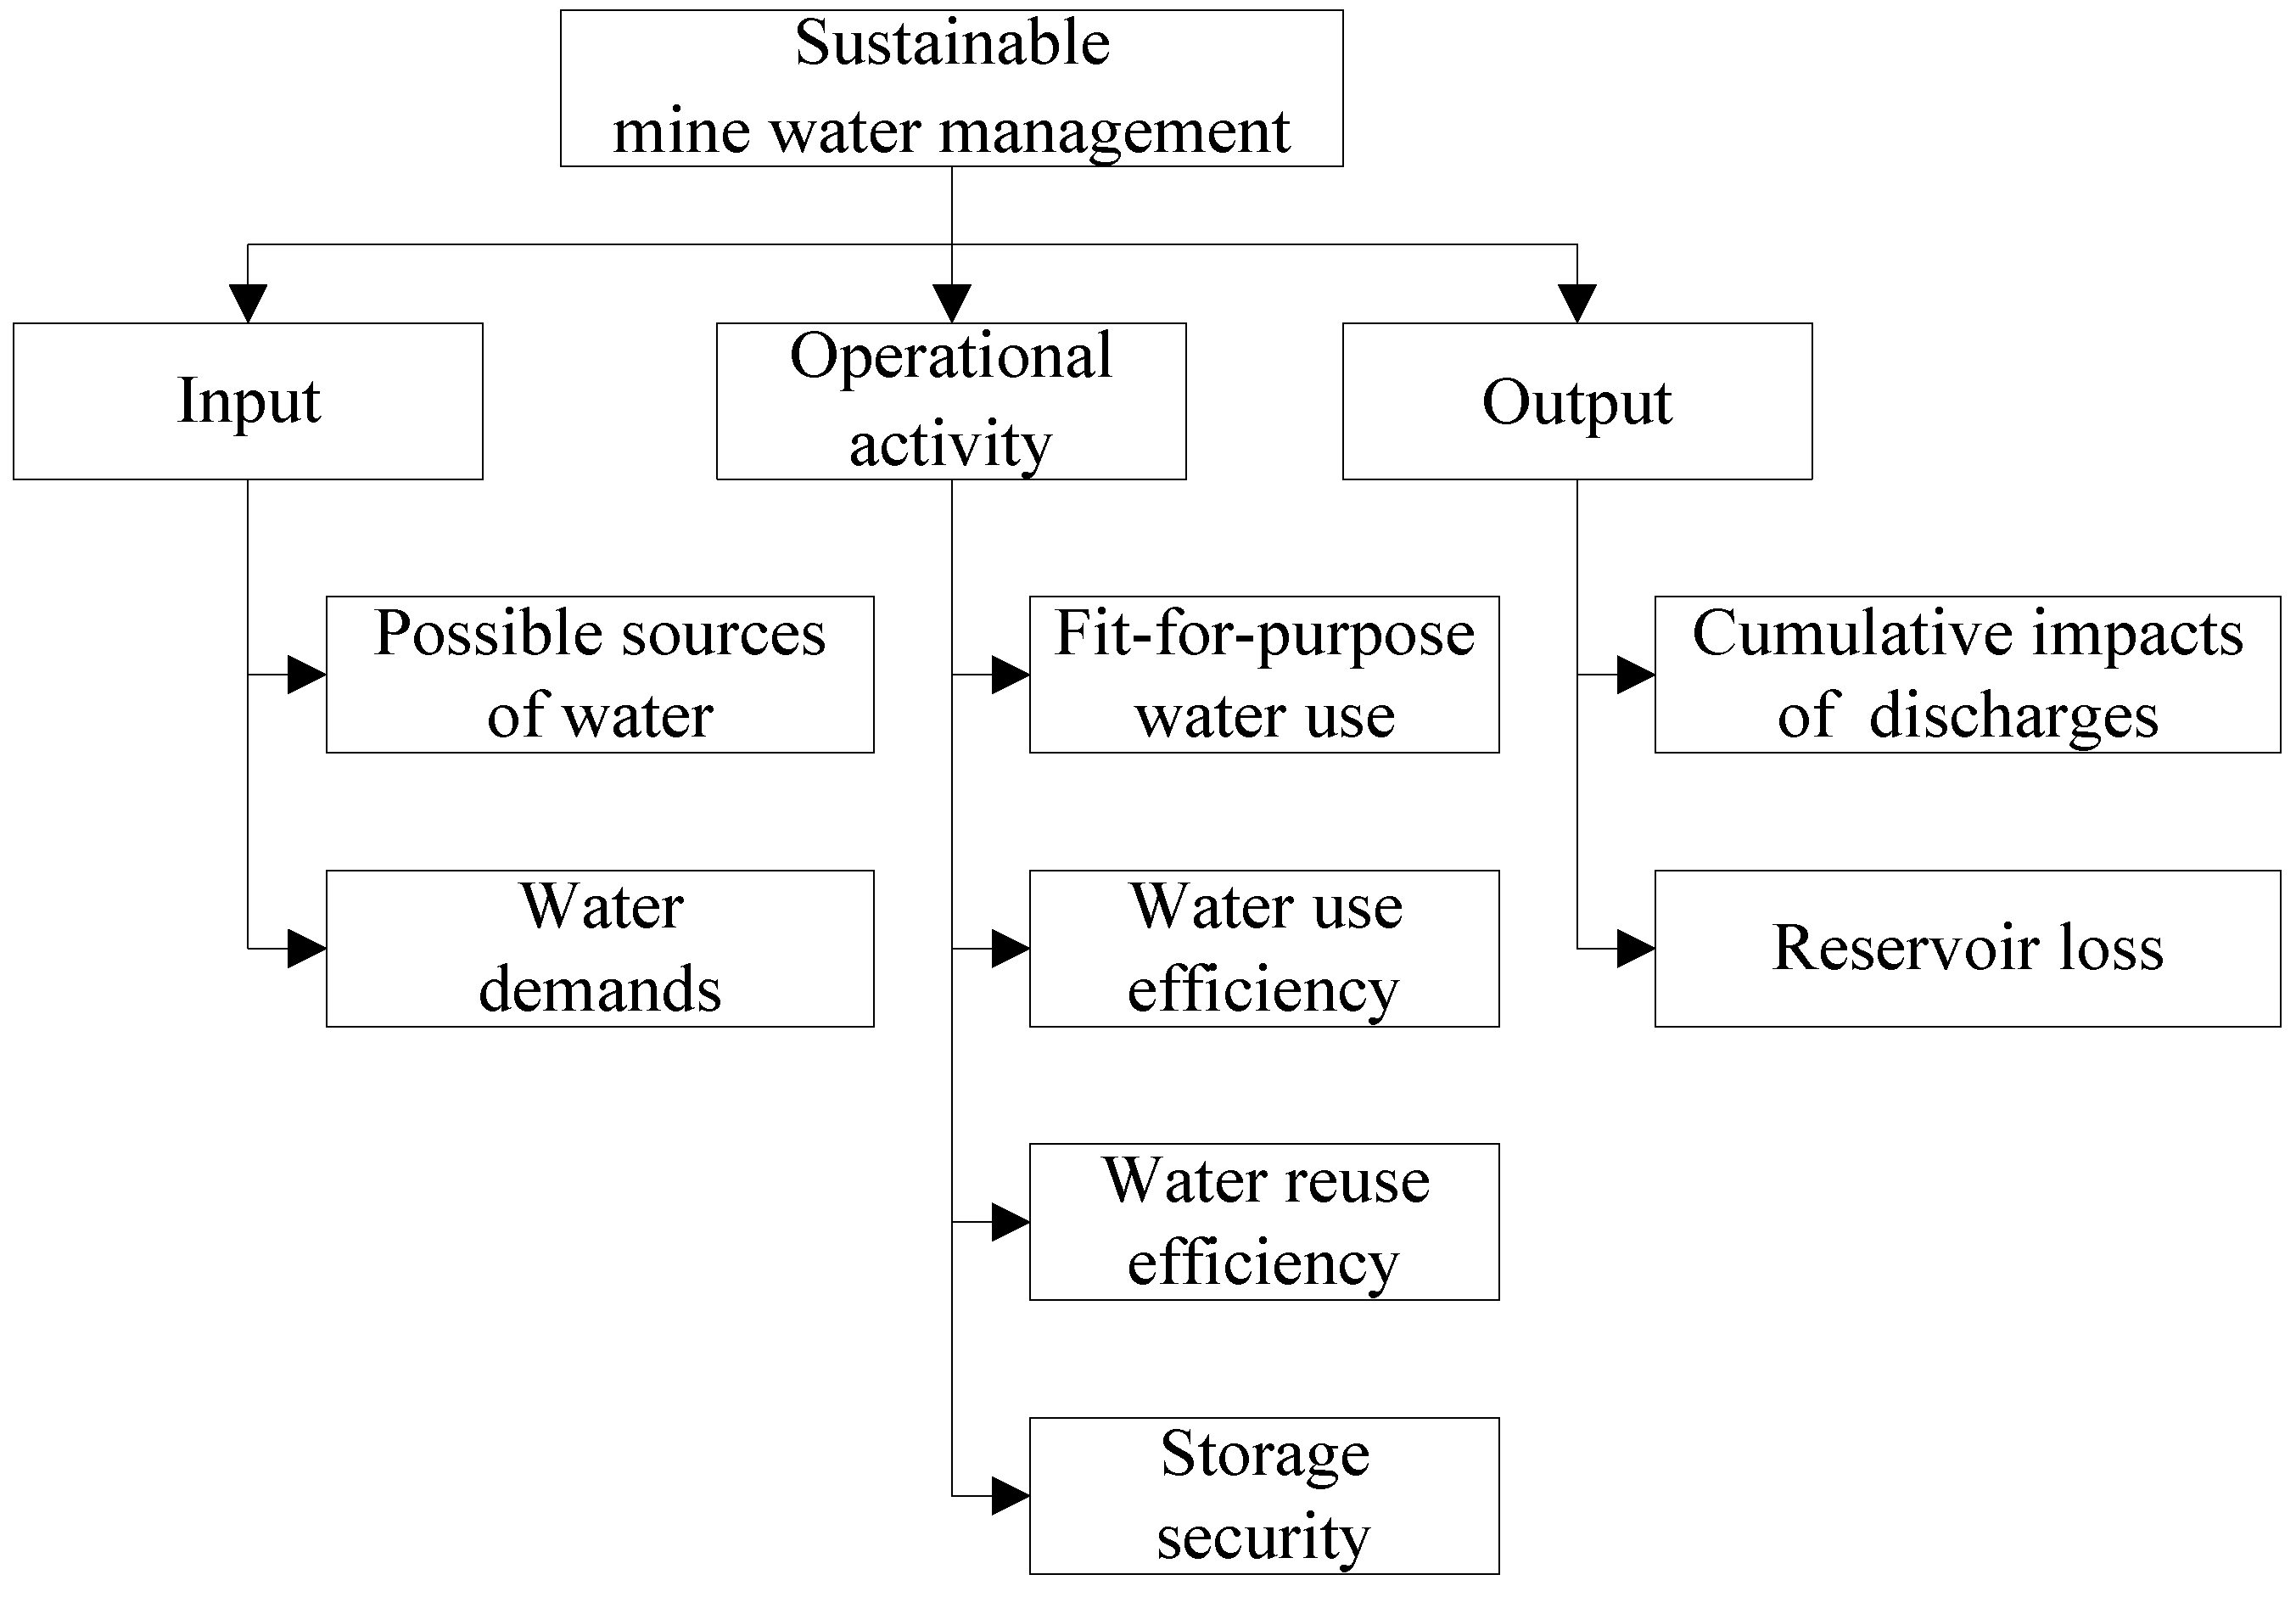
Figure 1 displays a conceptual decision hierarchy of evaluating sustainable mine water practices, with the trunk representing core criteria and the branches representing sub-criteria. The top-level criteria are “input”, “operational activity”, and “output”.
The “input” criterion comprises the following two sub-criteria: “possible sources of water” and “water demands”. Input represents the receipt of water to the operational facility and is characterized by their source and quality. In most mine sites, water is obtained directly from groundwater, surface water, or through commercial water service suppliers. In this functional element, the potential water demands (water volume and quality needs) for mining activities are considered.
The “operational activity” includes “fit-for-purpose water use”, “water use efficiency”, “water reuse efficiency”, and “storage security”. Operational activity includes the majority of operational tasks, storages, technologies and processes that are implemented to reduce raw water use, promote water use efficiency, and minimize risks associated with water quantity and quality utilized. The mine water system must be managed to secure water at a quality that is “fit-for-purpose” during water limited periods. Most of the time, water is in limited supply in Australia so water use efficiency and reuse efficiency are deemed to be important. Additionally, reservoirs are required to be controlled to secure water use in the mine during water limited periods, and mitigate environmental impacts expressed through unregulated discharge of worked water during excess supply periods.
The “output” functional element represents the removal of water from an operational facility and includes two sub-criteria: “cumulative impacts of discharges” and “reservoir loss”. The major water quality parameters of concern associated with coal mining are salinity (based on electrical conductivity usually measured in μS/cm), heavy metal and metalloid ion concentrations (mg/L), and acidity/alkalinity (pH). The impacts of water discharges from coal mines accrue in time and space, and can interact in synergistic ways [
8]. These impacts may have on the river environment and the quality of water in the river basin and may generate high levels of public concern and result in the prohibition of mining companies’ social license to operate. Reservoir loss needs to be managed for saving water in the storage.
2.2. Determination of Preference Weights
The AHP method is a qualitative-quantitative analysis with the multi-objective decision-making and comprehensive evaluation method. This method can help decision makers determine the quantitative experience in order to achieve optimal decisions. The basic steps involved in this method are as follows:
(1) Structuring a decision problem and selecting criteria.
The first step is to decompose a decision problem into its constituent parts. In its simplest form, this structure comprises a goal or focus at the topmost level, criteria and indicators at the intermediate levels, while the lowest level contains provided options. Organizing all the components in a hierarchy provides an overall view of the complex relationships among decision components.
(2) Conducting a pair-wise comparison.
This step involves describing preferences in the form of relative weights on a pair-wise comparison basis. The weight specification is simplified by using a pair-wise comparison decision matrix. The relative importance of two factors is rated using a scale with the values 1, 3, 5, 7, and 9, where 1 refers to ‘equally important’, 3 denotes ‘more important’, 5 equals ‘obviously more important’, 7 represents ‘strongly more important’ and 9 denotes ‘extremely more important’. Also, 2, 4, 6, and 8 are used for compromise between the above values. The reciprocal denotes inverse comparison [
18].
(3) Constructing an evaluation matrix.
This step constructs an n-criteria evaluation matrix A in which every element αi,j (i,j = 1,2, … ,n) is the quotient/ratio of preference values attached to the criteria.
(4) Deriving criterion weights.
The aim in this step is to transform the pair-wise preferences summarized in the evaluation matrixinto a vector of weights that could be attached to the multiple outcomes. To impose a consistency requirement, this procedure calculates the maximum eigenvalue λmax and a corresponding eigenvector w for the matrix CR. Then, this maximum eigenvalue is used to develop a consistency measure, using a procedure that accounts for the effects of the size of the criteria set n as shown below. This measure, known as the consistency ratio or CR is used to determine whether the preference judgments embodied in matrix A are consistent. If they are not, the preferences are adjusted and the procedure repeated until CR lies in the desired range. The assessment of preference consistency involves the following three steps:
Step 1: Calculating the consistency index
CI in terms of Equation (1):
where λ
max is the maximum characteristic root of the consistency matrix,
n is the number of pair-wise comparisons.
Step 2: Calculating the consistency ratio
CR using Equation (2), where the random consistency index (
RI) depends on
n and is obtained from
Table 1 [
18].
Table 1.
The value of RI with different n.
Table 1.
The value of RI with different n.
| | n |
| 3 | 4 | 5 | 6 | 7 | 8 | 9 | 10 | 11 |
| RI | 0.5149 | 0.8931 | 1.1185 | 1.2494 | 1.345 | 1.42 | 1.4616 | 1.4874 | 1.5156 |
Step 3: Comparing CR to the accepted upper limit value of 0.1. If CR exceeds this value, matrix A will be modified and the evaluation procedure has to be repeated to improve consistency.
2.3. Fuzzy TOPSIS-Based Comprehensive Evaluation
The TOPSIS method is based on the idea that the best alternative should have the shortest distance from the positive ideal solution and farthest distance from the negative ideal solution. In the classical TOPSIS method, the weights of the criteria and the ratings of alternatives are known precisely and crisp values are used in the evaluation process. However, crisp data are inadequate to model real-life decision problems under many conditions. Therefore, the fuzzy TOPSIS method is proposed where the weights of criteria and ratings of alternatives are evaluated by linguistic variables represented by fuzzy numbers to deal with the deficiency in the traditional TOPSIS. In this paper, the extension of the TOPSIS method is considered which was proposed by Dağdeviren
et al. [
16]. The algorithm of this method was described as follows.
Step 1: Choosing the linguistic ratings rij = (rij1, rij2, rij3) , where rij1, rij2, and rij3 are three elements of this triangular fuzzy number, i represents the index of a management alternative, i = 1,2, …, m and j denotes the index of a criterion for alternatives, j = 1,2, …, n. The fuzzy linguistic rating rij preserves the property that the ranges of normalized triangular fuzzy numbers belong to [0, 1]; thus, there is no need for normalization.
Step 2: Considering the weighted decision matrix
V = [
vij]
m×n. The weighted value
vij is calculated as:
where
wj is the weight of the jth attribute and
![Water 06 00414 i002]()
.
Step 3: Determining the fuzzy positive ideal solution (FPIS)
A+ and fuzzy negative ideal solution (FNIS)
A‒. The FPIS and FNIS of the alternatives are computed as follows:
where
J is a set of benefit attributes and
J′ is a set of cost attributes.
Step 4: Calculating the distances of each alternative from FPIS and FNIS as follows:
where
d(
a,
b) is the Euclidean distance measurement between two fuzzy numbers
a and
b.
Step 5: Computing the closeness coefficient (
CCi) of each alternative. The closeness coefficient
CCi represents the distances to the FPIS
A+ and FPIS
A‒ simultaneously. The closeness coefficient of each alternative is calculated as:
where 0 ≤
CCi ≤ 1.
Step 6: Ranking the alternatives. The different alternatives are ranked according to the closeness coefficient CCi in decreasing order. The best alternative is closest to the FPIS and farthest from the FNIS.
2.4. Sensitivity Analysis
Naturally, there would be uncertainty about the preference weights used in the ranking or stakeholders would have different preferences. The sensitivity analysis is used to allow decision-makers to judge whether the model results are sufficiently accurate to support decision-making. It is performed by modifying probability or weight values.
The most critical criterion for strategy ranking is not necessarily the criterion which corresponds to the highest weight. It was defined in two alternative ways. One interest was on whether the indication of the best alternative changes. The other was on changes in the ranking of any alternative. Therefore, a total of four alternative definitions were considered. There are coded as percent top (PT), percent any (PA), absolute top (AT), and absolute any (AA) [
22]. We first introduce the concept of the minimum change , which denotes the smallest change in the magnitude of the current weight
wk of a criterion
CCi such that the strategy ranking would be reversed. The new weight is shown as Equation (9):
where = 1, …,
m − 1,
q = 2, … ,
m,
q >
p. m is the number of management alternatives.
k is an index value of a sub-criterion and
k = 1, … ,
n.
A negative value of
δk,p,q indicates an increase of the weight
wk of the
k-th indicator, while a positive change indicates a decrease. All weights are
w1,
w2, …,
![Water 06 00414 i009]()
, …, and
wm. It is necessary that all weights should be normalized. The normalized weight is:
The change value in relative terms
δ′k,p,q is computed as in Equation (12):
3. Case Study
We applied the above methods to the evaluation of water management practices of 16 mines located in the Bowen Basin. Major mining activities in the basin are coal mining and coal seam methane gas production. It is critical to know how sustainable the current water management practices are in these mines in this area. To this end, we first followed the conceptual framework and constructed a decision hierarchy for sustainable mine water evaluation. Eleven indicators are incorporated into the hierarchy referring to the criteria and sub-criteria of the conceptual framework. The steps for evaluating mine water management practices mainly include: (1) determining a set of decision indicators and structuring a decision hierarchy over these indicators; (2) calculating a consistent set of weights for indicators set using the AHP; (3) evaluating water management practices using the fuzzy TOPSIS approach; and (4) identifying preferred management and discussing possible improvement measures.
3.1. A Decision Hierarchy and Data Sources
A decision hierarchy was designed to assess mine water management practices. For each criterion and sub-criterion in the framework, one or multiple relative indicators can be selected as evaluation indices. Eleven evaluation indicators (demonstrated in
Table 2) were determined in terms of the sub-criteria presented in
Section 2.1. According to the two sub-criteria of the input criterion, the indicators of input include number of apply sources (
NSS), average water quality of sources (
AWQ), ratio of potential demand to supply (
RPDS), and water demands (
WD). As to the sub-criteria of operational activity in the framework, we select four indicators: reuse efficiency (
RE), water loss in tasks (
WLT), wet indicator (
WI), and dry indicator (
DI). As to the sub-criteria of output, three indicators are selected: worked water discharge risk (
WWDR), raw reservoir loss (
RRL), and worked reservoir loss (
WRL).
A decision hierarchy structured with criteria and indicators is shown in
Figure 2. Three criteria are input, operational activity, and output. These indicators are measured as quantitative or qualitative.
AWQ and
WWDR are qualitative indicators, whose values are “very high”, “high”, “medium”, “low”, or “very low”. The other indicators are scaled quantity.
AWQ,
RPDS,
RE,
WLT,
WI,
DI,
WWDR,
RRL, and
WRL are valued respectively by the proportion or percentage and they are no units. The value of
WD value is obtained directly from the data source (seen
Table A5 in
Appendix 2) and its unit is ML/Mt. The value of
NSS is decided by the number of possible supply sources of a mine.
WI and
DI are from the data source. And each value of the others can be derived from the original data.
We applied the hierarchy to evaluating the sustainable mine water management practices in the case study region. The original data of the 16 coal mines were reported by Côte
et al. [
23]. The 16 mines are numbered as Mines 2–17, coinciding with the original data source. In terms of operation location, a mine site is classified as open-cut (where coal is extracted following removal of the overlying rock near the surface), underground (where the overlying rock is left in place and the coal removed through shafts or tunnels), or mixed one (with both open-cut and underground operations). Mines 5, 6, 13, and 15 are underground mines; Mines 3, 14, and 17 are mixed mines; and the rest are open-cut mines.
Table 2.
The evaluation indicators and their descriptions.
Table 2.
The evaluation indicators and their descriptions.
| Criteria | Indicators | Explanations |
|---|
| Input | NSS | The number of possible supply sources (e.g., surface water, groundwater, and water provided by the third-party). Here, the impacts of other water users on water availability of these sources are not considered |
| AWQ | Water quality, e.g., high or low |
| RPDS | The proportion of total raw demand water to total raw water |
| WD | Total water demand for mining activities or task, such as handling and processing plant (CHPP), dust, and underground per million ton product |
| Operational activity | RE | The proportion of worked water to total water |
| WLT | The proportion of water loss to the total water in tasks |
| WI | The proportion of time above 90% full time for stored water |
| DI | The proportion of time below 20% full time for stored water |
| Output | WWDR | The discharge risk of worked water which affects environments, e.g. very high, medium, very low |
| RRL | The proportion of raw reservoir total loss to raw reservoir input |
| WRL | The proportion of worked reservoir loss to worked water input |
Figure 2.
A decision hierarchy of management practice evaluation.
Figure 2.
A decision hierarchy of management practice evaluation.
3.2. Determining the Weights of Indicators Using the AHP Method
The weights of indicators for evaluation were calculated using the AHP method. We first built pair-wise comparison matrices as an instance of the preference weights that might be elicited from experts and mine water managers, and then set criteria and indicators by pair-wise comparisons. A fundamental scale of values was used to simplify the representation of the intensities of preferences. Next, we constructed an n-criteria evaluation matrix A in which every element
αij (
i, j = 1,2, … ,
n) is the quotient/ratio of preference values attached to the criteria, shown in
Table A1,
Table A2,
Table A3,
Table A4 of
Appendix 1. Finally, the weights were derived and the global weight was calculated by multiplying the local weight of an indicator with that of a criterion.
Table 3 exhibits local weights for indicators at each level of the proposed decision hierarchy.
Table 3.
The AHP derived the weights of indicators.
Table 3.
The AHP derived the weights of indicators.
| Criteria | Local weights | Indicators | Local weights | Global weights |
|---|
| Input | 0.2 | NSS | 0.0899 | 0.018 |
| AWQ | 0.1803 | 0.0361 |
| RPSD | 0.2811 | 0.0562 |
| WD | 0.4486 | 0.0897 |
| Operational activity | 0.4 | RE | 0.4831 | 0.1933 |
| WLT | 0.0803 | 0.0321 |
| WI | 0.2081 | 0.0832 |
| DI | 0.2285 | 0.0914 |
| Output | 0.4 | WWDR | 0.5889 | 0.2356 |
| RRL | 0.2519 | 0.1007 |
| WRL | 0.1593 | 0.0637 |
3.3. Evaluating Water Management Practices in the 16 Coal Mine Sites
The fuzzy TOPSIS was used to evaluate the sustainable mine water management with respect to the indicators presented in
Table 3. Linguistic variables were selected to evaluate the rating of alternatives. The membership functions of the triangular fuzzy numbers are shown in
Figure 3. The linguistic variables “Very Low” (VL), “Low” (L), “Medium” (M), “High” (H), “Very High” (VH), and “Excellent” (E) correspond to (0, 0, 0.2), (0, 0.2, 0.4), (0.2, 0.4, 0.6), (0.4, 0.6, 0.8), (0.6, 0.8, 1), and (0.8, 1, 1), respectively.
Based on linguistic values, alternatives with regards to indicators were assessed. The weighted evaluation for each site was created and seen in
Table A6 of
Appendix 2. The fuzzy weighted decision matrix was calculated with Equation (3) and depicted in
Table A7 and
Table A8 of
Appendix 3. Using Equations (4) and (5), A
+ and A
‒ were computed respectively. Next, the Euclidean distance of each alternative from A
+ and A
‒ were computed using Equations (6) and (7). After that, the closeness coefficients were solved using Equation (8). Finally, the values of each alternative for final ranking are illustrated in
Table 4.
Figure 3.
The membership function.
Figure 3.
The membership function.
We see that Mine 13 is the best sustainable one, with a CC value of 0.8306, and Mine 3 is the worst one with a CC value of 0.3600. The CC value is mainly affected by WWDR, RE, RRL, DI, and WI indicators. Reference to the data about Mine 13, there are three water sources from third-party (high quality), surface water (high quality), and ground water (low quality). The RPDS value is 9.8%, which denotes that the site has plenty of supply water and needs less water to produce coal products. The RE value is 80.8%. The WI value is 32.5%. The DI value is 0.28%, which is much lower than most of the others. Therefore, the extreme weather, such as dry weather, hardly happens. WWDR is “low”, which denotes that the site does not need discharge excessive water and thus discharge water hardly affects the environment. In addition, the RRL value is 15.8% that is lower than most of the others’ values.
Table 4.
The fuzzy TOPSIS results.
Table 4.
The fuzzy TOPSIS results.
| Mine ID | ![Water 06 00414 i013]() | ![Water 06 00414 i014]() | CCi | Ranking |
|---|
| 2 | 0.4331 | 0.8550 | 0.6638 | 6 |
| 3 | 0.8131 | 0.4574 | 0.3600 | 16 |
| 4 | 0.4470 | 0.8221 | 0.6347 | 8 |
| 5 | 0.2687 | 1.0167 | 0.7910 | 3 |
| 6 | 0.4766 | 0.7981 | 0.6261 | 10 |
| 7 | 0.4709 | 0.8008 | 0.6297 | 9 |
| 8 | 0.5278 | 0.7393 | 0.5835 | 14 |
| 9 | 0.4257 | 0.8440 | 0.6647 | 5 |
| 10 | 0.4959 | 0.7727 | 0.6091 | 13 |
| 11 | 0.4929 | 0.7876 | 0.6151 | 12 |
| 12 | 0.2363 | 1.0342 | 0.8140 | 2 |
| 13 | 0.2175 | 1.0668 | 0.8306 | 1 |
| 14 | 0.6079 | 0.6641 | 0.5221 | 15 |
| 15 | 0.2888 | 0.9862 | 0.7735 | 4 |
| 16 | 0.4807 | 0.8000 | 0.6246 | 11 |
| 17 | 0.4665 | 0.8122 | 0.6352 | 7 |
As for Mine 3, there are also three water sources. However, the RE value is 48.8% which is lower than those of most of the others. The RPDS value is 64.2% which is higher than the others’ values. The WI value is 0 and the DI value is 86.1%. The WWDR value is ‘very high’, which denotes that the discharge water influences severely on the environment. However, the RRL and WRL values are 9.5% and 78.5%, respectively. By the analysis of the actual circumstances, it is recommended to redesign the drainage area to increase the collection of on-site runoffs. The evaporation control measures should be implemented to reduce water loss.
3.4. Sensitivity Analysis
A sensitivity analysis was performed in order to evaluate the sensitivity of results to the weights (as shown in
Table 3). We calculated the minimum change
δk,p,q by changing
wk in small steps Δ
k(Δ
k = 0.0005) until the ranking of two optional sites is reversed or the full range of possible
wk values is explored.
We present the
δk,p,q values for several combinations of indicators in selected pairs of site cases, as shown in
Table 5. Here, k is the index of an indicator (
k = 1, … ,11).
p and
q are the indices of sites (
p = 2, … ,16,
q = 3, … ,17 (
q >
p))
.
Table 5.
The minimum weight change δk,p,q (δ′k,p,q).
Table 5.
The minimum weight change δk,p,q (δ′k,p,q).
| Indicators | Mine |
|---|
| 3 & 7 | 3 & 13 | 3 & 14 | 4 & 7 | 4 & 13 | 12 & 13 |
|---|
| NSS | N/F | N/F | N/F | 0.0097 (54.15) | N/F | N/F |
| AWQ | N/F | N/F | 0.2276 (630.42) | N/F | N/F | N/F |
| RPDS | N/F | N/F | N/F | 0.0140 (24.94) | N/F | N/F |
| WD | N/F | N/F | N/F | 0.0045 (5.05) | N/F | 0.0656 (73.15) |
| RE | N/F | N/F | 0.3019 (156.19) | −0.0205 (−10.59) | 0.3849 (199.11) | N/F |
| WLT | 0.3562 (1109.59) | N/F | N/F | −0.0049 (−15.15) | 0.4087 (1273.22) | N/F |
| WI | 0.1733 (208.25) | N/F | 0.1115 (134.01) | −0.0046 (−5.53) | N/F | N/F |
| DI | N/F | N/F | N/F | 0.0135 (14.76) | N/F | −0.0138 (−15.06) |
| WWDR | N/F | N/F | −0.1934 (−82.09) | −0.0155 (−6.57) | N/F | 0.0551 (23.38) |
| RRL | 0.5024 (498.91) | N/F | N/F | −0.0228 (−22.67) | N/F | N/F |
| WRL | N/F | N/F | 0.4087 (641.57) | 0.0047 (7.31) | N/F | 0.0231 (36.20) |
The changes in relative term δ′k,p,q are shown in the brackets. These values were computed using Equation (12). We compared all possible pairs. Due to limitations on space, we only chose the results of some typical sites, such as, Mine 13 and Mine 12 (two top sites), Mine 3 and Mine 14 (two bottom sites), Mine 4 and Mine 7 (two medium sites).
The results in
Table 5 show the ranking of Mine 3 (the bottom site) and Mine 13 (the top site) does not vary when these weights change. For
WWDR, an increment of its current weight by 82.09% will change the ranking of two bottom sites, that is, Mine 3 and Mine 14.
Taking Mine 3 as an example, PT critical criterion is found by looking for the smallest percentage δ′k,p,q of all columns, which are related to alternative Mine 3. The smallest percentage δ′9,3,14 (i.e., −82.09%) corresponds to WWDR when Mine 3 and Mine 14 are considered. PA critical criterion is found by looking for the smallest relative values of all columns. Furthermore, considering the smallest relative of all columns, PA critical criterion δ′9,2,9 is −1.63%.
If the decision maker defines the most critical criterion in absolute changes, the smallest absolute value of AT of Mine 3 is
δ7,3,14 (
i.e., 0.1115, as shown in
Table 5). AA critical criterion is found by looking for the smallest absolute value of all columns. The smallest value
δ9,2,9 is −0.0038.
3.5. Discussions
Some suggestions can be presented to assist the stakeholders in improving mine water management from the results. Firstly, RE is a significant indicator. The RE values of the two top sites (Mines 13 and 12) are both more than 80% (they are 80.84% and 82.32%, respectively). However, The RE values of the two bottom sites (Mine 3 and Mine 14) are both less than 50% (they are 48.41% and 30.10%, respectively). Therefore, raw water use needs to be minimised and worked water use is required to be increased in Mines 3 and 14.
Next, WD is also an important indicator as for input criterion. Water demand mainly includes the water that is used for CHPP, dust suppression, and underground needs. As for the top site (i.e., Mine 13), we can see that the WD value obtained from the original data is 861.64 ML/Mt, and the RPDS value by calculation is 9.8%. As to the bottom site (i.e., Mine 3), the WD value is 947 ML/Mt and the RPDS value is 64.19%, which is the highest value among those of all sites. From the above analysis, sufficient supply water should be maintained to meet water demand. If a site does not carry sufficient water stock to meet water demand, its production may be put at a risk. Therefore, an effective method is to increase water stocks. There are two options available: reducing water losses and increasing water capture. Reducing water losses is illustrated through the implementation of evaporation control. Increasing water capture is illustrated by increasing the catchment area of the worked water store. In practice, this would be achieved by a redesign of the drainage area so as to increase collection of on-site runoff flows towards the worked water store rather than shedding them from the site.
The WWDR indicator inflects the potential salinity impacts on mine water so that the discharge risk should be minimized. We cannot determine whether predicted discharges are able to meet the regulatory conditions imposed by various systems of licensing. However, a site with a worked water store that is frequently full will have a high risk of uncontrolled discharge, especially when the flow in the surrounding water body is low. Therefore, a model can be developed to optimize water storage capacity and assess cumulative impacts across the region to understand full extent of cumulative impacts of mine water discharges. This needs the detailed technical information, for example, the water volume of storages over time using long-term climate data. In addition, water capture can be minimized, which is illustrated by decreasing the worked water store catchment area. The drainage area should be redesigned so as to divert some on-site runoff flows away from the sites.
The conceptual framework offers a comprehensive method to understand the condition of mine water management. And the criteria and indicators of the decision hierarchy can be changed according to preferences. The stakeholders or managers can also adjust the local weights of criteria or indicators to evaluate the sustainability of mine water management. They can improve their management schemes according to analytic results.


 .
.


 , …, and wm. It is necessary that all weights should be normalized. The normalized weight is:


