1. Introduction
Intense urban growth during the last decades [
1], together with large-scale waterproofing of the natural soil in cities [
2] and changes in the rainfall intensity patterns in the world [
3], have led to many problems regarding flooding. This is actually the most common and costly disaster in the world [
4,
5].
Porous surfaces are one of the main Sustainable Urban Drainage Systems (SUDS) for source control in car park areas [
6,
7,
8]. Many different devices have been used to measure the infiltration capacity on-site. Some of the most widely applied field devices nowadays around the world are single-ring infiltrometers [
9], double-ring infiltrometers [
10], and the LCS (“Laboratorio de Caminos de Santander”) permeameter [
11,
12].
Previous studies, [
13], highlighted the importance of analyzing different zones within a car park bay in order to obtain a more comprehensive view of real infiltration behavior in a car park with porous surfaces. The static and dynamic loads produced by the vehicle wheels can produce permanent deformations in the pervious surface, which could affect both porosity and permeability. Moreover, the vehicle wheels are the main source of particulate matter that can clog the pervious surfaces, especially due to the compaction force produced by the vehicle loads, this effect being more important in the contact zone between wheel and surface [
14,
15].
A new methodology was created for this research. Firstly, a scheme of field tests was created by using the LCS permeameter to measure the permeability, and finally, a statistical scheme of several analyses was designed and developed specifically for this kind of on-site test.
The aim of the new methodology presented in this paper was twofold. Firstly, the analysis of the influence of the porous mixture surface type on the permeability and the reduction in the infiltration capacity after 5 years of use. Secondly, the analysis of the possible differences in the infiltration capacity in different zones within the pervious parking bays.
2. Experimental Methodology
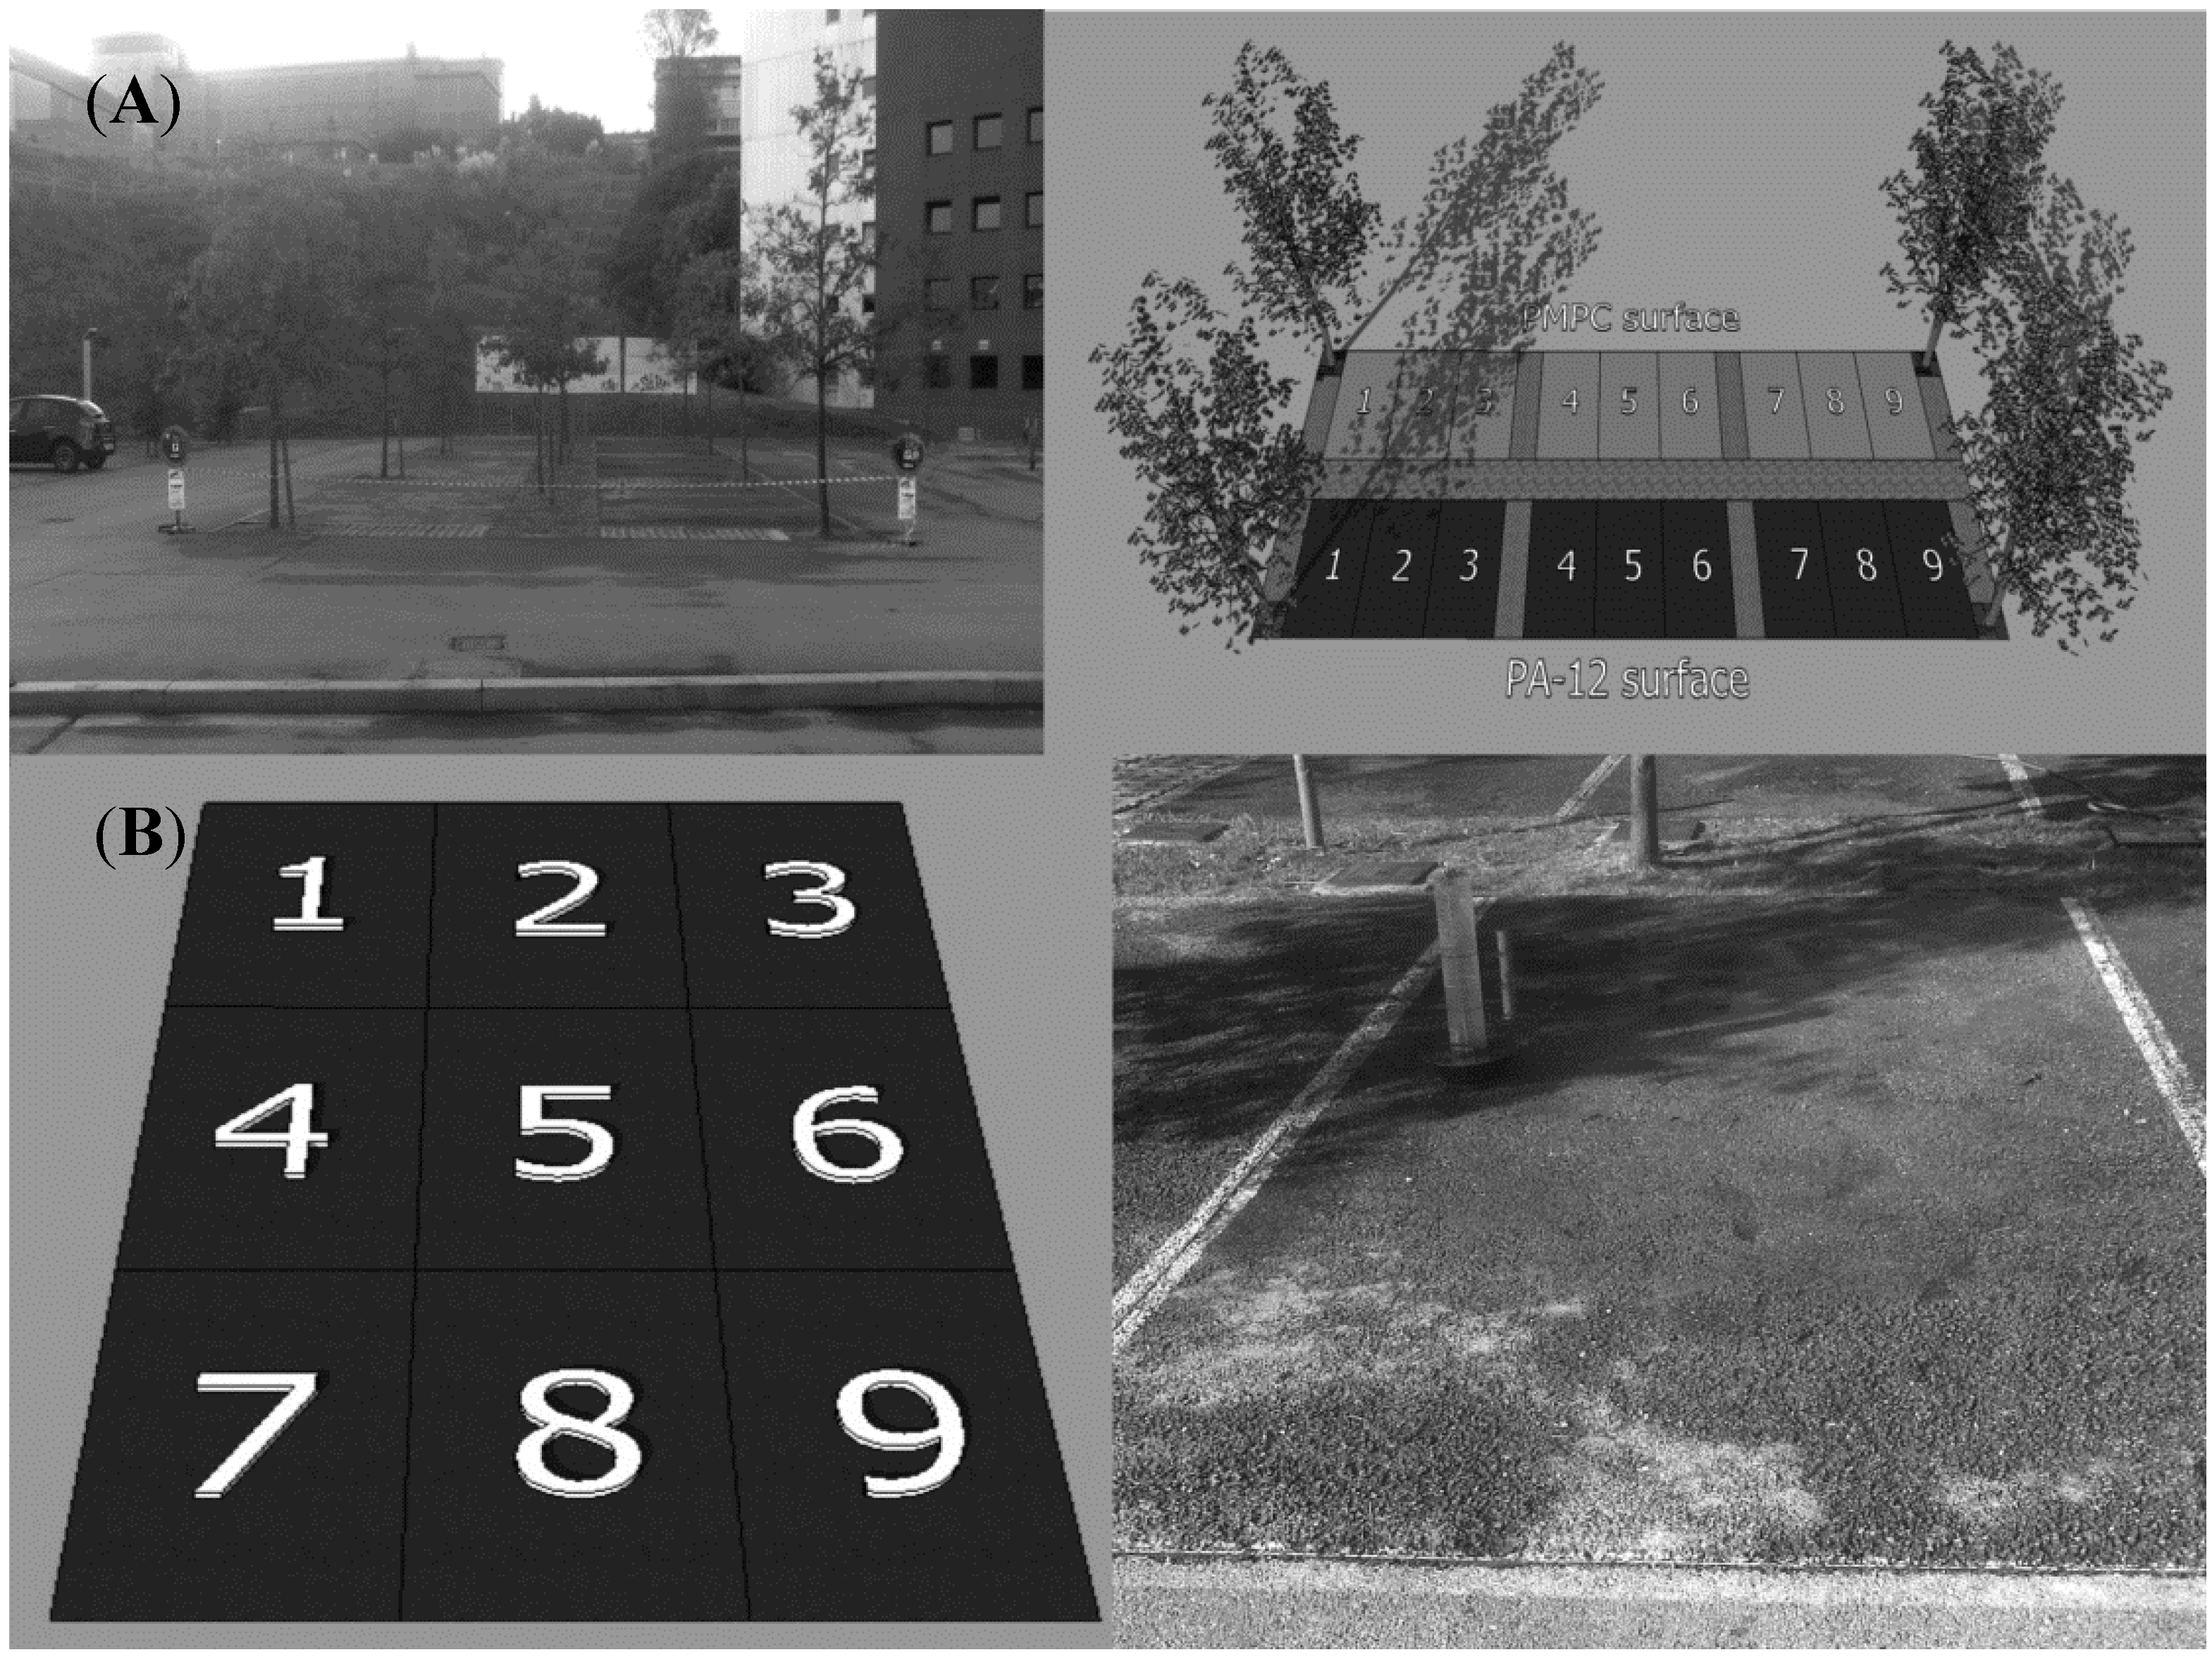
The whole study was carried out in the “Las Llamas” parking area in the University of Cantabria campus in Santander (Spain) 5 years after this car park was opened for light traffic. No maintenance operations have been carried out during this period. This parking area registers intense traffic activity every day, being nearly 100% occupied. Eighteen car parking bays of 4.2 m long and 2.4 m wide were analyzed with nine bays of Polymer Modified Porous Concrete (PMPC) and nine of Porous Asphalt (PA) surfaces (
Figure 1).
The specific characteristics of the two porous mixture surface materials used can be checked in [
12] based on the dosage recommended by [
16] for PMPC, and [
17] for PA. The high percentage of voids is remarkable, 25%–30% in the case of PMPC and 23% in the case of PA [
12], as was the thickness of both porous surfaces (80 mm).
Figure 1.
(A) Scheme of the eighteen car parking bays analyzed; and (B) measurement zones selected within each car park bay and LCS on-site.
Figure 1.
(A) Scheme of the eighteen car parking bays analyzed; and (B) measurement zones selected within each car park bay and LCS on-site.
The infiltration capacity reduction was analyzed through the permeability results obtained now (after 5 years of operational life) in each test carried out using the LCS permeameter [
18], comparing these values with those registered by [
12] for the same porous surfaces when built (0.020 m/s for the case of the PMPC surfaces and 0.012 m/s for PA surfaces on average).
Nine different points were selected within each car parking bay in order to undertake the LCS tests. Each point represents a specific zone (
Figure 1) which hypothetically could influence the infiltration capacity reduction. Points 1, 3, 7 and 9 (
Figure 1) represent the zone of the car parking bays in static contact with wheels, the zones that directly support the weight of the vehicles when parked. In contrast, points 4 and 6 (
Figure 1) represent the zones that were in dynamic contact with wheels while a vehicle is performing its parking maneuver, being part of the wheels path. Finally, points 2, 5 and 8 (
Figure 1) represent the zones that almost never have been in contact with vehicles tires.
2.1. Descriptive Analysis
The permeability results in the tests were partially described based on permeability ranges defined by [
19] for porous asphalt surfaces when using the LCS permeameter. Each measurement zone in every car park bay and all car park bays received a score based on the time taken by the LCS test, using the criteria in
Table 1. Moreover, plots of the average values of the outcome variables (permeability and reduction of the infiltration capacity) were used to analyze descriptively the infiltration behavior of the whole car parking area studied.
Table 1.
Criteria for defining the permeability of a porous mixture surface when using the LCS permeameter.
Table 1.
Criteria for defining the permeability of a porous mixture surface when using the LCS permeameter.
| Time (s) | Permeability (cm/s) | Score |
|---|
| <50 | >0.50 | Newly built |
| 50–100 | 0.25–0.50 | High |
| 100–200 | 0.13–0.25 | Medium |
| >200 | <0.13 | Poor |
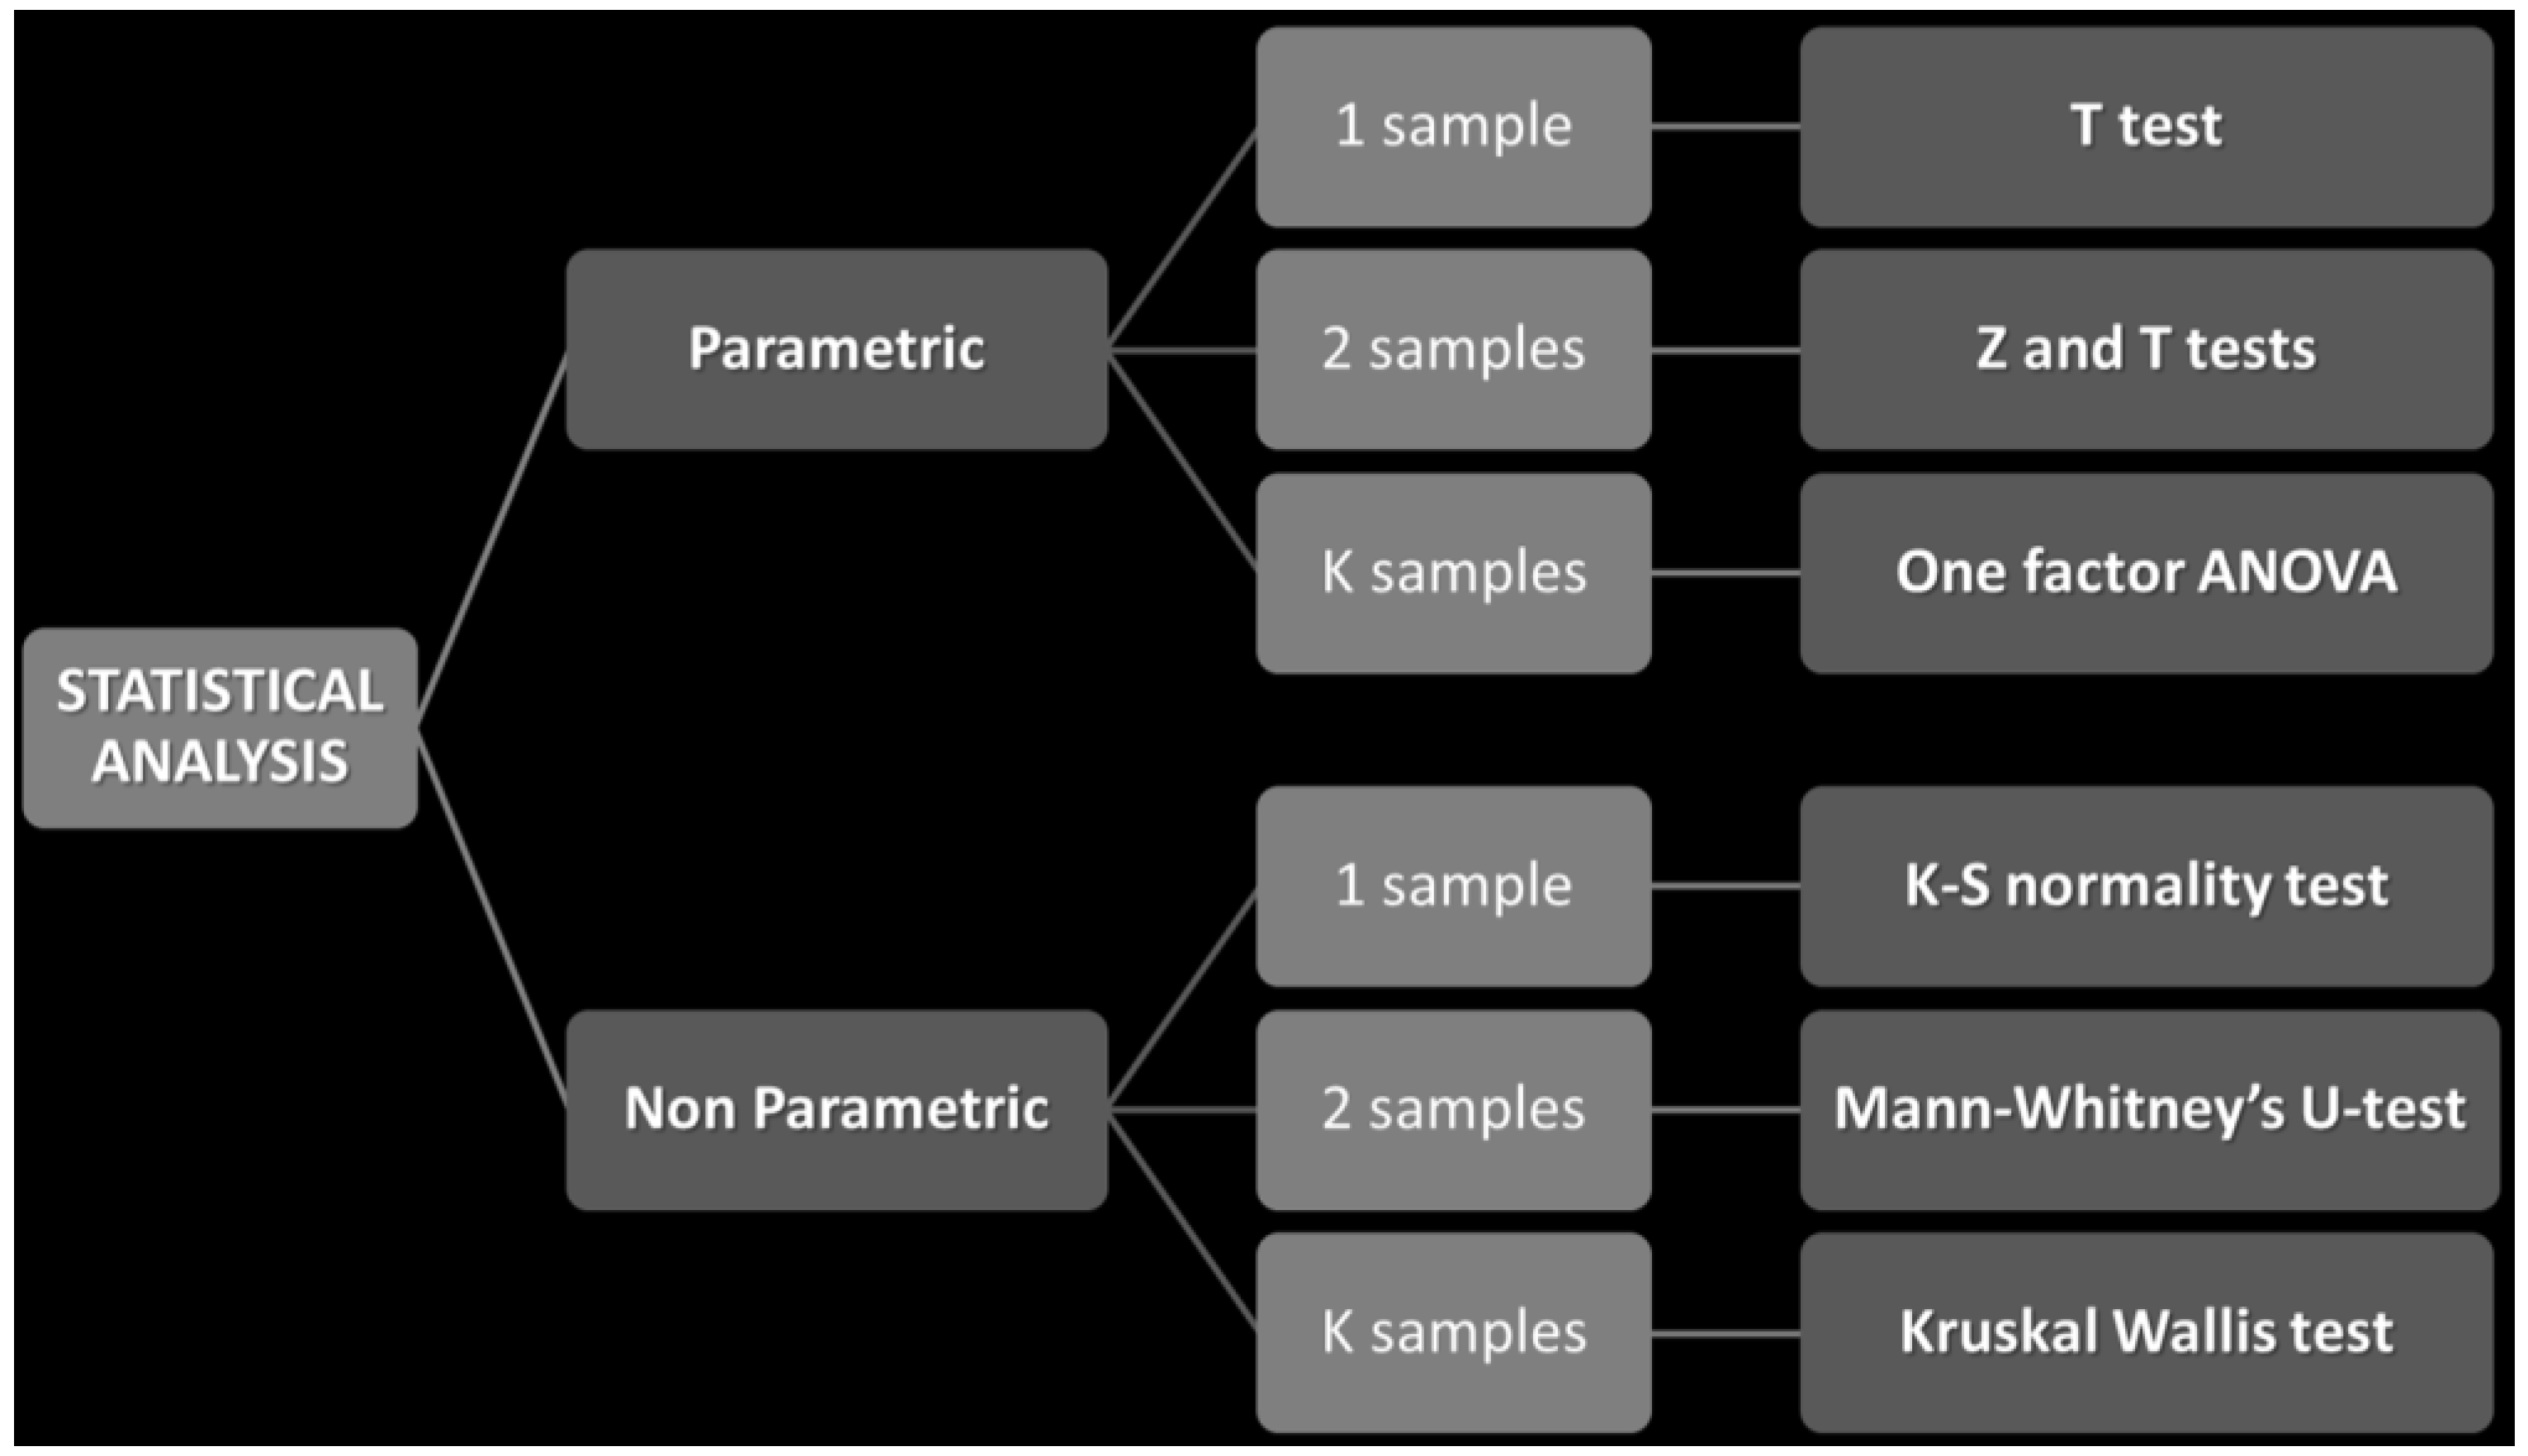
2.2. Statistical Analysis
To achieve the objectives explained in the introduction, a statistical methodology was designed, as can be seen in
Figure 2.
Figure 2.
Scheme of the statistical methodology designed.
Figure 2.
Scheme of the statistical methodology designed.
The statistical approach begins with the analysis of the normality distribution of the data in order to decide the path to follow in the statistical scheme in
Figure 2: Parametric test for normally distributed data and non-parametric test for non-normally distributed parameters. Then, a more in-depth statistical analysis was done based on different significance tests (see
Figure 2) with the aim of determining whether there are significant differences among the results obtained for the variables considered.
3. Results and Discussion
3.1. Descriptive Analysis
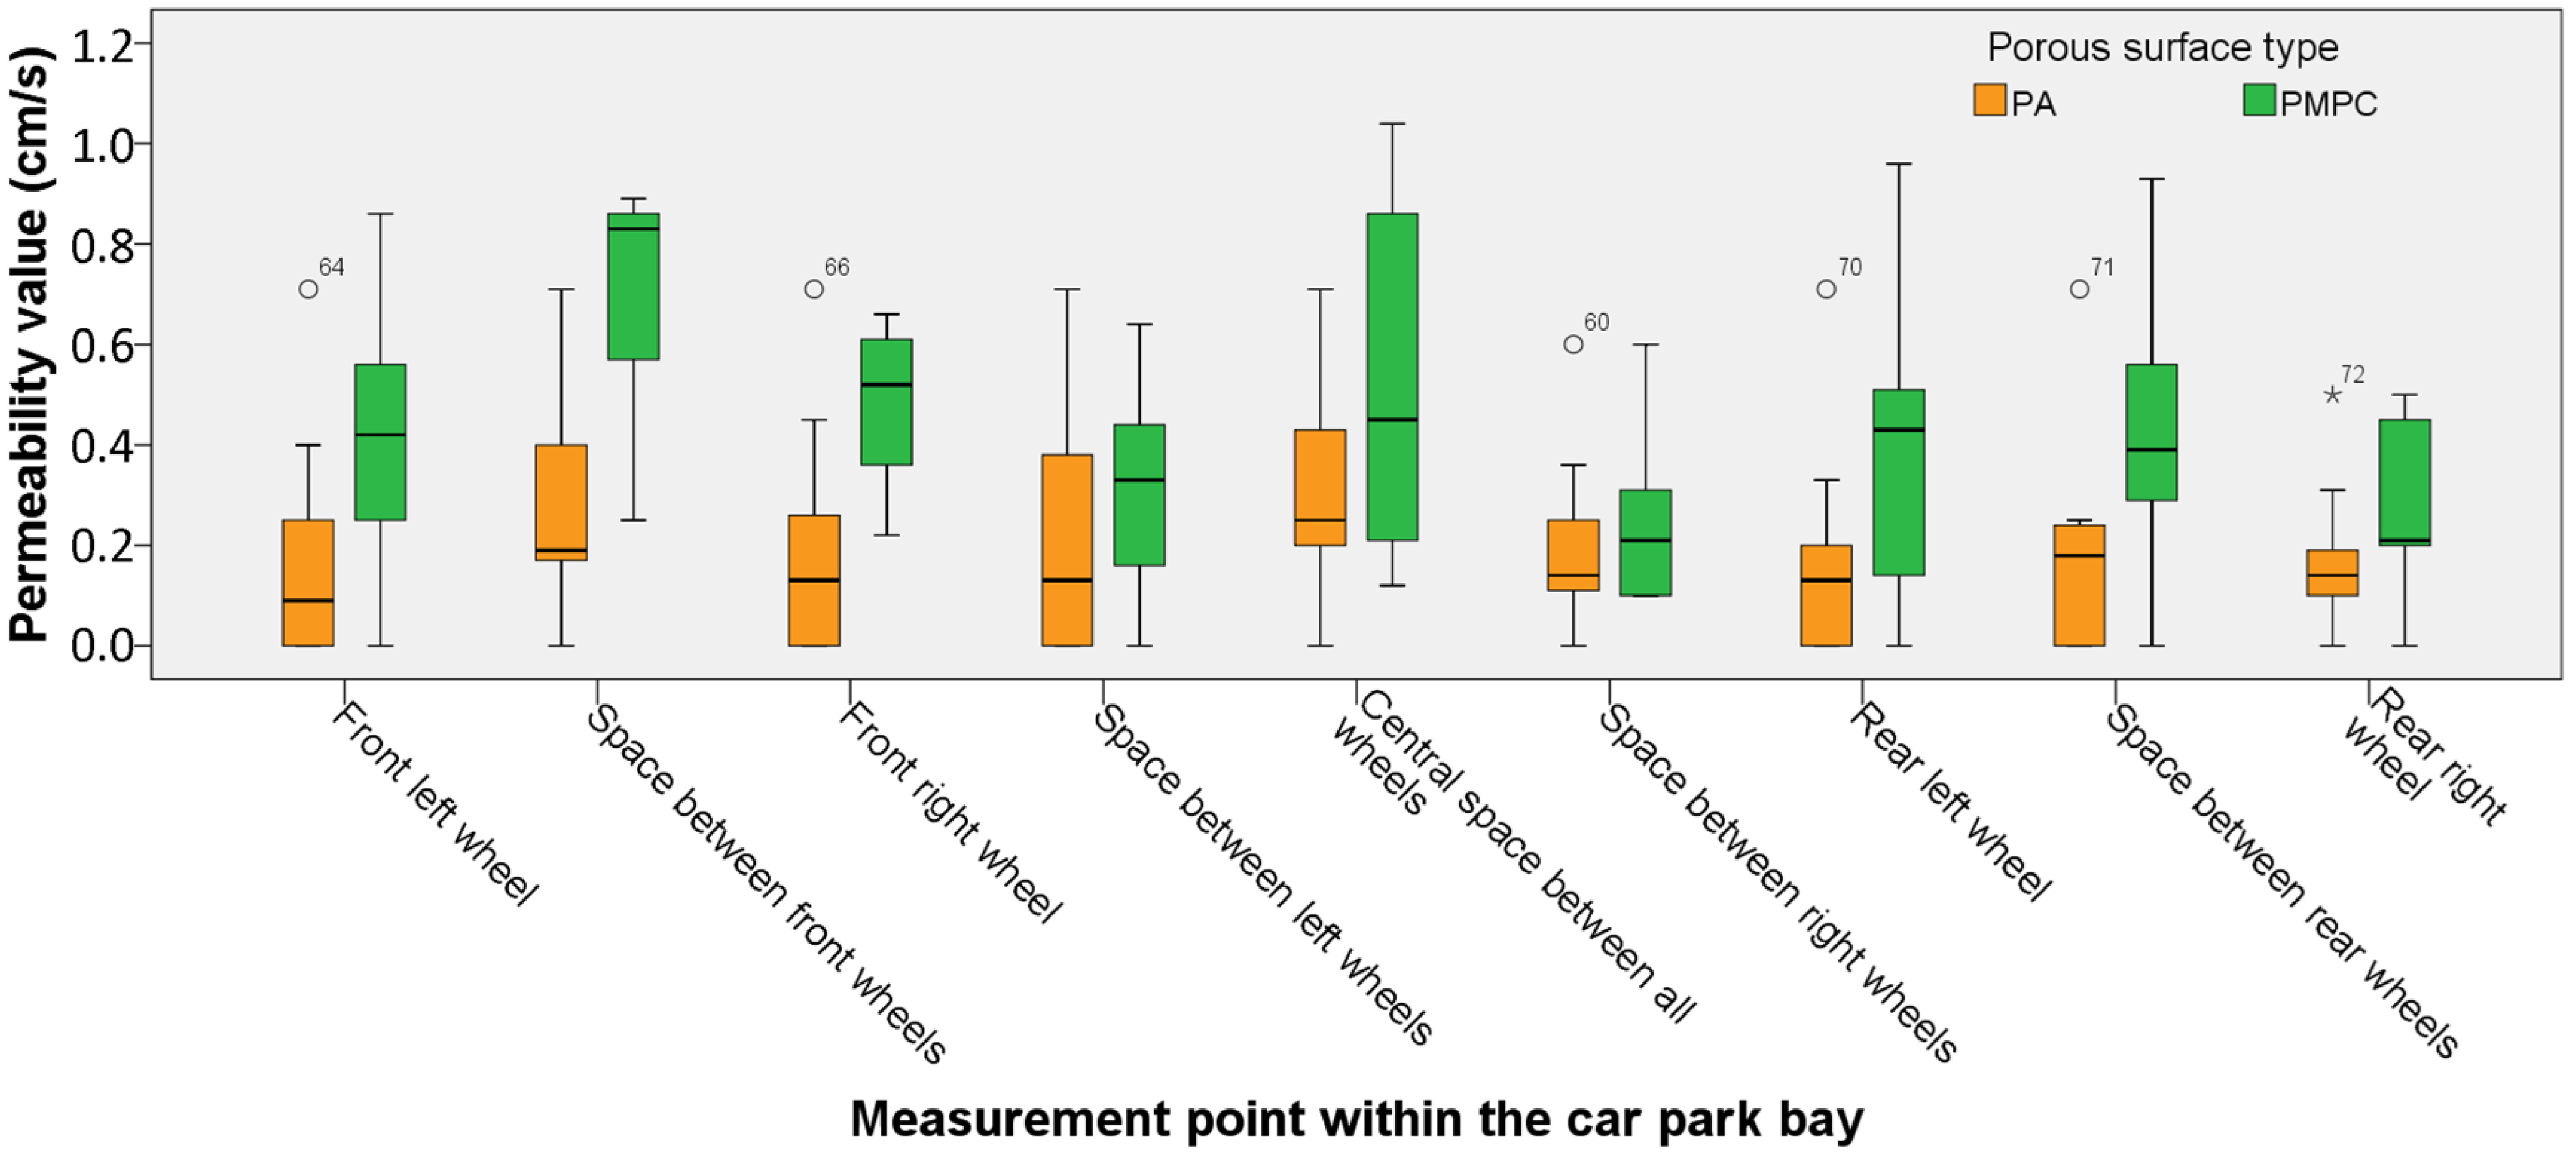
The distribution of the permeability values registered using the LCS permeameter at each measurement point of the analyzed parking bays of both types of pervious surfaces is in
Figure 3.
It can be observed descriptively that there are differences in the infiltration capacity among the different measurement zones on both types of pervious surfaces, generally showing a reduction in infiltration capacity in some wheel-surface contact zones. Considering the average permeability values in each measurement zone of each pervious surface type, the average reductions of the infiltration capacity were calculated and the results are shown in
Table 2 and
Table 3 for the PMPC and PA surfaces, respectively.
Figure 3.
Box-plots of the average values of permeability in each measurement zone of parking bays.
Figure 3.
Box-plots of the average values of permeability in each measurement zone of parking bays.
Table 2.
Average permeability and reduction of the infiltration capacity values registered in each measurement zone within each Polymer Modified Porous Concrete (PMPC) surface car park and their corresponding score.
Table 2.
Average permeability and reduction of the infiltration capacity values registered in each measurement zone within each Polymer Modified Porous Concrete (PMPC) surface car park and their corresponding score.
| Measurement zone | Permeability (cm/s) | Score | Reduction of the infiltration capacity (%) |
|---|
| 1 | 0.41 | High | 79..65 |
| 2 | 0.69 | Newly built | 65.62 |
| 3 | 0.47 | High | 76.45 |
| 4 | 0.31 | High | 84.47 |
| 5 | 0.54 | Newly built | 73.22 |
| 6 | 0.25 | High | 87.62 |
| 7 | 0.39 | High | 80.67 |
| 8 | 0.40 | High | 79.97 |
| 9 | 0.26 | High | 87.24 |
| Mean value | 0.41 | High | 79.43 |
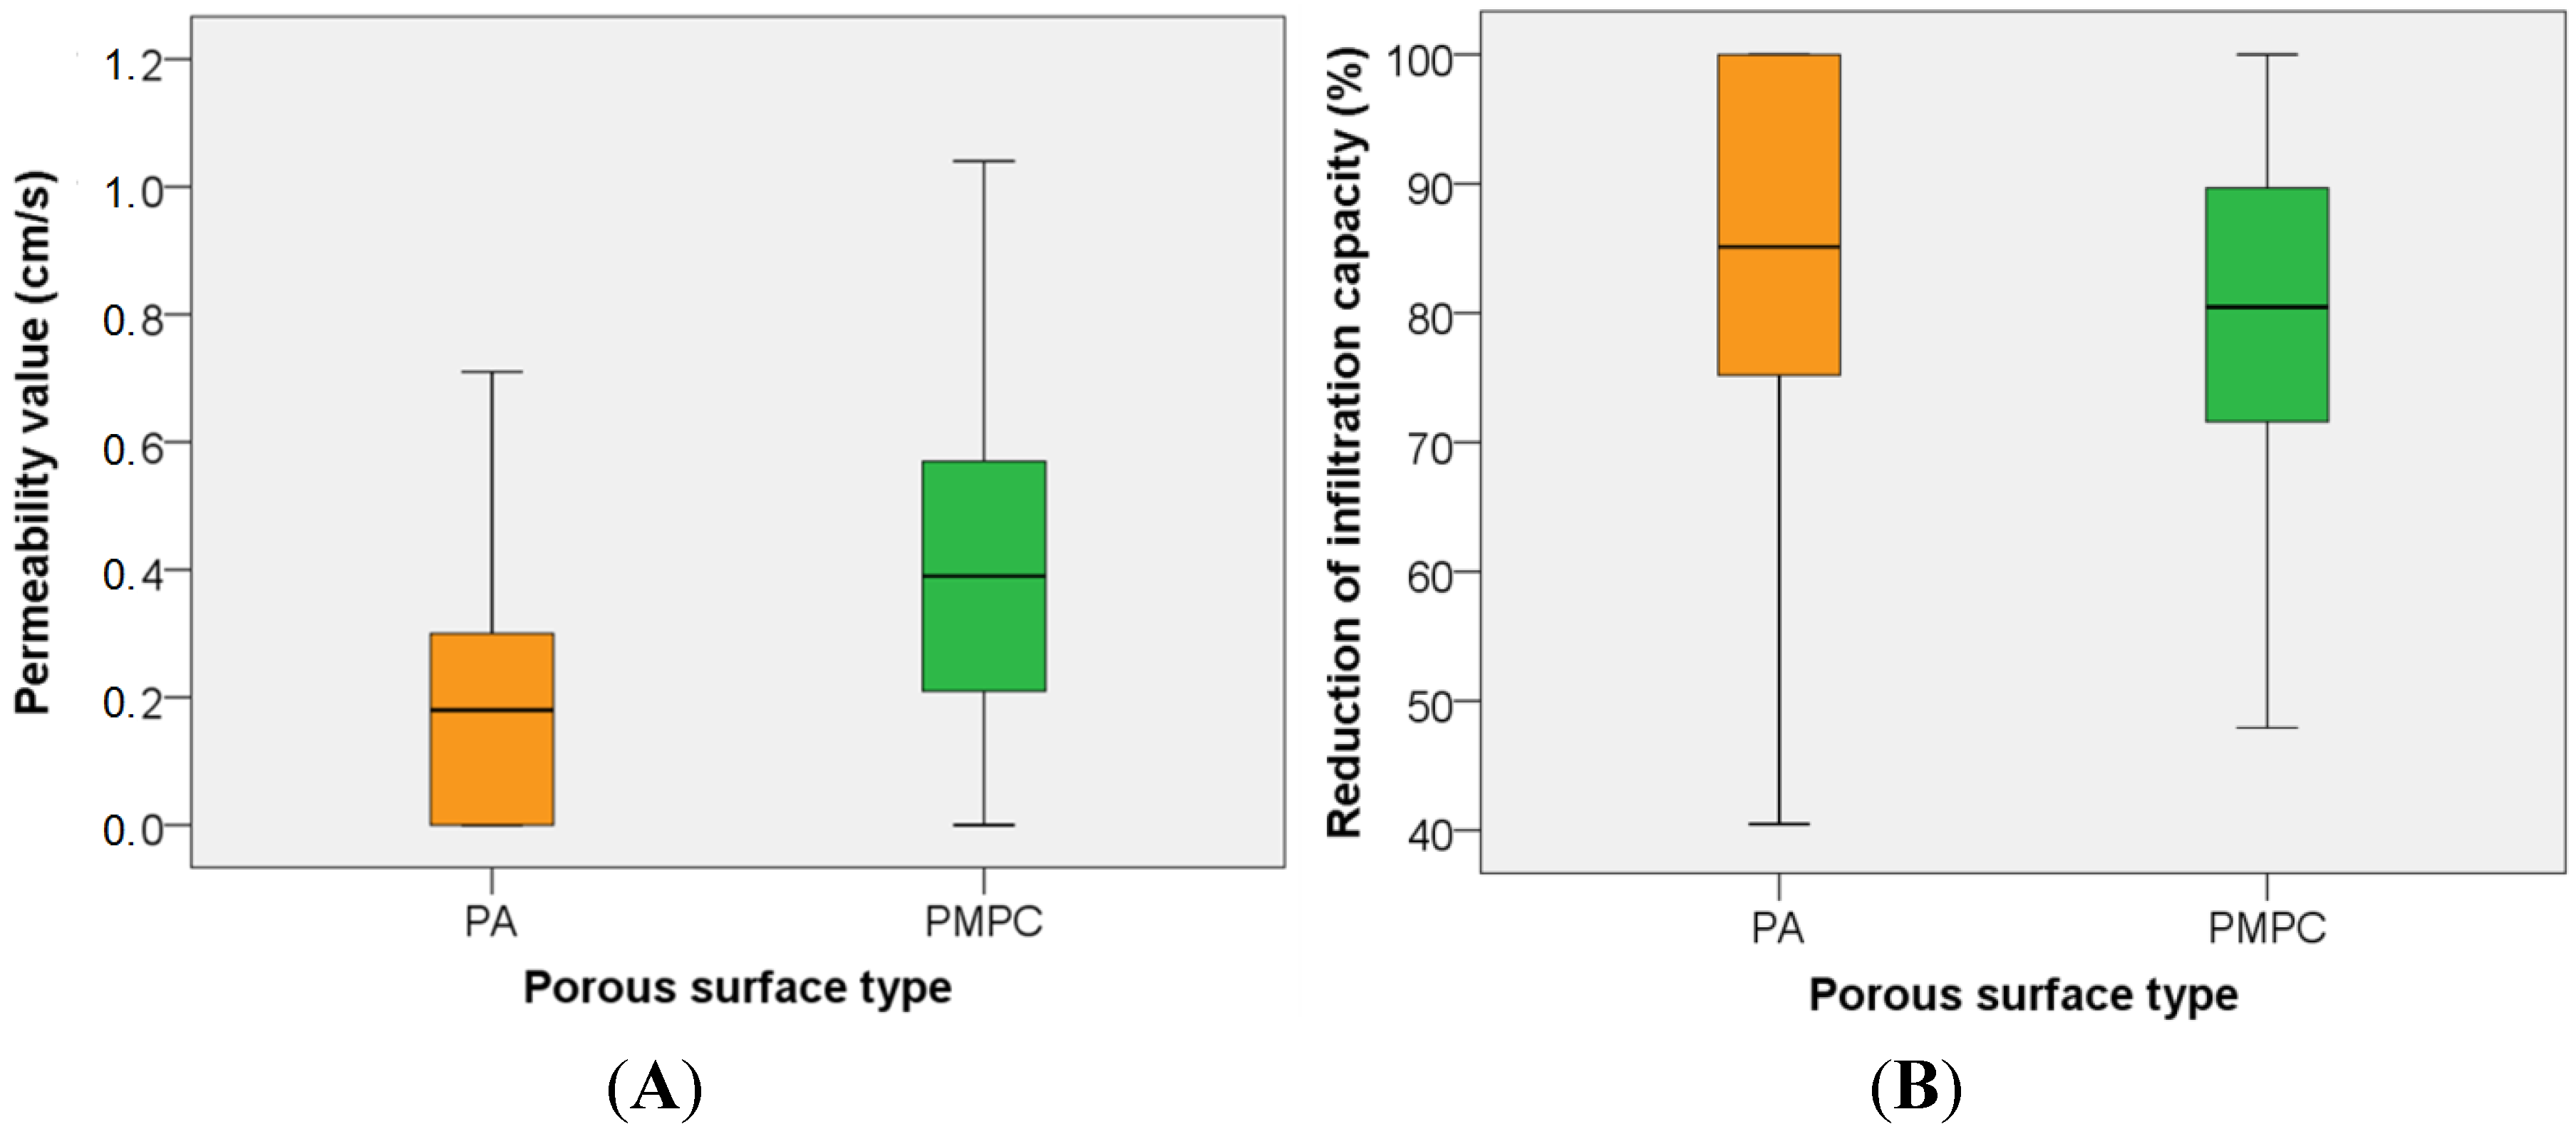
Although the average value of the PMPC surface infiltration capacity demonstrated a high decrease of 79.43% (
Table 2), the average permeability value is still high (0.41 cm/s). This value can be considered “high” in the score classification based on the criteria shown in
Table 1. A highly similar decrease in the average reduction of the infiltration capacity was found in
Table 3 for the PA surface (82.04%). However, the average score was “medium” for PA surfaces. This indicated possible problems in the future with the permeability behavior of this surface.
As can be seen in the box-plots in
Figure 4, average PMPC permeability was almost double that of PA (0.41 cm/s for PMPC and 0.22 cm/s for PA), while the reduction in the infiltration capacity on both porous mixture surfaces was quite similar (79.43% in the case of the PMPC surface and 82.04% in the case of the PA surface).
Table 3.
Average permeability and reduction of the infiltration capacity values registered in each measurement zone within each Porous Asphalt (PA) surface car park and their corresponding score.
Table 3.
Average permeability and reduction of the infiltration capacity values registered in each measurement zone within each Porous Asphalt (PA) surface car park and their corresponding score.
| Measurement zone | Permeability (cm/s) | Score | Reduction of the infiltration capacity (%) |
|---|
| 1 | 0.20 | Medium | 83.52 |
| 2 | 0.27 | High | 77.46 |
| 3 | 0.21 | Medium | 82.40 |
| 4 | 0.22 | Medium | 81.70 |
| 5 | 0.30 | High | 74.85 |
| 6 | 0.21 | Medium | 82.57 |
| 7 | 0.17 | Medium | 85.61 |
| 8 | 0.18 | Medium | 85.05 |
| 9 | 0.18 | Medium | 85.23 |
| Mean value | 0.22 | Medium | 82.04 |
Figure 4.
Box-plots of the average values of permeability (A) and the reduction of the infiltration capacity (B).
Figure 4.
Box-plots of the average values of permeability (A) and the reduction of the infiltration capacity (B).
3.2. Statistical Analysis
The first step was to check the normality of both outcome variables by using the Kolmogorov-Smirnov test. Neither variable had a normal distribution. Therefore, non-parametric significance analyses were carried out (
Figure 2), by using a Mann-Whitney test for the type of porous mixture surface (two samples: PMPC and PA) and a Kruskal Wallis test for the measurement zone (9 samples: zones 1 up to 9) (
Table 4).
Significance tests shown in
Table 4 demonstrate that only the type of porous mixture surface significantly influenced permeability results, while neither the type of porous surface nor the measurement zone influenced the reduction in infiltration capacity.
Table 4.
Mann-Whitney and Kruskal Wallis significance tests for the outcome variables.
Table 4.
Mann-Whitney and Kruskal Wallis significance tests for the outcome variables.
| Significance test | Parameter | Permeability | Reduction of the infiltration capacity |
|---|
| Mann-Whitney * | U de Mann-Whitney | 1888.5 | 2716.5 |
| Asymptotic significance | 0.000 | 0.058 |
| Kruskal Wallis ** | Square Chi | 12.493 | 13.329 |
| Asymptotic significance (bilateral) | 0.131 | 0.101 |
Once the influence of the porous mixture surfaces has been demonstrated in
Table 4, it is only necessary to verify the real influence of the measurement zone on the outcome variables for each type of porous mixture surface. With this aim, the normality and homoscedasticity of both outcome variables was analyzed as an initial step. PMPC surface permeability and reduction in infiltration capacity results were distributed according to a normal and homoscedastic distribution, while in the case of the PA surface, these results were not normal. Thus, in order to use the same test for both types of pervious surfaces, a Kruskal Wallis test was done to analyze the influence of the measurement zone on the outcome variables (
Table 5) based on the statistical scheme shown in
Figure 2.
Table 5.
Significance analyses for k-independent samples (measurement zones) by using Kruskal Wallis test.
Table 5.
Significance analyses for k-independent samples (measurement zones) by using Kruskal Wallis test.
| Type of surface | Statistical Significance Test | Permeability | Reduction of the infiltration capacity |
|---|
| PMPC | Square ChiChi | 17.752 | 17.742 |
| Significance (bilateral) | 0.023 | 0.023 |
| PA | Square Chi | 4.397 | 4.522 |
| Significance (bilateral) | 0.820 | 0.807 |
The results shown in
Table 5 demonstrate the influence of the measurement zone on permeability values and on the reduction in infiltration capacity obtained after 5 years of use in car parking bays made of PMPC. However, in the case of PA, no influence was identified.
Therefore, both the statistical methodology and the measurement zones shown in this article can be used for present and future research when using the LCS permeameter to study the infiltration behavior of porous mixture surfaces on-site during their operational life.
4. Conclusions
The statistical methodology described in this article has proven its efficiency in this particular scenario. Therefore, this methodology could be used in similar investigation in order to prove the general suitability of materials used in infiltration surfaces
In this field study, permeability is significantly different for PMPC and PA surfaces after 5 years of use, as it was at the beginning of their operational life, the PMPC surfaces having higher permeability values.
No significant differences were found between PMPC and PA surfaces regarding their infiltration capacity reduction after 5 years of use.
The measurement zones proposed for this research for analyzing the infiltration capacity behavior of a porous surface car parking bay after 5 years have demonstrated a significance influence of the zone on permeability results for PMPC surfaces.
No significant differences were identified among all the measurement zones for PA surfaces, its infiltration behavior being quite uniform after 5 years of use.
Acknowledgments
This study was funded by the Spanish Ministry of Economy and Competitiveness through the research projects BIA2009-08272 and BIA2012-32463 with funds from the State General Budget (PGE) and the European Regional Development Fund (FEDER). The authors wish to thank the Santander Roads Group (GCS) and Construction Technology Research Group (GITECO) of the University of Cantabria, the Sustainable Drainage Applied Research Group of the Coventry University, and the companies SIEC S.A., Hanson-Formpave, Bloques Montserrat S.L. and DANOSA for their collaboration. Luis A. Sañudo-Fontaneda would also like to thank the Ministry of Economy and Competitiveness for the Researcher Formation Fellowship (FPI) funding for his research activity in the University of Cantabria.
Author Contributions
The four co-authors designed the research methodology, specifically Luis A. Sañudo-Fontaneda and Valerio C.A. Andrés-Valeri carried out the test in the car park and the statistical analysis of the results, while Jorge Rodriguez-Hernandez and Daniel Castro-Fresno validated the analysis, lead the discussion and stated the final conclusions.
Conflicts of Interest
The authors declare no conflict of interest.
References
- Eigenbrod, F.; Bell, V.A.; Davies, H.N.; Heinemeyer, A.; Armsworth, P.R.; Gaston, K.J. The impact of projected increases in urbanization on ecosystem services. Proc. R. Soc. B Biol. Sci. 2011, 278, 3201–3208. [Google Scholar] [CrossRef]
- Swan, A. How increased urbanisation has induced flooding problems in the UK: A lesson for African cities? Phys. Chem. Earth 2010, 35, 643–647. [Google Scholar] [CrossRef]
- Christensen, J.H.; Christensen, O.B. Climate modelling: Severe summertime flooding in Europe. Nature 2003, 421, 805–806. [Google Scholar] [CrossRef]
- Barredo, J.I. Major flood disasters in Europe: 1950–2005. Nat. Hazards 2007, 42, 125–148. [Google Scholar] [CrossRef]
- Huang, X.; Tan, H.; Zhou, J.; Yang, T.; Benjamin, A.; Wen, S.W.; Li, S.; Liu, A.; Li, X.; Fen, S.; et al. Flood hazard in Hunan province of China: An economic loss analysis. Nat. Hazards 2008, 47, 65–73. [Google Scholar] [CrossRef]
- Gomez-Ullate, E.; Castillo-Lopez, E.; Castro-Fresno, D.; Bayon, J.R. Analysis and contrast of different pervious pavements for management of storm-water in a parking area in northern Spain. Water Resour. Manag. 2011, 25, 1525–1535. [Google Scholar] [CrossRef]
- Castro-Fresno, D.; Andrés-Valeri, V.C.A.; Sañudo-Fontaneda, L.A.; Rodríguez-Hernández, J. Sustainable drainage practices in Spain, specifically focused on pervious pavements. Water 2013, 5, 67–93. [Google Scholar] [CrossRef]
- Sañudo-Fontaneda, L.A.; Rodriguez-Hernandez, J.; Vega-Zamanillo, A.; Castro-Fresno, D. Laboratory analysis of the infiltration capacity of interlocking concrete block pavements in car parks. Water Sci. Technol. 2013, 67, 675–681. [Google Scholar]
- Li, H.; Kayhanian, M.; Harvey, J.T. Comparative field permeability measurement of permeable pavements using ASTM C1701 and NCAT permeameter methods. J. Environ. Manag. 2013, 118, 144–152. [Google Scholar] [CrossRef]
- Al-Rubaei, A.M.; Stenglein, A.L.; Viklander, M.; Blecken, G.T. Long-term hydraulic performance of porous asphalt pavements in northern Sweden. J. Irrig. Drain. Eng. 2013, 139, 499–505. [Google Scholar] [CrossRef]
- Fernández-Barrera, A.H.; Castro-Fresno, D.; Rodríguez-Hernández, J.; Calzada-Pérez, M.A. Infiltration capacity assessment of urban pavements using the LCS permeameter and the CP infiltrometer. J. Irrig. Drain. Eng. 2008, 134, 659–665. [Google Scholar] [CrossRef]
- Sañudo-Fontaneda, L.A.; Rodriguez-Hernandez, J.; Calzada-Pérez, M.A.; Castro-Fresno, D. Infiltration behaviour of polymer-modified porous concrete and porous asphalt surfaces used in SUDS techniques. Clean Soil Air Water 2014, 42, 139–145. [Google Scholar] [CrossRef]
- Kayhanian, M.; Anderson, D.; Harvey, J.T.; Jones, D.; Muhunthan, B. Permeability measurement and scan imaging to assess clogging of pervious concrete pavements in parking lots. J. Environ. Manag. 2012, 95, 114–123. [Google Scholar] [CrossRef]
- Gruber, I.; Zinovik, I.; Holzer, L.; Flisch, A.; Poulikakos, L.D. A computational study of the effect of structural anisotropy of porous asphalt on hydraulic conductivity. Constr. Build. Mater. 2012, 36, 66–77. [Google Scholar] [CrossRef]
- Coleri, E.; Kayhanian, M.; Harvey, J.T.; Yang, K.; Boone, J.M. Clogging evaluation of open graded friction course pavements tested under rainfall and heavy vehicle simulators. J. Environ. Manag. 2013, 129, 164–172. [Google Scholar] [CrossRef]
- Pindado, M.Á; Aguado, A; Josa, A. Fatigue behavior of polymer-modified porous concretes. Cem. Concr. Res. 1999, 29, 1077–1083. [Google Scholar] [CrossRef]
- Bustos, G.; Pérez, E. Pliego de Prescripciones Técnicas Generales Para Obras de Carreteras y Puentes, 5th ed.; Ediciones LITEAM: Madrid, Spain, 2007. [Google Scholar]
- EN 12697-40 Bituminous Mixtures. Test Methods for Hot Mix Asphalt. Part 40: In situ Drainability; European Standard ICS 93.080.20; European Committee for Standardization: Brussels, Belgium, 2005.
- Pérez Jiménez, F.E.; Calzada Pérez, M.A. Analysis and Evaluation of the Performance of Porous Asphalt: The Spanish Experience. In Proceedings of the Surface Characteristics of Roadways: International Research and Technologies, Papers of the First International Symposium on Surface Characteristics, State College, PA, USA, 8–9 June 1988.
© 2014 by the authors; licensee MDPI, Basel, Switzerland. This article is an open access article distributed under the terms and conditions of the Creative Commons Attribution license (http://creativecommons.org/licenses/by/3.0/).

 ,
, 


