Article

The Prediction Methods for Potential Suspended Solids Clogging Types during Managed Aquifer Recharge

Key Laboratory of Groundwater Resources and Environment, Ministry of Education, Jilin University, Changchun 130021, China
*
Author to whom correspondence should be addressed.
Water 2014, 6(4), 961-975; https://doi.org/10.3390/w6040961
Submission received: 17 February 2014 / Revised: 24 March 2014 / Accepted: 11 April 2014 / Published: 22 April 2014

Abstract

:
The implementation and development of managed aquifer recharge (MAR) have been limited by the clogging attributed to physical, chemical, and biological reactions. In application field of MAR, physical clogging is usually the dominant type. Although numerous studies on the physical clogging mechanism during MAR are available, studies on the more detailed suspended clogging types and its prediction methods still remain few. In this study, a series of column experiments were inducted to show the process of suspended solids clogging process. The suspended solids clogging was divided into three types of surface clogging, inner clogging and mixed clogging based on the different clogging characteristics. Surface clogging indicates that the suspended solids are intercepted by the medium surface when suspended solids grain diameter is larger than pore diameter of infiltration medium. Inner clogging indicates that the suspended solids particles could transport through the infiltration medium. Mixed clogging refers to the comprehensive performance of surface clogging and inner clogging. Each suspended solids clogging type has the different clogging position, different changing laws of hydraulic conductivity and different deposition profile of suspended solids. Based on the experiment data, the ratio of effective medium pore diameter (Dp) and median grain size of suspended solids (d50) was proposed as the judgment index for suspended solids clogging types. Surface clogging occurred while Dp/d50 was less than 5.5, inner clogging occurred while Dp/d50 was greater than 180, and mixed clogging occurred while Dp/d50 was between 5.5 and 180. In order to improve the judgment accuracy and applicability, Bayesian method, which considered more ratios of medium pore diameter (Dp) and different level of grain diameter of suspended solids (di), were developed to predict the potential suspended solids types.

1. Introduction

With the background of global water scarcity, actively promoting water reuse and excess water storage technology helps solve the problem of groundwater and surface water shortage attributed to uncertain climatic factors. Managed aquifer recharge (MAR) is one of the most effective methods to augment the groundwater resources [1,2,3]. It may form part of conjunctive use schemes, or be applied to increase water availability and improve water quality.
Conventional recharge water resources including native groundwater, potable water and surface water were primarily used in MAR. In recent years, with the growing interest in non-conventional resources, quality and health issues have been raised [4]. Improvements to water quality via MAR have been demonstrated to reduce organic matter [5,6], trace organic compounds [7], nitrogen [8]. Bacteria and virus transport during MAR is another one major concern with using recycled water [9,10,11]. The water quality change and its related health risks still are the main topics for MAR researches.
Clogging issue has been another main limited factor for the implementation of MAR around the world. According to the investigation on 207 groundwater recharge systems in Maryland, USA, the rate of loss function system attributed to clogging increased to 50% in 1990 from 33% in 1986 [12]. Clogging is generally caused by inter-dependent mechanisms that are often hard to distinguish [13,14,15]. The classification of clogging into physical, chemical and biological processes is quite standard [16]. The role of suspended particles in clogging was recognized early and was often evidenced as the main clogging mode during MAR process [17,18,19]. It has been observed to depend on the total mass of suspended solids and particle size distribution of the porous media with reduction in basin recharge rates well described by an exponential decay function [20]. The main source of suspended solids mainly comes from recharge water and may also generates from aquifer matrix because of hydrodynamic and hydrochemical function [21,22]. The mechanisms of suspended solids clogging including filtration and deposition function. Modified fouling index (MFI) was mainly used to assess clogging potential of artificial recharge well [23]. Turbidity and concentration of suspended solids of recharge water are the main two common water quality indexes to assess potential of clogging [24,25]. But the judgment criterion for suspended solids clogging is still not uniform. Siriwardene NR et al. (2007) showed that physical clogging was mainly caused by the migration of sediment particles that are less than 6 μm in diameter [26]. Okubo and Matsumoto (1983) showed that physical clogging problems would not occur if the suspended solids (SS) level of recharge water utilized for ASR is <2 mg/L [27]. However, Pavelic et al. (1998) showed that physical clogging problems did not exhibited at a stormwater MAR site in South Australia even when SS > 25 mg/L [22]. The recommend limitation of TSS < 100 mg/L was proposed by Winter (2013) [28]. These experiments were conducted to study the MAR clogging problem from the perspective of the nature of suspended solids and do not comprehensively consider the properties of porous media. Thus, the proposed criteria are mostly applicable at limited field conditions. This article was tried to give a more detailed classification for suspended solids clogging and propose prediction methods to predict the potential clogging types. This would be helpful to prevent and control suspended solids clogging during MAR design and operation.

2. Materials and Methods

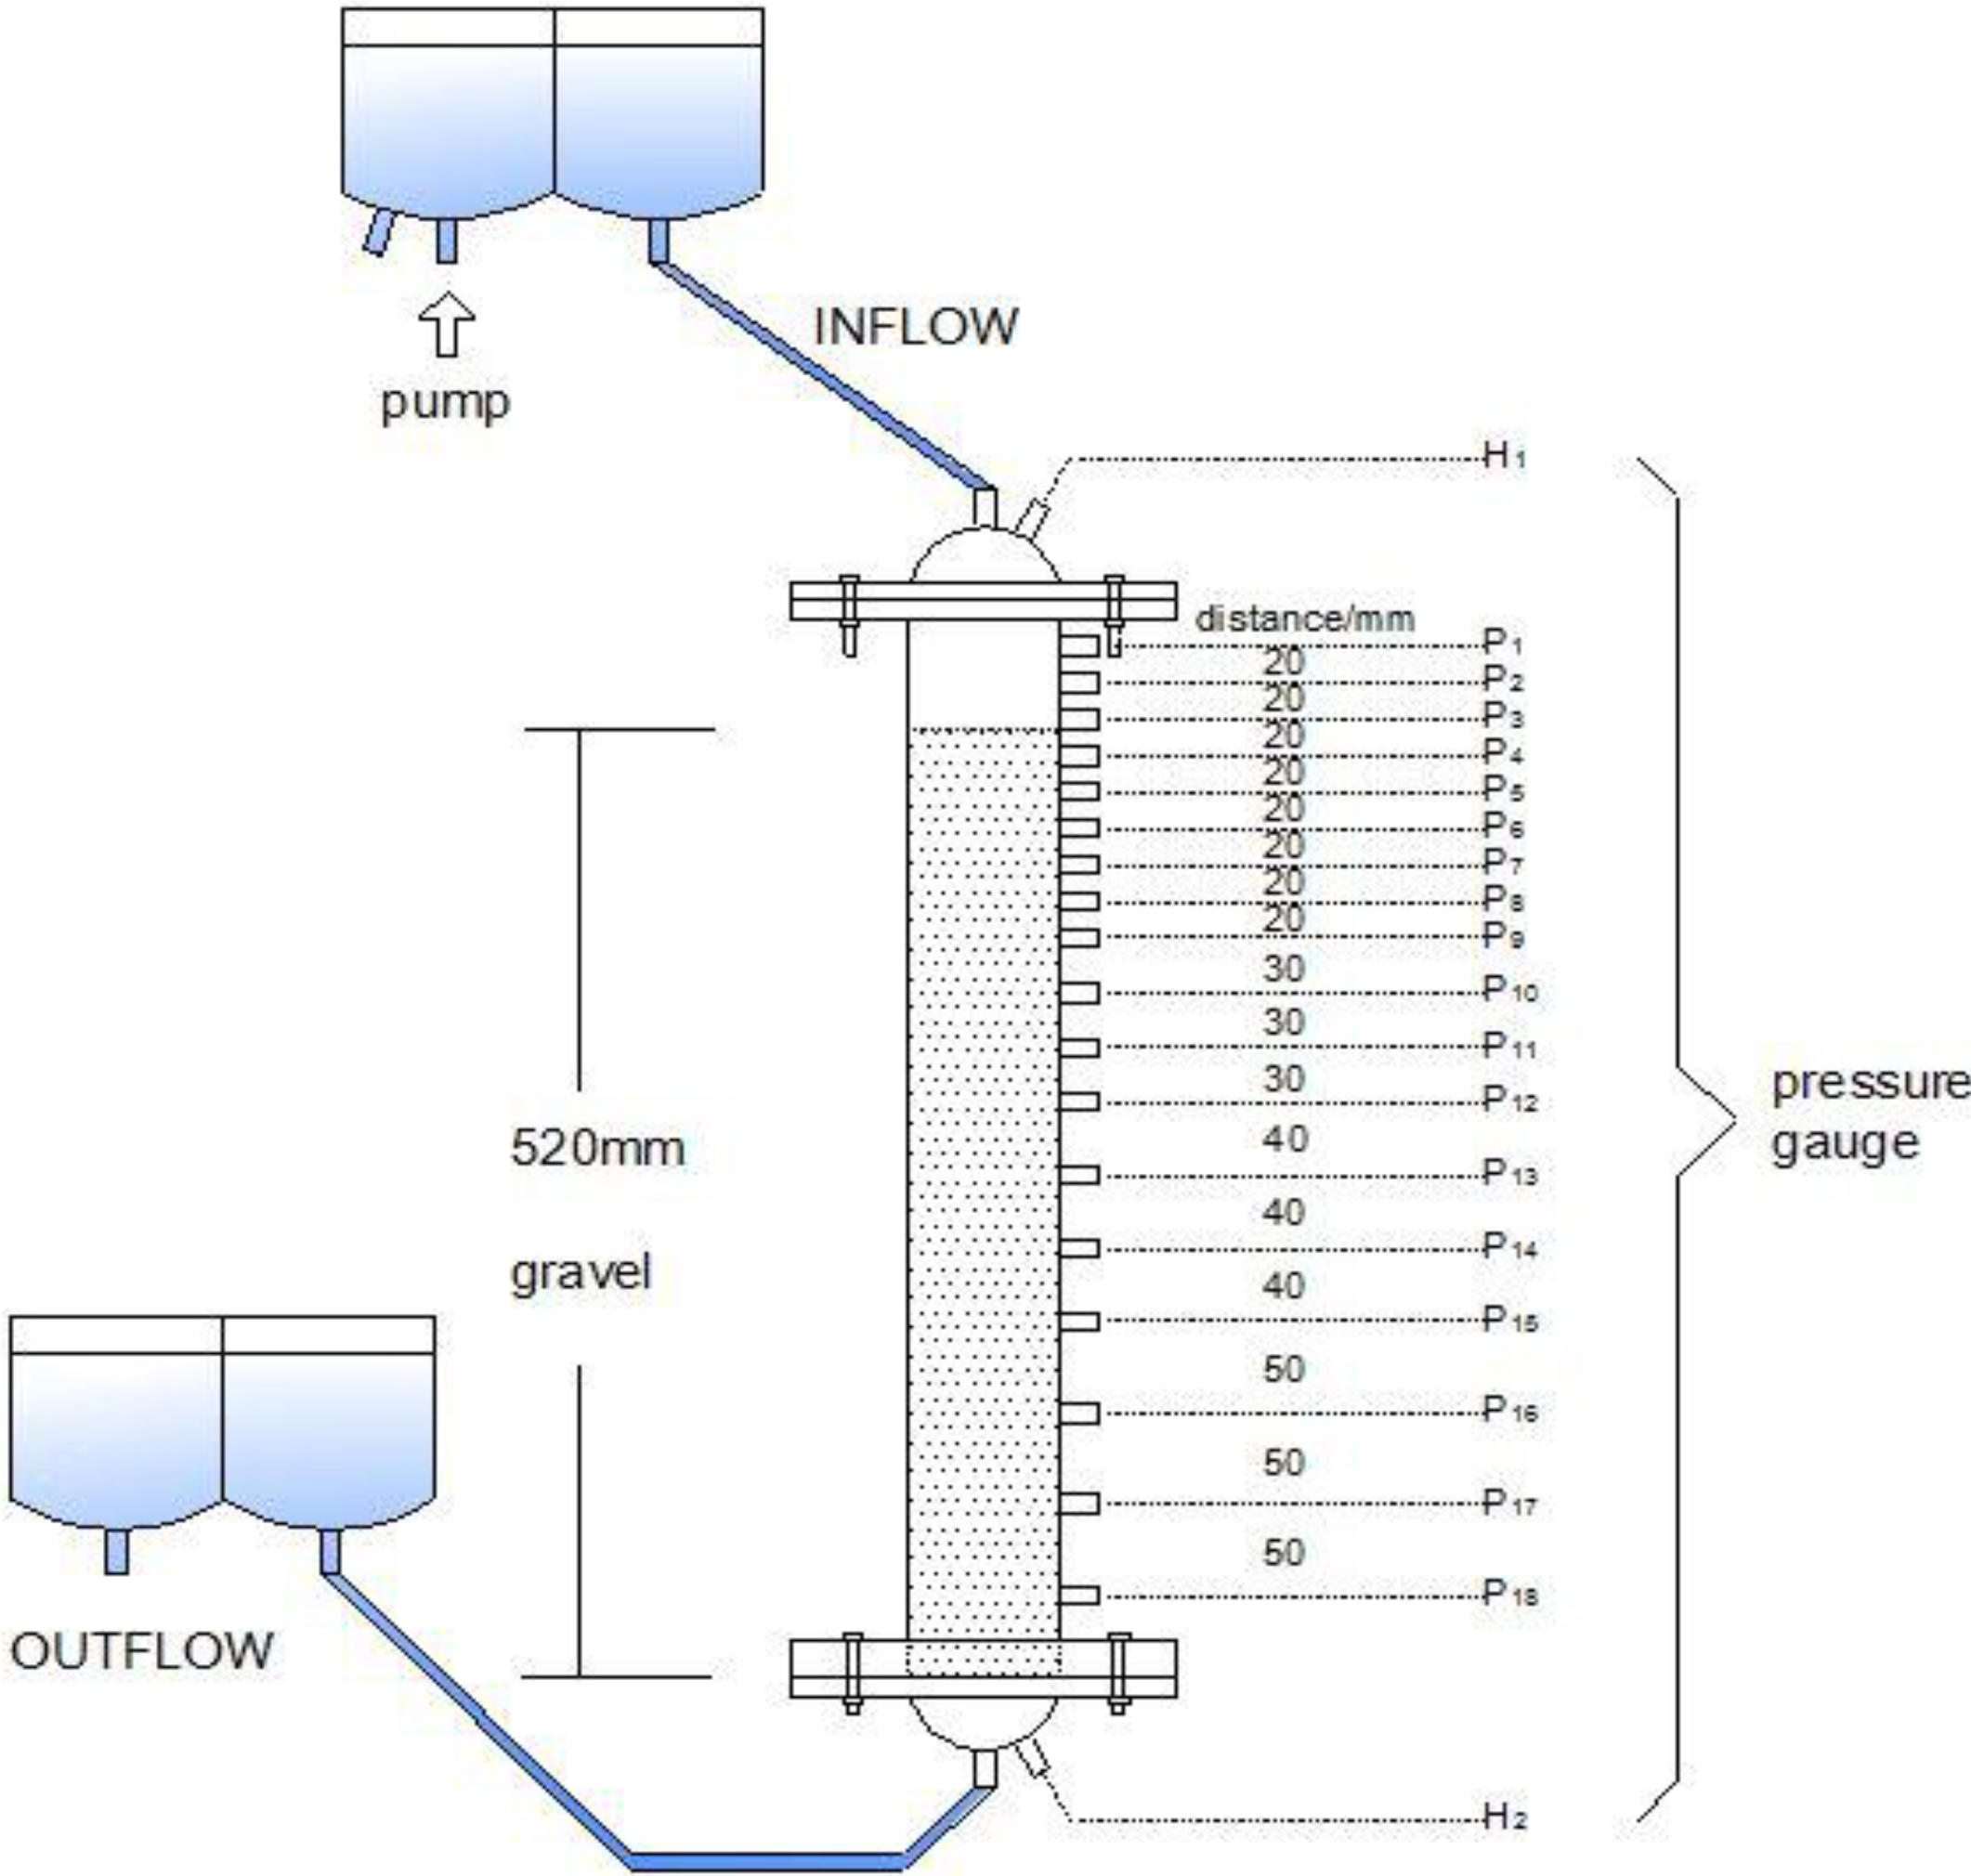
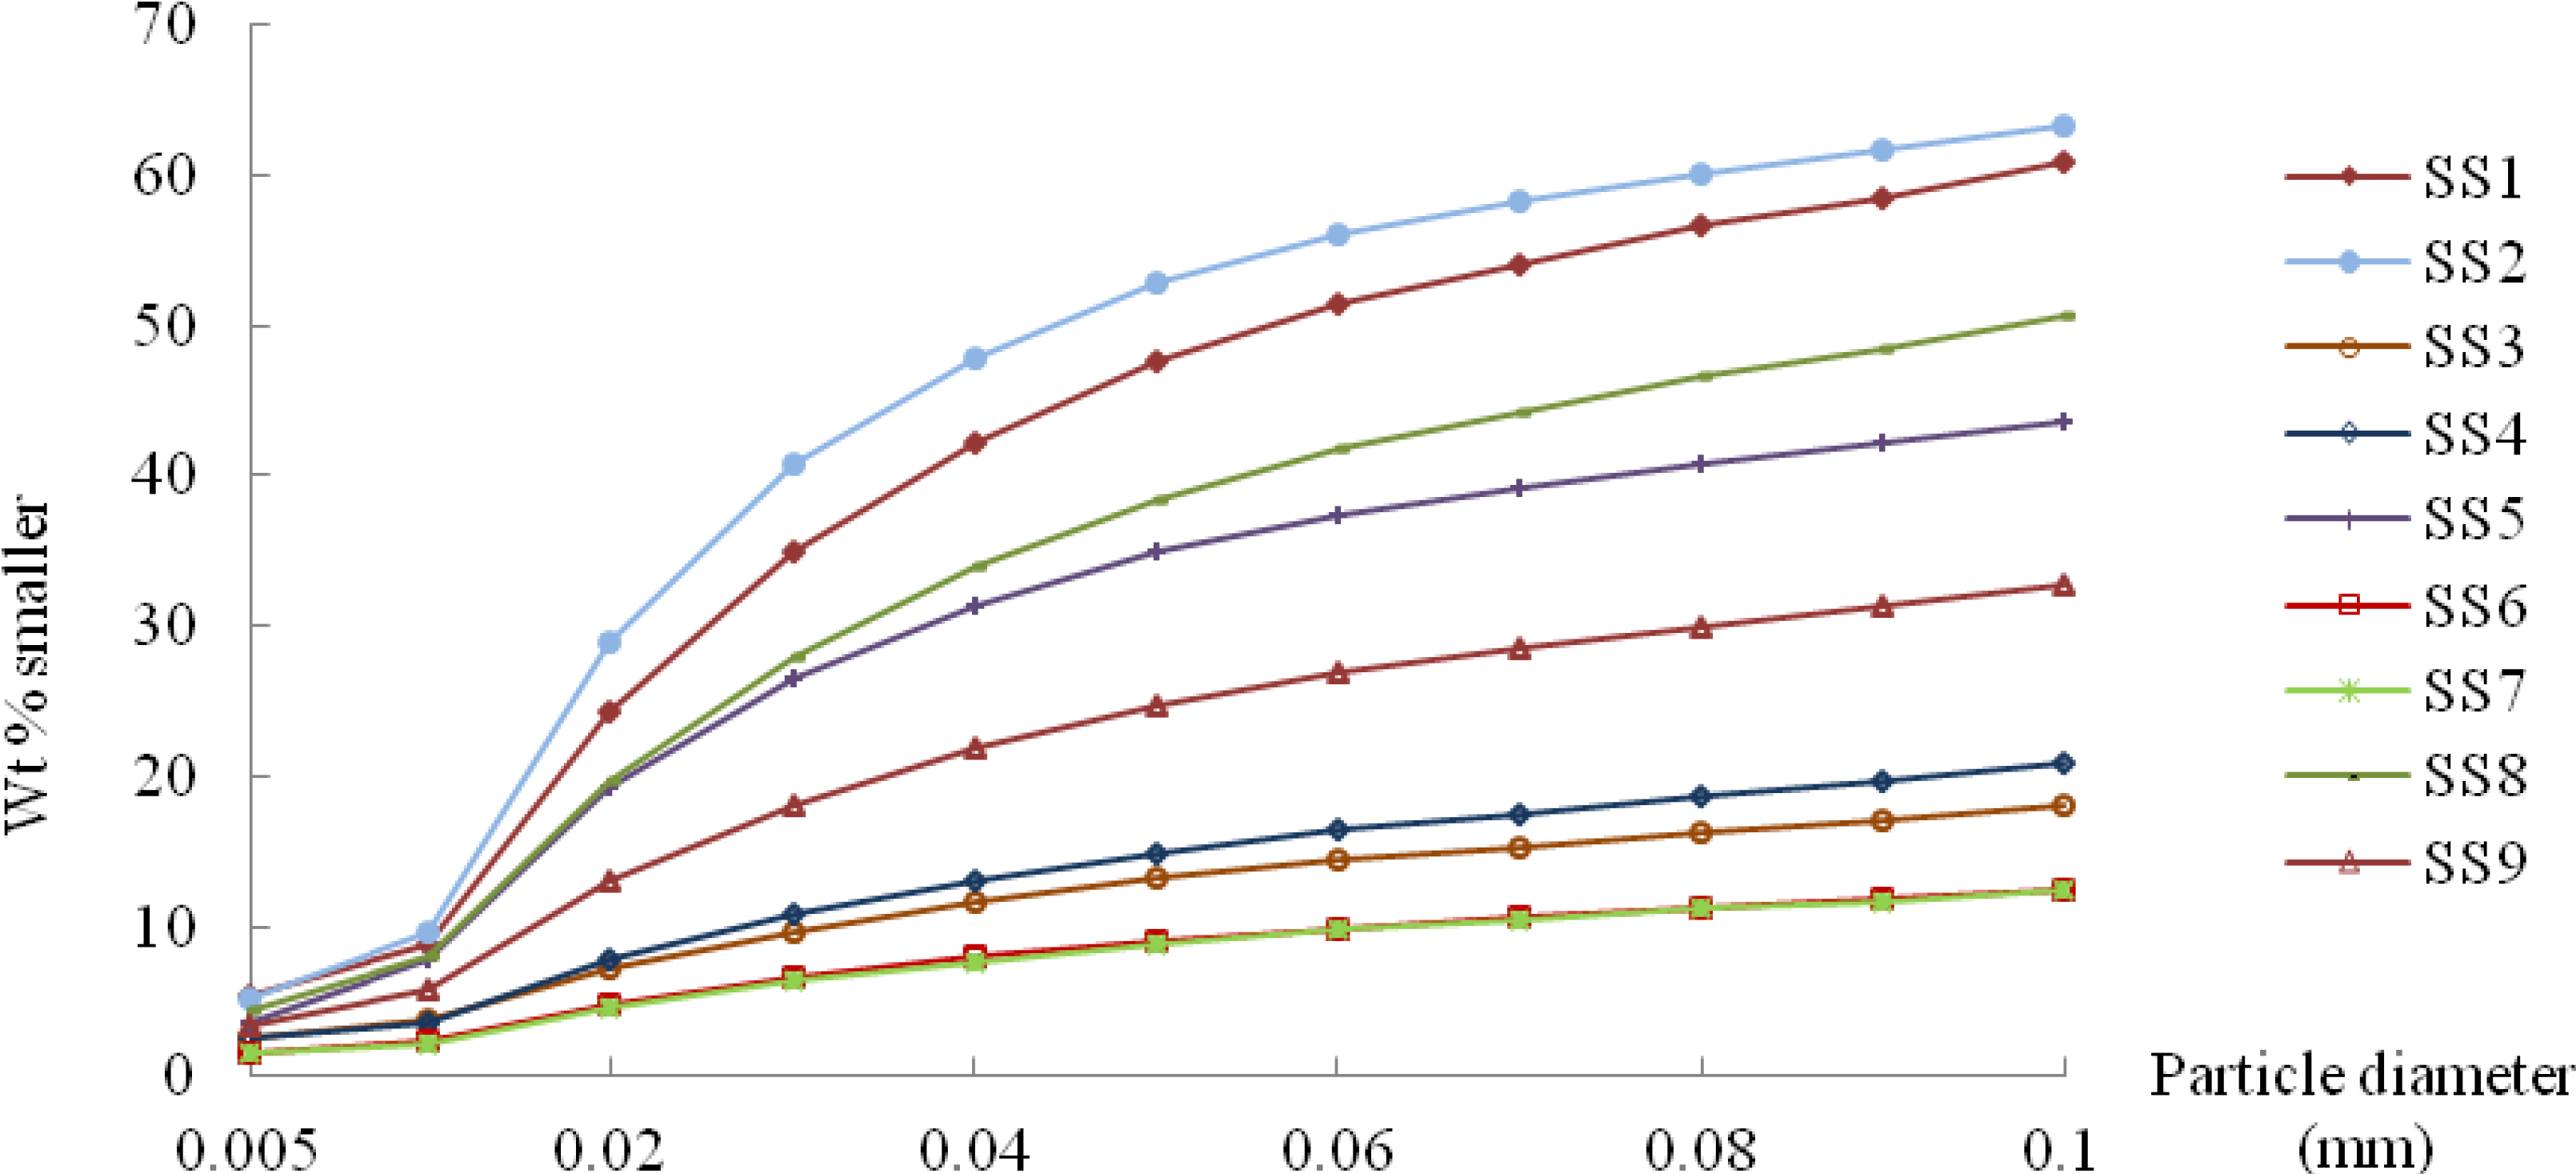
2.1. Lab-Based Approach

A MAR laboratory experimental system included four parts: water supply tank with circulation function (includes a submersible pump with a maximum pump head of 5 m and maximum output 5500 L/h), upper and lower constant-head controller for water supply and drainage (adjustable range is 0 to 1.5 m), experimental seepage column (580 mm in height and with 80 mm inside diameter and is made of Plexiglas), and pressure observation panel. Piezometer tubes were distributed along the experimental column (Figure 1).
Figure 1. Schematic diagram of aquifer recharge managed simulated system.
Water 06 00961 g001
Highly purified Quartz sand and river sand (predominant mineral composition was quartz, with a small amount of feldspar) were adopted as the infiltration medium. The columns were packed with quartz sand in increments of 1cm according to its natural density of 1.6 g/cm3.
The suspended solids were collected from lowlands of a field site after a storm event. The particle diameter distribution was measured by TCZ-4 particle analyzer and showed in Figure 2. The coarse particles of diameter greater than 0.1 mm were removed because this part is easily to removal by pretreatment. All the selected suspended solids samples were mixed together. X-ray diffraction (XRD) pattern showed that dominant mineral composition is quartz, Alkali feldspar and Plagioclase (Table 1).
Table 1. Mineralogy of suspended solids.
Sample No.SS1SS2SS3SS4SS5SS6SS7SS8SS9
Quartz374246473843564749
Alkali feldspar111617221114101415
Plagioclase202321221830212221
Calcite834442486
Illite-smectite mixed-layer622043340
Illite12860155206
Kaolinite553493443
Amphibole111110010
Figure 2. Particle diameter distribution of suspended solids.
Water 06 00961 g002
The ultra-purified water was produced by machine of ELGA Option R7 and the main characteristics are as follow: TSS = 0 mg/L, TDS = 0 mg/L to 2 mg/L. The recharge water adopted in these lab experiments was mixed sieved suspended solids and ultra-purified water with total suspended solids (TSS) equals to 1000 mg/L and total dissolved solids (TDS) equals to 4 mg/L to 6 mg/L.
The recharge water was feed up from a water tank to the upper constant head controller, flow throughout the column and then discharge via the lower constant head controller. The columns were initially flushed for 4 h with purified water before the experiments to clear any potential pollutants in the infiltration sand. During the operation period, a submersible pump was placed at the bottom of water tank and was used to continuously feed water into the upper constant-head water level controller; the water infiltrated through the columns at a hydraulic gradient of 1. Surplus water overflowed from the upper level controller and was recycled into the water tank.
The flow rate and hydraulic head along the infiltration path were observed every 2 h or 4 h manually. TDS was measured using a Multi-parameter Water Quality Portable Meter every 2 h. TSS of inflow and outflow was measured using a PARTECH 740 monitor every 2 h. The time-varying hydraulic conductivity at different positions of the sand columns was calculated based on Darcy’s law (Equation (1)):
Water 06 00961 i001
where Q (m3/d) is the flow rate; l (m) is the distance between any two piezometric tubes along the column; Δh (m) is the hydraulic head difference at a distance of l; and r (m) is the inner diameter of the column. The clogging degree at different position can be expressed by the ratio of hydraulic conductivity (K) and its initial hydraulic conductivity (K0). If the value of K/K0 is less than 1, that means clogging has happened at the specific time and specific position.
At the end of experiment, the sand in column was excavated one centimeter at a time. The suspended solids were separated from each sand sample through the procedures of wash, separation, drying and weight.
Seventeen experiments (Table 2) were conducted to simulate the suspended solids clogging process. Coarse sand (I) (sieve number 10 to 20), coarse sand (II) (sieve number 20 to 40), medium sand (sieve number 40 to 70), fine sand (sieve number 70 to 150), and mixed sand (sieve number 20 to 150 with equal amounts of fine sand, medium sand, and coarse sand (II)) were adopted as the infiltration medium. The grain diameters of suspended solids in recharged water were 0.075 mm to 0.05 mm, 0.05 mm to 0.0385 mm, less than 0.0385 mm, and less than 0.013 mm.
Table 2. Ratios of infiltration medium effective pore diameter (Dp) and levels of suspended solids grain diameter (di).
Experiment No.Medium and Dp (mm)di (mm)Dp/d10Dp/d20Dp/d30Dp/d40Dp/d50Dp/d60Dp/d70Dp/d80Dp/d90
E2Coarse sand (I), 0.453<0.013453.0348.5266.5215.7181.2151.0129.5105.480.89
E4Coarse sand (II), 0.1080.075–0.052.082.001.931.861.771.711.641.591.52
E50.05–0.03852.772.702.632.572.512.452.352.302.25
E6<0.038513.5012.0010.809.828.317.206.355.404.15
E7<0.013108.083.0863.5351.4343.2036.0030.8625.1219.29
E9Medium sand, 0.0660.075–0.051.271.221.181.141.081.051.000.970.93
E100.05–0.03851.691.651.611.571.531.501.431.401.38
E11<0.03858.257.336.606.005.084.403.883.302.54
E12<0.01366.0050.7738.8231.4326.4022.0018.8615.3511.79
E14Fine sand, 0.0460.075–0.050.880.850.820.790.750.730.700.680.65
E150.05–0.03851.181.151.121.101.071.051.000.980.96
E16<0.03855.755.114.604.183.543.072.712.301.77
E17<0.01346.0035.3827.0621.9018.4015.3313.1410.708.21
E19Mixed sand (I), 0.0780.075–0.051.501.441.391.341.281.241.181.151.10
E200.05–0.03852.001.951.901.861.811.771.701.661.63
E21<0.03859.758.677.807.096.005.204.593.903.00
E22<0.01378.0060.0045.8837.1431.2026.0022.2918.1413.93
Note: * Experiments of E1, E3, E8, E13 and E19 are the background references which recharge water is only ultra-purified water.

2.2. Prediction Methods of Suspended Solids Clogging Types

Suspended solids clogging types would be vary depending on the magnitude relation between infiltration medium pore diameter and suspended solids grain diameter. For the quantitative representation of the relationship among medium pore, suspended solids, and clogging type, the calculation for the conversion of effective grain diameter to the effective pore diameter is realized using the effective pore diameter formula (Equations (2) and (3)) proposed by Glover and Walker (2009) [29]:
Deff = 2θreff = θDp
where,
Water 06 00961 i002
where Deff (mm) is the effective grain diameter; θ (dimensionless) is the theta transform; reff (mm) is the effective pore radius; Dp (mm) is the effective pore diameter; a is a parameter thought to be equal to 8/3 for three-dimensional samples composed of quasi-spherical grains; m (dimensionless) is the cementation exponent; and n (dimensionless) is the porosity. In this study, the prediction analysis of the suspended solids clogging type can be achieved using two methods: the ratio of infiltration medium pore diameter and suspended solids grain diameter and the Bayesian method [30] based on multi ratios of infiltration medium pore diameter and suspended solids grain diameter.

2.2.1. Ratio of Pore Diameter (Dp) and Grain Diameter (d)

Using the ratio of infiltration medium pore diameter and a suitable suspended solids grain diameter as indicator and according to the classification results of the experimental samples, the critical value of discriminant index was determined to differentiate various types of suspended solids physical clogging.

2.2.2. Bayesian Discrimination Method

G1, G2, … Gg are g p-dimensional normal population, and each population has equal covariance matrix. After the calculation, the Bayesian discriminant functions for multiple populations (Equation (4)) could be obtained:
Water 06 00961 i003
where qi is prior probability of each population; and ni is the number contained in ith population Gi.
In practical application, if μi and Σi are unknown, training samples could be used for estimation, that is, the sample average Water 06 00961 i004 and sample dispersion matrix St/n of the training samples can be used.
Water 06 00961 i005
Water 06 00961 i006
Water 06 00961 i007
where xik is the ith sample in the kth population; k = 1, 2, …, g; Water 06 00961 i008 is the estimate of the kth population average μk; Water 06 00961 i009 is the estimate of the population covariance matrix Σ; and Sk is the intragroup covariance matrix of number k population.
If the misclassification loss is c(j|i) (i, j = 1, 2, …, g), let c(i|i) = 0. Here, Bayesian discrimination criterion is:
Water 06 00961 i010
The discrimination criterion could be interpreted as follows: for a given pending sample x, the calculated g p-dimensional normal population, the maximum of which at x Wk(x) belongs to Gi, is called the category of the pending sample.

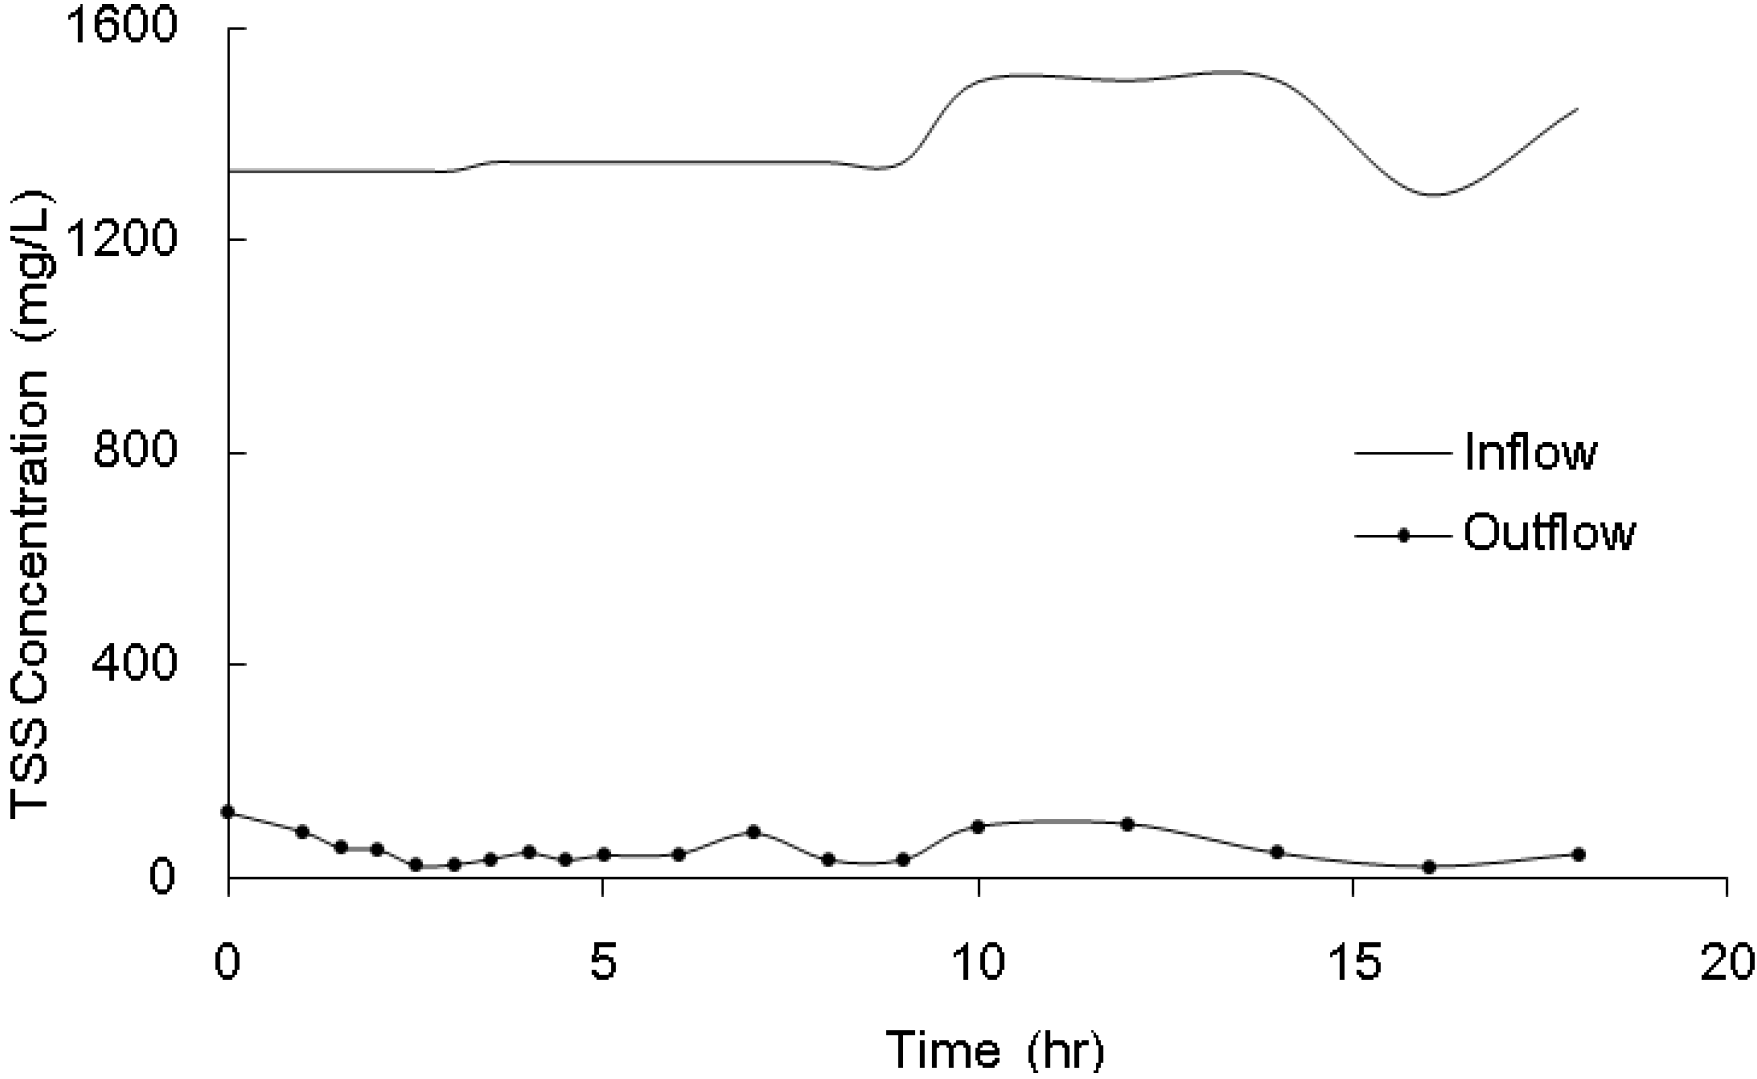
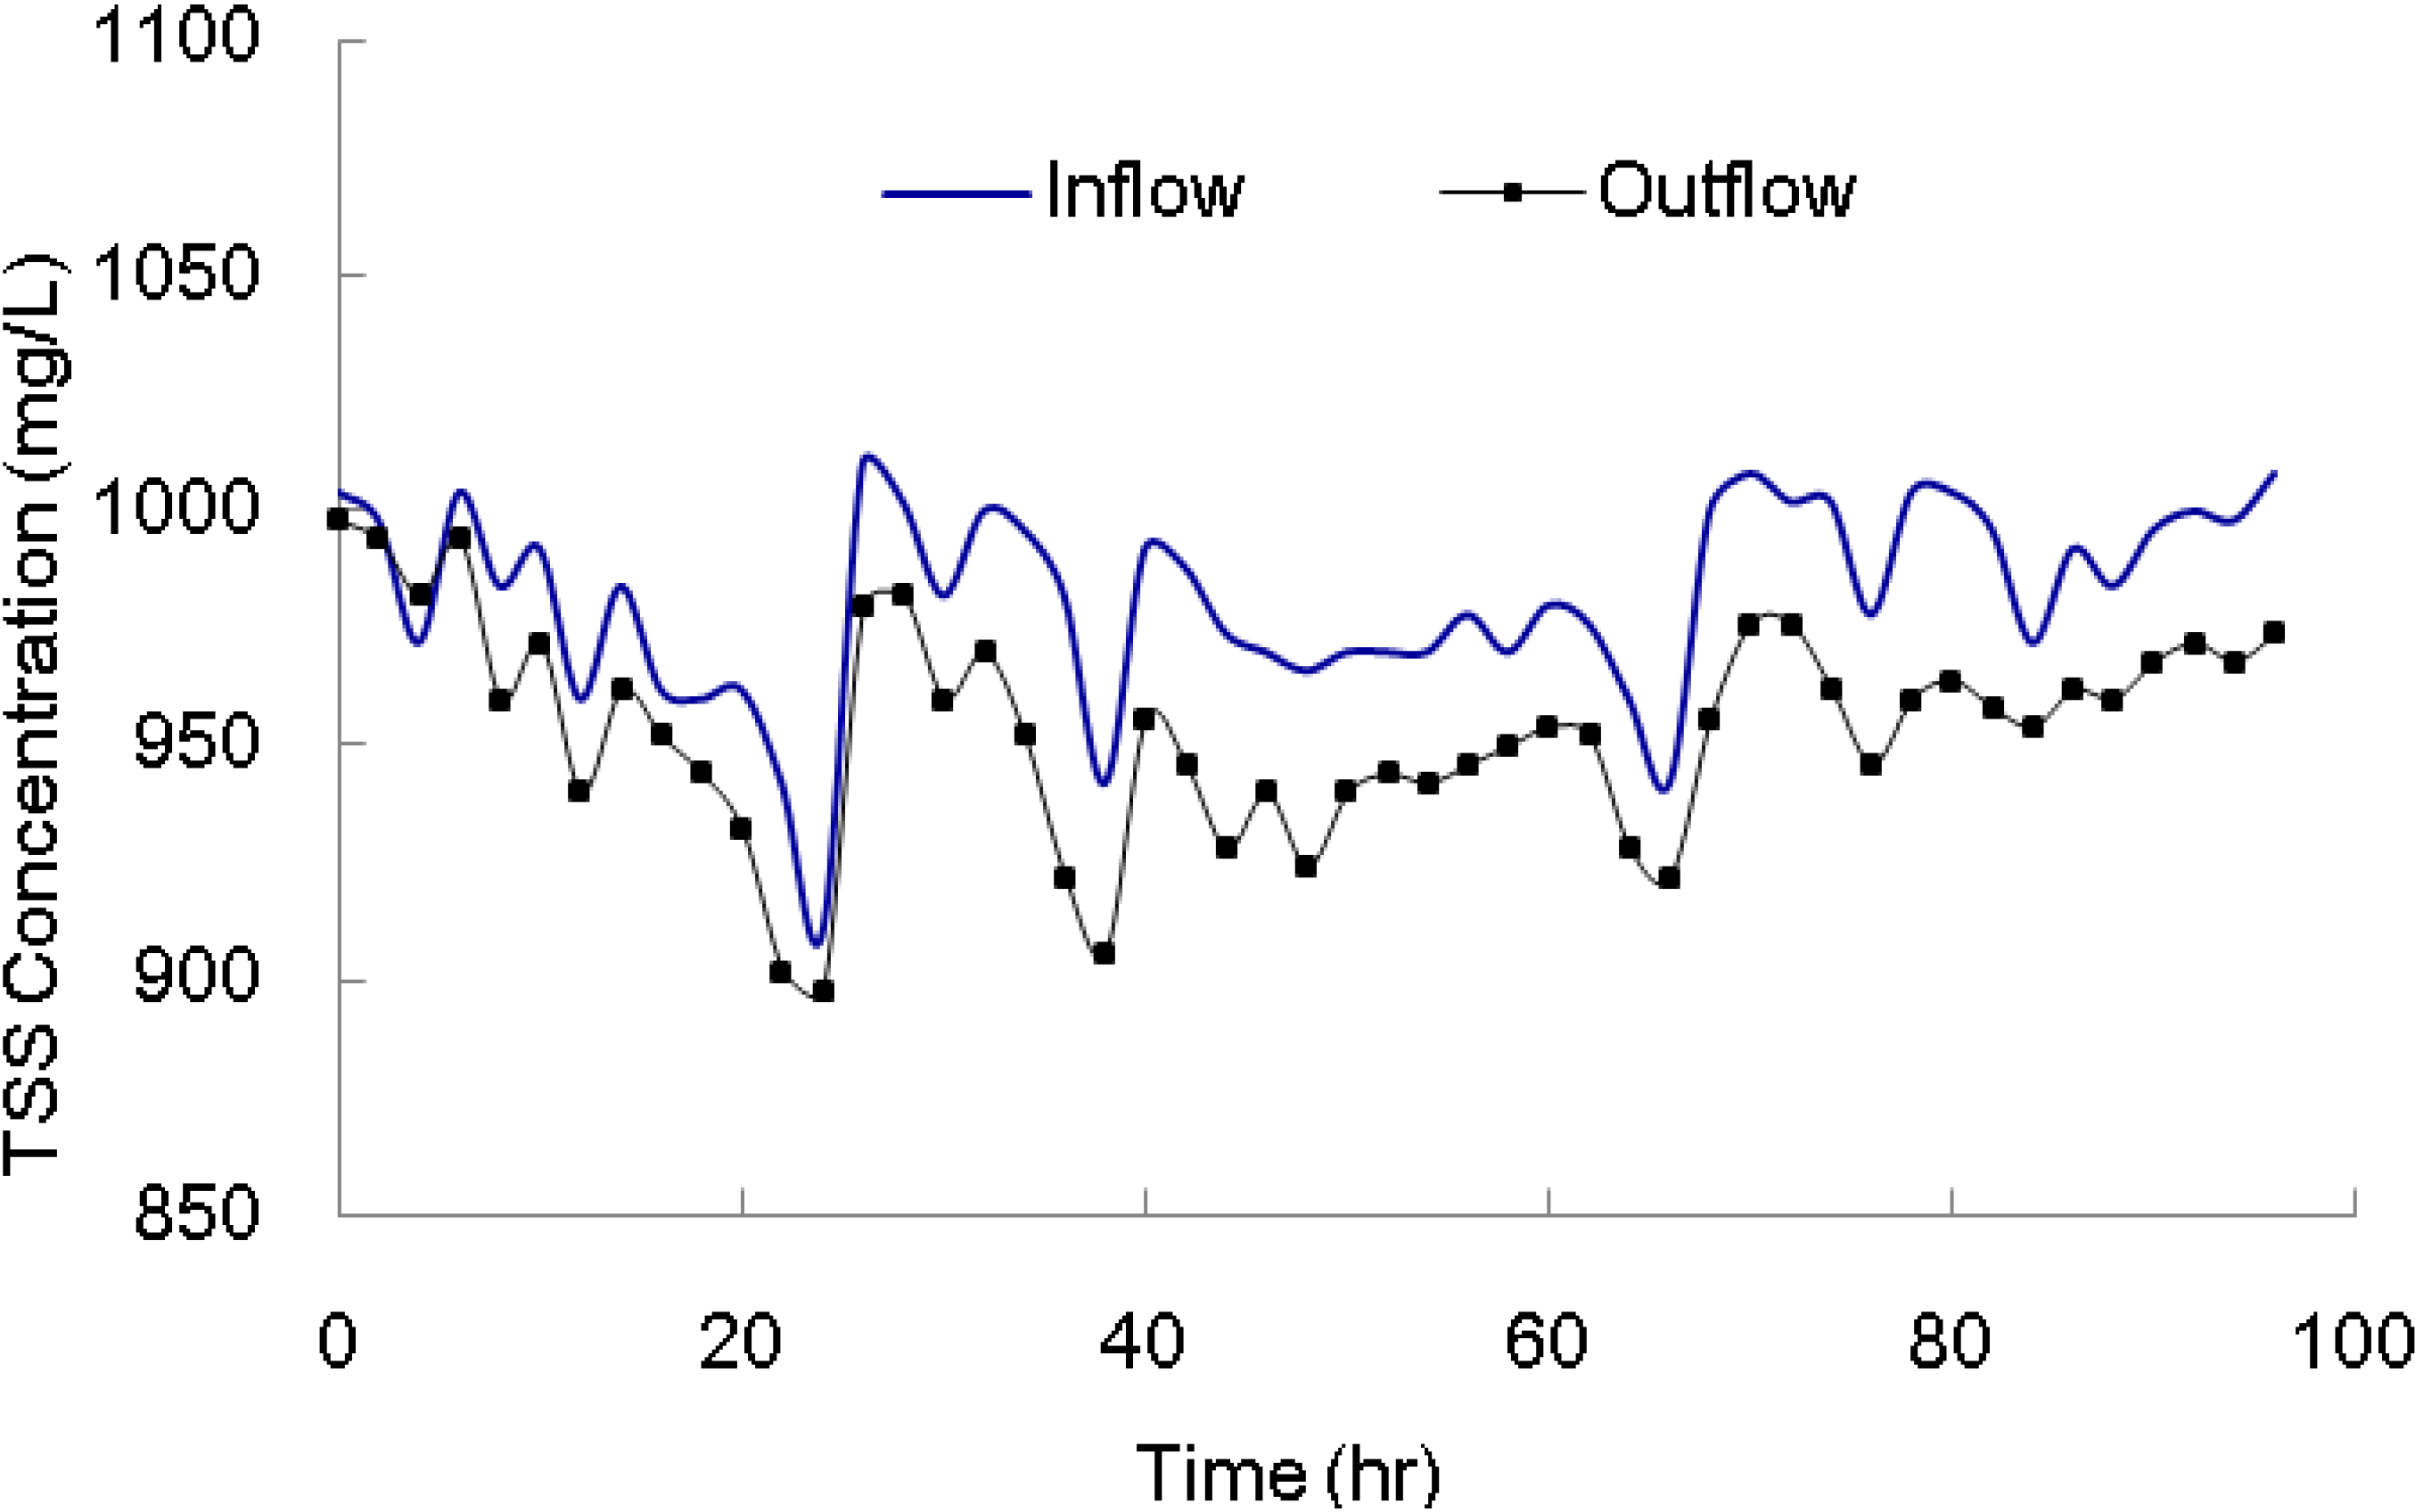
2.3. Case Verification

Three experiments were conducted to simulate the suspended solids physical clogging process, with a test case (T1 to T3) for the ratio of pore diameter and grain diameter discriminant method and the Bayesian discrimination method. The three kinds of sand were adopted as the infiltration medium for the verification experiments. Mixed sand (I) was composed by equal amounts of fine sand, medium sand, and coarse sand (II), Mixed sand (II) was composed by a double amount of fine sand, single amounts of medium and coarse sand, and Mixed sand (III) was the raw sand (grain diameter 80 μm to 5000 μm). The grain diameter of suspended solids in recharged water was 0 mm to 0.1 mm.

3. Results and Discussion

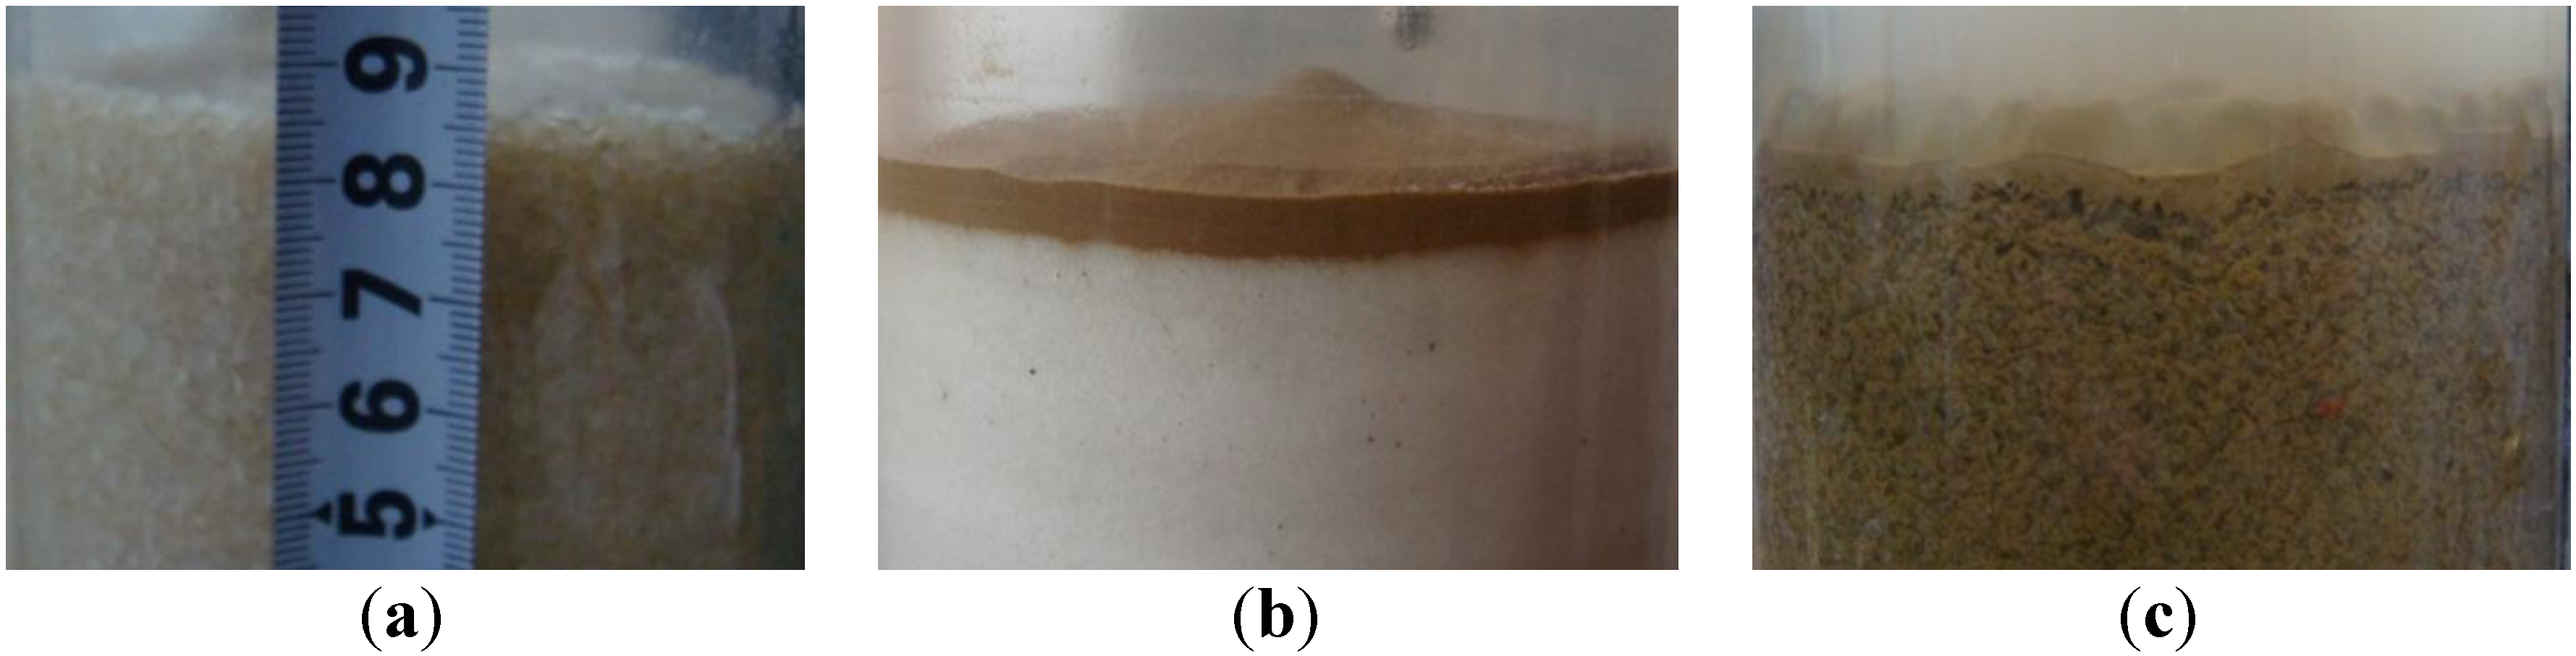
3.1. Suspended Solids Clogging Types

Based on the experimental results, suspended solids clogging could be divided into three types of surface clogging, inner clogging and mixed clogging.

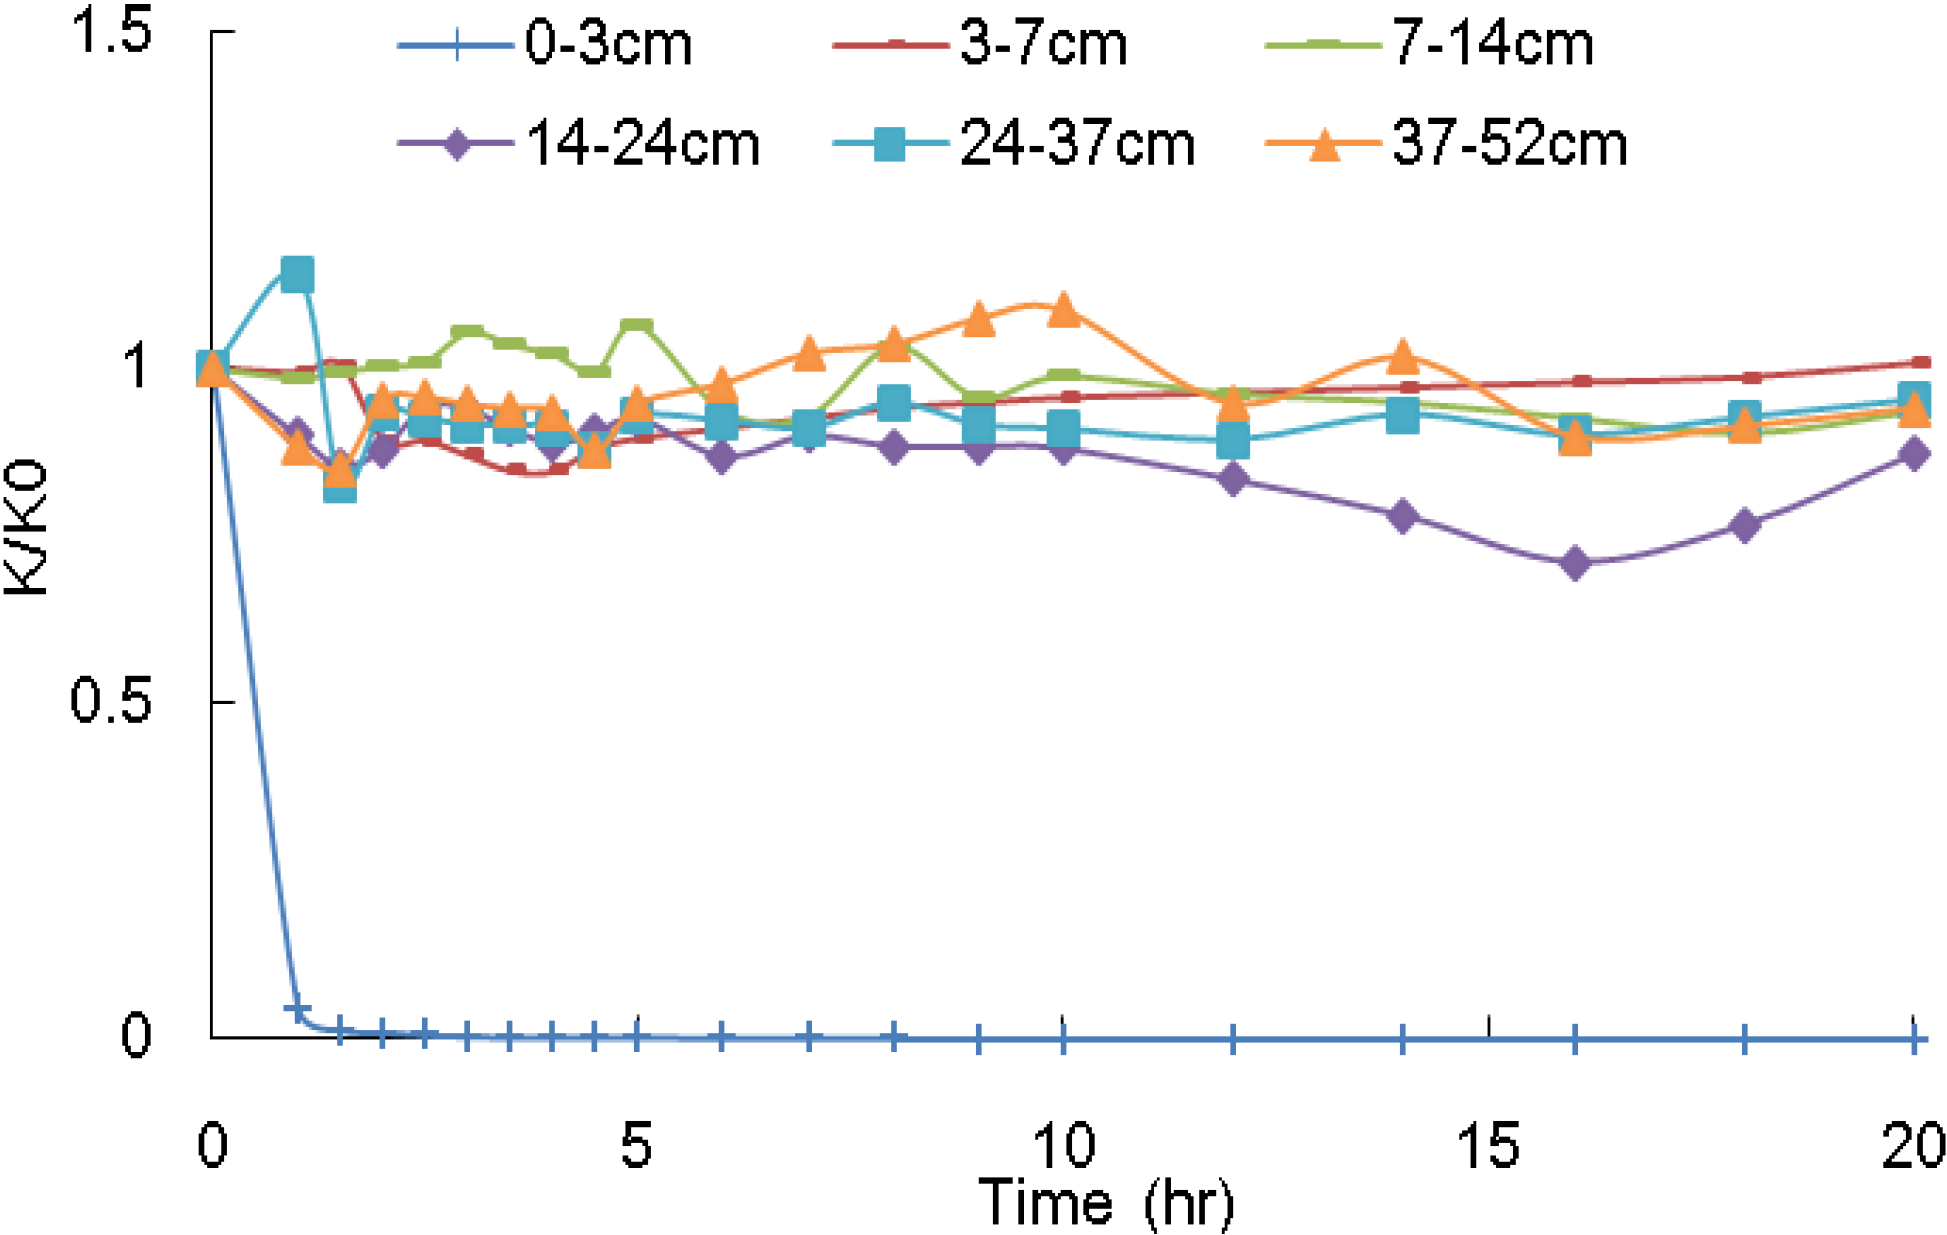
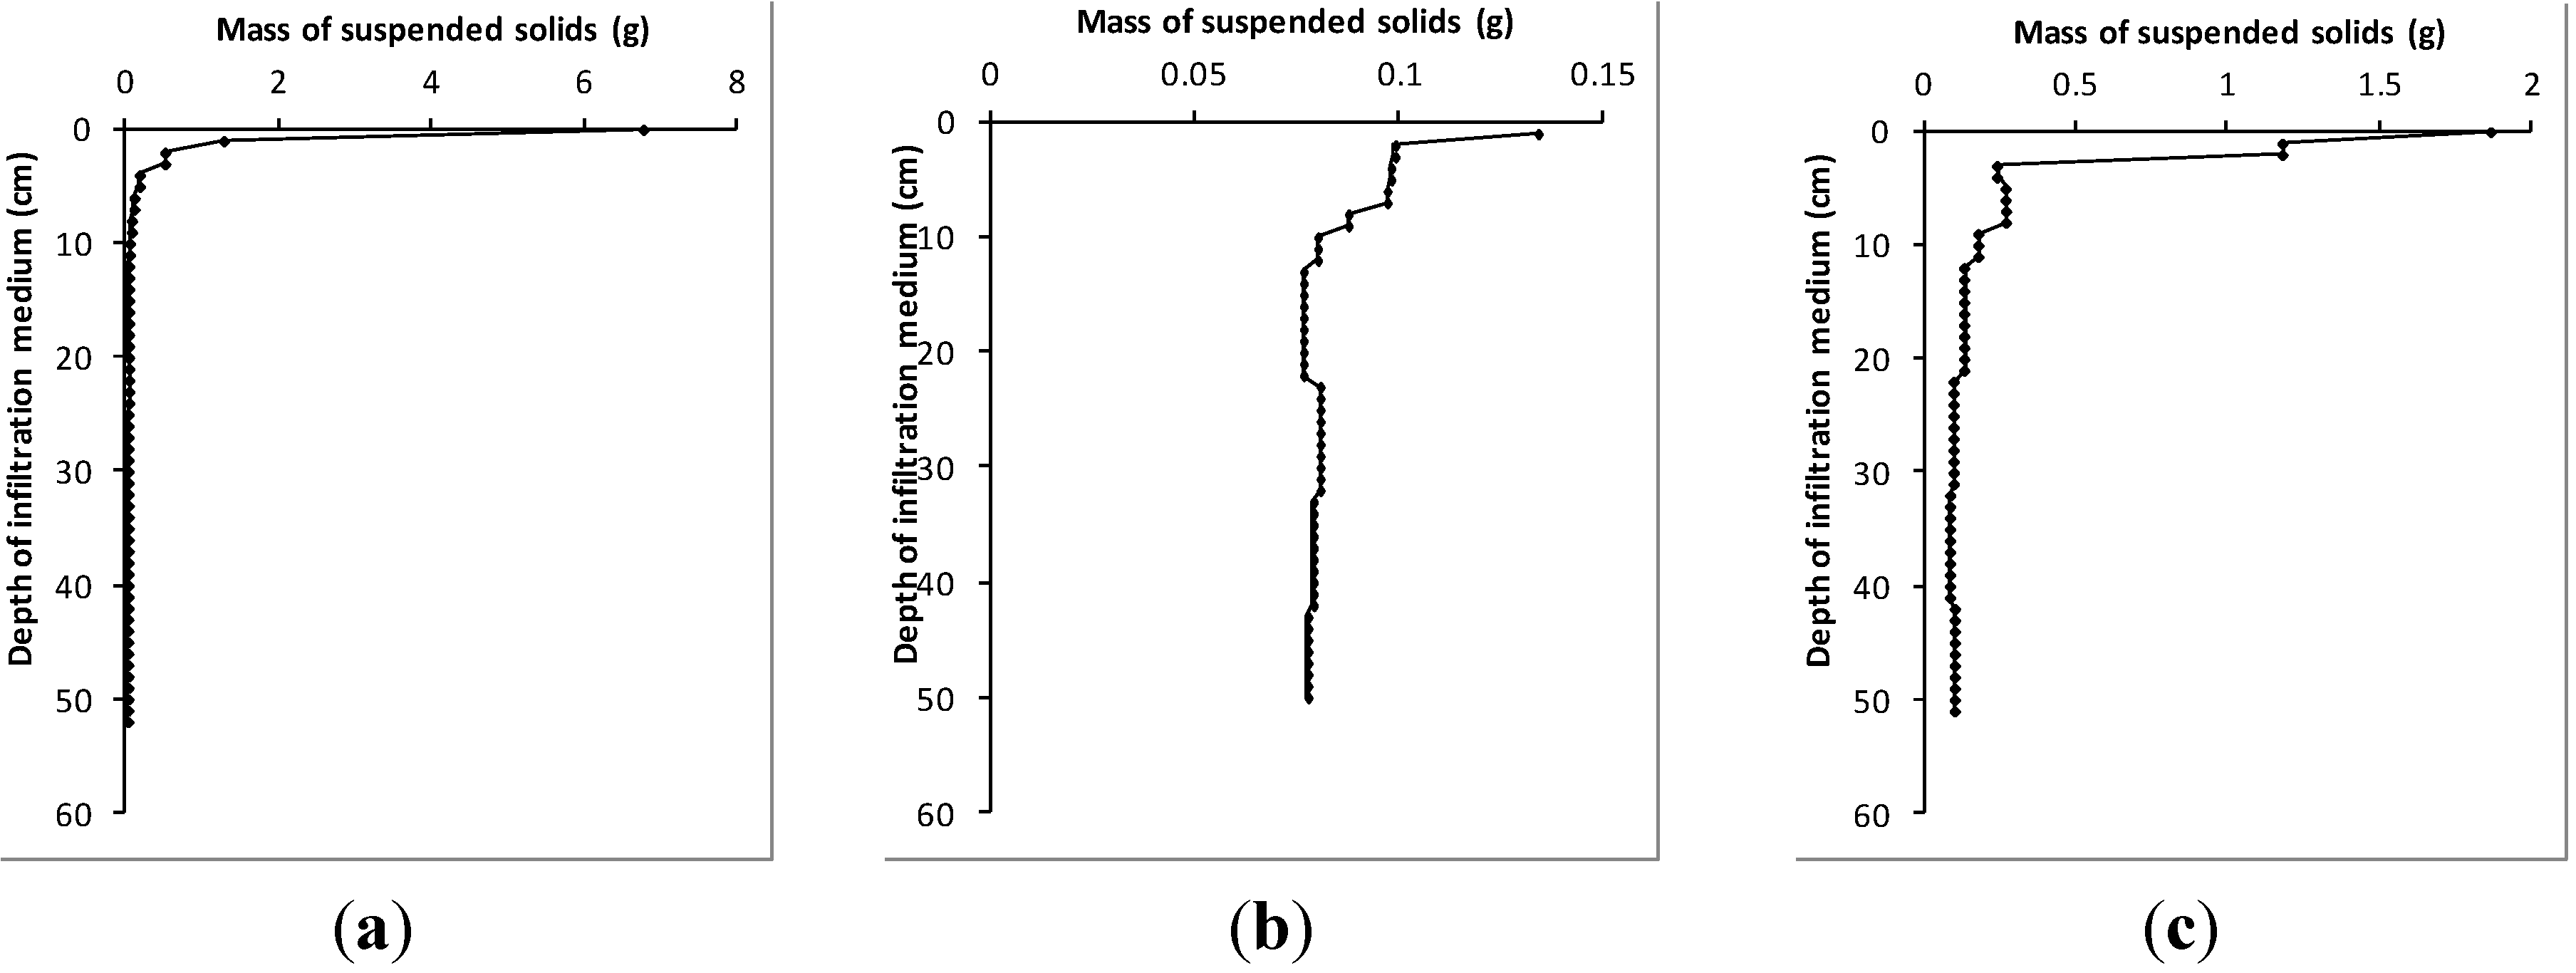
3.1.1. Surface Clogging (S)

Surface clogging indicates that the suspended solids are intercepted by the medium surface when suspended solids grain diameter is larger than pore diameter of infiltration medium (Figure 3a). Characteristics of surface clogging are as follows: (a) the hydraulic conductivity of top layers (0–3 cm) in column decreases very fast with time, but the hydraulic conductivity of other layers can keep relative stable (Figure 4); (b) TSS of inflow is much greater than outflow because of the filtration effect (Figure 5); and (c) the suspended solids are accumulated only on the surface of sand layer (Figure 6a).
Figure 3. Pictures of different types of suspended solids clogging. (a) Surface clogging (Exp. No.E9); (b) Inner clogging (Exp. No.E2); (c) Mixed clogging (Exp. No.E7).
Water 06 00961 g003
Figure 4. K/K0 vs. operation time (Exp. No.E9).
Water 06 00961 g004
Figure 5. Total suspended solids (TSS) concentration of inflow and outflow.
Water 06 00961 g005

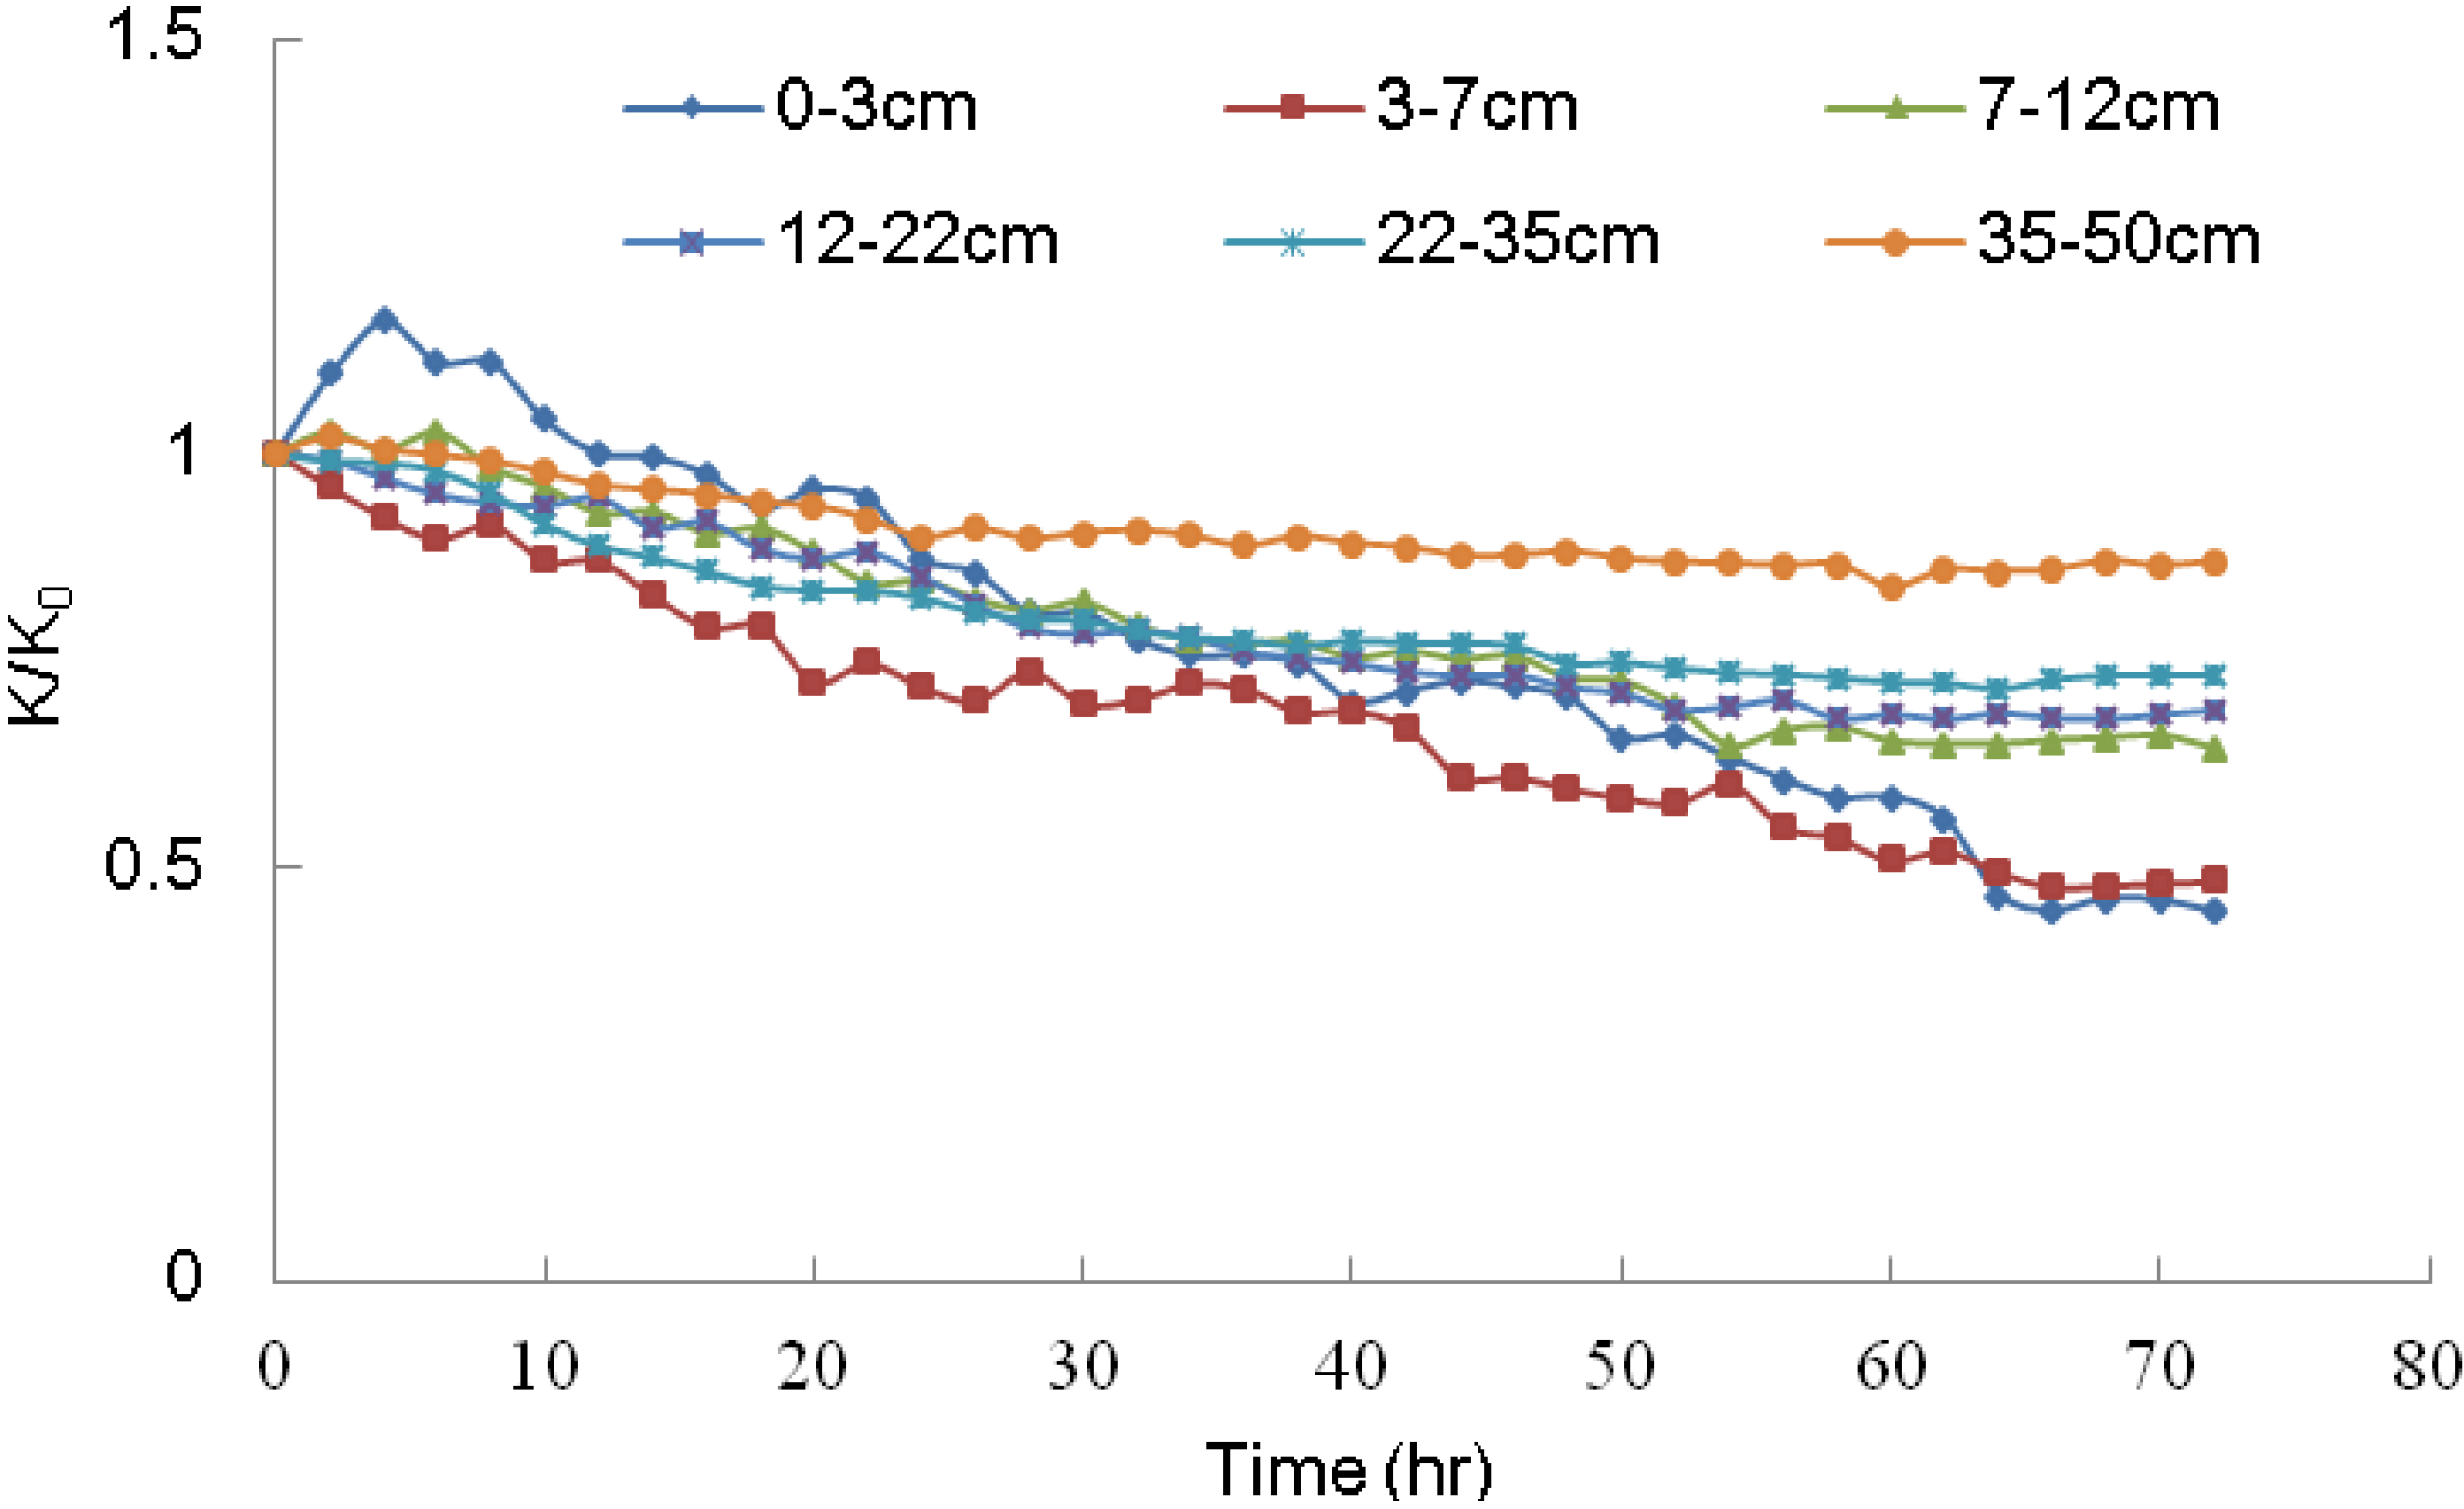
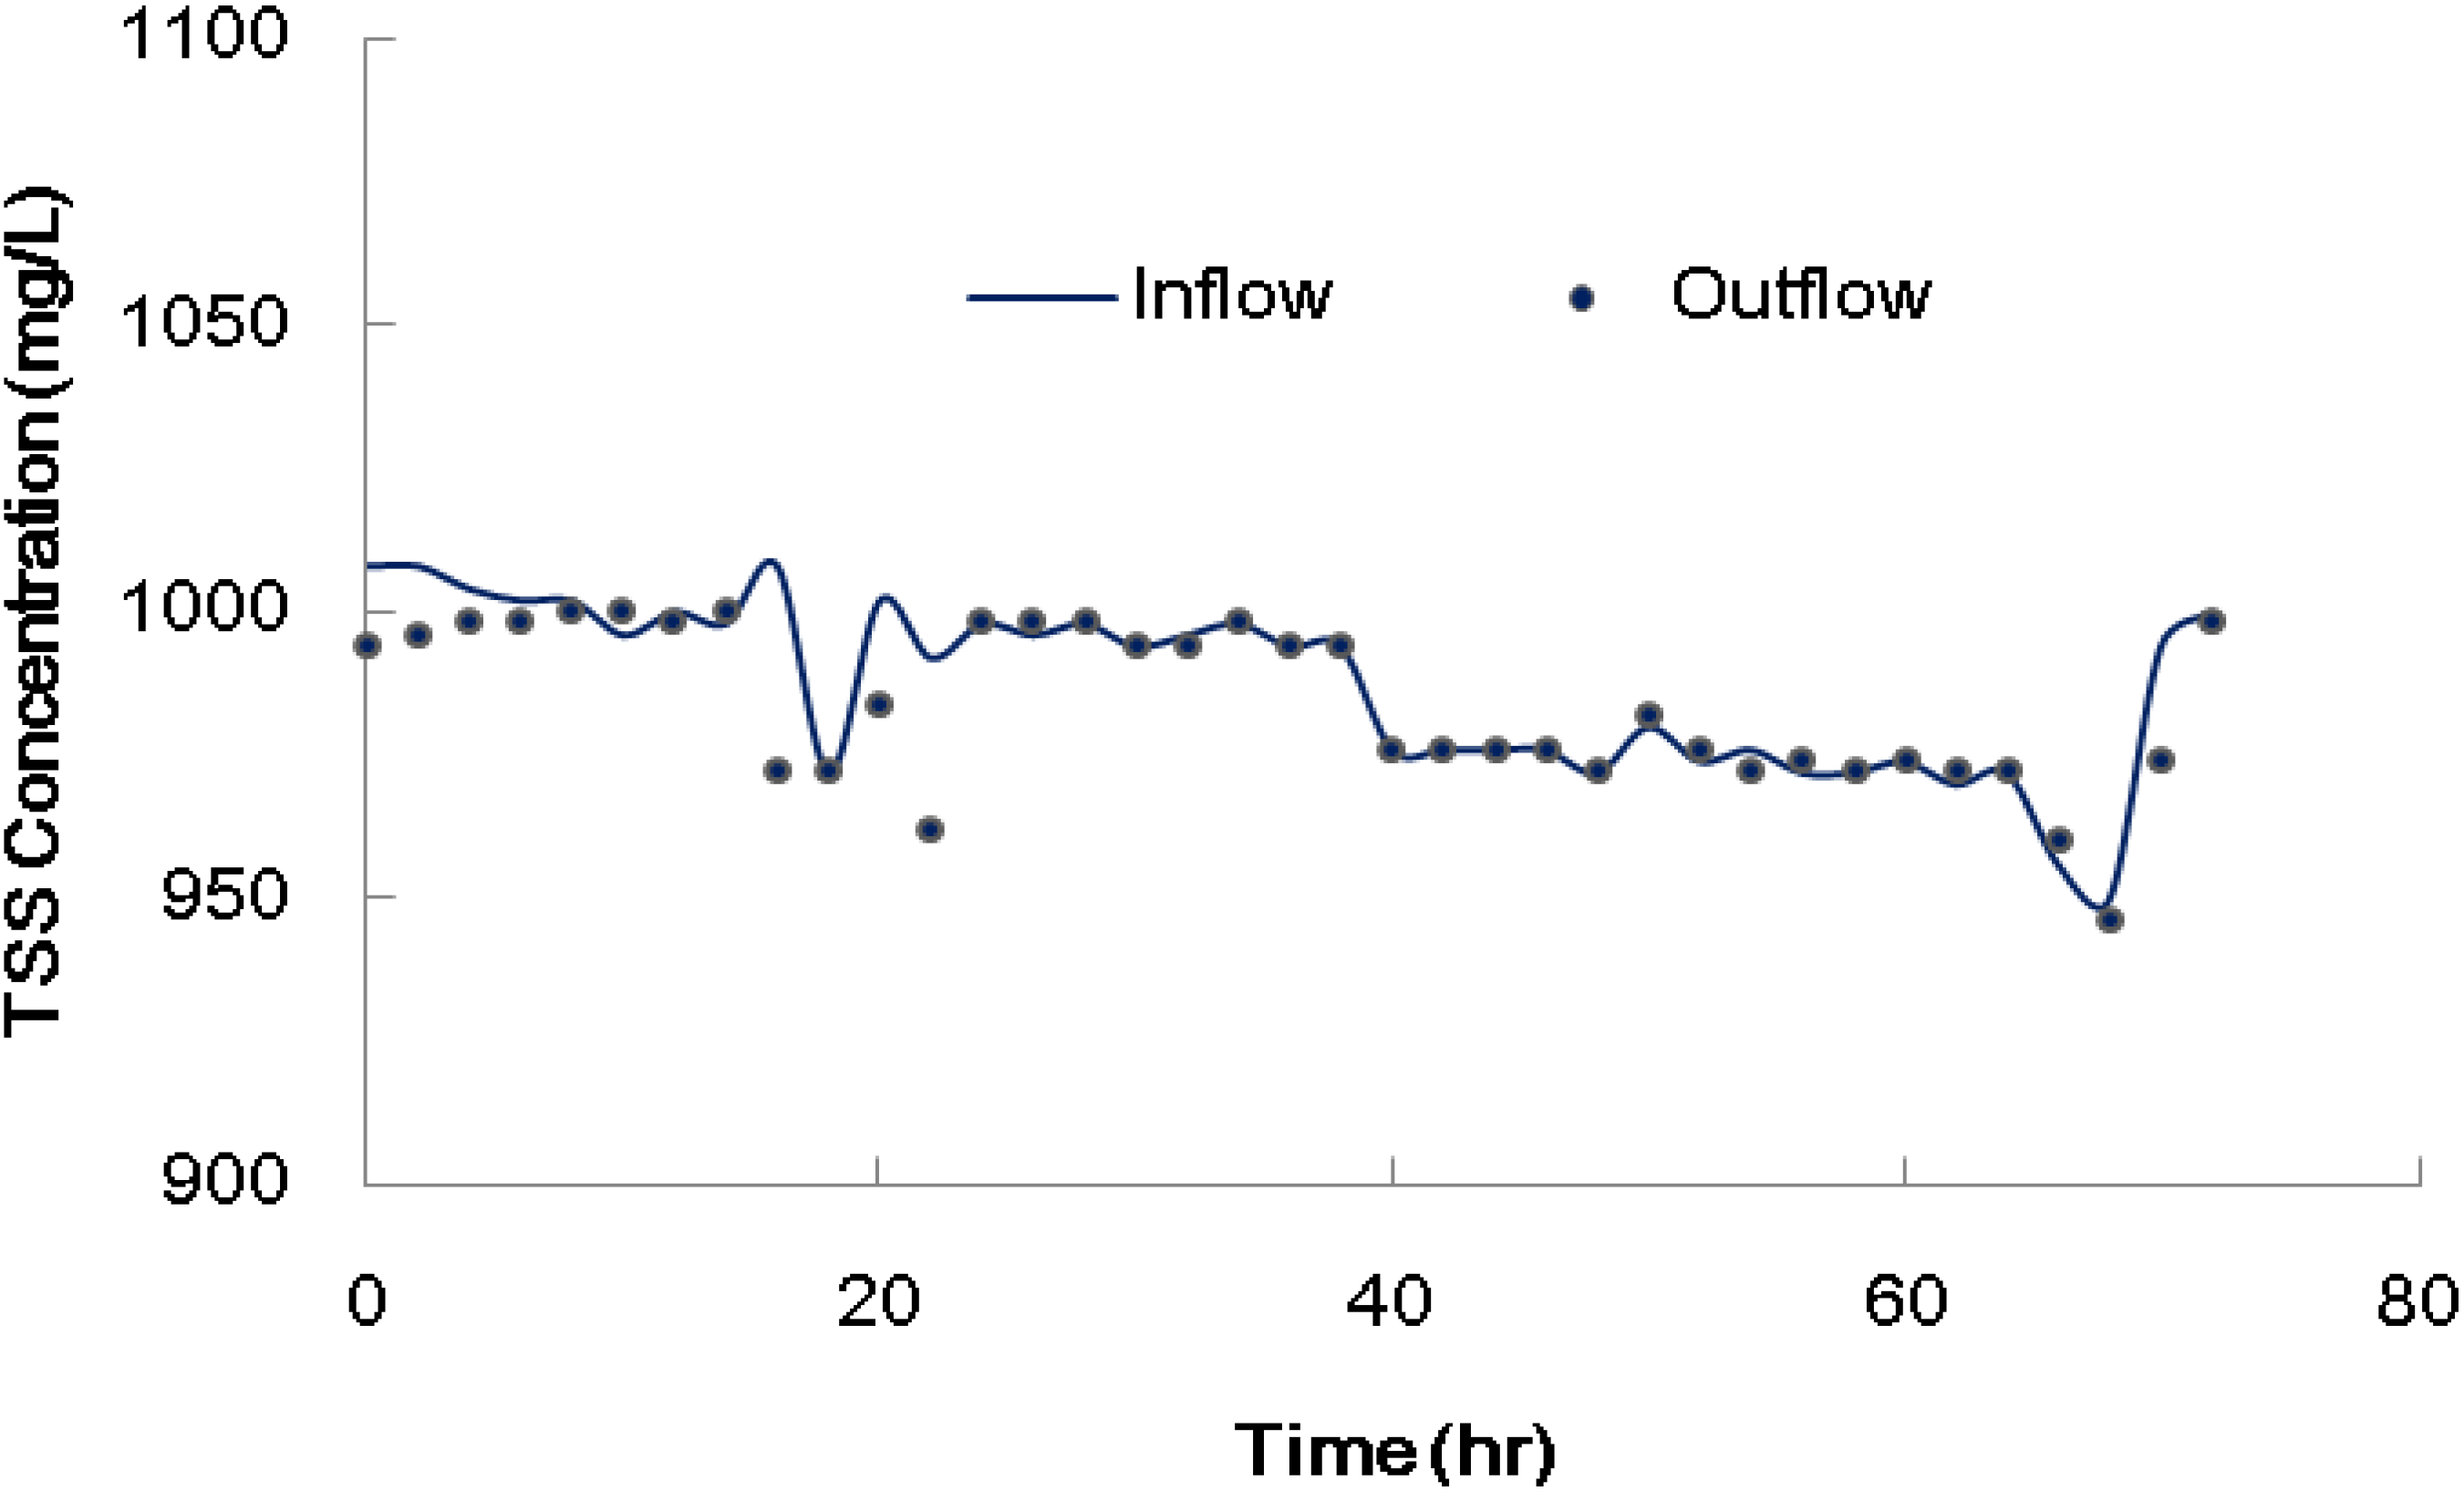
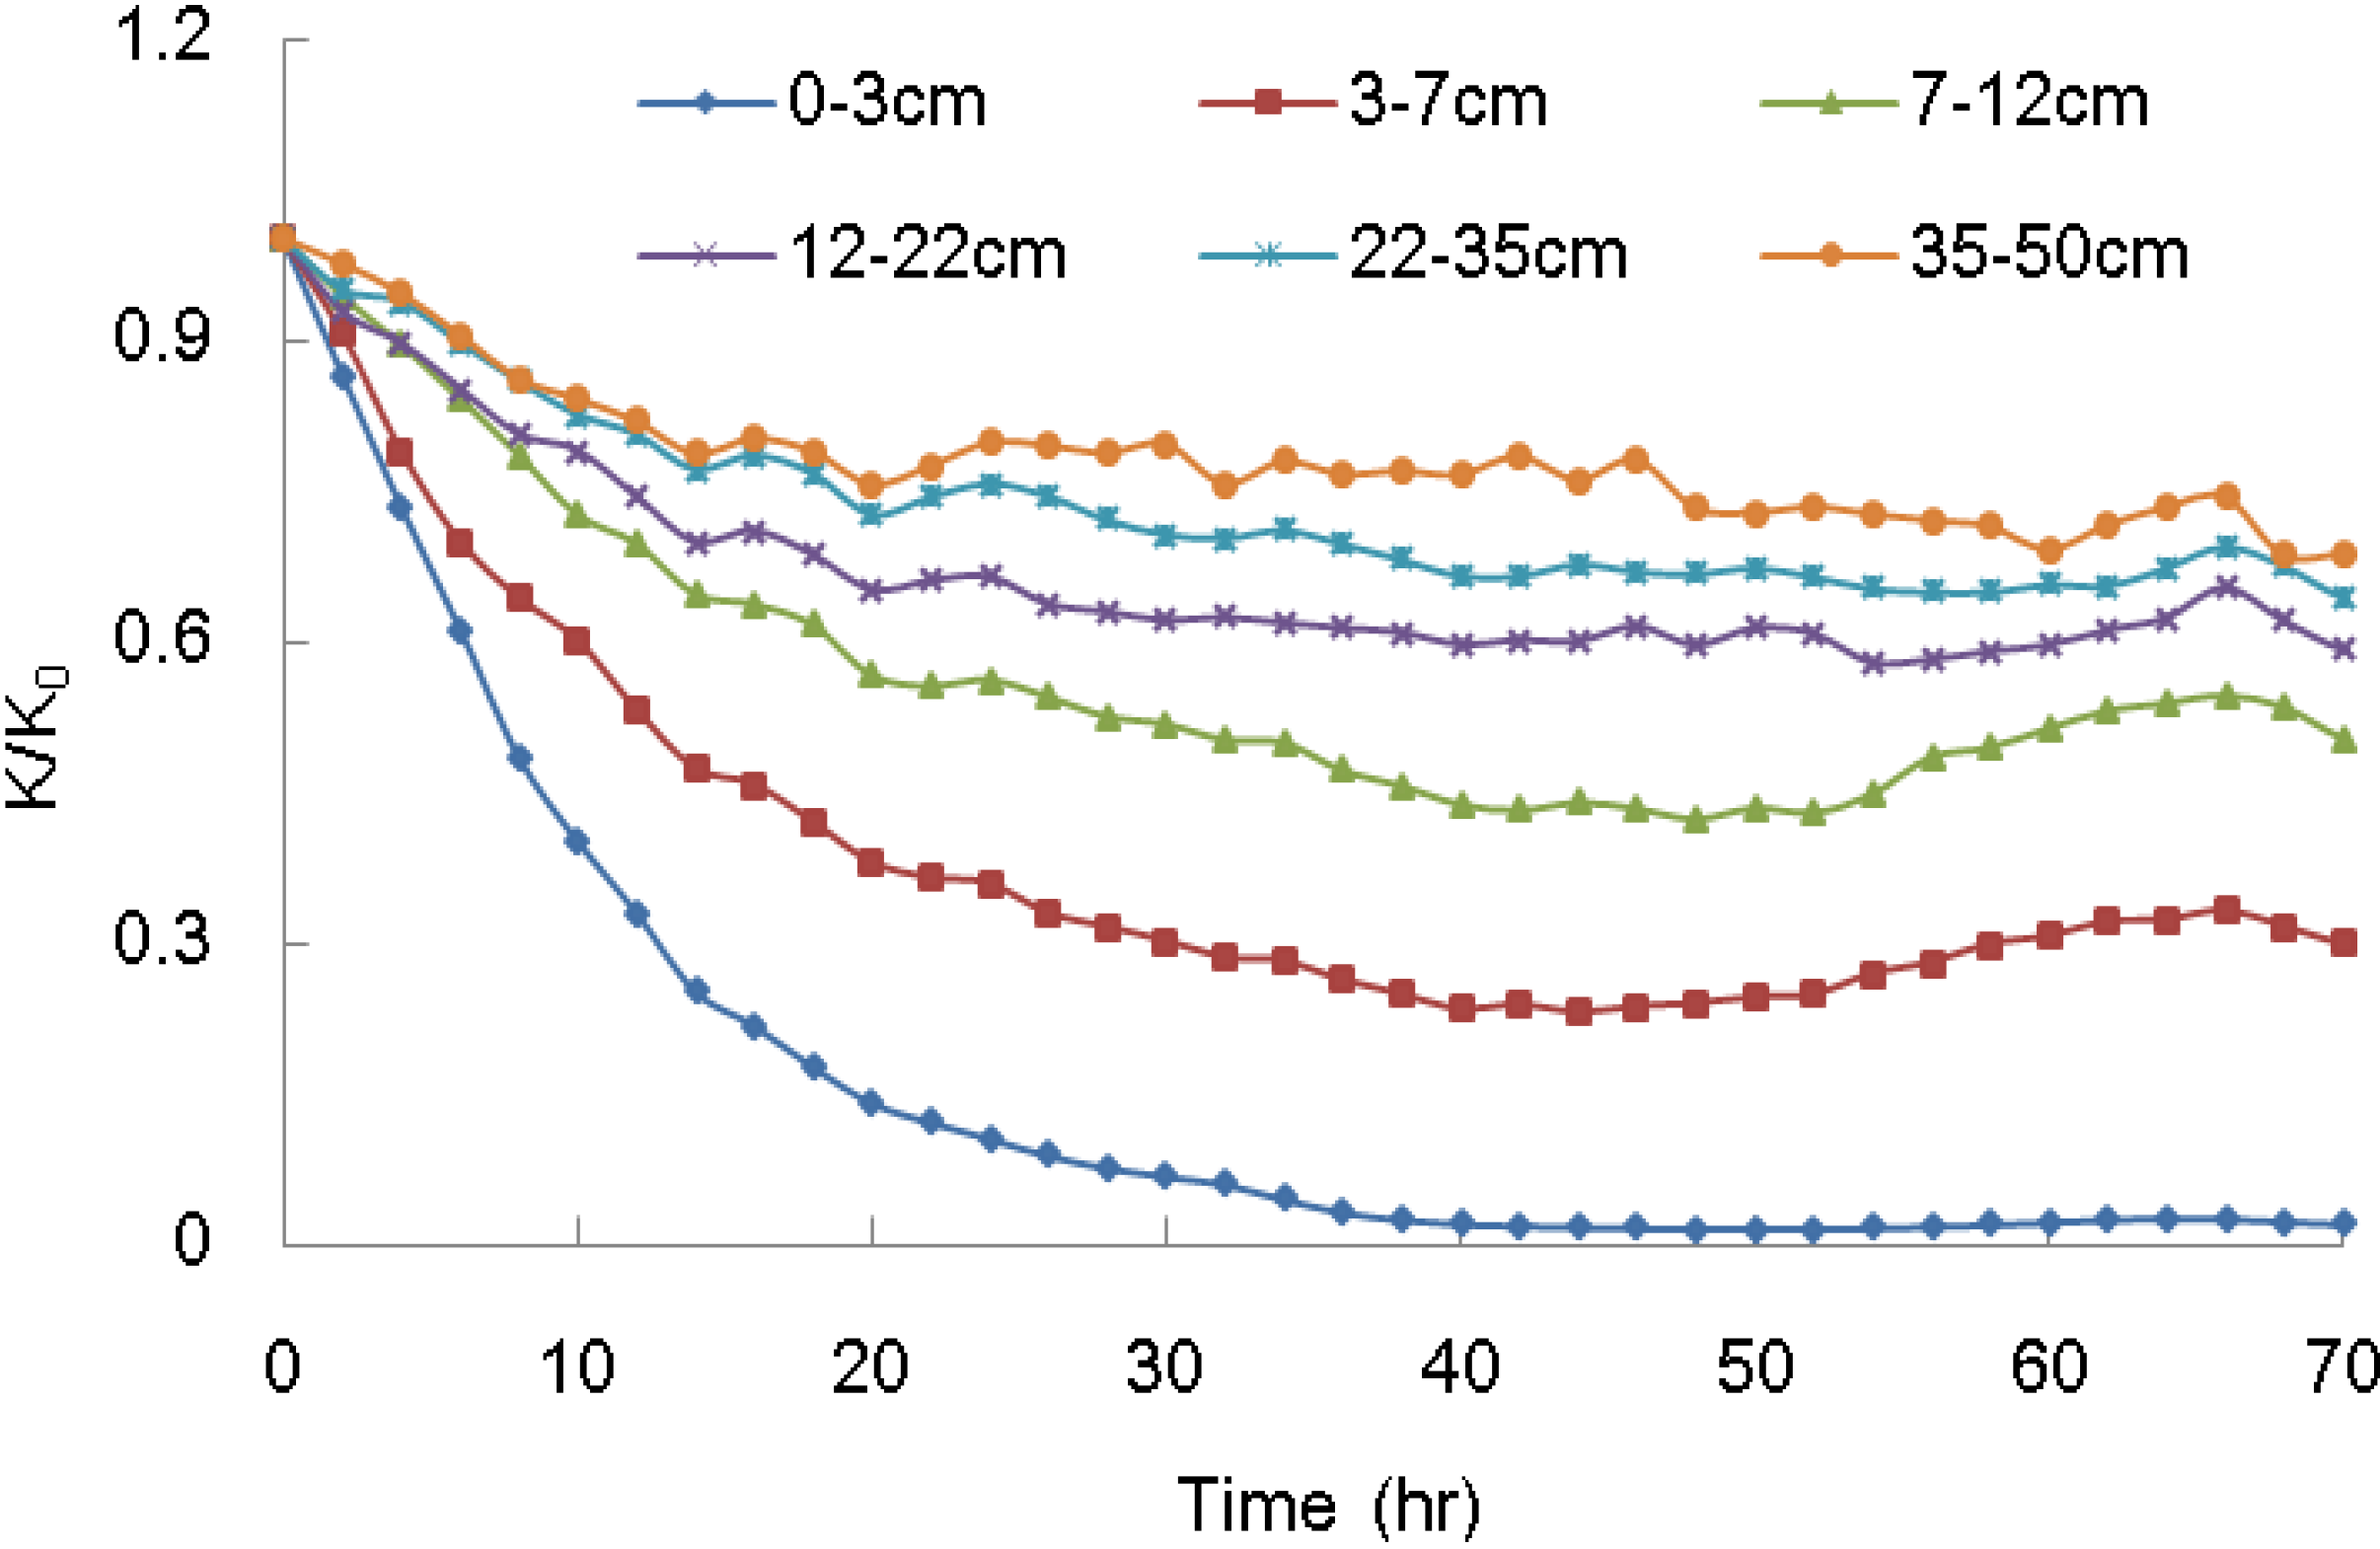
3.1.2. Inner Clogging (I)

Inner clogging indicates that the suspended solids particles could transport through the infiltration medium. Only a few suspended solids particles stay in the column, with the majority flowing out with water flow (Figure 3b). The characteristics of inner clogging are as follows: (a) the hydraulic conductivity of all layers in column decreases gradually with time (Figure 7); (b) TSS of inflow is slightly greater than outflow because the filtration effect is not obvious (Figure 8); and (c) the suspended solids are accumulated within the whole column (Figure 6b).
Figure 6. Deposition profile of suspended solids in column. (a) Surface clogging (Exp. No.9); (b) Inner clogging (Exp.No.2); (c) Mixed clogging (Exp.No.7).
Water 06 00961 g006
Figure 7. K/K0 vs. operation time (Exp. No.E2).
Water 06 00961 g007
Figure 8. TSS concentration of inflow and outflow (Exp. No.E2).
Water 06 00961 g008

3.1.3. Mixed Clogging (M)

Mixed clogging refers to the comprehensive performance of surface clogging and inner clogging. Some small particles can transport for a certain distance through the infiltration medium. As suspended solids continuously accumulate in the flow channel of the medium, the number of suspended solids particles which have the capability to transport through the medium decreases. Suspended solids retention position accumulates upward, ultimately forming a clogging cake on the surface of the infiltration medium [31] (Figure 3c). This clogging mode is a special type of surface clogging that takes longer time to achieve the ultimate clogging state. The characteristics of mixed clogging are as follows: (a) all layer’s hydraulic conductivity decreases with time, and the top layer’s hydraulic conductivity decreases much faster than other layers (Figure 9); (b) TSS of inflow was greater than outflow, the difference was getting bigger while surface clogging occurred after the time about 30 hours (Figure 10); and (c) the suspended solids were accumulated within the whole sand column, but most of them deposited within depth of 10 cm (Figure 6c).
Figure 9. Different depths K vs. operation time (Exp. No.E7).
Water 06 00961 g009
Figure 10. TSS concentration of inflow and outflow (Exp. No.E7).
Water 06 00961 g010
The clogging mechanism, clogging process and the change laws of hydraulic conductivity are differs from different suspended solids clogging types. Thus, the different mathematical models and different prevent and control methods should be varied for each types of suspended solids clogging.

3.2. Judgment Criteria of Suspended Solids Clogging Types

Coarse sand (I, II), medium sand, and fine sand in the experiment were basically homogeneous media. Mixed sand is a heterogeneous medium with equal amounts of fine sand, medium sand, and coarse sand (II). Thus, using mean grain diameter, D50, as the effective grain diameter, Deff, to calculate effective pore diameter, Dp, is reasonable. The ratio of the infiltration medium of effective pore diameter, Dp, and the grain diameter of all levels of suspended solids, di, was used as the discriminant foundation. Table 2 shows the summary of the calculated Dp/di using Equations (1) and (2). The classification of suspended solids clogging experiment results could be determined by observing the clogging phenomenon in the experiment, combined with the suspended solids clogging characteristics, and then referenced to the result of K-means cluster analysis [32] that uses different groups of Dp/di. Table 3 shows the classification summary.
Table 3. Suspended solids clogging types in laboratory experiments.
Experiment No.Clogging typeExperiment No.Clogging typeExperiment No.Clogging type
E2IE10SE17M
E4ME11SE19S
E5ME12ME20S
E6ME14SE21M
E7ME15SE22M
E9SE16S

3.2.1. Ratio of Pore Diameter and Grain Diameter

Limited by the experimental conditions, the judgment index is Dp/d50, which represents the ratio of medium pore diameter and median grain size of suspended solids. Theoretically, when Dp/d50 is less than or equal to a critical value (the theoretical value is 1) and the medium pore diameter is less than the suspended solids grain diameter, the suspended solids are intercepted on the surface of medium and form surface clogging. When Dp/d50 is greater than the critical value, suspended solids are theoretically capable of flowing through the medium freely. However, the judgment criteria based on the experiments are not coincident with the theoretical analysis because of heterogeneity, curve and roughness of pore space. The surface clogging is much easier to occur while Dp/d50 < 5.5, the strict inner clogging is hard to happen until Dp/d50>180, and mixed clogging can be occur while Dp/d50=5.5 − 180.

3.2.2. Bayesian Discrimination Method

The ratios of medium effective pore diameter Dp and levels of suspended solids grain diameter d10, d20, …, d90 are selected as the judgment factors in the Bayesian discriminant analysis model. Using the suspended solids clogging types in the 17 experiments as training samples, Bayesian discriminant analysis can be used to determine the suspended solids clogging type (Equations (9)–(11)).
C1 = −1.322 − 0.585Dp/d10 + 1.023Dp/d30
C2 = −3.627 − 1.789Dp/d10 + 3.169Dp/d30
C3 = −155.013 − 8.913Dp/d10 + 3.169Dp/d30
where C1, C2 and C3 represent the indicator value of surface clogging, mixed clogging and inner clogging. By substituting the pending samples Dp/d10 and Dp/d30 into the model to be calculated, the pending sample category is the group that has the largest C1, C2 and C3.

3.3. Case Verification Results

The discriminant criterion of Dp/d50< and Bayesian criteria were also carried out based on the laboratory experiments under the specific infiltration media and suspended solids with nearly uniform particle diameter. The laboratory experiment conditions may not coincide with any real MAR projection. In order to verify the suitability of above criteria, the verification experiments (T1, T2 and T3) under more realizable conditions of suspended solids and infiltration media were conducted and analyzed by the methods of Dp/d50 and Bayesian discrimination (Equations (9)–(11)) (Table 4).
Table 4. Case verification results for different prediction methods.
Test No.Experimental observationsDp/d50Bayesian method predict result
Dp (mm)d50 (mm)Dp/d50Predict result
T1S0.0780.0233.41SS
T2S0.0740.0233.23SS
T3S0.8070.02335.24MS
According to experimental observations, T1, T2, and T3 exhibit surface clogging. Both the prediction results of Dp/d50 method and Bayesian method are work, and the Bayesian method is more stable and accurate because more factors was considered in the equations.

4. Conclusions

Suspended solids clogging in MAR can be classified into three types according to clogging position: surface clogging, inner clogging, and mixed clogging. Surface clogging indicates that the suspended solids are intercepted by the medium surface when suspended solids grain diameter is larger than pore diameter of infiltration medium. The suspended solids are accumulated only on the surface of sand layer and the hydraulic conductivity of top layers decreases very fast with time. Inner clogging indicates that the suspended solids particles could transport through the infiltration medium. The suspended solids are accumulated within the whole column and the hydraulic conductivity of all layers in column decreases gradually with time. Mixed clogging refers to the comprehensive performance of surface clogging and inner clogging. The suspended solids were accumulated within the whole sand column, but most of them deposited within depth of 10cm. All layer’s hydraulic conductivity decreases with time, and the top layer’s hydraulic conductivity decreases much faster than other layers.
The prediction of different suspended solids clogging types is very important for design and maintenance of MAR facility. The ratios of medium effective pore diameter, Dp, and levels of suspended solids grain diameter, d10, d20, …, d90 are selected as the judgment index of suspended solids clogging types. Dp/d50 has a clearer physical meaning in theory and is also easier to apply. Surface clogging occurred while Dp/d50 was less than 5.5, inner clogging occurred while Dp/d50 was greater than 180, and mixed clogging occurred while Dp/d50 was between 5.5 and 180. However, the relative ideal conditions of nearly uniform particle diameter of suspended solids, the homogeneous infiltration medium and the limited number of experiments place limitations on the established criterion in practical applications with heterogeneous infiltration medium and non-uniform suspended solids. The scale effect also would play an important role to its application.
The Bayesian discrimination method fully utilizes the ratios of different granularity levels of pore diameter and grain diameter, as well as the statistical relationship based on experimental samples. Under the condition of non-uniform infiltration medium and suspended solids, the misjudgment rate is lower than that of the single pore diameter/grain diameter (Dp/d50) discriminant method, thus exhibiting stronger practicality. With these methods, the potential suspended solids clogging types can be predicted prior to implementation of MAR projection.
In this study, further development of laboratory experiments on material selection and the number of experiments would further improve the single pore diameter/grain diameter discriminant criterion and Bayesian discriminant model to make these approaches more practical. In addition, further research will involve the testing of other discrimination methods to compare their advantages and disadvantages.

Acknowledgments

This work was supported by the National Natural Science Foundation of China (No. 40902068, 41002077).

Authors Contributions

Zijia Wang, Yunqing Fang, Jiawei Hou and Xueyan Ye conducted all the experiments under the guidance of Xinqiang Du. The draft manuscript was finished mainly by Zijia Wang and Yunqing Fang, and the final revision was finished by Xinqiang Du.

Conflicts of Interest

The authors declare no conflict of interest.

References

  1. Dillon, P.; Pavelic, P.; Toze, S.; Rinck-Pfeiffer, S.; Martin, R.; Knapton, A.; Pidsley, D. Role of aquifer storage in water reuse. Desalination 2006, 188, 123–134. [Google Scholar] [CrossRef]
  2. Bouwer, H. Artificial recharge of groundwater: Hydrogeology and Engineering. Hydrogeol. J. 2008, 10, 121–142. [Google Scholar] [CrossRef]
  3. Du, X.; Ye, X.; Lu, Y.; Chi, B.; Birk, S.; Yang, Y. Research progress of artificial recharge clogging problem. Adv. Earth Sci. 2009, 24, 973–980. [Google Scholar]
  4. Bekele, E.; Toze, S.; Patterson, B.; Higginson, S. Managed aquifer recharge of treated wastewater: Water quality changes resulting from infiltration through the vadose zone. Water Res. 2011, 45, 5764–5772. [Google Scholar] [CrossRef]
  5. Quanrud, D.; Hafer, J.; Karpiscak, M.; Zhang, H.; Lansey, K.; Arnold, R. Fate of organics during soil-aquifer treatment: Sustainability of removals in the field. Water Res. 2003, 37, 3401–3411. [Google Scholar] [CrossRef]
  6. Vanderzalm, J.; Page, D.; Barry, K.; Dillon, P. A comparison of the geochemical response to different managed aquifer recharge operations for injection of urban stormwater in a carbonate aquifer. Appl. Geochem. 2010, 25, 1350–1360. [Google Scholar] [CrossRef]
  7. Montgomery-Brown, J.; Drewes, J.; Fox, P.; Reinhard, M. Behavior of alkylphenol polyethoxylate metabolites during soil aquifer treatment. Water Res. 2003, 37, 3672–3681. [Google Scholar] [CrossRef]
  8. Zhang, J.; Huang, X.; Liu, C.; Shi, H.; Hu, H. Nitrogen removal enhanced by intermittent operation in a subsurface wastewater infiltration system. Ecol. Eng. 2005, 25, 419–428. [Google Scholar] [CrossRef]
  9. Schafer, A.; Ustohal, P.; Harms, H.; Stauffer, F.; Dracos, T.; Zehnder, A. Transport of bacteria in unsaturated porous media. J. Contam. Hydrol. 1998, 33, 149–169. [Google Scholar] [CrossRef]
  10. Toze, S.; Bekele, E.; Page, D.; Sidhu, J.; Shackleton, M. Use of static Quantitative Microbial Risk Assessment to determine pathogen risks in an unconfined carbonate aquifer used for Managed Aquifer Recharge. Water Res. 2010, 44, 1038–1049. [Google Scholar] [CrossRef]
  11. Anders, R.; Chrysikopoulos, C.V. Virus fate and transport during artificial recharge with recycled water. Water Resour. Res. 2005, 41. [Google Scholar] [CrossRef]
  12. Lindsey, G.; Roberts, L.; Page, W. Inspection and maintenance of infiltration Facilities. Soil Water Conserv. 1992, 47, 481–486. [Google Scholar]
  13. Frycklund, C. Artificial Recharge of Groundwater for Public Water Supply. Potential and Limitations in Boreal Conditions. Ph.D. Thesis, Department of Civil Engineering, Royal Institute of Technology (KTH), Stockholm, Sweden, 1998. [Google Scholar]
  14. Chrysikopoulos, C.V.; Masciopinto, C.; La Mantia, R.; Manariotis, I.D. Removal of biocolloids suspended in reclaimed wastewater by injection in a fractured aquifer model. Environ. Sci. Technol. 2010, 44, 971–977. [Google Scholar] [CrossRef]
  15. Rinck-Pfeiffer, S.; Ragusa, S.; Sztajnbok, P.; Vandevelde, T. Interrelationships between biological chemical and physical processes as an analog to clogging in aquifer storage and recovery (ASR) wells. Water Res. 2000, 34, 2110–2118. [Google Scholar] [CrossRef]
  16. Sniegocki, R.T.; Brown, R.F. Clogging in Recharge Wells, Causes and Cures. In Proceedings of Artificial GRoundwater Recharge Conference, University of Reading, Reading, England, 21–24 September 1970; pp. 337–352.
  17. Frycklund, C. Artificial Groundwater Recharge State of the Art. Report 1992-04; Svenska vatten- och avloppsverksföreningen: Stockholm, Sweden, 1998. [Google Scholar]
  18. Custodio, E.; Isamat, J.; Miralles, J. Twenty-five years of groundwater recharge in Barcelona (Spain). Artif. Groundw. Recharg. 1982, 11, 171–192. [Google Scholar]
  19. Iwasaki, T. Some notes on sand filtration. J. Am. Water Works Assoc. 1937, 29, 1591. [Google Scholar]
  20. Phipps, D.; Lyon, S.; Hutchinson, A. Development of a percolation decay model to guide future optimization of surface water recharge basins. In Proceedings of the 6th International Symposium on Managed Aquifer Recharge, ISMAR 6, Phoenix, AZ, USA, 27 October–2 November 2007.
  21. McDowell-Boyer, L.M.; Hunt, J.R.; Sitar, N. Particle transport through porous media. Water Resour. Res. 1986, 22, 1901–1921. [Google Scholar] [CrossRef]
  22. Pavelic, P.; Dillon, P.J.; Barry, K.E.; Herczeg, A.L.; Rattray, K.J.; Hekmeijer, P.; Gerges, N.Z. Well clogging effects determined from mass balances and hydraulic response at a stormwater ASR site. In Proceedings of the 3rd International Symposium on the Artificial Recharge of Ground Water, Amsterdam, Netherlands, 21–25 September 1998; Peters, J.H., Karsten, H.J., Eds.; Balkema: Amsterdam, the Netherlands; pp. 61–66.
  23. Schippers, J.C.; Verdouw, J. The modified fouling index, a method of determining the fouling characteristics of water. Desalination 1980, 32, 137–148. [Google Scholar] [CrossRef]
  24. Hauser, V.L.; Lotspeich, F.B. Artificial groundwater recharge through wells. J. Soil Water Conserv. 1967, 22, 11–15. [Google Scholar]
  25. Vecchioli, J. Experimental injection of tertiary treated sewage in a deep well at Bay Park, Long Island, NY. New England. Water Works Assoc. 1972, 86, 87–103. [Google Scholar]
  26. Siriwardene, N.R.; Deletic, A.; Fletcher, T.D. Clogging of stormwater gravel infiltration systems and filters-Insights from a laboratory study. Water Res. 2007, 41, 1433–1440. [Google Scholar] [CrossRef]
  27. Okubo, T.; Matsumoto, J. Biological clogging of sand and changes of organic constituents during artificial recharge. Water Res. 1983, 17, 813–821. [Google Scholar] [CrossRef]
  28. Winter, K.J.; Goetz, D. The impact of sewage composition on the soil clogging phenomena of vertical flow constructed wetlands. Water Sci. Technol. 2003, 48, 9–14. [Google Scholar]
  29. Glover, P.W.J.; Walker, E. Grain-size to effective pore-size transformation derived from electrokinetic theory. Geophysics 2009, 74, 17–29. [Google Scholar] [CrossRef]
  30. Lachenbruch, P A. Discriminant Analysis. Macmillan Pub Co.: New York, NY, USA, 1975. [Google Scholar]
  31. Wang, Z.; Du, X.; Yang, Y.; Ye, X. Surface clogging process modeling of suspended solids during urban stormwater aquifer recharge. J. Environ. Sci. 2012, 24, 1418–1424. [Google Scholar] [CrossRef]
  32. Aldenderfer, M.S.; Blashfield, R.K. Cluster Analysis, 3rd ed.SAGE Publications Inc.: New York, NY, USA, 1984. [Google Scholar]

