Article

Water End-Uses in Low-Income Houses in Southern Brazil

Laboratory of Energy Efficiency in Buildings, Department of Civil Engineering, Federal University of Santa Catarina, Florianópolis-SC 88040-900, Brazil
*
Author to whom correspondence should be addressed.
Water 2014, 6(7), 1985-1999; https://doi.org/10.3390/w6071985
Submission received: 4 May 2014 / Revised: 13 June 2014 / Accepted: 18 June 2014 / Published: 8 July 2014
(This article belongs to the Special Issue Water Consumption and Water End-uses in Buildings)

Abstract

:
Knowing water consumption patterns in buildings is key information for water planning. This article aims to characterize the water consumption pattern and water end-uses in low-income houses in the region of Florianópolis, Southern Brazil. Data were collected by interviewing householders, as well as by measuring the flow rate of existing water fixtures and appliances. The results indicated that the shower was the fixture with the largest water consumption in households, i.e., about 30%–36% of total water consumption on average, followed by the toilet (18%–20%). The surveyed households consumed from 111 to 152 L/capita·day on average, based on different income ranges. No correlation was found between income and water consumption. The results of this study can be used to estimate the consumption of water for new buildings, as well as to develop integrated water management strategies in low-income developments, in Florianópolis, such as water-saving plumbing fixtures, rainwater harvesting, and greywater reuse. Likely, there would be a deferral of capital investments in new water assets for enhancing water and wastewater services by saving water in low-income houses.

1. Introduction

Developing efficient strategies to reduce water consumption is linked to the characterization of water end-uses. From this knowledge it is possible to evaluate the main devices responsible for water use and prioritize the development of technologies to generate more effective water savings [1].
Moreover, the water end-uses are useful in order to evaluate actions to reduce water demand and waste generated in households, as well as possible alternative sources of water. They are also essential to identify the portion of total demand that can be saved through alternative sources of water [2,3].
Each population, region, and country presents their own patterns of consumption of water, so the collection of specific end-uses in each study is decisive for the prediction of water demand [4].
Therefore, by knowing the factors that influence the demand for water in communities of social interest, their perception about the water situation and the need to use it consciously, one can establish strategies for implementing rational use of water for this part of the population [5].
As the purchasing power of low-income populations increases, water demand may also increase. With the development of new public housing policies, the rational use of water in low-income houses has the potential to reduce demand on public water systems and sewage. Thus, the characterization of water consumption in these dwellings can be an important step to promote potable water savings at the urban scale.
However, there are few studies that present water end-uses data for low-income houses. In the metropolitan region of Salvador, Brazil, Cohim et al. [6] evaluated the water end-uses in ten low-income houses. The survey indicated that higher consumption occurs in the kitchen sink (29%), followed by the toilet bowl (23%) and shower (21%). The laundry and sink represented 17% and 10% of water consumption, respectively. Family income was up to two minimum wages, but the majority (78%) had a family income of up to one minimum wage. The water consumption ranged between 74.34 and 85.99 L/capita·day, averaging approximately 80 L/capita·day.
In another study, Ywashima et al. [7] characterized the use of water for 27 single-family low-income houses located in Paulínia, Brazil. The data were surveyed through interviews with users and observing the operating conditions of water fixtures or appliances. It was observed that the monthly water consumption varied from 3 to 25 m3 per month, while the consumption per person varied from 46 to 309 L/capita·day. The average values of monthly consumption and per capita consumption were 12 m3 and 113 L/capita·day, respectively.
Dantas et al. [8] analyzed the water consumption in 19 single-family low-income houses located in Itajubá, Brazil. Data were collected primarily through interviews with users. The indicator of the average consumption was found to be 117 L/capita·day (ranging from 80 to 133 L/capita·day), corresponding to an average consumption of 11.63 m3 per month.
Oliveira et al. [9] also conducted water consumption characterization in low-income houses. The methodology was based on interviews in 14 households located in the city of Goiânia, Brazil. The average water consumption was 95 L/capita·day.
In the international scenario studies approaching water end-uses in low-income houses are unusual. The majority of studies evaluate water consumption in single-family and multifamily residences of medium standard [10,11,12,13,14,15,16].
A survey carried out in 1188 households in the United States and Canada verified the consumption and water end-uses for a period of three years. It was noticed that more than half of the consumption of the surveyed households (58% of total consumption) was used in external activities. As for the domestic consumption in homes with conventional water fixtures, the highest consumption was found for toilets (76.1 L/capita·day), followed by washing machines (56.8 L/capita·day) and showers (50.3 L/capita·day). In homes with saving appliances, washing machines had the highest consumption (56.8 L/capita·day), followed by taps (41.3 L/capita·day), showers (37.9 L/capita·day), and toilet flushing (36.3 L/capita·day) [17].
In Sweden, 20% of the potable water used in households is intended for toilet flushing, 15% for washing machines and 10% for washing cars and other types of cleaning [18].
In Australia, Beal et al. [15] performed an evaluation study of residential water consumption and socioeconomic characteristics in 252 households located in Southeast Queensland. The water end-uses for each group identified as “low”, “medium”, and “high” water consumers was verified. Analyses of variance tests were conducted to consider the variables that characterize each group of water use, such as age, income, water savings, family size and water conservation actions. The results suggested that, with 95% confidence, water users named as high consumers use less volume of water than middle and low consumers. It was concluded that the socioeconomic characteristics of groups that tend to overestimate or underestimate their consumption of water can be useful for planning demand management programs, community education, and social marketing.
In Northern Portugal, Matos et al. [19] conducted a study with the objective of characterizing the water end-uses. Fifty-two homes inhabited by families with 1–5 people, located in three cities with different sociodemographic characteristics (Vila Real, Valpaços and Oporto) were monitored. This study provided a better understanding of the variation of daily water consumption in the various water fixtures or appliances. This knowledge may be useful to assess available alternatives to minimize the consumption of potable water in buildings. Finally, the authors concluded that the sociodemographic characteristics affect daily water consumption, but this topic needs further research, particularly addressing the relationship between the characteristics of the occupants (age, income, education, etc.) and their habits about water consumption.
In China, Fan et al. [20] investigated the patterns of water use through a survey of 776 households located in three districts of the Wei River basin. The practices of water conservation, attitudes, and barriers to water conservation in homes were evaluated. The consumption of water for domestic use was 70.2 L/capita·day. It was found that families that showed high consumption of water consumed a larger volume for irrigation, cleaning their homes and yards, and use more appliances that require water. There were a total of 20 water conservation practices used by evaluated families. Furthermore, it was found that householders preferred to implement inexpensive water conservation practices as economic concerns are the main reasons for saving water. Knowledge of water end-uses, motivations and barriers to water conservation are essential for the effective establishment of public policies.
Thus, it is noted that there are few studies on water use that feature end-uses and water consumption per capita in low-income houses. Therefore, it becomes necessary to investigate the patterns of water consumption in conjunction with socioeconomic data in this typology of building.

2. Objective

The objective of this article is to characterize the water consumption pattern and water end-uses of low-income houses located in Florianópolis, Southern Brazil.

3. Method

The water consumption and end-uses were assessed through field surveys, i.e., interview with householders and analysis of water fixtures and appliances. The interviews were aimed at determining the duration and frequency of use for each water fixture and appliance, as well as collecting information about the historical monthly water consumption registered by the local water utility. The analysis of fixtures and appliances was performed so as to determine either the flow rate of showers and taps, or the water consumption per cycle of washing machines.

3.1. Socioeconomic Assessment

The study was conducted in 48 low-income households in the metropolitan region of Florianópolis, Santa Catarina (Figure 1). In order to select the studied households, one of the following criteria was considered:
  • Household with monthly income of less than or equal to three minimum wages (3 × R$622.00 = R$1866.00 = US$987.30—April 2012);
  • House located in a low-income area (e.g., slums, shanty towns, or suburbs with a high concentration of low-income houses);
  • Householders own residence funded by the program “Minha Casa Minha Vida” [21] or other Brazilian public housing program for low-income households.
Figure 1. Location of assessed suburbs in the metropolitan region of Florianópolis city (red dot).
Water 06 01985 g001
Each studied household was classified taking into account their income as follows:
(a)
Income 1: Total family income up to R$1866.00 (US$848.18—April 2014) (up to 3 minimum wages);
(b)
Income 2: Total family income ranging from R$1866.00 to R$3110.00 (US$848.18 to US$1409.09—April 2014) (3–5 minimum wages);
(c)
Income 3: Total family income above R$3110.00 (US$1409.09—April 2014) (more than 5 minimum wages).
The influence of household’s socioeconomic characteristics, i.e., number of residents and total monthly income, on the water consumption patterns was analyzed.

3.2. Water End-Use Estimation

The water end-use was determined through interviews, for which householders reported the frequency and duration of use for each water fixture and appliance. For fixtures and appliances used on a daily basis, householders were asked to describe the hourly consumption pattern by estimating the average frequency of events or total duration of use at each hour of the day. For fixtures and appliances used on a weekly or monthly basis, householders estimated their respective frequency of use per week or month.
Moreover, the flow rate or water consumption per cycle for each water fixture or appliance was determined through an on-site assessment. The usual water flow rates were calculated by asking householders to open taps and showers for three times at the typical flow rates used, and then by measuring the total volume during 10 s for each of the three events. From the three measured flow rates, an average flow rate was calculated. In addition, information about the water consumption per cycle of washing machines and toilets with cisterns was also obtained from the product technical specifications or the PROCEL (Brazilian Energy Efficiency Program) catalog [22]. The flow rate for toilets with flushing valves was considered equal to 1.7 L/s as per the Brazilian Plumbing Code NBR 5626 [23].
The monthly water consumption for each water fixture or appliance was calculated by multiplying either their respective average flow rate and estimated total usage time per month (Equation (1)), or their respective average water consumption per cycle and estimated number of events per month (Equation (2)).
The water consumption was estimated on a monthly basis to allow a comparison with total water consumption (m3 per month per household) fixed by the local water utility and with data from literature.
Cflow = Q × t
where Cflow is the monthly water consumption [m3/month] of the fixtures measured by flow rate; Q is the average flow rate [L/s]; t is the total usage time [seconds/month];
Ccycle = c × F
where Ccycle is the monthly water consumption [m3/month] of the fixtures measured by cycle; c is the water consumption per cycle [L/cycle]; F is the frequency of use [cycles/month].
The water consumption estimated for toilets with flushing valves was performed by multiplying the flow rate of this water fixture as indicated in the Brazilian Plumbing Code NBR 5626 [23] and the average time of flushing valves use in the households.
To represent the water end-use, a descriptive statistic approach was performed by showing the mean value with 90% confidence interval. As the 48 households sample was very heterogeneous, the 90% confidence interval was chosen instead of higher confidence possibilities, to avoid large amplitudes of the results.
As for this paper analyses, the chosen confidence interval can represent 90% of the sample. The interval was calculated using the Student's distribution as an alternative of normal distribution, as the population mean is unknown, assuming that the values were normally distributed.
A degree of freedom equal to the sample size minus one (i.e., n−1) was considered. The calculations were performed using the computer program Minitab 16 [24] by using Equation (3). Confidence intervals were determined also for each studied income group. Water end-uses were classified into potable (kitchen and bathroom taps and showers) and non-potable (toilet flushing, washing machine, and service area and external taps).
Water 06 01985 i001
where x is the mean value of the sample; S is the standard deviation of the sample; n is the size of the sample; t0.05(n-1) is the statistic of the Student’s distribution with 5% significance on each side of the distribution, totalling 90% confidence in both sides of the distribution; μ is the estimated population mean.
During the interviews, householders were asked to provide the monthly water consumption pattern recorded in their water bill for the previous 12 months prior the study. This information was used to determine the average monthly water consumption of households, as well as the basis to determine whether or not water end-use estimations were within the expected water consumption range. Moreover, the following information was also obtained from water bills: water tariff type (e.g., standard residential tariff, low-income residential tariff, etc.), sewage tariff type (e.g., 80% of water bill charge, 100% of water bill charge, no applicable as sewage is treated on-site), the total water and sewage charges.
The validation of estimated end-uses was performed by comparing the combined estimated water consumption of each water end-use with the expected water consumption (i.e., ±20% of the average water consumption recorded by the water utility). This study has considered a ±20% between the average water consumption recorded by the water utility and the water consumption values obtained by the analysis as a sufficient estimate. When the estimated water consumption was outside the upper and lower limits of the expected water consumption, interviews were repeated or the estimation was considered as invalid.

3.3. Daily per Capita Water Consumption

The daily per capita water consumption was calculated based on the estimated water consumption in each household and the number of consumer agents fixed (Equation (4)). The fixed population refers to householders with continuous permanence the house.
Water 06 01985 i002
where Cdaily is the daily per capita water consumption [L/capita·day]; Cwater is the total water consumption during one day [L/day]; N is the number of consumer agents per day [householders].

4. Results

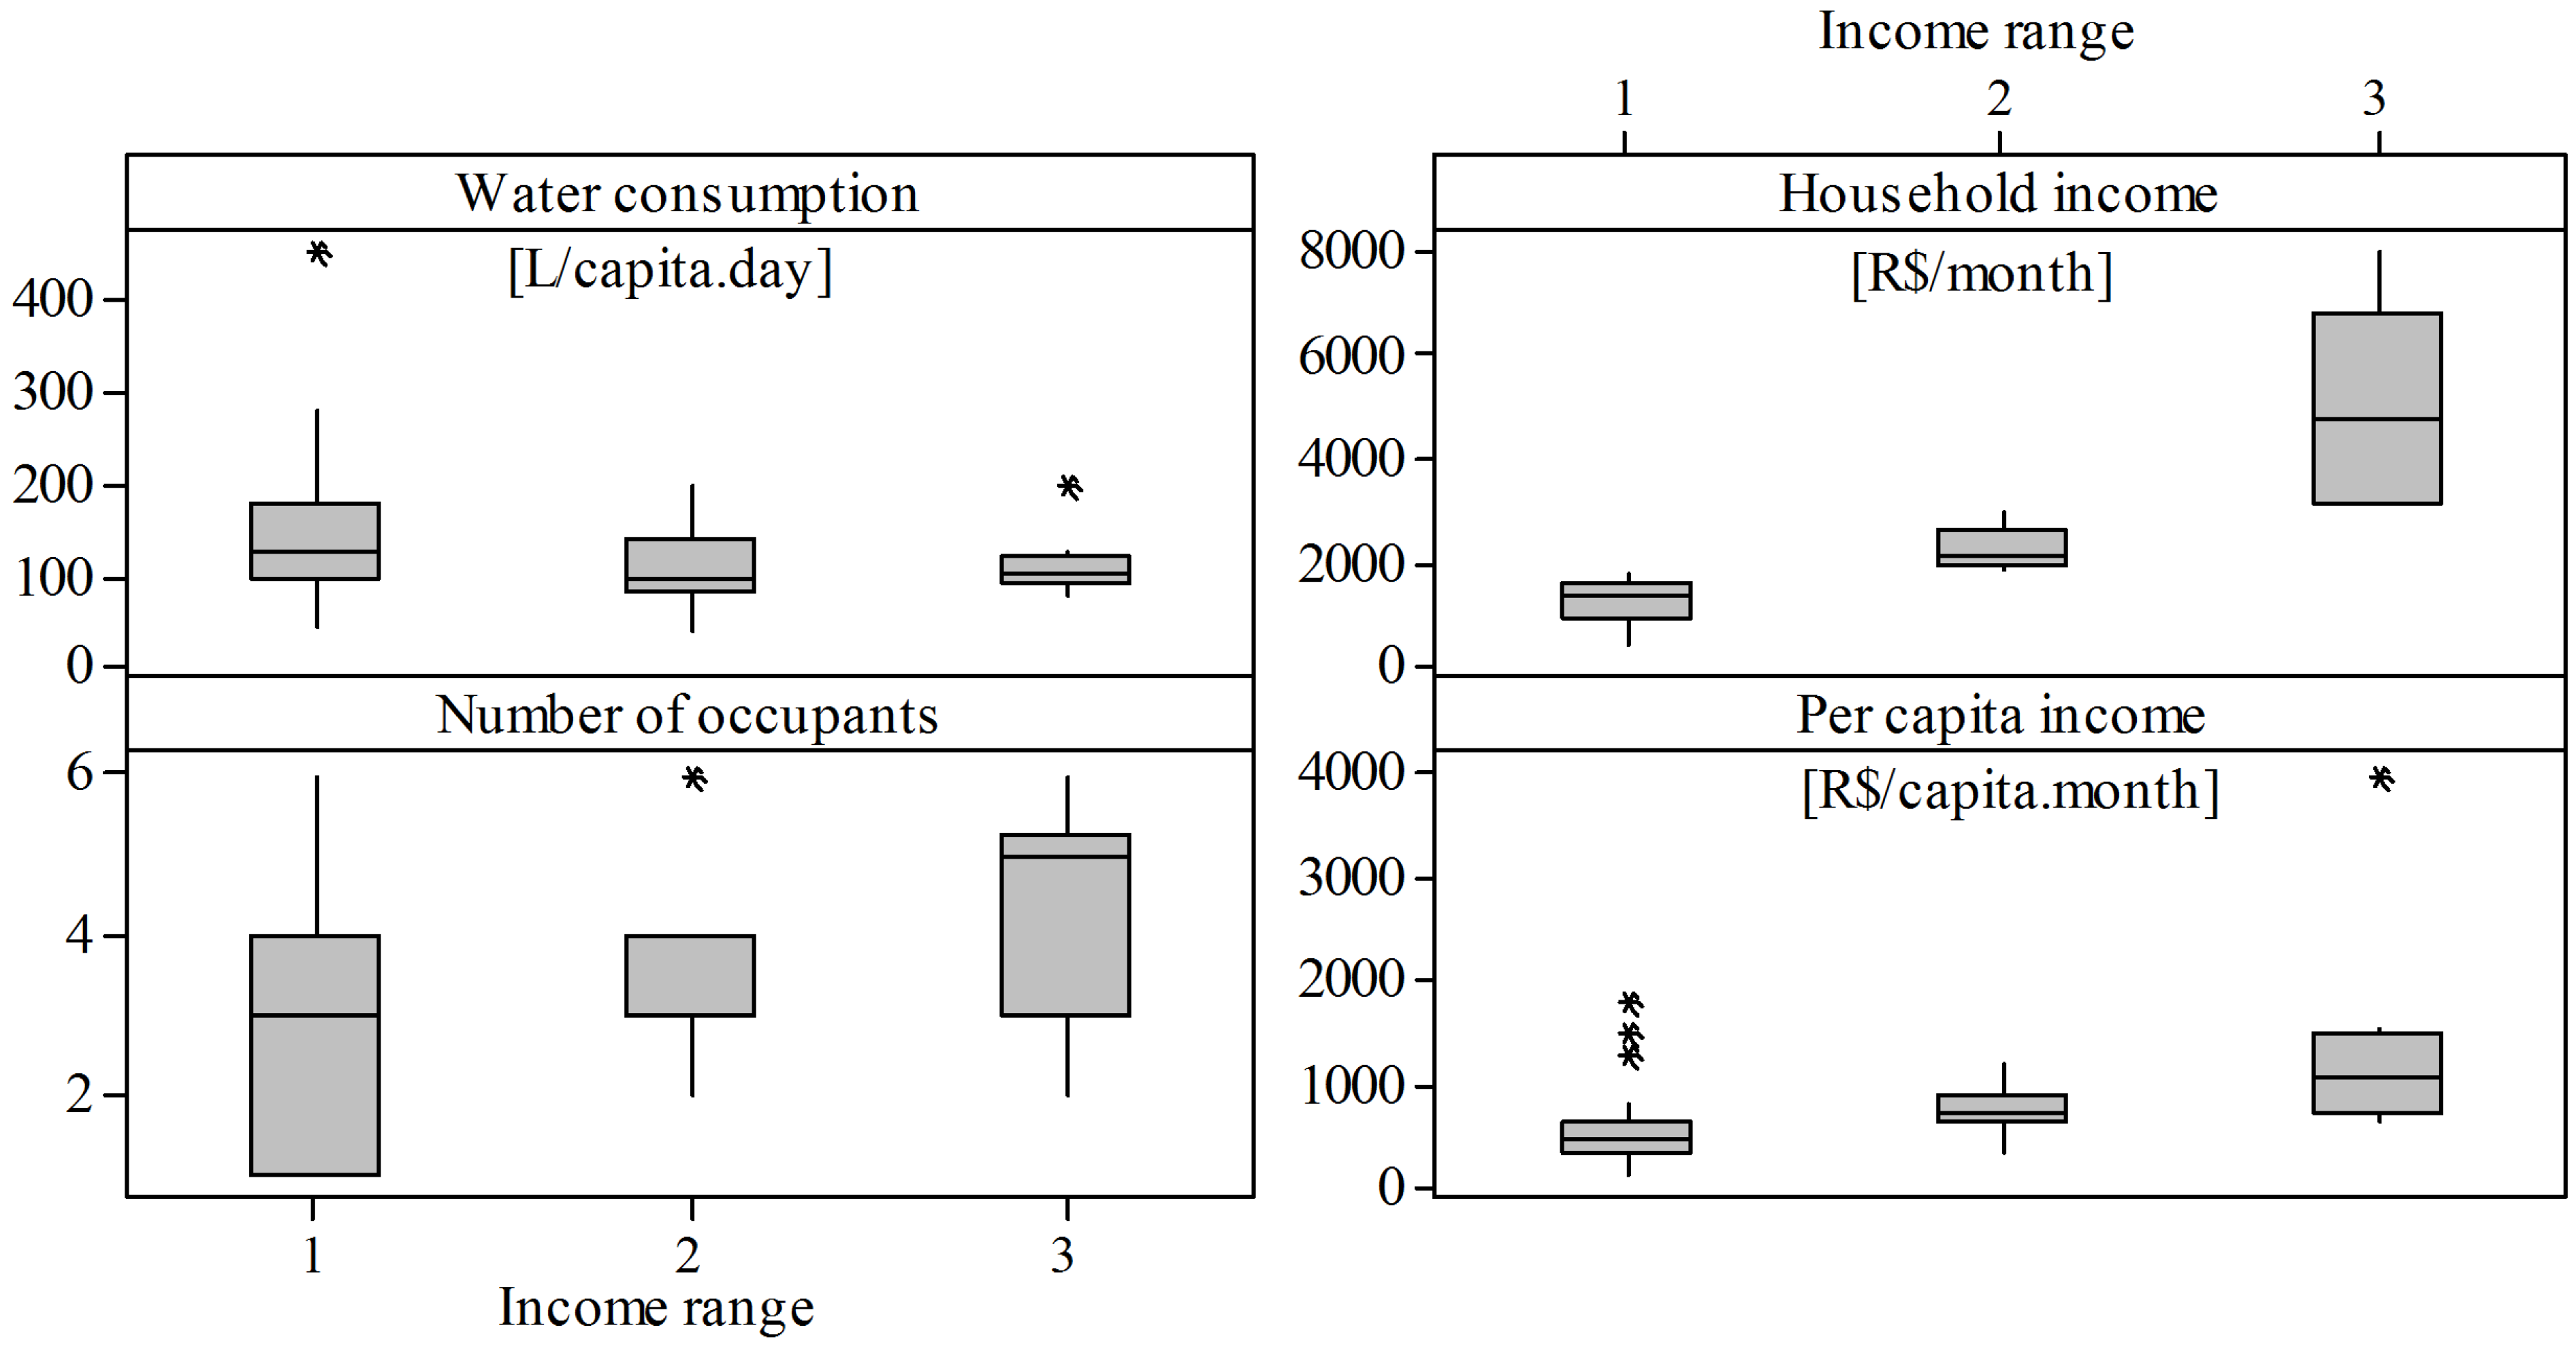
4.1. Socioeconomic Characteristics of Households

Figure 2 illustrates the socioeconomic characteristics of the studied households. When considering the three levels of income range, 24 households were classified in income range 1, 14 households were classified in income range 2, and 10 households were classified in income range 3.
Figure 2. Socioeconomic characteristics of studied households.
Water 06 01985 g002
The maximum monthly household income was equal to R$8,000.00 (US$3,636.36), while the highest income was equal to R$4,000.00 per capita (US$1,818.18). These maximum values are likely outliers as the median values are considerably lower, closer to R$4,100.00 for total income, and R$1,000.00 for per capita income, for income range 3. The number of occupants in households ranged from one to six, with an average value of four occupants.
Among the different income ranges, it can be noticed that the median value of the number of occupants increases with the household income. The household income itself has higher amplitude in the third income range. The per capita water consumption has higher amplitude in the first income range, i.e., there was greater difference between the maximum and minimum water consumption. Furthermore, the sample of houses in the first income range had more data and these data varied widely.

4.2. Water Fixtures or Appliances

The assessed households were fitted with the following water fixtures and appliances: shower, toilet, washing machine, kitchen tap, bathroom tap, and laundry tap. Table 1 shows the quantity of each water fixture and appliance type in the studied sample according to income ranges. For example, for income range 2, 10 out of 14 households have washing machine; for income range 1, 16 out of 24 households do not have external taps. There is no correlation between water consumption and quantity of each water fixture and appliance type for the studied sample.
Table 1. Quantity of water appliances or fixtures per income range.
Water fixtureIncome range
123
QuantityQuantityQuantity
012301230123
Toilet with flushing valve11121-563-631-
Toilet with cistern1212--95--46--
Shower1203--122--82-
Washing machine420--410--19--
Washing basin1212--122-181-
Kitchen tap12111-122--91-
Laundry tap4191-68--451-
External tap168--95--262-
Others222--14---82--
Among the studied households, 81% had washing machines, 48%, toilets with cisterns, and 54%, toilets with flushing valves. Furthermore, only 30% of the households used water for external end-uses, such as irrigation and car washing.

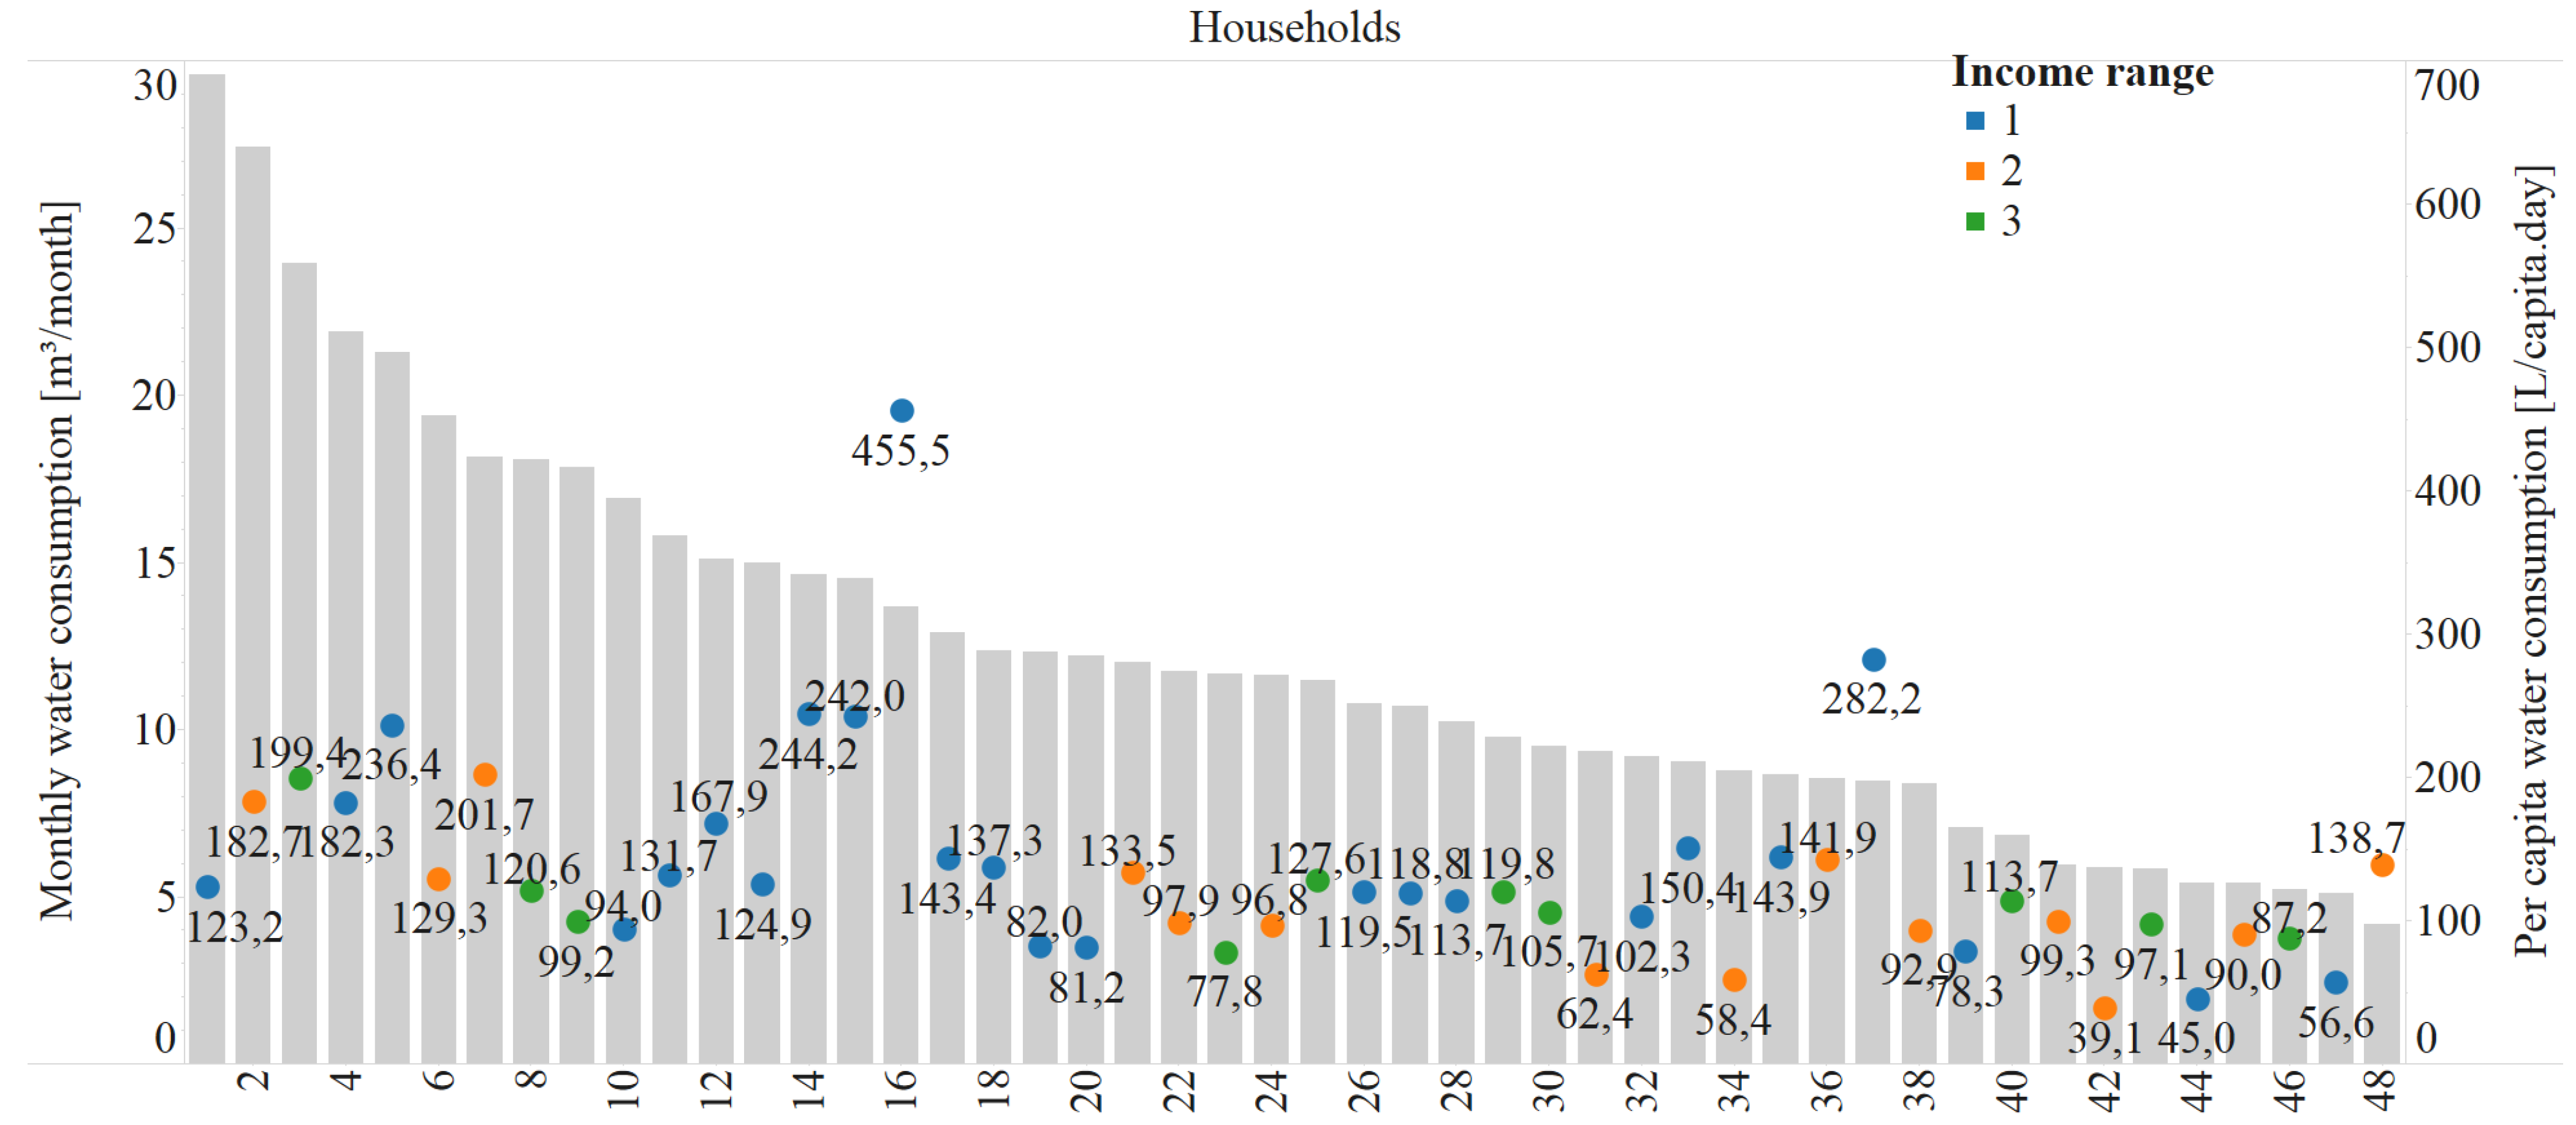
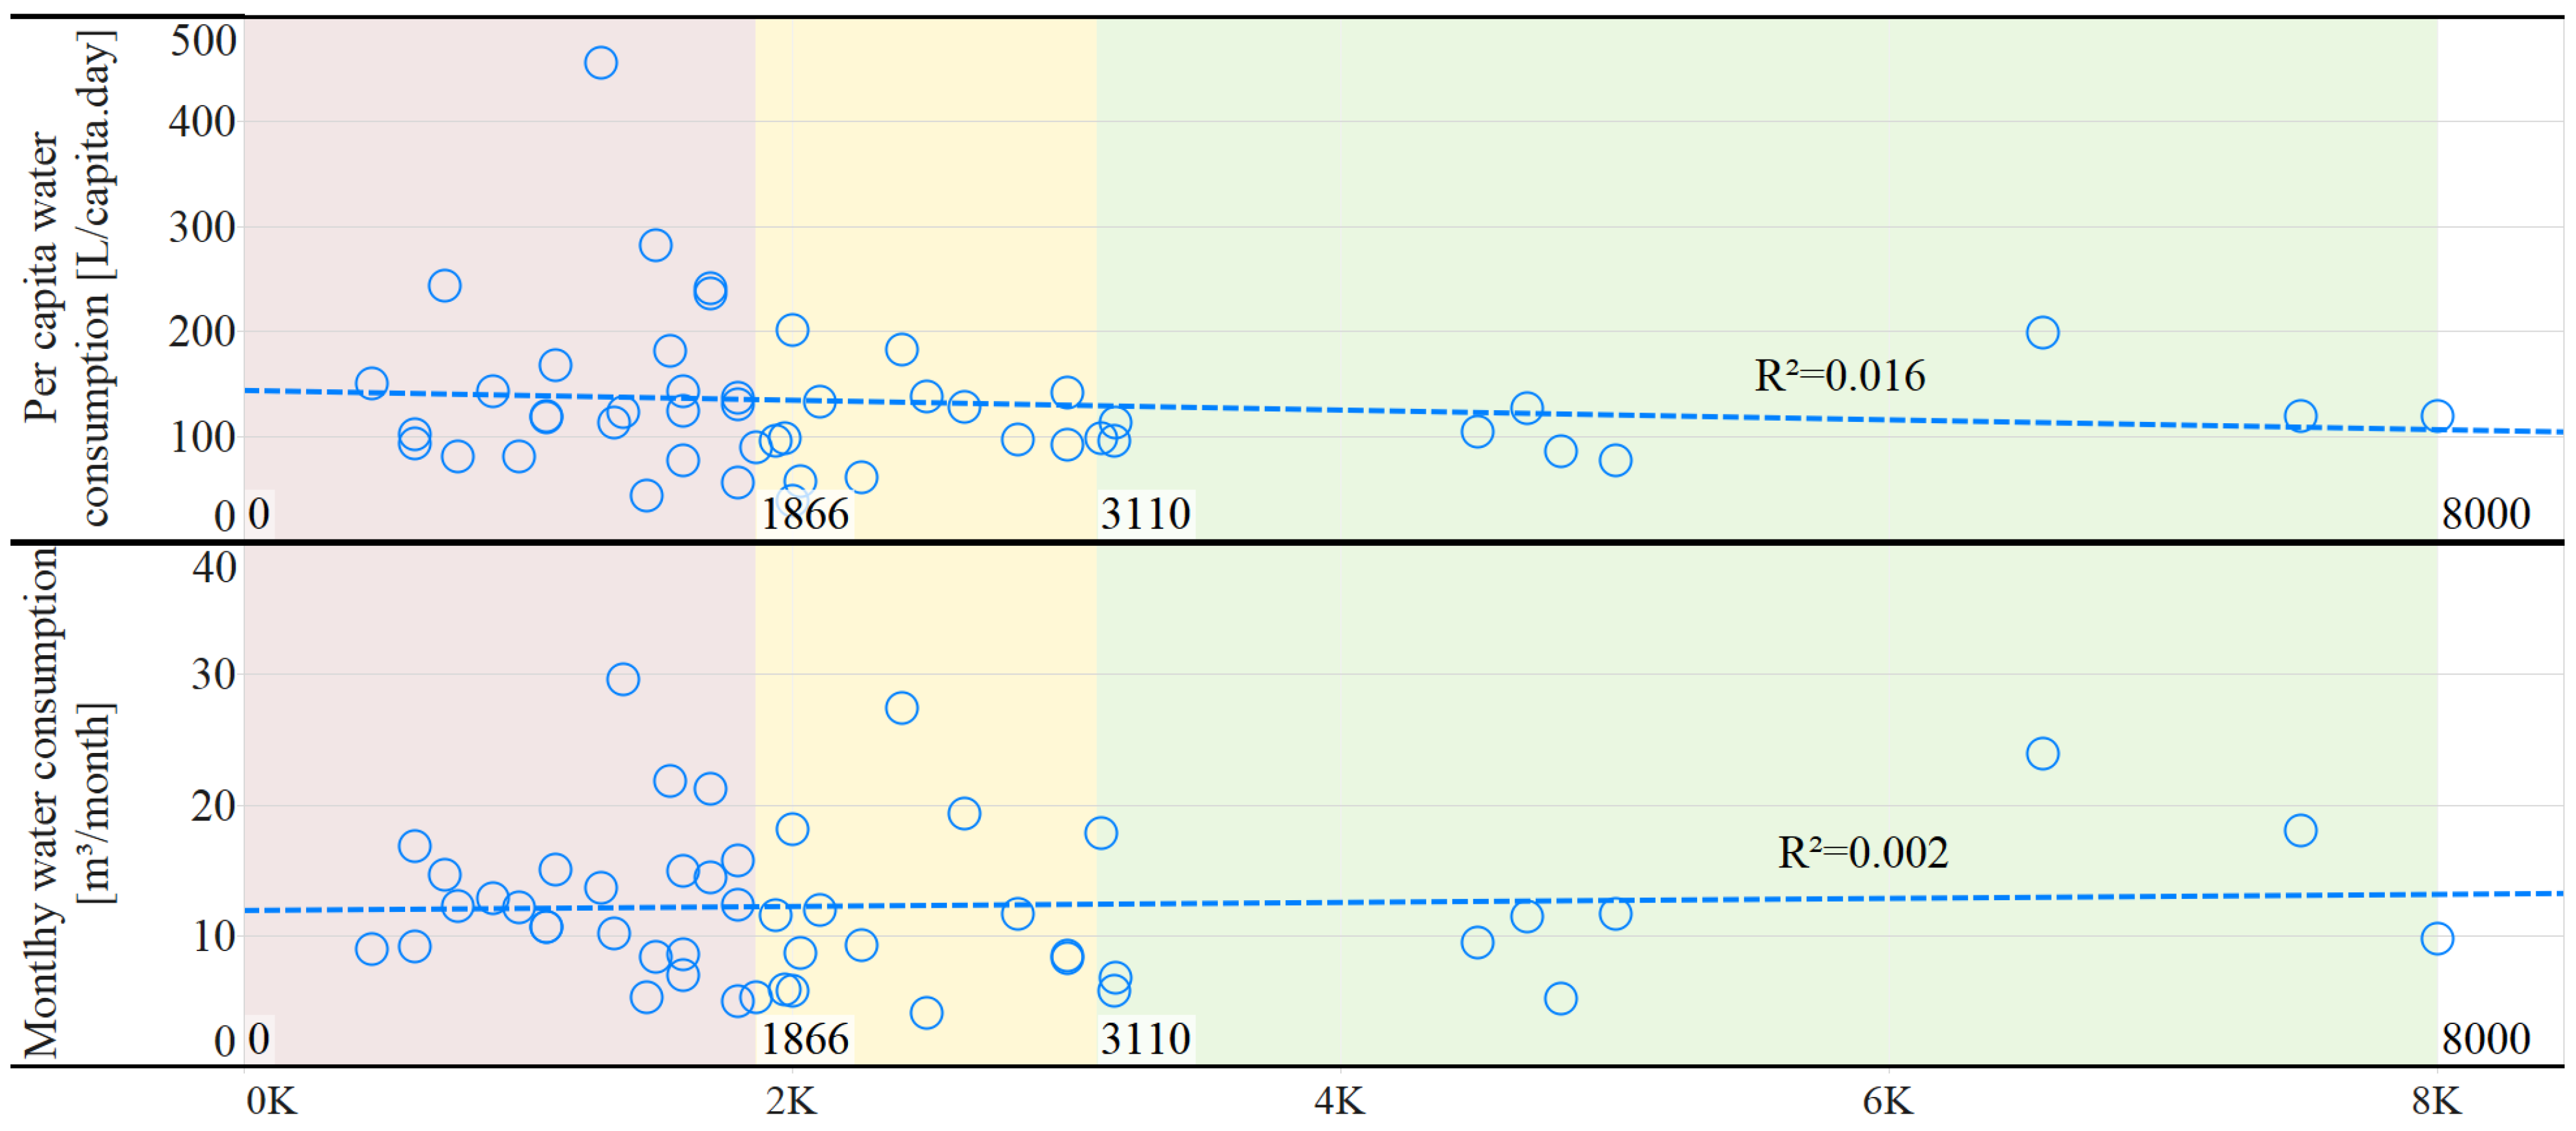
4.3. Water Consumption Pattern

The average daily water consumption per capita in the 48 studied households was equal to 133 L/capita·day. Figure 3 illustrates the monthly and per capita water consumption patterns, as well as the income classification (e.g., ranges 1, 2, and 3), for the studied households.
Figure 3. Monthly and per capita water consumption patterns and income classification for the studied households.
Water 06 01985 g003
The largest difference for water consumption per capita among households classified in the three income ranges was equal to 37%. This difference was observed between households with income up to three minimum wages (152 L/capita·day) and household with income range between three and five minimum wages (112 L/capita·day). For households with income over five minimum wages, the water consumption was equal to 115 L/capita·day on average. Similar water consumption patterns are described in other studies carried out in Brazil [7,8,9,25].
However, it was noticed that lower water consumption values occur in households with higher incomes. That would explain that there is no correlation between water consumption and household income for the studied sample, as shown in Figure 4. The water consumption for the households was related to the lifestyle of the residents. It was noted in interviews that many residents, or at least some members of the families, prepare their meals at home, which greatly influences the water consumption for cooking and dishwashing (kitchen tap). While in higher income families lunch at restaurant may be more frequent. In addition, some families use water from the kitchen tap for drinking. Similar results for low income households in Florianópolis were described by Vieira [25], where residences with longer permanence occupants at home had higher water consumption.
The total monthly water consumption was up to the 10 m3 for 33% of the households. Such households have no economic incentive to reduce their water consumption or use alternative water sources, as the local water utility charges a fixed rate for total water consumption equal to 10 m3/month per house.
Figure 4. Correlation between the monthly water consumption and per capita water consumption with household income, showing the three intervals of income.
Water 06 01985 g004

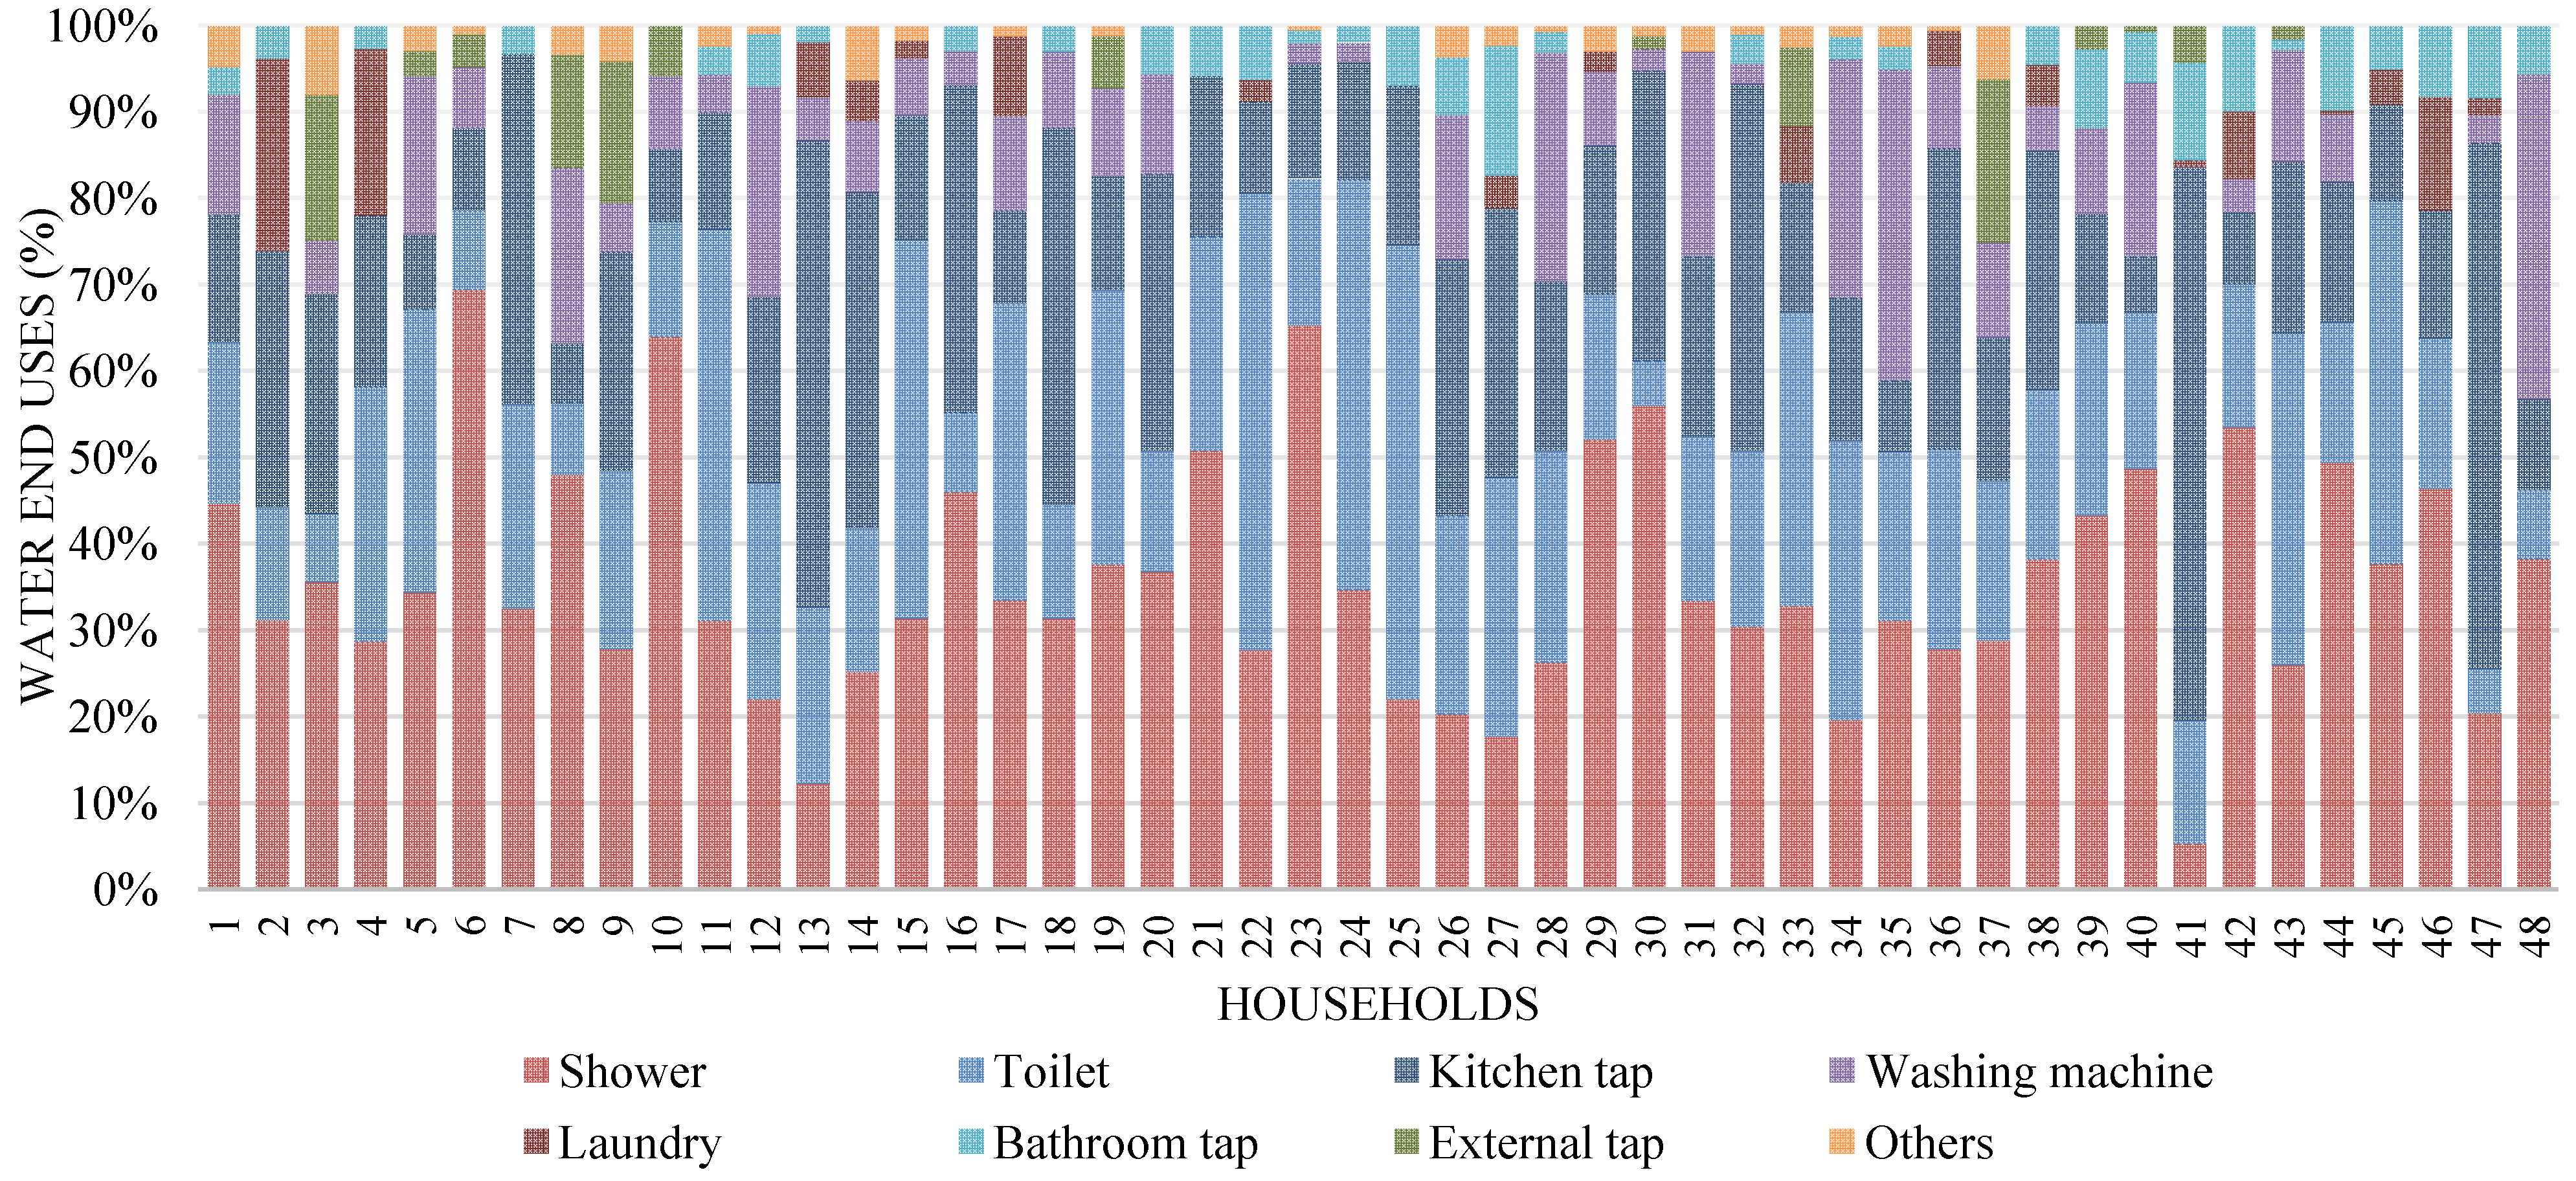
4.4. Water End-Uses Estimation

Throughout the on-site assessment of water fixtures, the flow rate of showers and taps were determined as illustrated in Table 2. The estimated water consumption per cycle for washing machines and toilets with cisterns is shown in Table 3.
Table 2. Flow rate of water fixtures in low-income households.
Water fixtureFlow rate (L/s)
AverageStandard deviation
Shower0.070.03
Bathroom tap0.080.04
Kitchen tap0.090.05
Laundry tap0.130.13
External tap0.170.11
Table 3. Water consumption per cycle of water fixtures and appliances in low-income households.
Water fixture or applianceWater consumption (L/cycle)
AverageStandard deviation
Toilet with flushing valve6.21.4
Toilet with cistern11.52.6
Washing machine102.550.2
The flow rate of water fixtures significantly varied among the studied households (Table 2). Such variation was greater for end-uses that are generally operated at their maximum flow rates, i.e., laundry and external taps. The average flow rates for these fixtures were high, 0.13 and 0.17 L/s, respectively, as they are usually operated at their maximum capacity in order to accomplish in a faster way the intended function (e.g., filling up a bucket or watering plants). Therefore, the flow rate of these two fixtures is dependent on the maximum supply capacity of plumbing systems depending on the characteristics of the plumbing systems, including but not limited to: (i) direct or indirect town water supply; (ii) head losses in the plumbing components; (iii) tap type.
A similar trend was observed for the water consumption per cycle for water fixtures and appliances (Table 3). Such parameter presented a larger variation for washing machines as their volume is directly proportional to the washing machine type and model and washing cycle used.
Table 4 shows the monthly indicator of consumption for each water fixture and appliance, in which the average and the upper and lower limit values are presented for the three income ranges. For example, the washing machine had an average water consumption, upper and lower limit of 30.6, 12.2 and 49.1 L/capita·day, respectively for income range 1. However, measured flow rates in each water fixture or appliance were used to estimate the water end-uses. Table 5 shows the average, lower and upper limit values for the daily water consumption in water fixtures and appliances. Figure 5 shows the water end-uses for each assessed household.
Table 6 shows the per capita water consumption for each appliance and fixture and the limits of the confidence interval for each income range. On average, shower and toilet represent the greatest end-uses for all income ranges. However, in income ranges 1 and 3, the third larger end-use is the kitchen tap; yet, for the income range 2, the third larger end-use is the washing machine.
Showers were the greatest end-uses among households, 30%–36% on average and ranging between 20% and 52% in the lower and upper ranges limits. The second largest water consumption was observed for toilets, i.e., 8%–31%, followed by kitchen taps, 9%–26%. On average, 67%–72% of the water consumption in the studied low-income households is used for these three end-uses. However, the contribution of each water fixture or appliance for the total water consumption varied considerably among households.
Table 4. Average, lower and upper limit values for the daily water consumption (per capita) in water fixtures and appliances.
Water FixtureIncome 1Income 2Income 3
LL (1) 90%Average (L/capita·day)UL (2) 90%LL (1) 90%Average (L/capita·day)UL (2) 90%LL (1) 90%Average (L/capita·day)UL (2) 90%
Shower52.379.4106.527.553.779.923.039.756.4
Toilet34.946.057.017.925.433.09.219.529.8
Kitchen tap31.945.158.312.822.632.410.919.327.7
Washing machine12.230.649.12.729.258.92.87.211.5
Laundry tap4.616.227.81.76.611.41.42.23.1
Bathroom tap7.111.115.12.87.111.40.93.27.6
External tap1.38.014.76.78.410.04.411.618.7
Others3.05.78.40.71.52.41.93.24.4
Total (3) 152.3 111.7 114.8
Notes: (1) LL is lower limit values for 90% confidence; (2) UL is upper limit values for 90% confidence; (3) The total is not the sum of the average value of water consumption of each water fixture, but is the average of the own daily water consumption in each house. The values would be different as each house have different quantities of fixtures, which was taken in account when averaging the water fixture values for Table 5.
Table 5. Average, lower and upper limit values for the daily water consumption (per household) in water fixtures and appliances.
Water fixtureIncome 1Income 2Income 3
LL (1) 90%Average (L/day)UL (2) 90%LL (1) 90%Average (L/day)UL (2) 90%LL (1) 90%Average (L/day)UL (2) 90%
Shower121.7148.4175.289.3147.7206.291.0163.4235.8
Toilet74.799.8125.038.865.191.556.570.484.3
Kitchen tap79.196.8114.558.878.698.435.888.4140.9
Washing machine40.563.286.011.469.5127.59.038.868.7
Laundry tap11.830.449.07.025.544.04.99.714.4
Bathroom tap14.621.728.911.421.030.63.315.938.0
External tap8.019.931.817.020.824.318.653.588.5
Others3.78.814.00.42.03.52.99.115.2
Total (3) 434.2 373.1 400.6
Notes: (1) LL is lower limit values for 90% confidence. (2) UL is upper limit values for 90% confidence. (3) The total is not the sum of the average value of water consumption of each water fixture, but is the average of the own daily water consumption in each house. The values would be different as each house have different quantities of fixtures, which was taken in account when averaging the water fixture values for Table 5.
Figure 5. Water end uses in households sample.
Water 06 01985 g005
Table 6. Average percentage water end-uses and lower and upper limits for 90% confidence.
Water fixtureIncome 1Income 2Income 3
LL(1) 90%Average (%)UL(2) 90%LL(1) 90%Average (%)UL(2) 90%LL(1) 90%Average (%)UL(2) 90%
Shower253036213448203652
Toilet16202314182382031
Kitchen tap15202691521131619
Washing machine81318316302915
Bathroom tap26102610123
Laundry tap346357148
External tap24745641220
Others123001123
Notes: (1) LL is lower limit values for 90% confidence. (2) UL is upper limit values for 90% confidence.
By using confidence intervals, the variability of the water consumption pattern for each appliance was estimated. For instance, the use of shower in households classified within the income range 1 represented, on average, 30% of the water consumption, ranging from 25% to 36% with a confidence interval of 90%. Kitchen tap and toilet flushing had comparable monthly water consumption patterns; however, they were not significantly different with 90% confidence interval, due to their large internal variation among studied households.
Non-potable water end-uses (toilet flushing, washing machine, and laundry and external taps) were equivalent on average to 42%–45% of the total water consumption in households. Such end-uses can be supplied with alternative water sources, including rainwater for all end-uses thereof. Greywater for toilet flushing and external taps could be used to supply 23%–32% of the total water demand in households; whereas it could be produced from 55% of the wastewater streams generated in the households from showers, bathroom taps, washing machines, and laundry tap. Therefore, this water source has a great potential for use, as the supply capacity of greywater surpasses the demand.

5. Conclusions

This article characterizes the water consumption patterns and water end-uses in a sample of 48 low-income houses in the metropolitan region of Florianópolis, Southern Brazil.
The results indicated that the shower was the water appliance responsible for the largest portion of water consumption in households. The water consumption pattern was associated with the lifestyle of the residents.
Based on the analysis of water end-uses, it was possible to investigate the demand for non-potable water together with the socioeconomic data of household assessed. The analysis of water consumption per capita between the different evaluated income ranges indicated that there were differences of up to 26% on average of the water consumption per capita between the different household income ranges assessed. Similar water consumption patterns per capita were found in other Brazilian studies. Households with incomes up to three minimum wages consumed 152 L/capita·day on average; while households with income between three and five minimum wages, 112 L/capita·day. Households with incomes over five minimum wages consumed 115 L/capita·day of water on average. No correlation was found between income and water consumption. The results of this study can be used to estimate the consumption of water for new buildings, as well as to develop integrated water management strategies (water-saving plumbing fixtures, rainwater harvesting, and greywater reuse) in low income developments in Florianópolis. This knowledge about water end-uses and water consumption patterns may be used for awareness campaigns about water conservation practices among low-income households.

6. Limitations

Some limitations were observed in this study, such as the absence of specific meters (sensors or data loggers) for measuring flow rates and the frequency and duration of use of water appliances to determine the water consumption and end-uses.
There was no measurement of average volume per cycle usage in toilets with cistern and washing machines. These volumes were assumed equal to the suggested values by the Brazilian Plumbing Code NBR 5626 and values presented by manufactures and in the PROCEL catalog, respectively.

Author Contributions

Ana Kelly Marinoski contributed in the literature review, by searching for studies of end-uses and water consumption per capita in houses; wrote the introduction and participated in the field survey. Abel Silva Vieira developed the questionnaires and spreadsheets used to calculate water end uses; coordinate the field survey and interviews with householders. Marinoski and Vieira participated in the composition of the manuscript in the method, results and conclusion sections. Arthur Santos Silva participated in data processing, elaborated the statistical analysis, graphs, tables and figures. Enedir Ghisi elaborated the concept and the idea of the manuscript content and reviewed the manuscript.

Conflicts of Interest

The authors declare no conflict of interest.

References

  1. Rocha, A.L.; Barreto, D.; Ioshimoto, E. Caracterização e monitoramento do consumo predial de água (Water consumption assessment and monitoring in building); National Programme to Combat Wasting Water—Technical Support Document # E1.; Ministério do Planejamento e Orçamento: Brasília, Brazil, 1998. (In Portuguese)
  2. Giurco, D.P.; Carrard, N.; Mcfallan, S.; Nalbantoglu, M.; Inman, M.; Thornton, N.; White, S. Residential end Use Measurement Guidebook: A Guide to Study Design, Sampling and Technology; The Institute for Sustainable Futures, UTS and CSIRO for the Smart Water Fund: Victoria, Australia, 2008. [Google Scholar]
  3. Willis, R.M.; Stewart, R.A.; Giurco, D.P.; Talebpour, M.R.; Mousavinejad, A. End use water consumption in households: Impact of socio-demographic factors and efficient devices. J. Clean. Prod. 2013, 60, 107–115. [Google Scholar] [CrossRef]
  4. Inman, D.; Jeffrey, P. A review of residential water conservation tool performance and influences on implementation effectiveness. Urban. Water J. 2006, 3, 127–143. [Google Scholar] [CrossRef] [Green Version]
  5. Garcia, A.P.A.; Santos, M.; Conceição, D.; Machado, A.; Kiperstok, A. Consumo domiciliar e uso racional da água em áreas de baixa renda: Pesquisa de opinião(Household consumption and rational use of water in low-income areas: Survey); I Congresso Baiano de Engenharia Sanitária e Ambiental: Salvador, Brazil, 2010. (In Portuguese) [Google Scholar]
  6. Cohim, E.; Garcia, A.P.A.; Kiperstok, A.; Dias, M. Consumo de água em Residências de Baixa Renda—Estudo de Caso (Water consumption in low-income households—A case study); 25° Congresso Brasileiro de Engenharia Sanitária e Ambiental: Recife, Brazil, 2009. (In Portuguese) [Google Scholar]
  7. Ywashima, L.A.; Campos, M.A.S.; Piaia, E.; Luca, D.M.P.; Ilha, M.S.O. Caracterização do uso de água em residências de interesse social em Paulínia (Water consumption assessment in low-income houses in Paulínia). In Proceedings of the XI Encontro Nacional de Tecnologia do Ambiente Construído, Florianópolis-SC, Brazil, 23–25 August 2006. (In Portuguese)
  8. Dantas, C.T.; Ubaldo, L., Jr.; Potier, A.C.; Ilha, M.S.O. Caracterização do uso de água em residências de interesse social em Itajubá (Water consumption assessment in low-income households in Itajubá). In Proceedings of the XI Encontro Nacional de Tecnologia do Ambiente Construído, Florianópolis-SC, Brazil, 23–25 August 2006. (In Portuguese)
  9. Oliveira, L.H.; Sousa, L.C.; Silva, K.A.; Paixão, A. Caracterização do uso da água em habitações unifamiliares de interesse social (Water consumption assessment in single low-income households). In Proceedings of the XI Encontro Nacional de Tecnologia do Ambiente Construído, Florianópolis-SC, Brazil, 23–25 August 2006. (In Portuguese)
  10. Bradley, R.M. Forecasting domestic water use in rapidly urbanizing area in Asia. J. Environ. Eng. 2004, 130, 465–471. [Google Scholar] [CrossRef]
  11. Ghisi, E.; Oliveira, S.M. Potential for potable water savings by combining the use of rainwater and greywater in houses in Southern Brazil. Build. Environ. 2007, 42, 1731–1742. [Google Scholar] [CrossRef]
  12. Ghisi, E.; Ferreira, D.F. Potential for potable water savings by using rainwater and greywater in a multi-storey residential building in southern Brazil. Build. Environ. 2006, 42, 2512–2522. [Google Scholar] [CrossRef]
  13. Sanchez, D.C.; Prado, R.T.A. Caracterização de hábitos de uso da água em edifícios residenciais multifamiliares localizados em São Paulo (Characterization of habits of water use in multifamily residential buildings located in São Paulo). In Proceedings of the X Simpósio Nacional de Sistemas Prediais: Desenvolvimento e inovação, São Carlos-SP, Brazil, 30–31 August 2007. (In Portuguese)
  14. Coelho, G.M.; Ghisi, E. Avaliação dos usos finais de água em residências unifamiliares localizadas em Blumenau-SC (Evaluation of water end uses in single-family residences located in Blumenau-SC). In Proceedings of the XII Encontro Nacional de Tecnologia do Ambiente Construído, Fortaleza—CE, Brazil, 7–10 October 2008. (In Portuguese)
  15. Beal, C.; Stewart, R.A.; Fielding, K. A novel mixed method smart metering approach to reconciling differences between perceived and actual residential end use water consumption. J. Clean. Prod. 2013, 60, 116–128. [Google Scholar] [CrossRef]
  16. Lee, D.-J.; Park, N.-S.; Jeong, W. End use analysis of household water by metering: The case study in Korea. Water Environ. J. 2012, 26, 455–464. [Google Scholar] [CrossRef]
  17. Mayer, P.W.; DeOreo, W.B.; Opitz, E.M.; Kiefer, J.C.; Davis, W.Y.; Dziegielewski, B.; Nelson, J.O. Residential end uses of water; AWWA Research Foundation and American Water Works Association: Denver, CO, USA, 1999. Available online: http://www.aquacraft.com/sites/default/files/pub/Mayer-%281999%29-Residential-End-Uses-of-Water-Study-Executive-Summary_0.PDF (accessed on 23 March 2014).
  18. Villarreal, E.L.; Dixon, A. Analysis of a rainwater collection system for domestic water supply in Ringdansen, Norrköping, Sweden. Build. Environ. 2005, 40, 1174–1184. [Google Scholar] [CrossRef]
  19. Matos, C.; Teixeira, C.A.; Duarte, A.A.L.S.; Bentes, I. Domestic water uses: Characterization of daily cycles in the north region of Portugal. 2013, 458–460, 444–450. [Google Scholar]
  20. Fan, L.; Liu, G.; Wang, F.; Geissen, V.; Ritsema, C.J.; Tong, Y. Water use patterns and conservation in households of Wei River Basin, China. Resour. Conserv. Recycl. 2013, 74, 45–53. [Google Scholar] [CrossRef]
  21. Ministério das Cidades. Secretaria Nacional de Habitação, Gabinete da Secretaria. Programa Minha Casa, Minha Vida (PMCMV). Medida Provisória #514, de 2010, Destaques (Ministry of Cities. National Department of Habitation, Office of the Secretary. Minha Casa, Minha Vida. Provisional Measure #514, 2010). Brasília, Brazil, 2011. (In Portuguese) [Google Scholar]
  22. PROCEL—Programa Nacional de Conservação de Energia Elétrica. [National Program for Energy Conservation]. Available online: http://www.eletrobras.com (accessed on 28 April 2012).
  23. Instalação predial de água fria (Brazilian plumbing code); NBR 5626; Associação Brasileira de Normas Técnicas (ABNT) (Brazilian Association of Technical Standards): Rio de Janeiro, Brazil, 1998. (In Portuguese)
  24. Minitab. Minitab 16 Statistical Software. (Computer Software). Minitab: State College, PA, 2010. Available online: http://www.minitab.com (accessed on 12 March 2013).
  25. Vieira, A.S. Uso racional de água em habitações de interesse social como estratégia para a conservação de energia em Florianópolis, Santa Catarina (Integrated water management in low-income households for energy conservation in Florianópolis city). Master’s Thesis, Federal University of Santa Catarina, Florianópolis-SC, Brazil, 2012. [Google Scholar]

