Article

Lake Fluctuation Effectively Regulates Wetland Evapotranspiration: A Case Study of the Largest Freshwater Lake in China

State Key Laboratory of Lake Science and Environment, Nanjing Institute of Geography and Limnology, Chinese Academy of Sciences, Nanjing 210008, China
*
Author to whom correspondence should be addressed.
Water 2014, 6(8), 2482-2500; https://doi.org/10.3390/w6082482
Submission received: 29 April 2014 / Revised: 11 July 2014 / Accepted: 1 August 2014 / Published: 15 August 2014

Abstract

:
Lakes and wetlands provide valuable water resources. Wetland evapotranspiration (ET) is a key hydrologic component; however, the effects of lake fluctuation on wetland ET remain unclear. The Poyang Lake is the largest freshwater lake in China and experiences a dramatic fluctuation in water level and inundated area. This study used remote sensing data to estimate the wetland ET for Poyang Lake and to illustrate the distribution of wetland ET and its response to lake fluctuations. Our results showed that wetland ET was related to lake fluctuation both spatially and temporally. Within the same year, the difference between annual water evaporation (Ewater) and wetland ET (ETwetland) was primarily attributed to lake fluctuation through its effects on inundated area and exposure days. A 1% increase in inundated area would result in a 7.87 ± 1.13 mm a−1 reduction in annual Ewater-to-ETwetland differences, and a 10-day elongation of exposure could lead to an 11.1 ± 1.6 mm a−1 increase in annual Ewater-to-ETwetland differences, on average. Inter-annually, the Ewater-to-ETwetland differences were attributed to the combined effects of atmospheric and environmental variables and lake fluctuation. The lake fluctuation contributed 73% to the inter-annual ET difference, followed by relative humidity (19%), net radiation (5%), and wind speed (4%). Overall, lake fluctuation effectively regulates wetland ET, and its effect should receive careful consideration in hydrological and water resources studies under the current changing climate.

1. Introduction

Wetlands are defined as the transitional lands between terrestrial and aquatic systems where the water level is usually at or near the surface or the land is covered by shallow water [1]. Lakes and wetlands provide valuable water resources that are important for drinking, fishing, and wetland ecosystems [2]. Water level fluctuation is a key component of hydrology, especially in shallow lakes and wetlands [3,4]. The extent, frequency, and duration of water level fluctuations play an important role in regulating physical processes in lakes [5] and provide alternating habitats suitable for aquatic and terrestrial plants [6].
Evapotranspiration (ET) is a key hydrologic process that is critical to understanding hydrological responses to climate change [7,8,9,10,11]. Globally, terrestrial ET returns approximately 60% of annual precipitation (P) to the atmosphere [12]. ET is an integral component of the water cycle that affects vegetation distribution, climate, and water resources across multiple spatial-temporal scales [7,13,14]. Numerous attempts have been made to estimate ET from vegetation stands and open water in wetlands [15,16,17,18]. Existing studies focus on the variation in ET and its role in wetland water budgets [19]. ET may vary with variations in water level through its effects on water level fluctuations (vertical) and inundated area (horizontal) [15]. With water level fluctuations, the total inundated area and, ultimately, the distribution of vegetation shift [15,20]. For shallow lakes, frequent alternations between dry and wet surfaces have an impact on water and heat fluxes. Such alternations may change evapotranspiration, surface soil moisture, the diurnal course of surface boundary layer, and subsequently the water balance in the wetland. However, a comprehensive assessment of ET remains a challenge over lakes or wetlands due to the limited on-site access to inundated areas, the complexity of wetland cover and ecosystem composition [21]. Remote sensing provides an effective means to estimate regional ET [22,23,24,25], but few studies have investigated the spatial distribution of wetland ET [26]. It remains unclear to what extent the wetland ET varies with lake fluctuation and other environmental influences, which is of great importance to effective management of water resources and a comprehensive understanding of wetland hydrology under a changing climate.
There are approximately 304 million lakes in the world [27]. Only 122 lakes are larger than 1000 km2, among which 11 lakes are located in China [28,29]. Poyang Lake is the largest freshwater lake in China, with a maximum water area of 3680 km2 [30]. This lake experiences dramatic seasonal fluctuations of more than 10 m in water level and thousands of km2 in inundated area. The lake serves as an ideal subject for studying the association between wetland ET variation and lake fluctuations. In this study, we applied remote sensing techniques to estimate wetland ET and to illustrate the distribution of wetland ET and its response to lake fluctuations.

2. Study Area and Data Source
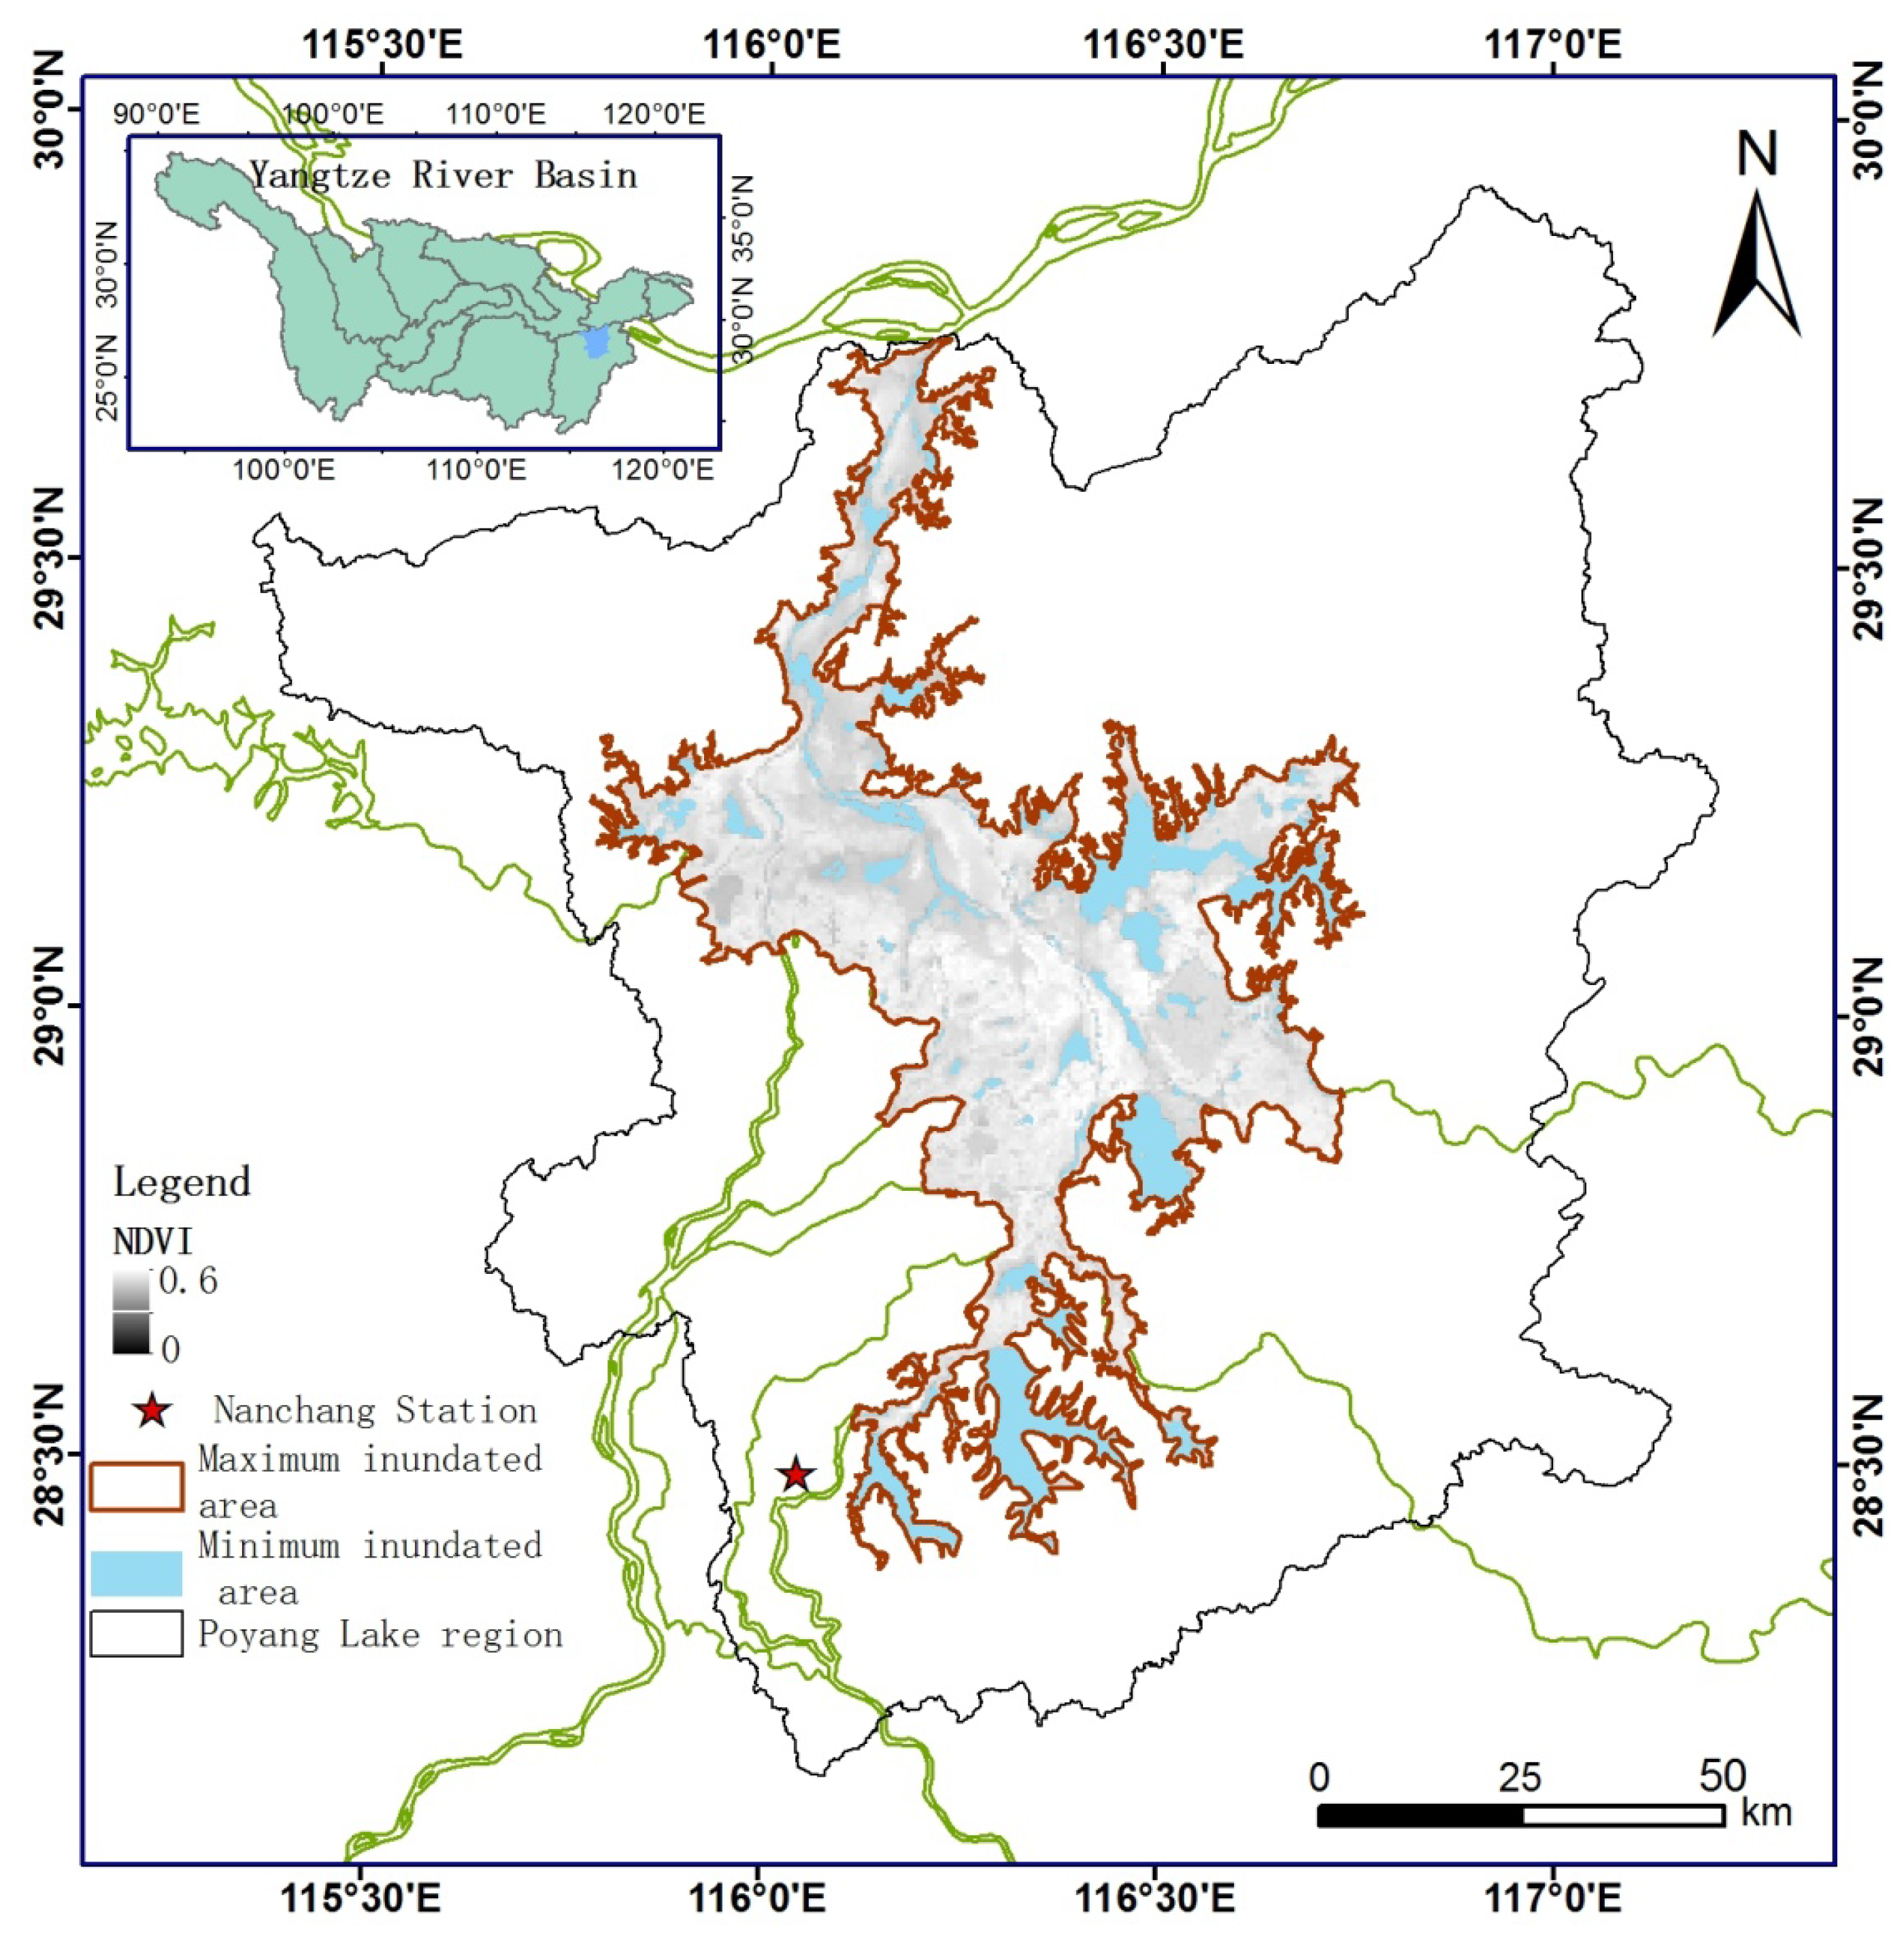
2.1. Study Area

Poyang Lake is located in the northern Poyang Lake basin in the middle Yangtze River basin (24.5°–30.0° N, 113.5°–118.5° E) (Figure 1). The lake exchanges water with the Yangtze River and receives water flows from five rivers: Xiushui, Ganjiang, Fuhe, Xinjiang and Raohe. The Poyang Lake region has a total area of 2.5 × 10⁴ km2.
Figure 1. Geographic location of the Poyang Lake wetland delineated with its maximum and minimum water surface areas.
Water 06 02482 g001
The water level and inundated area of Poyang Lake exhibit remarkable seasonal variation. During the high-water season, from April to September, the inundated area may exceed 3000 km2. The maximum water surface area reaches 3860 km2 at a water level of 22.59 m, corresponding to the maximum inundated area in Figure 1. In the low-water season, from October to March, the inundated area may shrink to less than 1000 km2, forming a narrow meandering channel. The minimum water surface area is 730 km2 at an average water level of 7.68 m, corresponding to the minimum inundated area in Figure 1. Under the Ramsar wetland conservation treaty, wetlands are areas of marsh, fen, peatland or water, whether natural or artificial, permanent or temporary, with water that is static or flowing, fresh, brackish or salt, including areas of marine water the depth of which at low tide does not exceed six meters. Within this definition, the wetland classification system identifies 40 different wetland types in three categories: marine and coastal zone wetlands, inland wetlands and human-made wetlands. The Poyang Lake belongs to a wetland type of seasonal or intermittent freshwater lake in inland wetland classification. The Poyang Lake wetland is defined as the maximum inundated area [31,32]. The lake experiences a subtropical monsoon climate, with an annual mean temperature of 17.8 ± 0.52 °C, and an annual precipitation of 1620 ± 310 mm for the period 1960–2009. Precipitation is concentrated from April to June, accounting for 45%–50% of annual precipitation. The dominant land covers include forest, agricultural fields, grasslands, bare lands, and water surfaces.

2.2. Remote Sensing Data

MODIS (Moderate Resolution Imaging Spectroradiometer) products covering the study area were acquired from the Land Processes Distributed Active Archive Center (LP DAAC) [33]. The selected products included the MODIS geolocation (MOD03), the atmospheric profile (MOD07), the surface reflectance (MOD09), the land surface temperature/emissivity (MOD11_L2) and the albedo (MOD43B3) (Table 1). All products were generated from the Product Generation Executive (PGE) code Version 5. MOD03 includes the solar zenith and the azimuth angles and satellite zenith and azimuth angles. MOD07 supplies air temperature and dew point temperature. MOD09GA provides surface reflectance in seven reflective bands and includes the values corrected after radiometric and atmospheric effects. MOD11_L2 contributes the 1 km land surface temperature and surface emissivity in bands 31 and 32. MOD43B3 provides clear-sky observations at a 1 km spatial resolution for albedo [34]. To satisfy the spatial resolution of ET distribution and maximize the remote sensing information, all parameters from these products were resized to 250 m using the nearest-neighbor algorithm.
Table 1. List of the Moderate Resolution Imaging Spectroradiometer (MODIS) products used in this study.
MODIS productsSpatial resolutionParameters contained
MOD031 kmSolar zenith and azimuth angles, satellite zenith and azimuth angles
MOD09GA500 mSurface reflectance after atmospheric correction
MOD09GQ250 mReflectance of RED and near-infrared band
MOD075 kmAir temperature and dew point temperature
MOD11_L21 kmSurface emissivity and temperature
MOD43B31 kmBlack- and white sky albedos
Because visible, near-infrared and thermal infrared bands are easily affected by weather and cloud cover, the ET estimation was limited to available remote sensing data [35]. Based on cloud detection, the images with greater than 85% clear sky area were selected to estimate regional ET. A total of 349 images of the Poyang Lake basin satisfied the above conditions for 2000–2009. The gaps in the images due to cloud cover were gap-filled using the nearest-neighbor method.

2.3. Field Measurement Data

Actual ET was measured using a Lysimeter at Nanchang station (28.5° N, 115.9° E), which is in an area covered by grassland. The measurement period spanned from September 2007 to August 2008. The precision of the ET measurements is 0.01 mm day−1 [36]. The ET measurements were used to validate the ET retrieved using remote sensing at the site scale.
Meteorological data, including daily air temperature, relative humidity, solar radiation, and precipitation at the Boyang (29.0° N, 116.7° E) and Nanchang stations were available from the China Meteorological Data Sharing Service System [37] for 1960–2009. Water level data at Xingzi station were obtained from the Hydrological Bureau of the Yangtze River Water Resources Commission for 1960–2009.

3. Methods

3.1. ET Estimation

The land surface temperature (Ts)/vegetation index (VI) triangle method was used to retrieve ET from remote sensing data. The method was proposed by Jiang and Islam [38,39] and later improved [40]. This index is based on the Priestley-Taylor (P-T) equation [41]. The P-T parameter is estimated from a triangular distribution in the Ts/VI feature space [42,43]. Due to the combination of its simplicity and physical basis, the method has been widely applied in numerous studies [44,45,46,47,48,49].
ET can be estimated with the following equation [39]:
Water 06 02482 i001
where ET is evapotranspiration (W m−2); Rn is net radiation (W m−2); G is soil heat flux (W m−2); Δ is the slope of saturated vapor pressure at air temperature Ta, γ is the psychometric constant (hPa K−1), and Φ is the P-T parameter representing an effective surface resistance to evapotranspiration [38]. Φ is derived from the triangular space of Ts/VI with a simple linear interpolation between the highest and lowest temperatures for a given value of the normalized difference vegetation index (NDVI). This variable can be expressed as follows:
Water 06 02482 i002
where Φmax is the P-T coefficient of 1.26 [50]; Water 06 02482 i006 is the land surface temperature (K) in a pixel; and Water 06 02482 i007 is the lowest temperature of full vegetation cover for each NDVI interval (NDVIi ), which forms the wet edge in the triangular space of Water 06 02482 i006 versus NDVIi . Water 06 02482 i008 is the highest temperature for each NDVI interval (NDVIi ), which forms the dry edge.
The wet and dry edges of the Ts/VI feature space constitute the boundary condition for surface fluxes. Three steps are required to estimate Φ: (1) establishment of the boundaries of the triangle; (2) interpolation of Φ along the dry edge; and (3) linear interpolation between the and for each NDVI interval (NDVIi). Implementation of the triangle method requires a robust estimation of the edges in the triangular space. To construct the Ts/VI space, the NDVI was generated from the MOD09GQ surface reflectance products, and Ts was extracted from the MOD11_L2 surface temperature products. The wet and dry edges of the triangular space were determined with the algorithm described by Tang et al. [45]. Finally, the Φ value for each pixel was calculated using Equation (2) from the triangular space for the study area.
Rn is another important parameter for ET estimation. This variable is the sum of shortwave and longwave net radiation. Here, we employed the algorithm proposed by Bisht et al. [35] for estimating Rn entirely from MODIS products. The method can be expressed as follows:
Water 06 02482 i003
where Rs and Rs are the downward and upward shortwave radiation (W m−2) and RL and RL are the downward and upward longwave radiation (W m−2), respectively. Alpha is the surface albedo extractable from MOD43; and Ta is the air temperature (K) extracted from MOD07. Ts and εs are the surface temperature and emissivity extractable from MOD11 L2, respectively. The value of εa can be calculated from Ta and the dew point temperature, which is extracted from MOD07.
Daily ET is more applicable than instantaneous ET in hydrological and water resources studies. In this study, the daily ET was estimated from the daily net radiation and near-noon instantaneous evaporative flux (EF) ratio [51,52,53]; this method has proven to be effective over both homogeneous and heterogeneous land surfaces [54,55,56,57]. Daily net radiation was estimated using a sinusoidal model [35] that had previously been applied successfully [58,59]. Due to cloud cover in satellite images, the missing ET values in the time series were reconstructed based on the ET estimations on clear days. There is a close linear correlation between the potential ET and the estimated ET (R2 = 0.82, p < 0.01) [60]. The gaps in ET within the year were filled based on this relationship. Then, the annual ET was obtained by summing the daily ET throughout the year for the Poyang Lake wetland.

3.2. Inundated Area Extraction

Water fluctuation causes variations in the inundated area and the exposure period of the wetland. In remote sensing, water surfaces are easily extracted using an index such as the normalized difference water index (NDWI) [61,62,63,64], which can be expressed as NDWI = (G − NIR)/(G + NIR), where NIR is the surface reflectance in the NIR band, and G is the reflectance value in the green band. A histogram of NDWI was generated for the delineation of the water surface. The sharp contrast between the water and land surfaces results in a bimodal histogram. A threshold value was optimally determined based on the mid-point between the water and land maxima in the generated histogram [65]. The maps of the inundated area are binary images. Pixels with a value of one represents land surface, and pixels with a value of zero represent water surface. The map of exposure days was generated by overlaying maps of the inundated area. Due to the effect of clouds in the satellite images, images for every day could not be obtained. Thus, approximately 50–60 images per year on clear days were selected for the extraction of the inundated area from 2000 to 2009. Considering minor changes in inundated area distribution between two consecutive images in a year, the exposure day for a specific pixel was estimated by the weighted sum of land and inundated area using Equation (4):
Water 06 02482 i004
where n is the number of images selected in one year (e.g., 50–60 images); Di is the value of this pixel on the ith day; ai is the difference between the DOY of the (i-1)th image and the DOY of the ith image; and a1 is the DOY of the first image. Since the DOY of an was not the last day of the year, an = (DOYan − DOYan-1) + (365 − DOYan). The sum of ai equals 365.

4. Results and Discussion

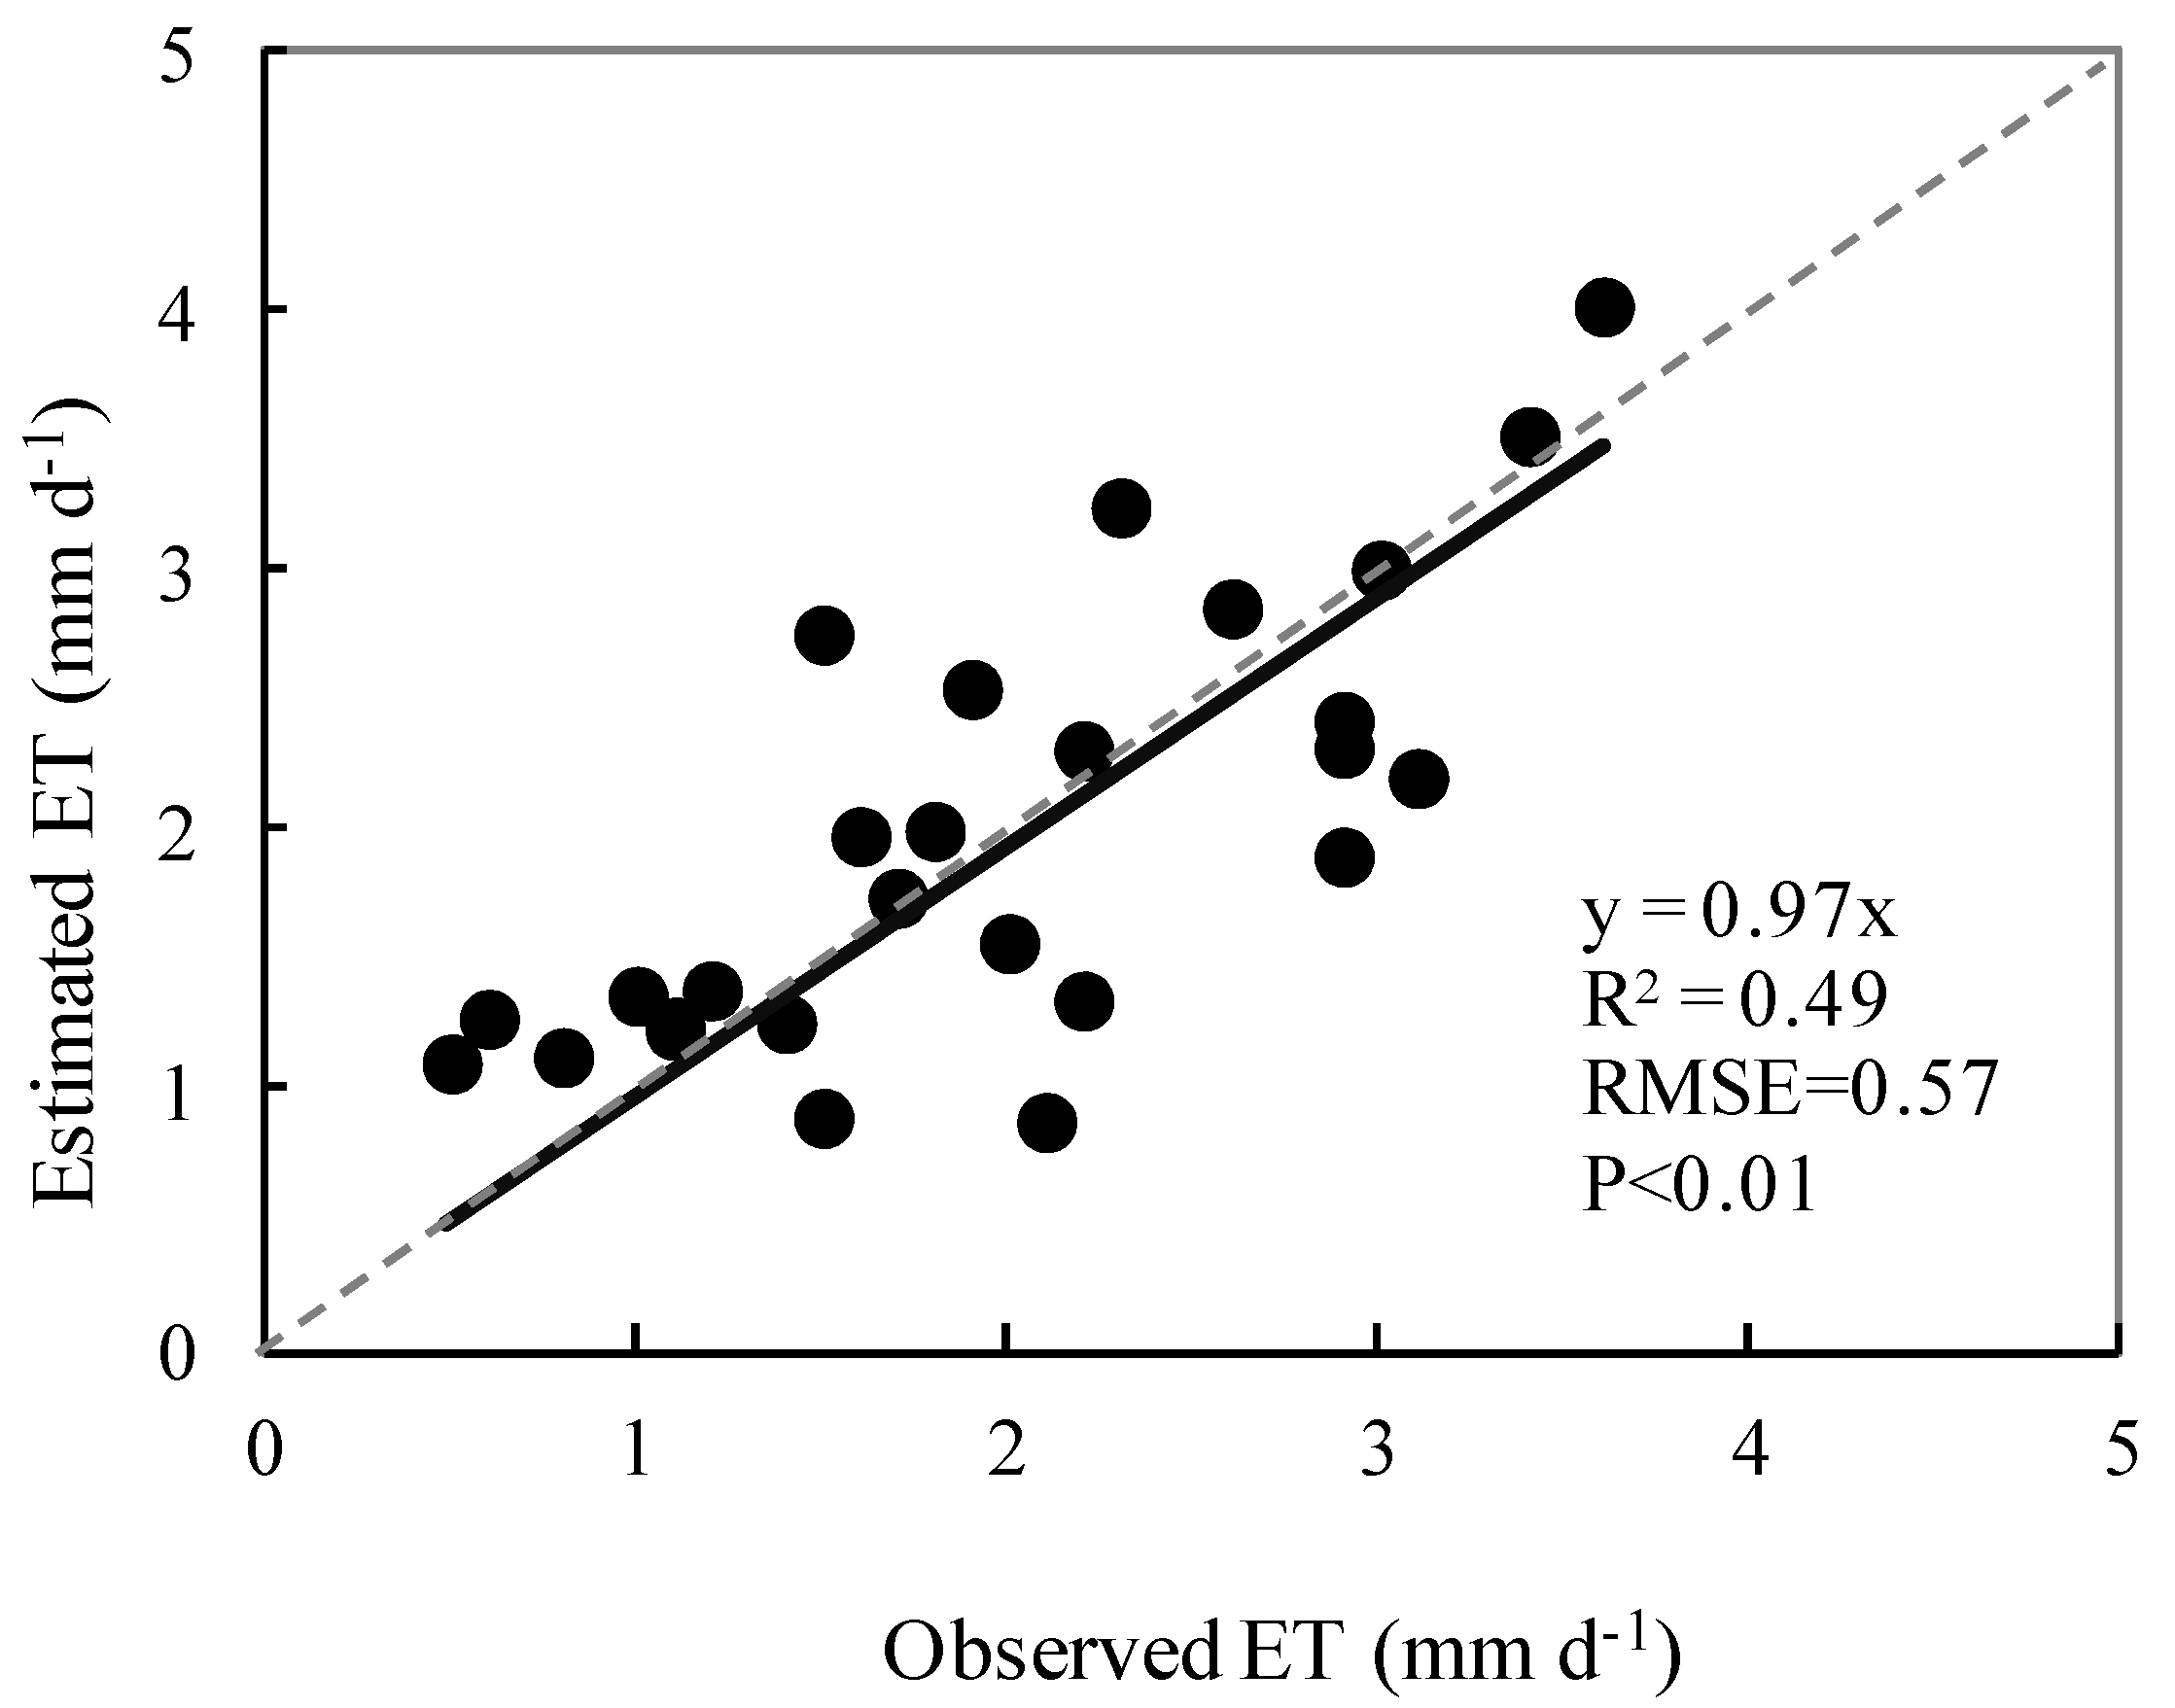
4.1. Validation of ET Retrievals

The ET retrievals were validated with available observation data from the Nanchang site. Figure 2 displays the comparisons between daily measured and estimated ET and illustrates the close agreement between these values, with a regression slope of 0.97, a correlation coefficient (R2) of 0.49, and a root mean square error (RMSE) of 0.57 mm d−1 between the estimates and the measurements. The average of the ET measurements was 746.1 mm during the observation period from September 2007 to August 2008. The ET estimate was 706.5 mm, and its relative error was 5.4%, on average. The error of the estimated ET was lower than the reported value (15%–30%) from satellite retrievals [66]. These results demonstrated that the triangle method performed well over the study area.
Figure 2. Comparison of evapotranspiration(ET) retrievals with field measurements.
Water 06 02482 g002

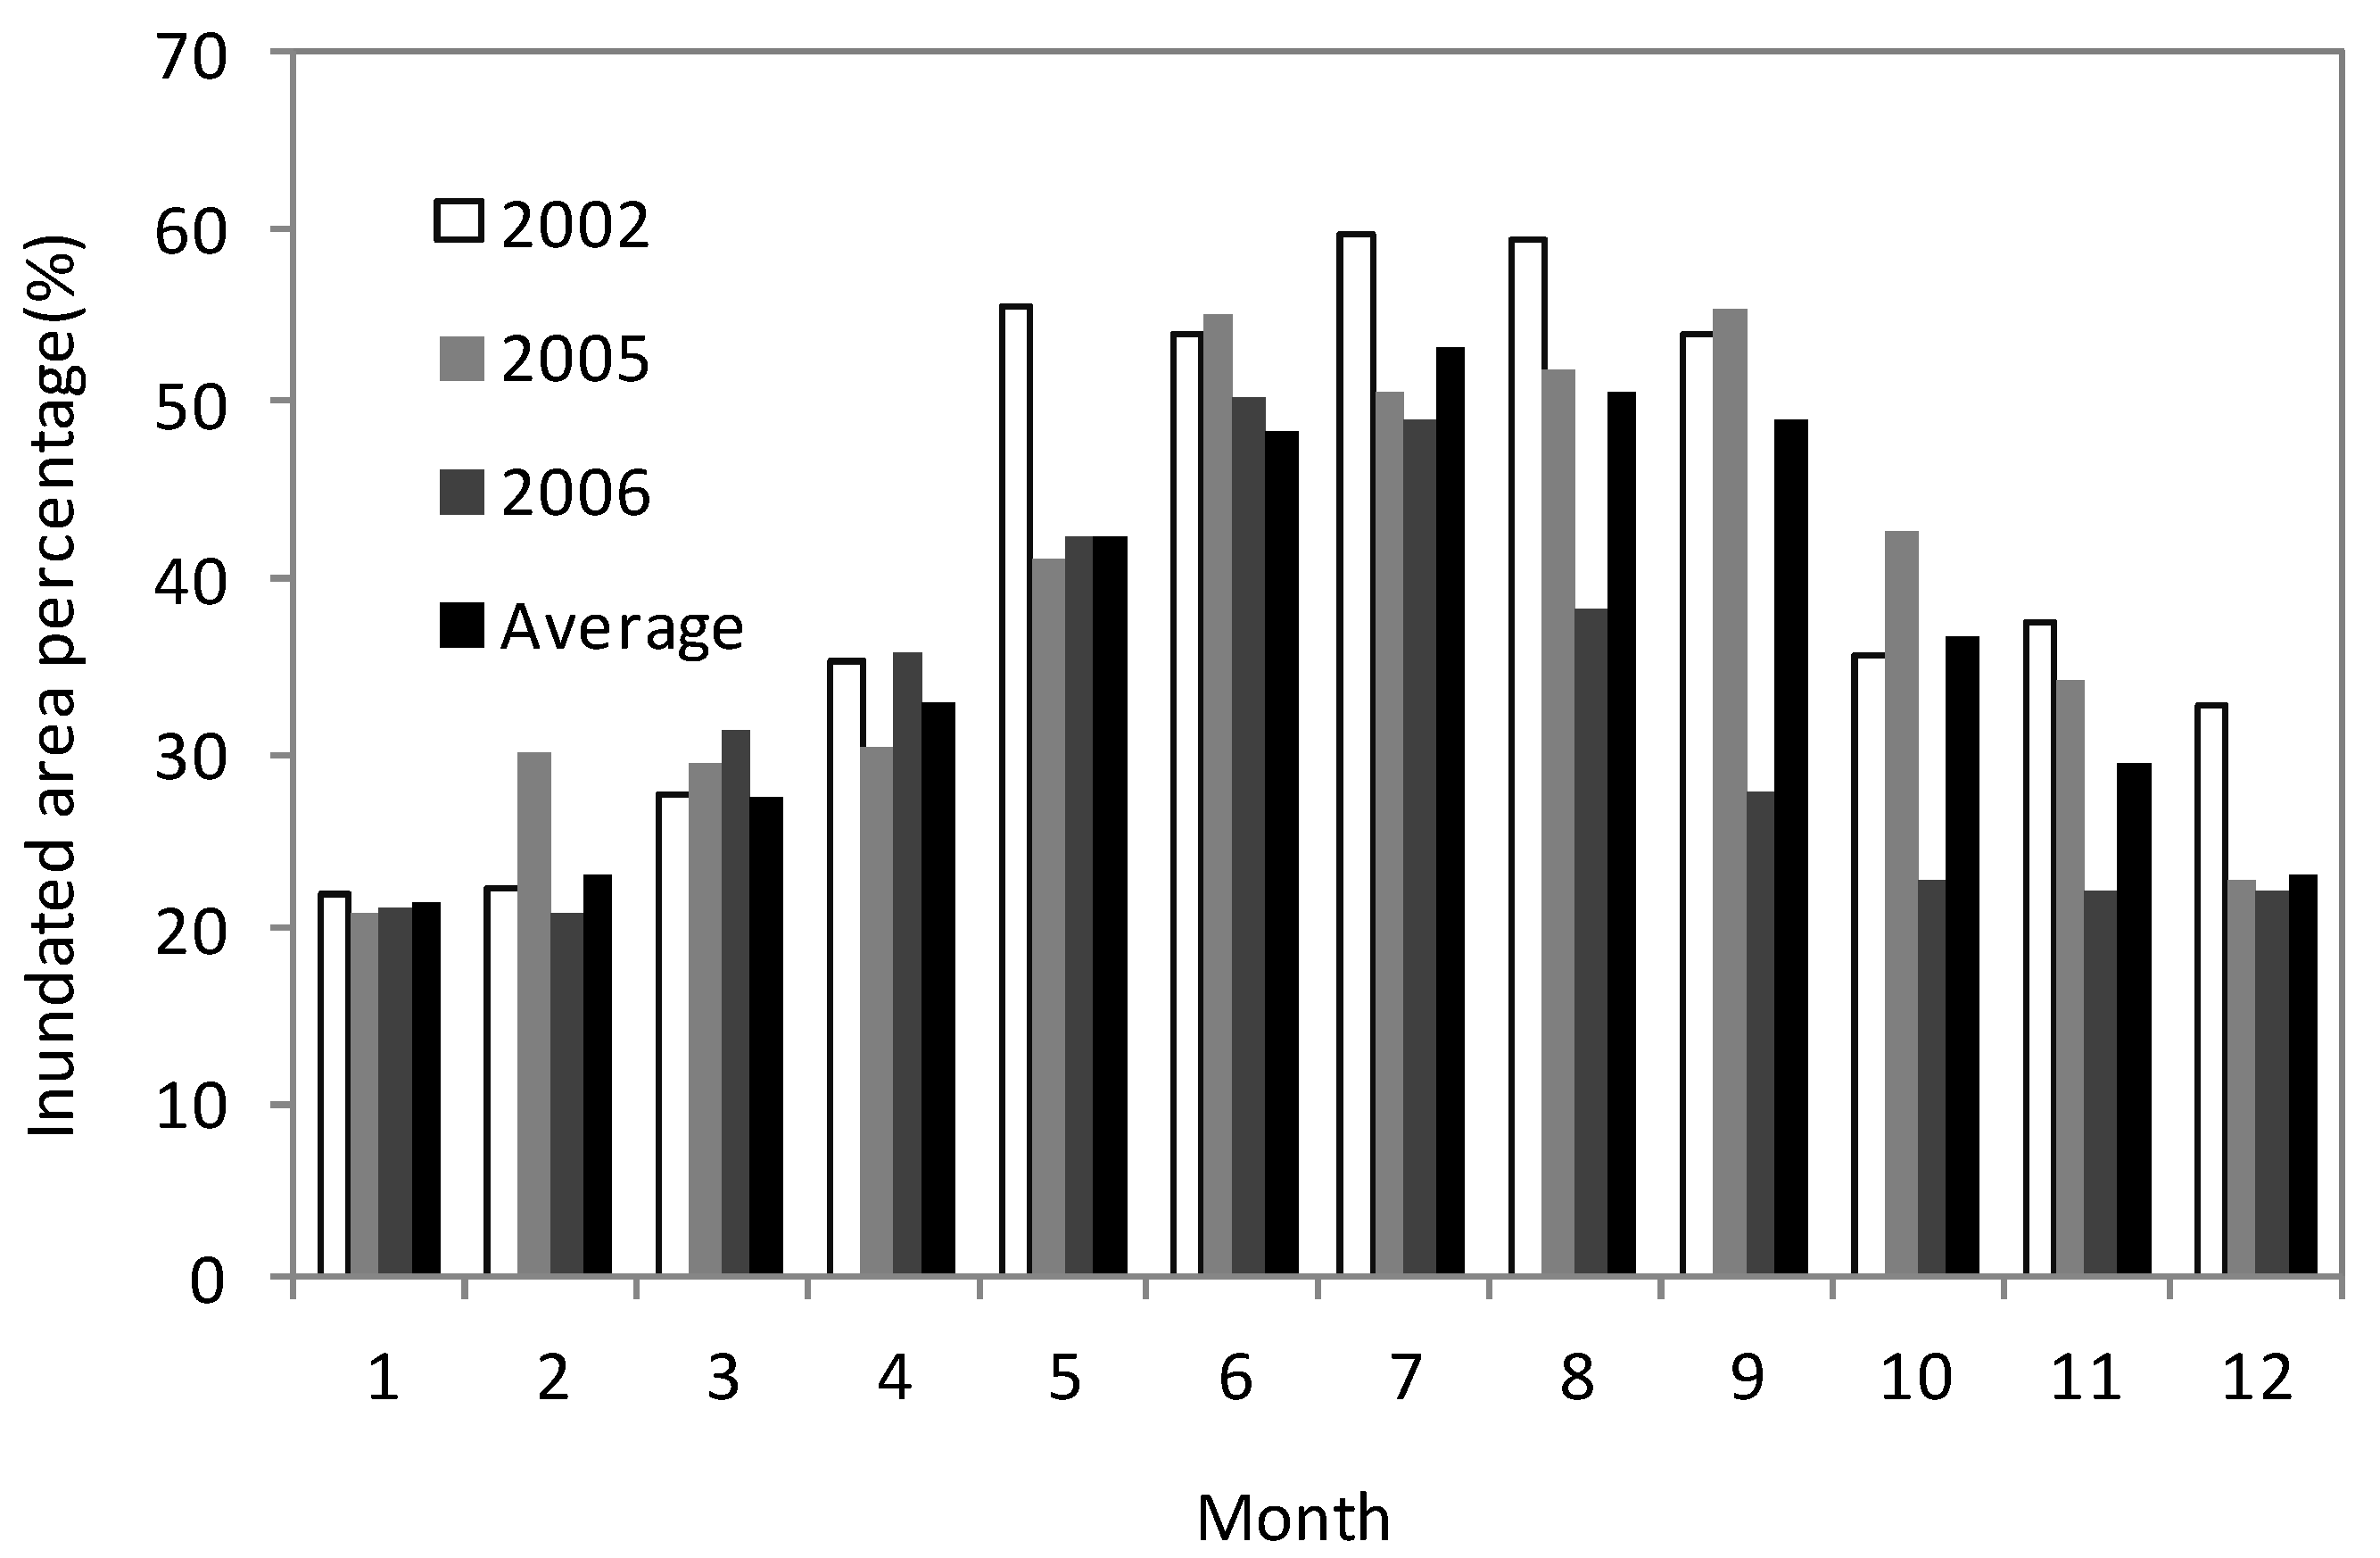
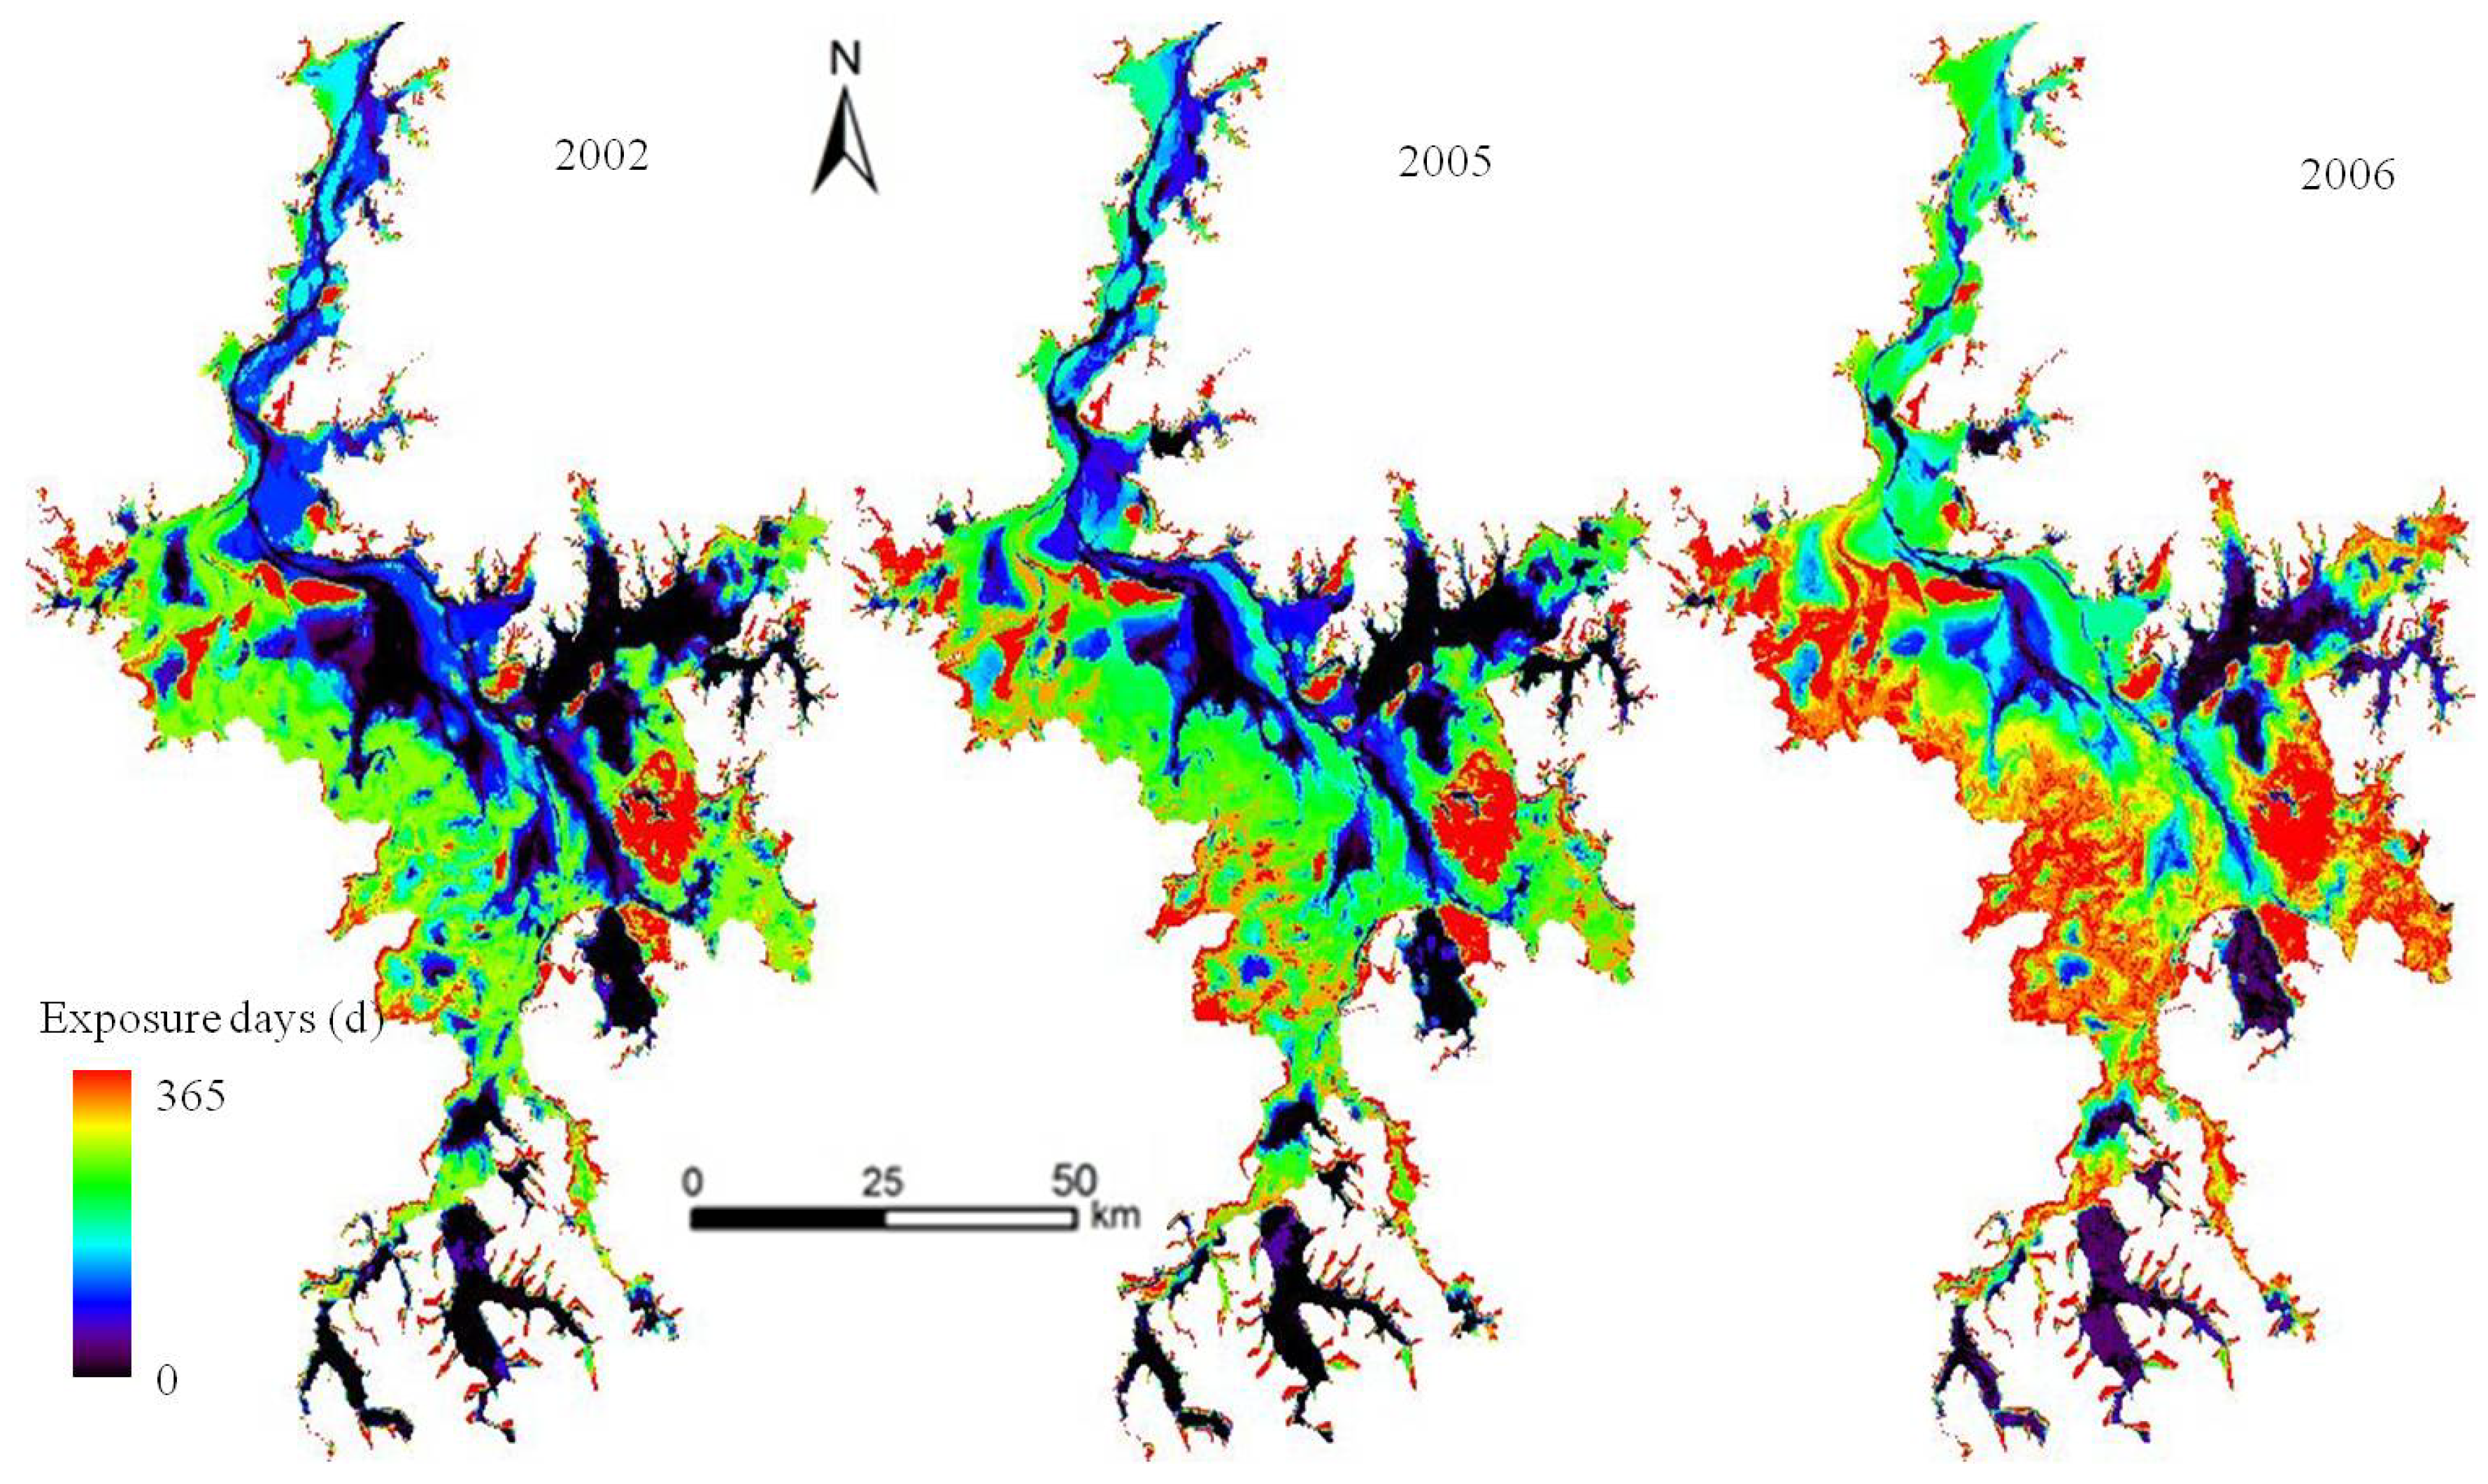
4.2. Lake Fluctuation in the Poyang Lake Wetland

In the Poyang Lake wetland, the multi-year average annual precipitation is 1575 mm, and the average water level is 13.30 m for 1960–2009. Based on annual precipitation and annual mean water level, 2002 was defined as a wet year, 2005 was a normal year, and 2006 was a dry year. The annual precipitation was 1792 mm in 2002, 14% higher than the multi-year average, and the annual mean water level was 14.01 m, 5% higher than average. The precipitation and water level were 1575.0 mm and 13.27 m, respectively, in 2005, close to average levels. In 2006, the precipitation was 11% lower and the water level was 13% lower than average.
Lake fluctuation changes the inundated area and the number of exposure days of the wetland. In the normal year of 2005, the inundated area occupied 38.7% of the wetland, and the number of exposure days was 183.5, on average. In the wet year of 2002, the inundated area was 41.3% and the number of exposure days was 169.1. In the dry year of 2006, the inundated area was 31.9% and the number of exposure days was 233.2. At a seasonal scale, the inundated area had a single peak distribution (Figure 3), increasing beginning in January and reaching its maximum, approximately 50%–60%, in July. The inundated area maintained a high value from July to September, then decreased rapidly and reached its minimum of 20% in December. Clearly, the inundated area was higher in 2002 than in other years; in most months, the inundated area in 2005 was similar to the average, and the inundated area in 2006 was 15%–30% lower than the average from August to November.
Figure 3. Seasonal variation in the inundated area of the Poyang Lake wetland in 2002, 2005, and 2006.
Water 06 02482 g003
Figure 4 shows the spatial distribution of exposure days in the Poyang wetland. The areas with zero exposure days were primarily distributed in the central, eastern, and southern portions of the lake. In 2002, the areas with fewer than 100 exposure days were in the central and eastern portions of the lake and in the river channel connecting to the Yangtze River, and the areas with less than 250 exposure days were located along the western lakeshore. In 2005, there were more areas with fewer than 100 exposure days than in 2002. In 2006, the entire wetland experienced more exposure days, as shown in Figure 4c, with areas with less exposure in blue and those with more exposure in red. Therefore, the lake varied significantly both temporally and spatially.
Figure 4. Spatial distribution of exposure days in the Poyang Lake wetland in 2002, 2005, and 2006.
Water 06 02482 g004

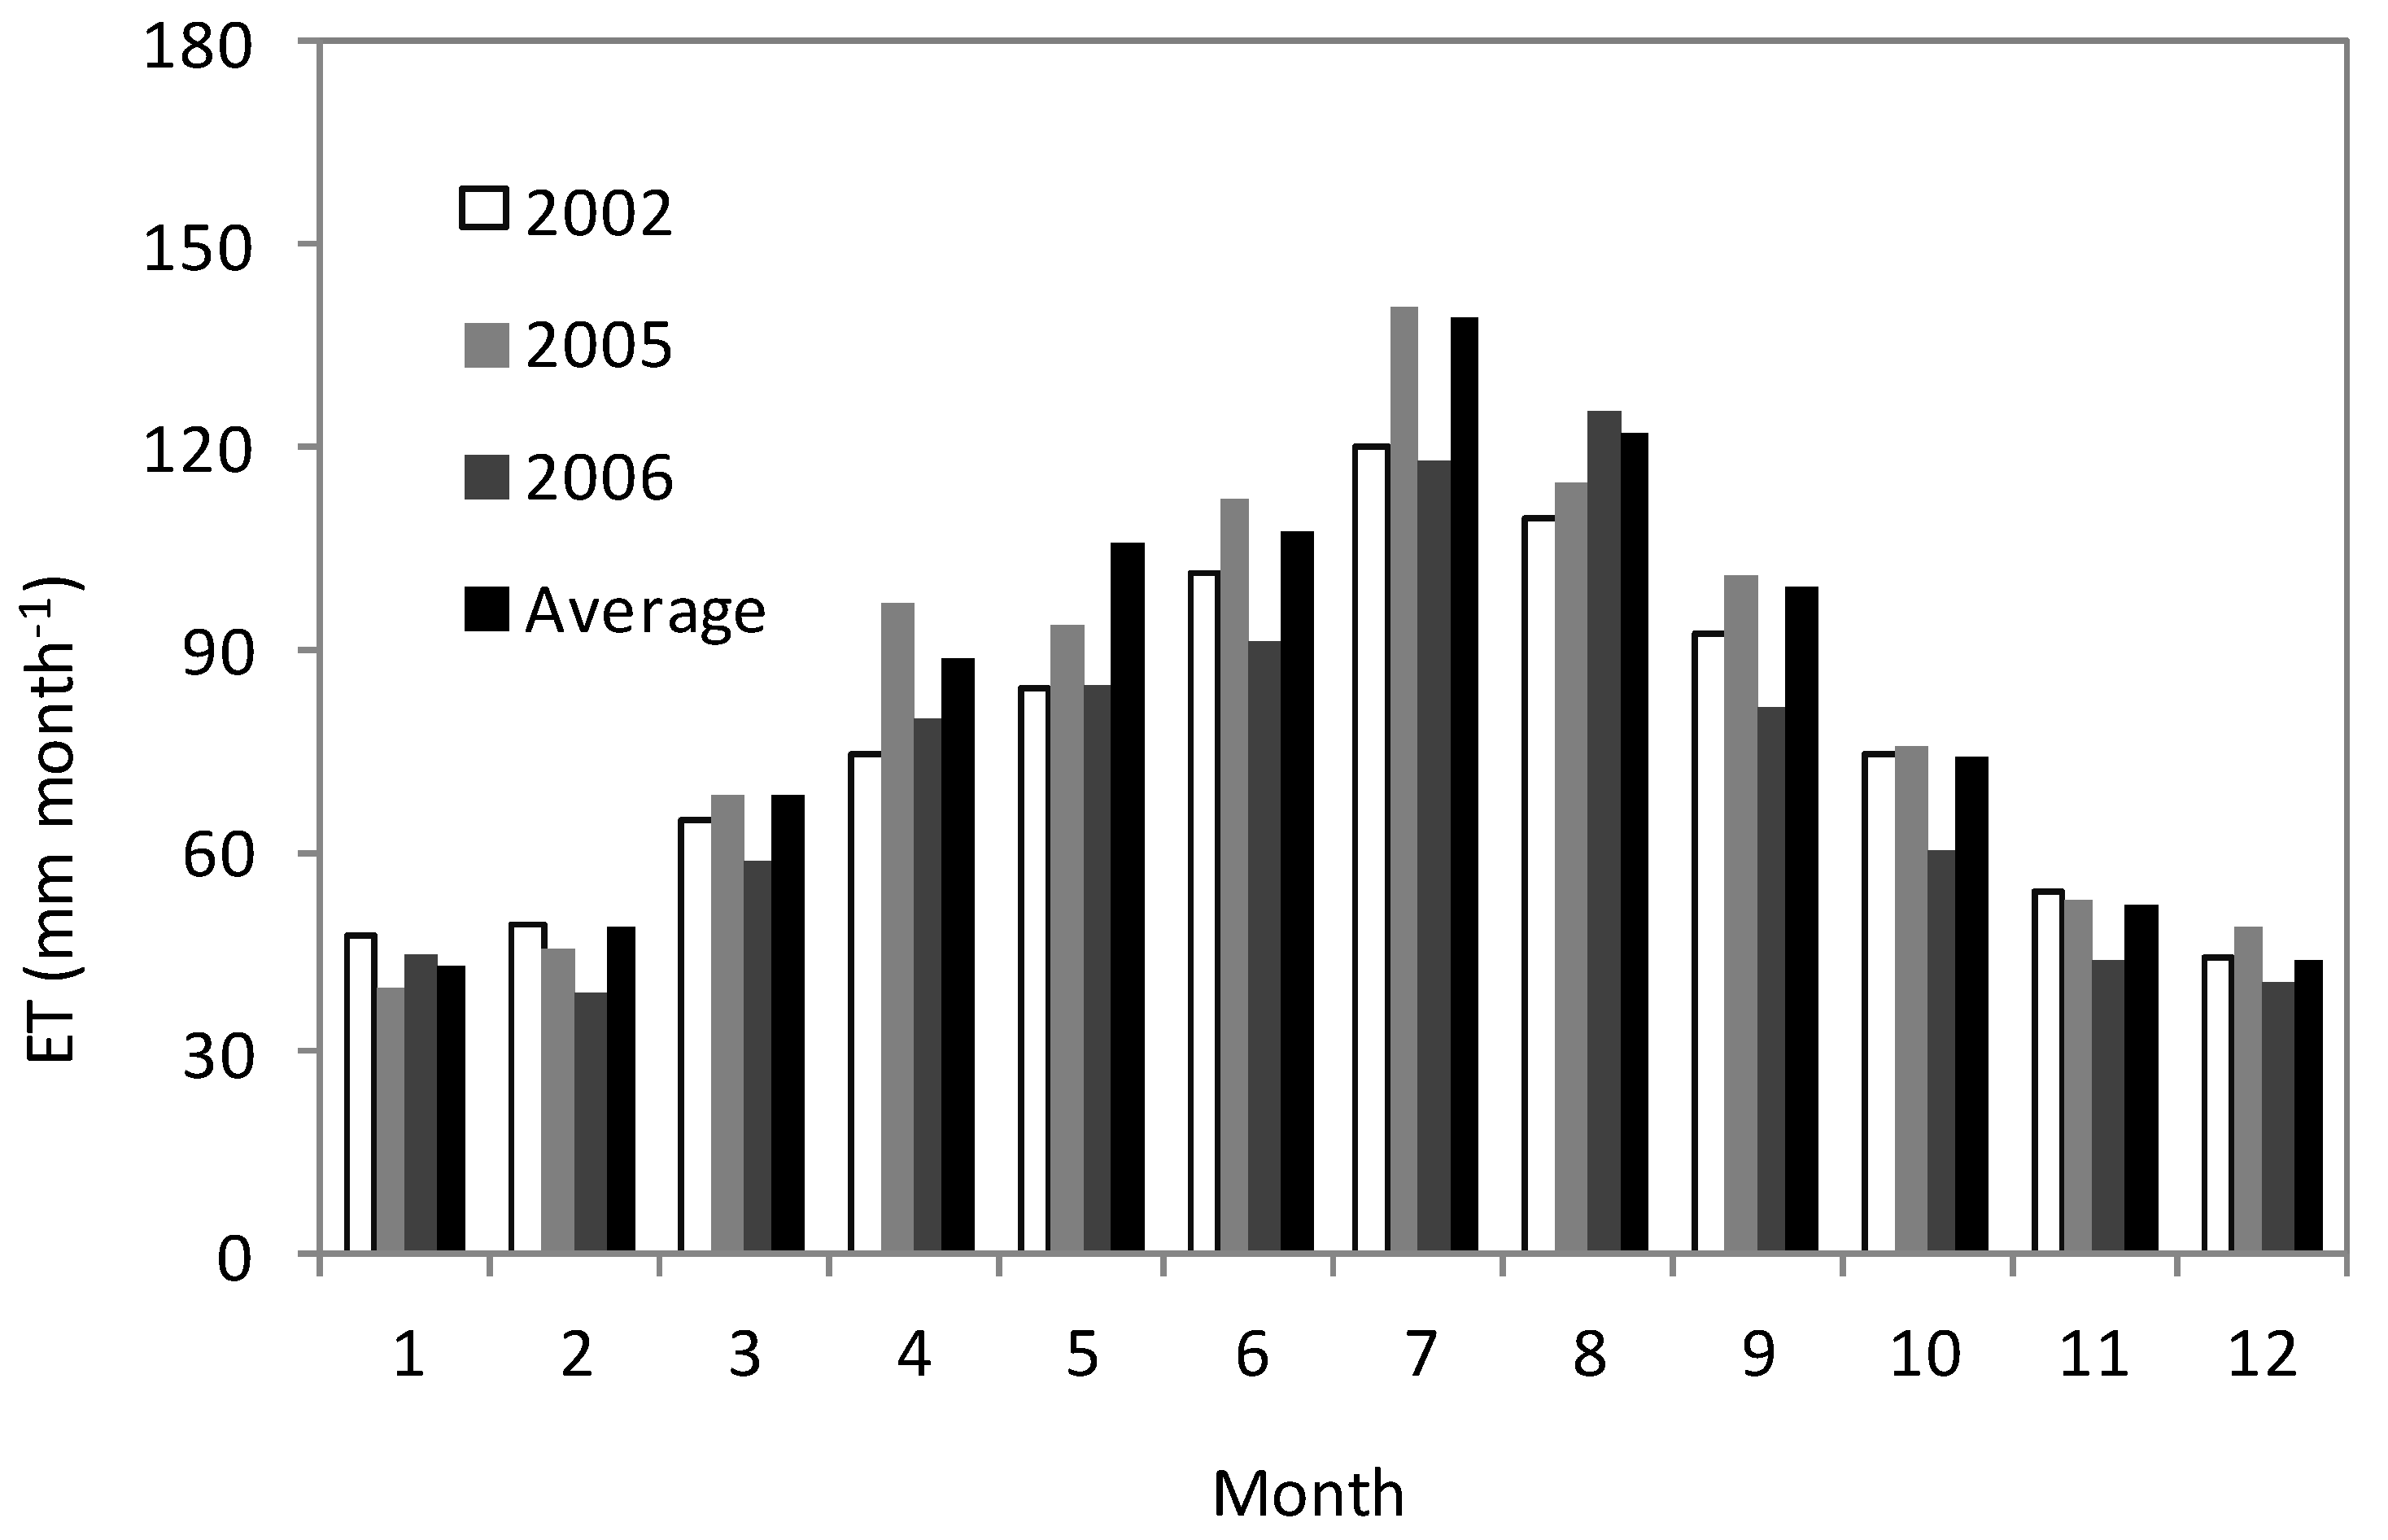
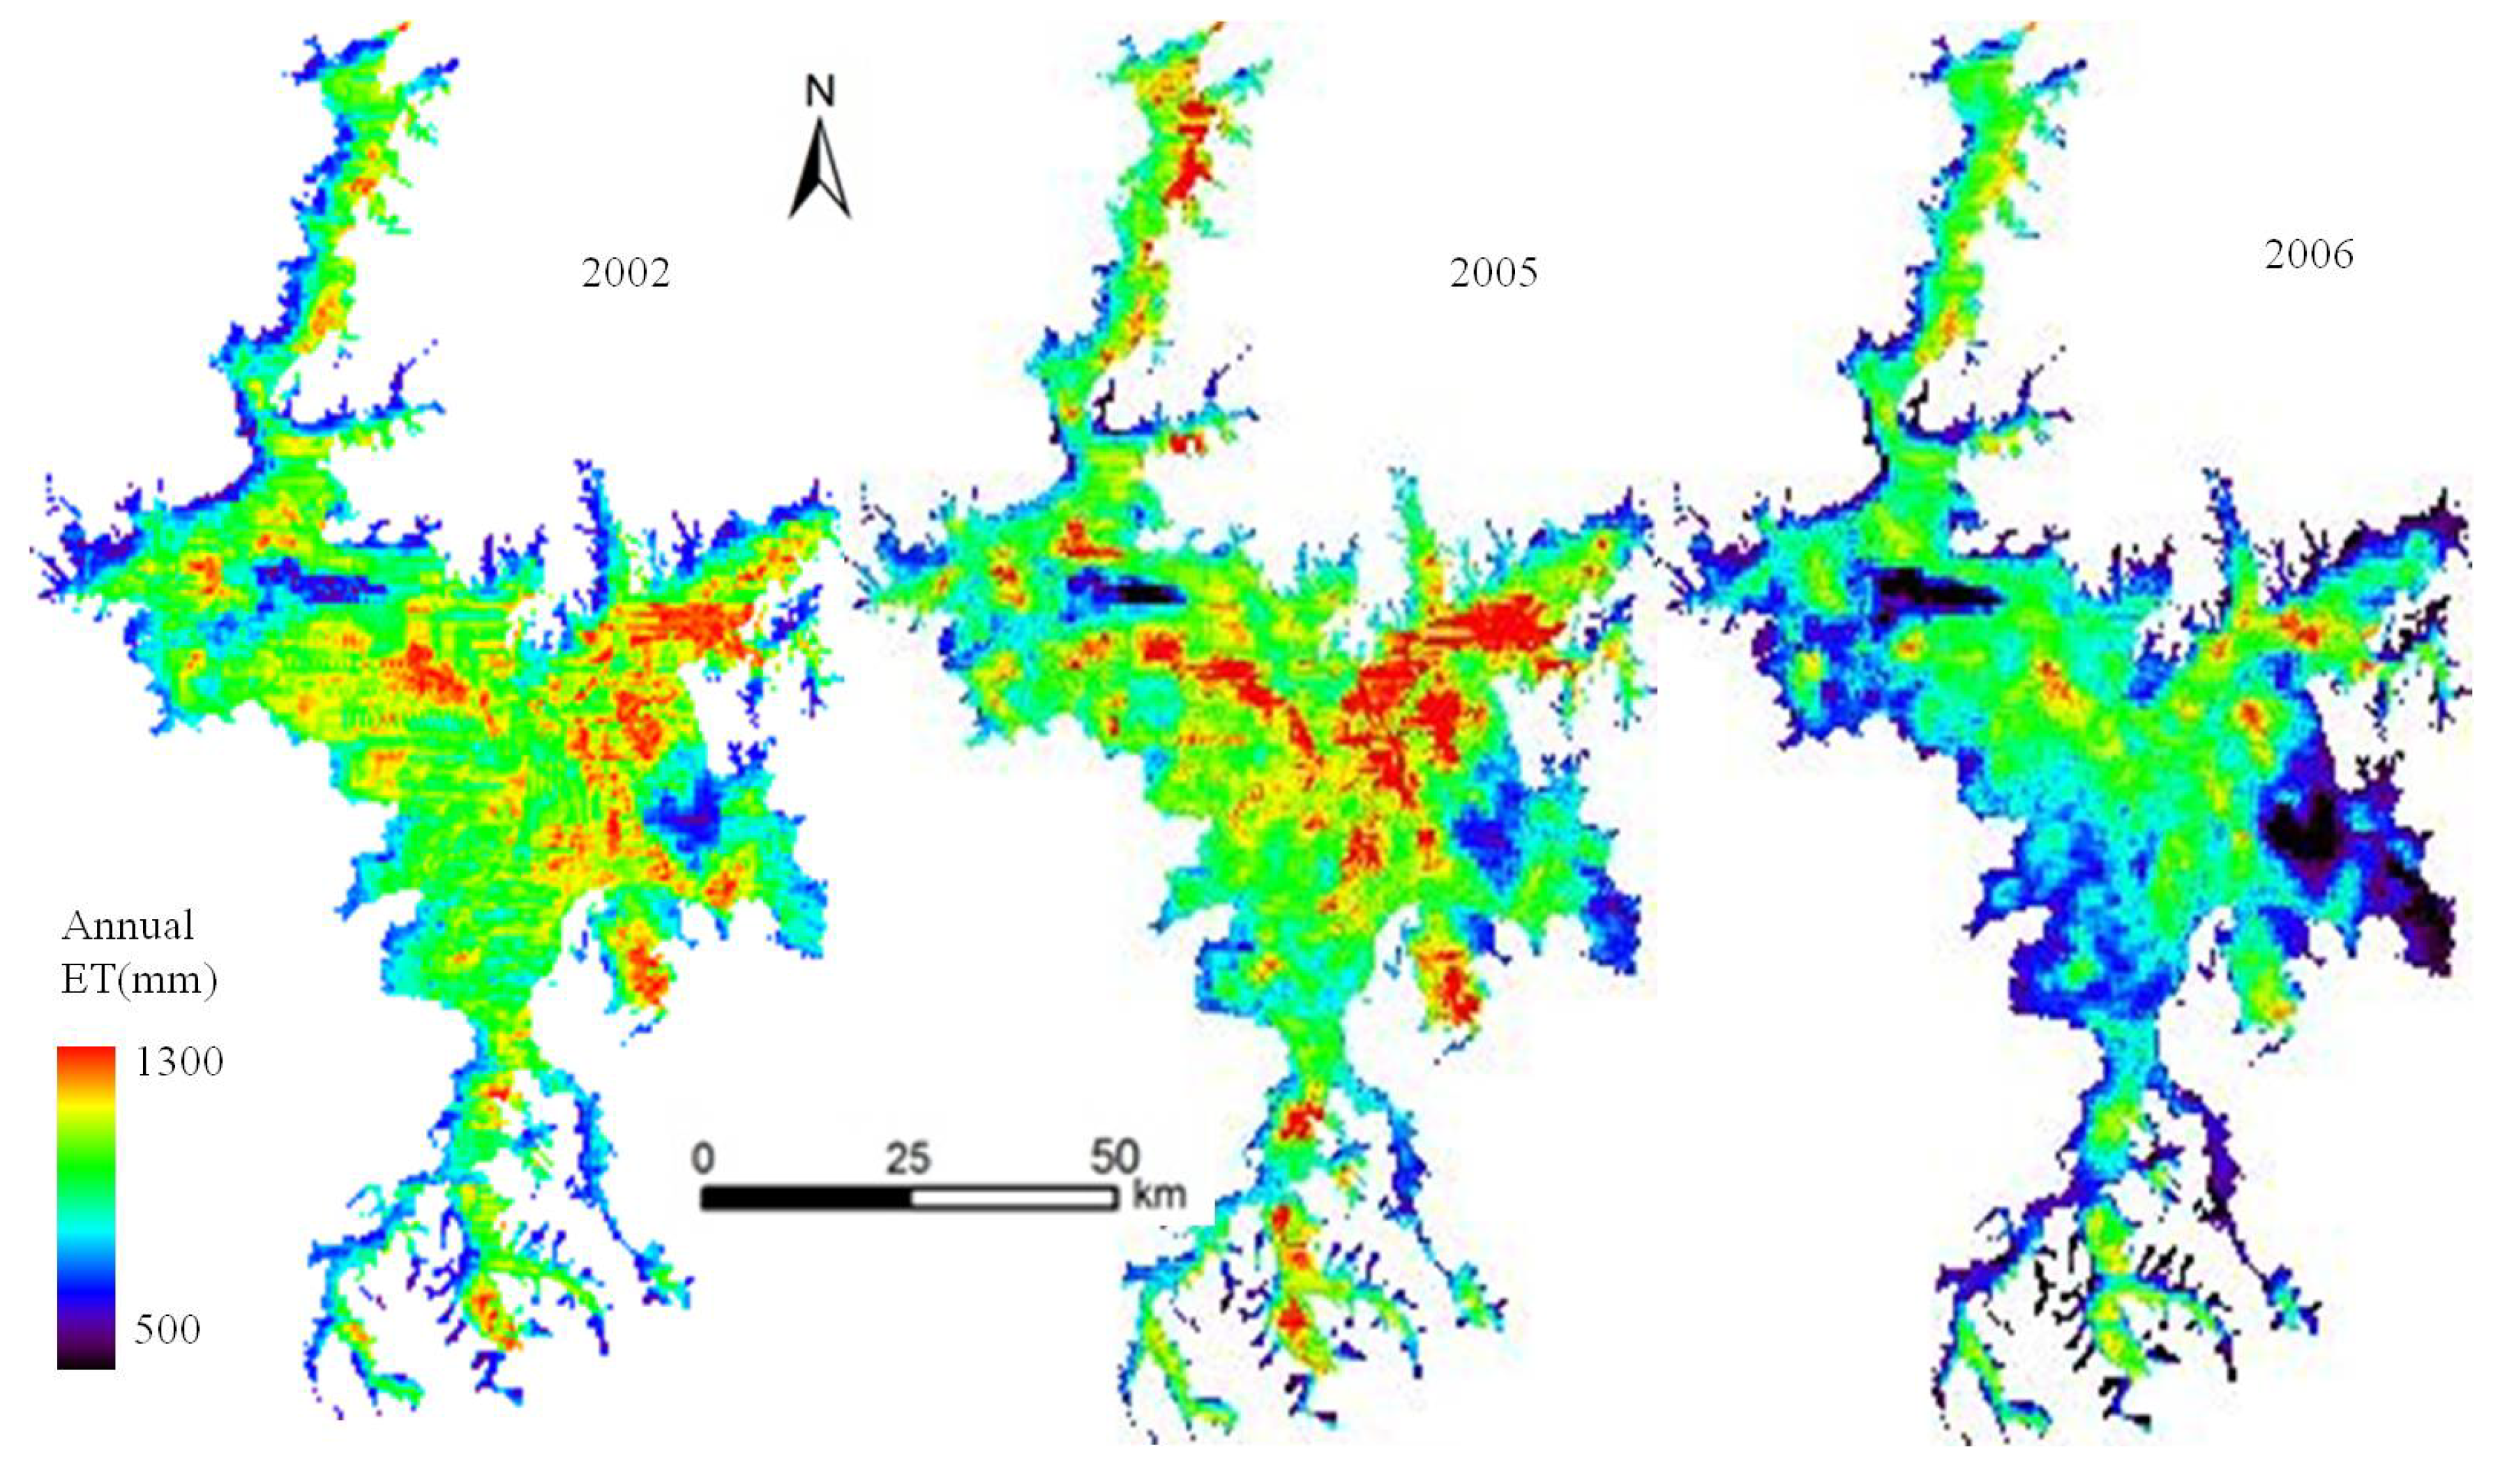
4.3. Spatial and Temporal Variation of ET in the Poyang Lake Wetland

The annual ET was 991.2 mm on average from the Poyang Lake wetland from 2000 to 2009. The annual ET was 914.3 mm in 2002, 989.2 mm in 2005, and 865.3 mm in 2006. Figure 5 shows the seasonal variation in ET for the three years. The monthly ET ranged from 43.0 mm to 139.4 mm, with a mean of 82.6 mm. A single peak with a maximum value appeared in July, consistent with high air temperatures and net radiation. ET was lower in June than in May because of the abundant precipitation in May. In addition, ET was significantly different between the years. Compared with the normal year of 2005, monthly ET was generally lower in 2002 and 2006. In 2002, the monthly ET was lower than average from May to August. In 2006, the monthly ET was generally lower than average for most months, with a maximum difference of 22.0 mm in July. Overall, the ET in both wet and dry years was relatively lower than average in the Poyang Lake wetland.
Figure 5. Seasonal variation in ET in the Poyang Lake wetland in 2002, 2005, and 2006.
Water 06 02482 g005
Figure 6 shows the spatial distribution of the annual ET in the Poyang Lake wetland. Generally, high ET values occurred over water surfaces (Figure 4). Nearly 1/3 of the wetland had a higher ET in 2005 than in the other years. ET differed in magnitude and spatial distribution for the three years: it was significantly lower in 2006 than in 2002 and 2005, and high ET values appeared mainly in the central and eastern wetlands and in the river channel connected to the Yangtze River. In 2006, ET was lower than 950.0 mm in most of the wetlands due to long exposure days. For those areas with greater than 300 exposure days, ET was less than 700 mm in 2006. These results suggest that the annual ET might be negatively correlated with total exposure days in the wetland.
Figure 6. Spatial distribution of annual ET for wet (2002), normal (2005), and dry years (2006).
Water 06 02482 g006

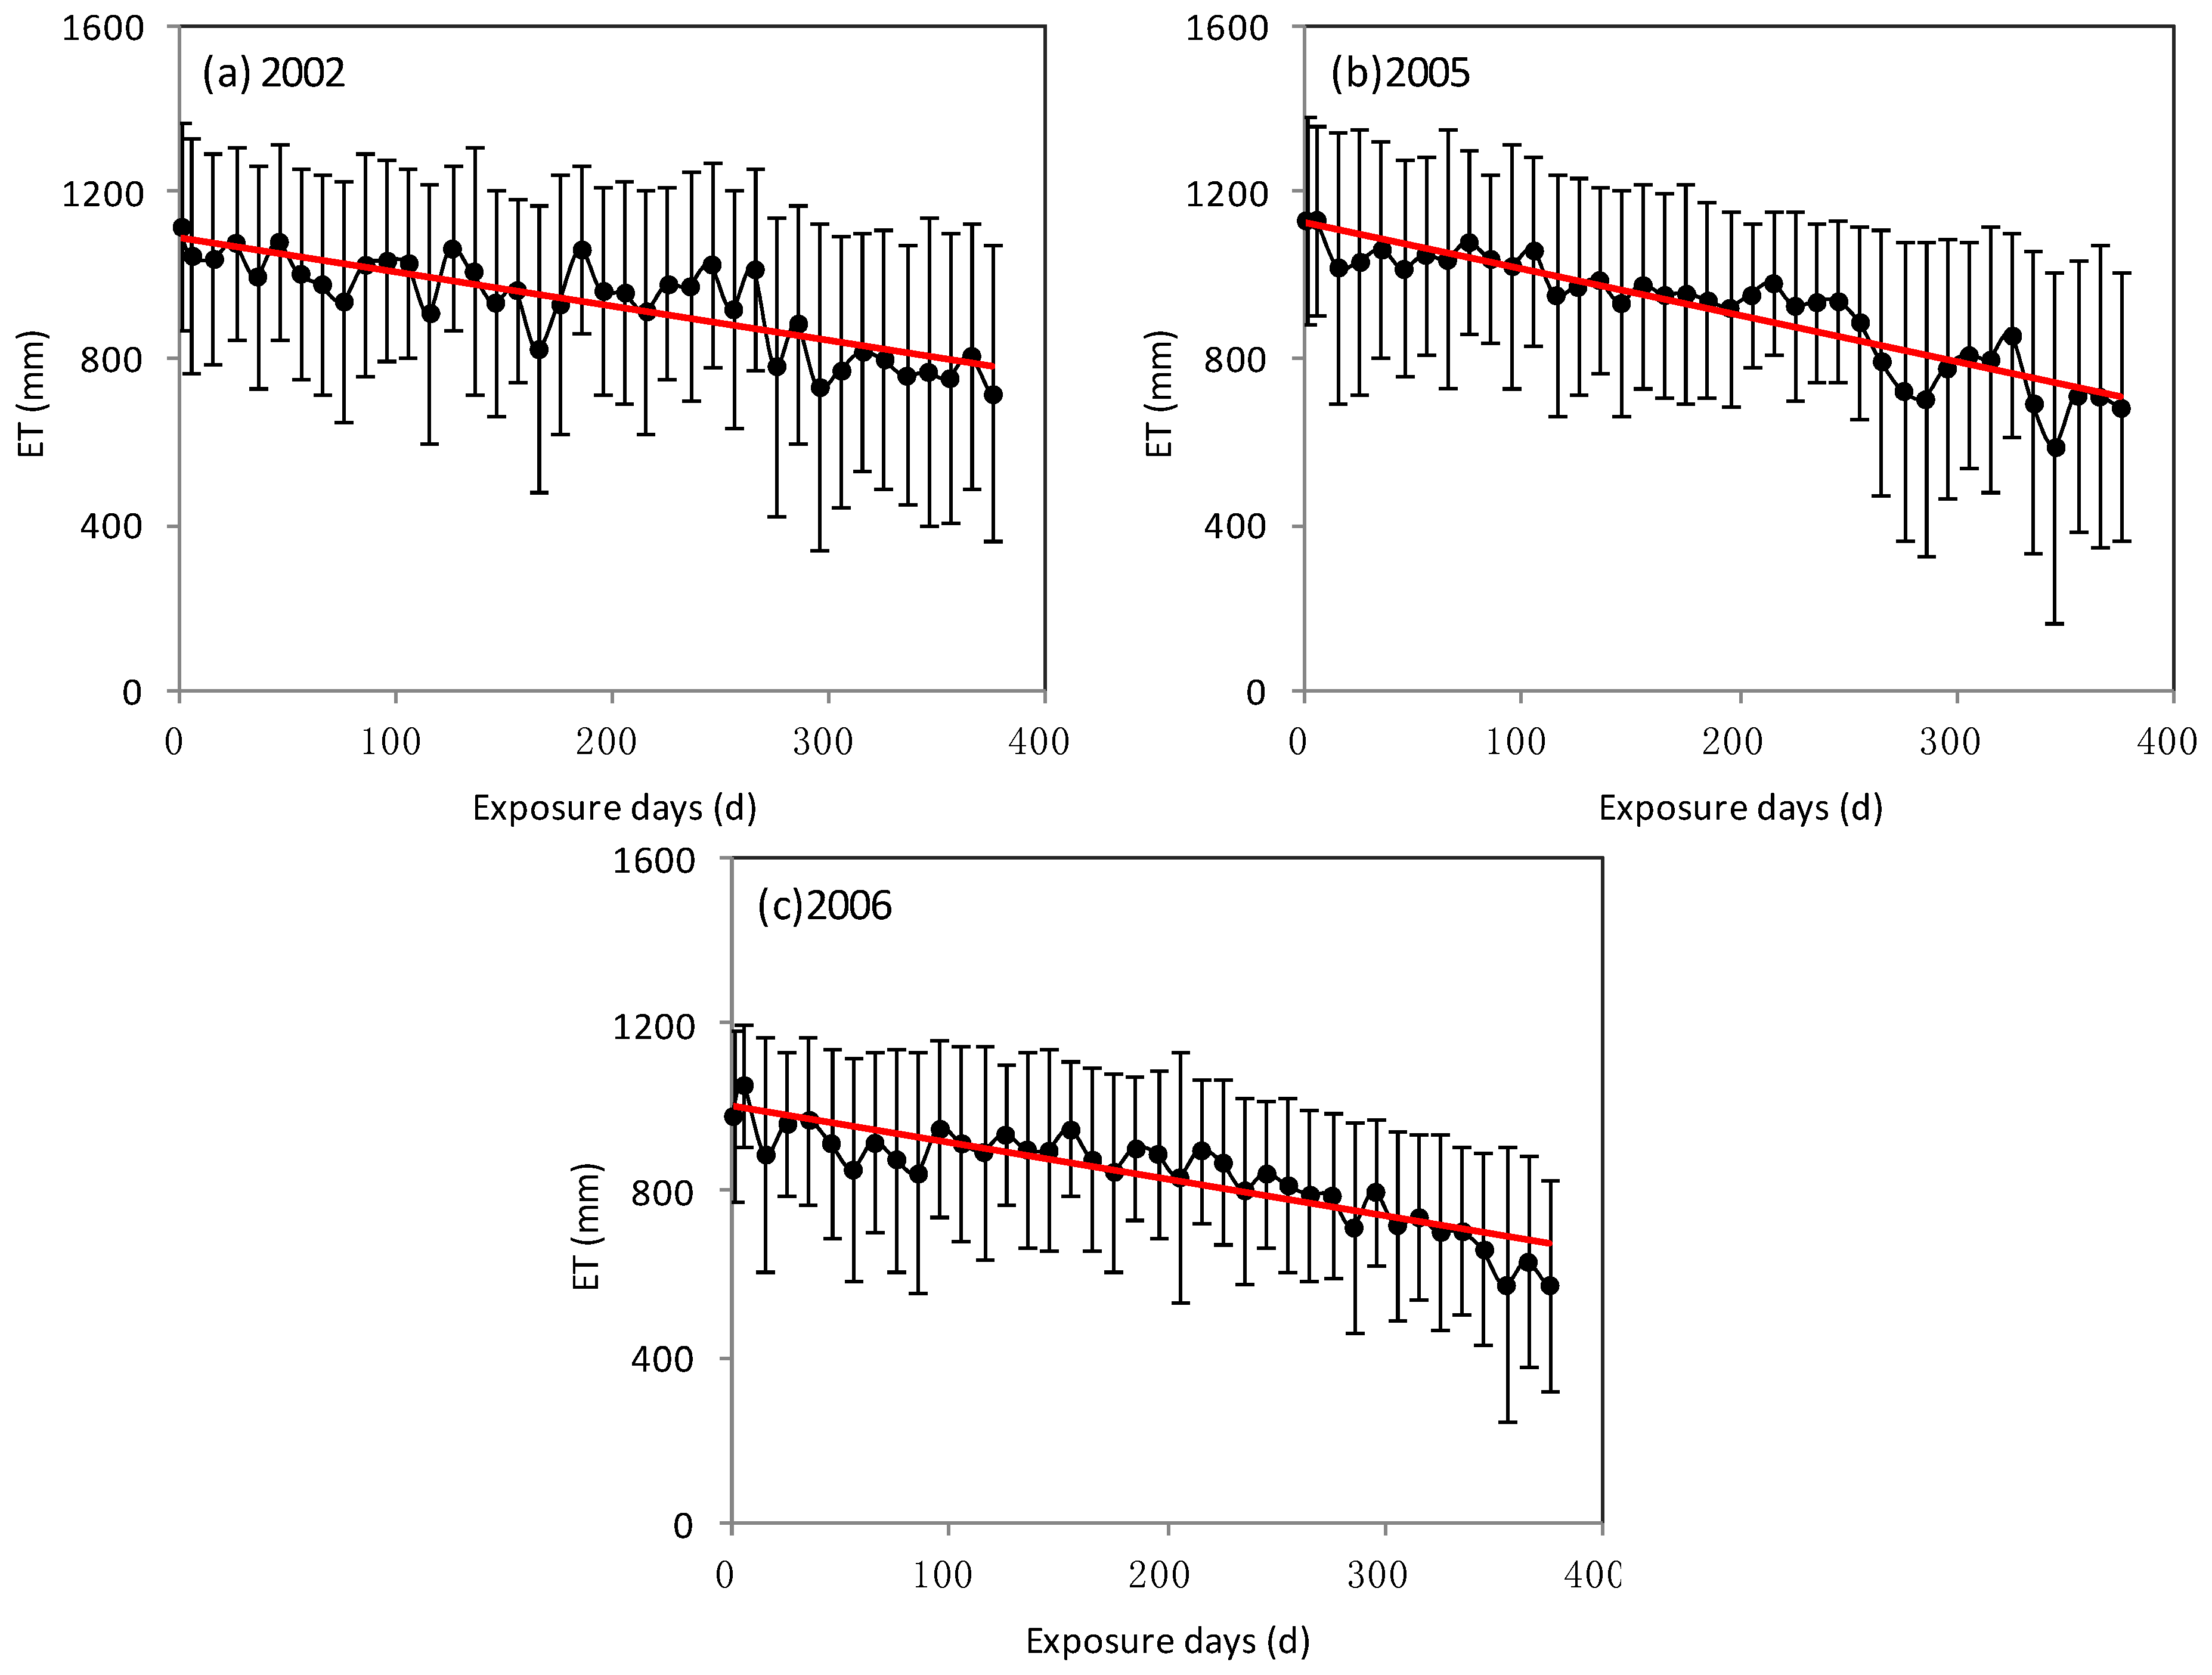
4.4. Combined Influences of Variables on ET in the Poyang Lake Wetland

The Poyang Lake wetland consists of water and land surfaces, and the controlling factors of the ET process may vary for the different surfaces. The annual ET for one pixel in the wetland was the sum of the land ET for exposure days and water evaporation for unexposed days, as in Equation (5). This method was used to calculate the annual ET for one pixel, and the values for each pixel comprised the map of ET in the wetland (Figure 6).
Water 06 02482 i005
where Water 06 02482 i009 is the terrestrial evapotranspiration rate on the ith day (mm d−1) for land and Water 06 02482 i010 is the water evaporation rate on the ith day (mm d−1) for water. Water 06 02482 i011 is the average daily ET rate (mm d−1) at the annual scale for land; Water 06 02482 i012 is the average daily evaporation rate (mm d−1) at the annual scale for water; and Water 06 02482 i013 is the sum of evaporation (mm a−1) throughout the year for water.
According to Equation (5), when a pixel experienced zero exposure days and was covered by water throughout the year, the wetland ET (ETwetland) is equal to the annual evaporation (Ewater) in this pixel. The annual evaporation (Ewater) in the Poyang Lake wetland was 1119.0 mm for 2002, 1134.6 mm for 2005, and 980.5 mm for 2006. These values represent potential evaporation, which is primarily controlled by atmospheric and environmental factors such as air temperature, wind speed, and air humidity [67,68,69]. When a pixel experienced 365 exposure days and was covered by land surface throughout the year, the wetland ET (ETwetland) is equal to the annual land ET (ETland) in this pixel when it is covered by land throughout the year. The annual ET (ETland) was 716.8 mm for 2002, 683.8 mm for 2005, and 574.0 mm for 2006. ETland was generally lower than Ewater due to the combined effects of lake fluctuation and atmospheric and environmental controls. Compared to the Ewater, the wetland ET (ETwetland) was 18.3% less in 2002, 12.8% less in 2005 and 11.7% less in 2006 due to land surface exposure.
Figure 7 shows the relationship between ET and exposure days for 2002, 2005, and 2006, generated from Figure 4 and Figure 6. Obviously, the annual ET decreased for those areas with increased exposure days. The negative trend between the exposure days and the annual ET averaged over the areas with the same exposure days can be described by ET = −0.82Day + 1087 (R2 = 0.67) for 2002, ET = −1.11Day + 1125 (R2 = 0.84) for 2005, and ET = −0.87Day + 999 (R2 = 0.78) for 2006. This negative relationship implied that increasing exposure by one day would result in a reduction of 0.8–1.1 mm ET for the study area. Meteorologically, atmospheric and environmental controls on ET are essentially identical over the study area for the same year, and the annual Ewater-to-ETwetland difference was primarily attributed to surface water availability altered by lake fluctuation and, therefore, exposure days.
Figure 7. Relationship between exposure days and annual ET in the Poyang Lake wetland in (a) 2002; (b) 2005, and (c)2006.
Water 06 02482 g007
Figure 8 shows the relationship of the annual Ewater-to-ETwetland difference with the percentage of inundated area and with exposure days from 2000 to 2009 in the Poyang Lake wetland. This figure illustrates that the difference was negatively correlated with the percentage of inundated area (R2 = 0.86) and positively correlated with exposure days (R2 = 0.87). The difference values of 60.52 mm a−1 for 2002, 86.21 mm a−1 for 2005 and 141.47 mm a−1 for 2006 represent the low, middle, and high values, which were found in wet, normal, and dry years, respectively. Regression analysis demonstrated that a one percent increase in inundated area would result in annual Ewater-to-ETwetland difference reduction of 7.87 ± 1.13 mm a−1 (Figure 8a) and that a 10-day elongation of exposure could lead to annual Ewater-to-ETwetland difference increase of 11.1 ± 1.6 mm a−1 (Figure 8b), on average.
Figure 8. Relationship of annual Ewater-to-ETwetland difference with (a) percentage of inundated area and (b) exposure days for 2000–2009 for the Poyang Lake wetland.
Water 06 02482 g008
The interannual differences were attributed to the combined effects of atmospheric and environmental variables and lake fluctuation. To distinguish the lake fluctuation effect from the other effects, contributions from major hydrometeorological factors were identified using regression analysis. First, the major factors, including net radiation (Rn), wind speed (WS), relative humidity (RH), and water level (WL), were selected. Based on a Pearson correlation analysis, these factors were significantly correlated with the Ewater-to-ETwetland difference at the 0.05 level. Second, the dependent and independent variables were normalized to values ranging from zero to one using the linear transfer function method. Then, the multiple regression analysis with the Enter method was applied to the difference and major environmental factors. The regression function is Difference = 0.88 − 0.73WL − 0.19RH − 0.05Rn + 0.04WS (R2 = 0.89, S.D. = 0.15 mm a−1). This function indicated that the water level fluctuation contributed 73% of the inter-annual ET difference, followed by relative humidity (19%), net radiation (5%), and wind speed (4%).
The variation in ET is responsible for the environmental conditions and characteristics of lake fluctuation in wetland ecosystems [70,71,72,73,74]. The environmental parameters (including net radiation, air temperature, and wind speed) significantly reflect the seasonal variation in ET in different wetland ecosystems [74,75,76,77]. The water level has only a small effect on variation in ET in a wetland with a constantly inundated area [15,78]. However, when the inundated area in that wetland is decreased as a result of water level fluctuation, the land cover and exposure days of the lakeshore change. The exposure period affects the ET process through its effect on vegetation growth in wetland ecosystems [79,80]. The increase in exposure days provides a longer growing season and higher biomass for vegetation [81,82]. Some studies indicated that a longer growing season substantially enhanced the ET in grasslands [83] and deciduous forests [84,85] when the soil moisture was sufficient. The minimum inundated area was 22% of the wetland area in the Poyang Lake wetland [86], and the average number of exposure days in the wetland ranged from 170 to 233 during the period from 2000 to 2009. Although more exposure days in a pixel increased the vegetation biomass [87], more exposure days also decreased the percentage of ETland in annual ETwetland because Ewater was greater than ETland. Thus, more exposure days subsequently lead to an increase in the Ewater-to-ETwetland difference. The interannual rate of change in water level ranged from −9.8% to 9.3%, and the rate of change in exposure days ranged from −19% to 13%; these rates were significantly higher than the rate of change in environmental factors. As a result, water level fluctuation showed the strongest effect on the annual Ewater-to-ETwetland difference. This phenomenon was difficult to observe in wetlands with low variability or constantly inundated areas.

5. Conclusions

Wetland evapotranspiration is complicated by lake fluctuation. The effective management of water resources and a comprehensive understanding of wetland hydrology require the quantitative application of satellite remote sensing. To investigate the effects of lake fluctuation on wetland ET, this study used the triangle method to retrieve wetland ET from MODIS data for the Poyang Lake wetland, China. The results showed that wetland ET was related to lake fluctuation both spatially and temporally. Within a given year, the annual Ewater-to-ETwetland difference was primarily attributed to surface water availability and lake fluctuation in terms of inundated area and exposure days. A 1% increase in inundated area would result in a 7.87 ± 1.13 mm a−1 reduction in ET, and a 10-day elongation of exposure could lead to an 11.1 ± 1.6 mm a−1 increase in ET, on average. Furthermore, inter-annual differences were attributed to the combined effects of atmospheric and environmental variables and lake fluctuation. Lake fluctuation plays an important role in variation in the inter-annual ET difference. Overall, lake fluctuation regulates wetland ET, and its effects merit careful consideration in hydrological and water resources studies under current changing climate.

Acknowledgments

This work was jointly supported by a 973 Project (2012CB417003) and the Science Foundation of Nanjing Institute of Geography and Limnology, Chinese Academy of Sciences (No. NIGLAS2012135001).

Author Contributions

All authors contributed to the conception, field and/or lab work, and development of this manuscript.

Conflicts of Interest

The authors declare no conflict of interest.

References

  1. Cowardin, L.M.; Carter, V.; Golet, F.C.; LaRoe, E.T. Classification of Wetlands and Deepwater Habitats of the United States; Fish and Wildlife Service, US Department of the Interior: Washington, DC, USA, 1979. [Google Scholar]
  2. Schindler, D.W. The cumulative effects of climate warming and other human stresses on Canadian freshwaters in the new millennium. Can. J. Fish. Aquat. Sci. 2001, 58, 18–29. [Google Scholar] [CrossRef]
  3. Wolcox, D.A.; Meeker, J.E. Implications for faunal habitat related to altered macrophyte structure in regulated lakes in northern Minnesota. Wetlands 1992, 12, 192–203. [Google Scholar] [CrossRef]
  4. Poff, N.L.R.; Allan, J.D.; Bain, M.B.; Karr, J.R.; Prestegaard, K.L.; Richter, B.D.; Sparks, R.E.; Stromberg, J.C. The natural flow regime. BioScience 1997, 47, 769–784. [Google Scholar] [CrossRef]
  5. Nowlin, W.H.; Davies, J.-M.; Nordin, R.N.; Mazumder, A. Effects of water level fluctuation and short-term climate variation on thermal and stratification regimes of a British Columbia reservoir and lake. Lake Reserv. Manag. 2004, 20, 91–109. [Google Scholar] [CrossRef]
  6. Casanova, M.T.; Brock, M.A. How do depth, duration and frequency of flooding influence the establishment of wetland plant communities? Plant Ecol. 2000, 147, 237–250. [Google Scholar] [CrossRef]
  7. Bonan, G.B. Forests and climate change: Forcings, feedbacks, and the climate benefits of forests. Science 2008, 320, 1444–1449. [Google Scholar] [CrossRef]
  8. Jung, M.; Reichstein, M.; Ciais, P.; Seneviratne, S.I.; Sheffield, J.; Goulden, M.L.; Bonan, G.; Cescatti, A.; Chen, J.; de Jeu, R. Recent decline in the global land evapotranspiration trend due to limited moisture supply. Nature 2010, 467, 951–954. [Google Scholar] [CrossRef]
  9. Rao, L.; Sun, G.; Ford, C.; Vose, J. Modeling potential evapotranspiration of two forested watersheds in the southern Appalachians. Trans. ASABE 2011, 54, 2067–2078. [Google Scholar] [CrossRef]
  10. Williams, C.A.; Reichstein, M.; Buchmann, N.; Baldocchi, D.; Beer, C.; Schwalm, C.; Wohlfahrt, G.; Hasler, N.; Bernhofer, C.; Foken, T. Climate and vegetation controls on the surface water balance: Synthesis of evapotranspiration measured across a global network of flux towers. Water Resour. Res. 2012, 48. [Google Scholar] [CrossRef]
  11. Vinukollu, R.K.; Wood, E.F.; Ferguson, C.R.; Fisher, J.B. Global estimates of evapotranspiration for climate studies using multi-sensor remote sensing data: Evaluation of three process-based approaches. Remote Sens. Environ. 2011, 115, 801–823. [Google Scholar] [CrossRef]
  12. Oki, T.; Kanae, S. Global hydrological cycles and world water resources. Science 2006, 313, 1068–1072. [Google Scholar] [CrossRef]
  13. Brutsaert, W. Evaporation into the atmosphere: Theory, history, and applications; D. Reidel Publishing Company: Dordrecht, Holland, 1982. [Google Scholar]
  14. Sun, G.; Alstad, K.; Chen, J.; Chen, S.; Ford, C.R.; Lin, G.; Liu, C.; Lu, N.; McNulty, S.G.; Miao, H. A general predictive model for estimating monthly ecosystem evapotranspiration. Ecohydrology 2011, 4, 245–255. [Google Scholar] [CrossRef]
  15. Sánchez-Carrillo, S.; Angeler, D.G.; Sánchez-Andrés, R.; Alvarez-Cobelas, M.; Garatuza-Payán, J. Evapotranspiration in semi-arid wetlands: Relationships between inundation and the macrophyte-cover: Open-water ratio. Adv. Water Resour. 2004, 27, 643–655. [Google Scholar] [CrossRef]
  16. Elsawwaf, M.; Willems, P.; Pagano, A.; Berlamont, J. Evaporation estimates from Nasser Lake, Egypt, based on three floating station data and Bowen ratio energy budget. Theor. Appl. Climatol. 2010, 100, 439–465. [Google Scholar] [CrossRef]
  17. Jacobs, J.M.; Mergelsberg, S.L.; Lopera, A.F.; Myers, D.A. Evapotranspiration from a wet prairie wetland under drought conditions: Paynes Prairie Preserve, FL, USA. Wetlands 2002, 22, 374–385. [Google Scholar] [CrossRef]
  18. Winter, T.C.; Buso, D.C.; Rosenberry, D.O.; Likens, G.E.; Sturrock, A.M., Jr.; Mau, D.P. Evaporation determined by the energy-budget method for Mirror Lake, New Hampshire. Limnol. Oceanogr. 2003, 48, 995–1009. [Google Scholar] [CrossRef]
  19. Drexler, J.Z.; Anderson, F.E.; Snyder, R.L. Evapotranspiration rates and crop coefficients for a restored marsh in the Sacramento–San Joaquin Delta, California, USA. Hydrol. Process. 2008, 22, 725–735. [Google Scholar] [CrossRef]
  20. Alvarez-Cobelas, M.; Cirujano, S.; Sánchez-Carrillo, S. Hydrological and botanical man-made changes in the Spanish wetland of Las Tablas de Daimiel. Biol. Conserv. 2001, 97, 89–98. [Google Scholar] [CrossRef]
  21. LeBlanc, M.-C.; de Blois, S.; Lavoie, C. The invasion of a large lake by the Eurasian genotype of common reed: The influence of roads and residential construction. J. Great Lakes Res. 2010, 36, 554–560. [Google Scholar] [CrossRef]
  22. Kustas, W.; Norman, J. Use of remote sensing for evapotranspiration monitoring over land surfaces. Hydrol. Sci. J. 1996, 41, 495–516. [Google Scholar] [CrossRef]
  23. Anderson, M.C.; Norman, J.M.; Mecikalski, J.R.; Otkin, J.A.; Kustas, W.P. A climatological study of evapotranspiration and moisture stress across the continental United States based on thermal remote sensing: 1. Model formulation. J. Geophys. Res. 2007, 112. [Google Scholar] [CrossRef]
  24. Batra, N.; Islam, S.; Venturini, V.; Bisht, G.; Jiang, L. Estimation and comparison of evapotranspiration from MODIS and AVHRR sensors for clear sky days over the Southern Great Plains. Remote Sens. Environ. 2006, 103, 1–15. [Google Scholar] [CrossRef]
  25. Mu, Q.; Zhao, M.; Running, S.W. Improvements to a MODIS global terrestrial evapotranspiration algorithm. Remote Sens. Environ. 2011, 115, 1781–1800. [Google Scholar]
  26. Niu, Z.; Gong, P.; Cheng, X.; Guo, J.; Wang, L.; Huang, H.; Shen, S.; Wu, Y.; Wang, X.; Wang, X. Geographical characteristics of China’s wetlands derived from remotely sensed data. Sci. China Ser. D Earth Sci. 2009, 52, 723–738. [Google Scholar] [CrossRef]
  27. Downing, J.; Prairie, Y.; Cole, J.; Duarte, C.; Tranvik, L.; Striegl, R.; McDowell, W.; Kortelainen, P.; Caraco, N.; Melack, J. The global abundance and size distribution of lakes, ponds, and impoundments. Limnol. Oceanogr. 2006, 51, 2388–2397. [Google Scholar] [CrossRef]
  28. Lehner, B.; Döll, P. Development and validation of a global database of lakes, reservoirs and wetlands. J. Hydrol. 2004, 296, 1–22. [Google Scholar] [CrossRef]
  29. McDonald, C.P.; Rover, J.A.; Stets, E.G.; Striegl, R.G. The regional abundance and size distribution of lakes and reservoirs in the United States and implications for estimates of global lake extent. Limnol. Oceanogr. 2012, 57, 597–606. [Google Scholar] [CrossRef]
  30. Zhang, B. Research of Poyang Lake; Shanghai Scientific & Technical Publishers: Shanghai, China, 1988; p. 572. [Google Scholar]
  31. Andreoli, R.; Yesou, Y.; Li, J.; Desnos, Y.; Shifeng, H.; de Fraipont, P. Poyang Hu (Jiangxi Province, PR of China) area variations between January 2004 and June 2006 using ENVISAT low and medium resolution time series. Geogr. Inf. Sci. 2007, 13, 24–35. [Google Scholar]
  32. Cai, X.; Chen, X.; Wang, X,; Gan, W. Spatial difference of water stage and its impact upon wetland hydrological analysis in Poyang Lake. J. Huazhong Norm. Univ. Nat. Sci. 2011, 24, 139–144. (In Chinese) [Google Scholar]
  33. Land Processes Distributed Active Archive Center Home Page. Available online: https://lpdaac.usgs.gov/ (accessed on 31 July 2011).
  34. Schaaf, C.B.; Gao, F.; Strahler, A.H.; Lucht, W.; Li, X.; Tsang, T.; Strugnell, N.C.; Zhang, X.; Jin, Y.; Muller, J.-P. First operational BRDF, albedo nadir reflectance products from MODIS. Remote Sens. Environ. 2002, 83, 135–148. [Google Scholar] [CrossRef]
  35. Bisht, G.; Venturini, V.; Islam, S.; Jiang, L. Estimation of the net radiation using MODIS (Moderate Resolution Imaging Spectroradiometer) data for clear sky days. Remote Sens. Environ. 2005, 97, 52–67. [Google Scholar] [CrossRef]
  36. Liu, B.; Zhai, J.; Gao, C.; Jiang, T.; Wang, Y. A Comparison of Daily Actual Evapotranspiration Evaluation Models Based on Field Observational Data. Adv. Earth Sci. 2010, 9, 014. [Google Scholar]
  37. China Meteorological Data Sharing Service System Home Page. Available online: http://cdc.cma.gov.cn/ (accessed on 31 July 2011).
  38. Jiang, L.; Islam, S. A methodology for estimation of surface evapotranspiration over large areas using remote sensing observations. Geophys. Res. Lett. 1999, 26, 2773–2776. [Google Scholar] [CrossRef]
  39. Jiang, L.; Islam, S. Estimation of surface evaporation map over southern Great Plains using remote sensing data. Water Resour. Res. 2001, 37, 329–340. [Google Scholar] [CrossRef]
  40. Jiang, L.; Islam, S. An intercomparison of regional latent heat flux estimation using remote sensing data. Int. J. Remote Sens. 2003, 24, 2221–2236. [Google Scholar] [CrossRef]
  41. Priestley, C.H.B.; Taylor, R.J. On the assessment of surface heat flux and evaporation using large-scale parameters. Mon. Weath. Rev. 1972, 100, 81–92. [Google Scholar]
  42. Carlson, T. An overview of the “triangle method” for estimating surface evapotranspiration and soil moisture from satellite imagery. Sensors 2007, 7, 1612–1629. [Google Scholar] [CrossRef]
  43. Petropoulos, G.; Carlson, T.; Wooster, M.; Islam, S. A review of Ts/VI remote sensing based methods for the retrieval of land surface energy fluxes and soil surface moisture. Progr. Phys. Geogr. 2009, 33, 224–250. [Google Scholar] [CrossRef]
  44. Peng, J.; Liu, Y.; Zhao, X.; Loew, A. A direct algorithm for estimating daily regional Evapotranspiration from modis TOA radiances. In Proceedings of the 2012 IEEE International Geoscience and Remote Sensing Symposium (IGARSS), Munich, Germany, 22–27 July 2012; pp. 702–705.
  45. Tang, R.; Li, Z.L.; Tang, B. An application of the Ts-VI triangle method with enhanced edges determination for evapotranspiration estimation from MODIS data in arid and semi-arid regions: Implementation and validation. Remote Sens. Environ. 2010, 114, 540–551. [Google Scholar] [CrossRef]
  46. Stisen, S.; Sandholt, I.; Nørgaard, A.; Fensholt, R.; Jensen, K.H. Combining the triangle method with thermal inertia to estimate regional evapotranspiration—Applied to MSG-SEVIRI data in the Senegal River basin. Remote Sens. Environ. 2008, 112, 1242–1255. [Google Scholar] [CrossRef]
  47. Margulis, S.A.; Kim, J.; Hogue, T. A comparison of the triangle retrieval and variational data assimilation methods for surface turbulent flux estimation. J. Hydrometeorol. 2005, 6, 1063–1072. [Google Scholar]
  48. Moran, M.; Rahman, A.; Washburne, J.; Goodrich, D.; Weltz, M.; Kustas, W. Combining the Penman-Monteith equation with measurements of surface temperature and reflectance to estimate evaporation rates of semiarid grassland. Agric. For. Meteorol. 1996, 80, 87–109. [Google Scholar] [CrossRef]
  49. Peng, J.; Liu, Y.; Zhao, X.; Loew, A. Estimation of evapotranspiration from MODIS TOA radiances in the Poyang Lake basin, China. Hydrol. Earth Syst. Sci. 2013, 17, 1431–1444. [Google Scholar] [CrossRef]
  50. Eichinger, W.E.; Parlange, M.B.; Stricker, H. On the Concept of Equilibrium Evaporation and the Value of the Priestley-Taylor Coefficient. Water Resour. Res. 1996, 32, 161–164. [Google Scholar] [CrossRef]
  51. Caparrini, F.; Castelli, F.; Entekhabi, D. Estimation of surface turbulent fluxes through assimilation of radiometric surface temperature sequences. J. Hydrometeorol. 2004, 5, 145–159. [Google Scholar]
  52. Liu, Y.; Hiyama, T. Detectability of day-to-day variability in the evaporative flux ratio: A field examination in the Loess Plateau of China. Water Resour. Res. 2007, 43. [Google Scholar] [CrossRef]
  53. Zhao, X.; Liu, Y.; Wan, R. Satellite data application for the assessment of water balance in the Taihu watershed, China. J. Appl. Remote Sens. 2013, 7. [Google Scholar] [CrossRef]
  54. Farah, H.; Bastiaanssen, W.; Feddes, R. Evaluation of the temporal variability of the evaporative fraction in a tropical watershed. Int. J. Appl. Earth Observ. Geoinf. 2004, 5, 129–140. [Google Scholar] [CrossRef]
  55. Hoedjes, J.; Chehbouni, A.; Jacob, F.; Ezzahar, J.; Boulet, G. Deriving daily evapotranspiration from remotely sensed instantaneous evaporative fraction over olive orchard in semi-arid Morocco. J. Hydrol. 2008, 354, 53–64. [Google Scholar] [CrossRef]
  56. Jia, L.; Xi, G.; Liu, S.; Huang, C.; Yan, Y.; Liu, G. Regional estimation of daily to annual regional evapotranspiration with MODIS data in the Yellow River Delta wetland. Hydrol. Earth Syst. Sci. 2009, 136, 1775–1787. [Google Scholar]
  57. Peng, J.; Borsche, M.; Liu, Y.; Loew, A. How representative are instantaneous evaporative fraction measurements of daytime fluxes? Hydrol. Earth Syst. Sci. 2013, 17, 3913–3919. [Google Scholar] [CrossRef]
  58. Bisht, G.; Bras, R.L. Estimation of net radiation from the MODIS data under all sky conditions: Southern Great Plains case study. Remote Sens. Environ. 2010, 114, 1522–1534. [Google Scholar] [CrossRef]
  59. Bhattacharya, B.; Mallick, K.; Patel, N.; Parihar, J. Regional clear sky evapotranspiration over agricultural land using remote sensing data from Indian geostationary meteorological satellite. J. Hydrol. 2010, 387, 65–80. [Google Scholar] [CrossRef]
  60. Mu, Q.; Heinsch, F.A.; Zhao, M.; Running, S.W. Development of a global evapotranspiration algorithm based on MODIS and global meteorology data. Remote Sens. Environ. 2007, 111, 519–536. [Google Scholar] [CrossRef]
  61. Davranche, A.; Lefebvre, G.; Poulin, B. Wetland monitoring using classification trees and SPOT-5 seasonal time series. Remote Sens. Environ. 2010, 114, 552–562. [Google Scholar] [CrossRef] [Green Version]
  62. McFeeters, S. The use of the Normalized Difference Water Index (NDWI) in the delineation of open water features. Int. J. Remote Sens. 1996, 17, 1425–1432. [Google Scholar] [CrossRef]
  63. Rogers, A.; Kearney, M. Reducing signature variability in unmixing coastal marsh Thematic Mapper scenes using spectral indices. Int. J. Remote Sens. 2004, 25, 2317–2335. [Google Scholar] [CrossRef]
  64. Gao, B.-C. NDWI—A normalized difference water index for remote sensing of vegetation liquid water from space. Remote Sens. Environ. 1996, 58, 257–266. [Google Scholar] [CrossRef]
  65. Bryant, R.G. Application of AVHRR to monitoring a climatically sensitive playa. Case study: Chott el Djerid, southern Tunisia. Earth Surf. Process. Landf. 1999, 24, 283–302. [Google Scholar] [CrossRef]
  66. Kalma, J.D.; McVicar, T.R.; McCabe, M.F. Estimating land surface evaporation: A review of methods using remotely sensed surface temperature data. Surv. Geophys. 2008, 29, 421–469. [Google Scholar] [CrossRef]
  67. Raupach, M. Combination theory and equilibrium evaporation. Q. J. R. Meteorol. Soc. 2001, 127, 1149–1181. [Google Scholar] [CrossRef]
  68. Lafleur, P.M.; Rouse, W.R. The influence of surface cover and climate on energy partitioning and evaporation in a subarctic wetland. Bound. Layer Meteorol. 1988, 44, 327–347. [Google Scholar] [CrossRef]
  69. Lenters, J.D.; Kratz, T.K.; Bowser, C.J. Effects of climate variability on lake evaporation: Results from a long-term energy budget study of Sparkling Lake, northern Wisconsin (USA). J. Hydrol. 2005, 308, 168–195. [Google Scholar] [CrossRef]
  70. Goulden, M.L.; Litvak, M.; Miller, S.D. Factors that control Typha marsh evapotranspiration. Aquat. Bot. 2007, 86, 97–106. [Google Scholar] [CrossRef]
  71. Aires, L.M.; Pio, C.A.; Pereira, J.S. The effect of drought on energy and water vapour exchange above a Mediterranean C3/C4 grassland in Southern Portugal. Agric. For. Meteorol. 2008, 148, 565–579. [Google Scholar] [CrossRef]
  72. Booth, E.G.; Loheide, S.P. Effects of evapotranspiration partitioning, plant water stress response and topsoil removal on the soil moisture regime of a floodplain wetland: Implications for restoration. Hydrol. Process. 2010, 24, 2934–2946. [Google Scholar] [CrossRef]
  73. Giambelluca, T.W.; Scholz, F.G.; Bucci, S.J.; Meinzer, F.; Goldstein, G.; Hoffmann, W.; Franco, A.; Buchert, M. Evapotranspiration and energy balance of Brazilian savannas with contrasting tree density. Agric. For. Meteorol. 2009, 149, 1365–1376. [Google Scholar] [CrossRef]
  74. Schedlbauer, J.L.; Oberbauer, S.F.; Starr, G.; Jimenez, K.L. Controls on sensible heat and latent energy fluxes from a short-hydroperiod Florida Everglades marsh. J. Hydrol. 2011, 411, 331–341. [Google Scholar] [CrossRef]
  75. Lenters, J.D.; Cutrell, G.J.; Istanbulluoglu, E.; Scott, D.T.; Herrman, K.S.; Irmak, A.; Eisenhauer, D. Seasonal energy and water balance of a Phragmites australis-dominated wetland in the Republican River basin of south-central Nebraska (USA). J. Hydrol. 2011, 408, 19–34. [Google Scholar] [CrossRef]
  76. San José, J.; Meirelles, M.; Bracho, R.; Nikonova, N. A comparative analysis of the flooding and fire effects on the energy exchange in a wetland community (Morichal) of the Orinoco Llanos. J. Hydrol. 2001, 242, 228–254. [Google Scholar] [CrossRef]
  77. Rouse, W.R. The energy and water balance of high-latitude wetlands: Controls and extrapolation. Glob. Change Biol. 2000, 6, 59–68. [Google Scholar] [CrossRef]
  78. Anda, A.; Boldizsár, A. Microclimate and transpiration of reedbeds on lakeshores with changing water levels. Acta Agron. Hungarica 2006, 54, 39–47. [Google Scholar] [CrossRef]
  79. Zhang, Y.; Li, C.; Trettin, C.C.; Li, H.; Sun, G. An integrated model of soil, hydrology, and vegetation for carbon dynamics in wetland ecosystems. Glob. Biogeochem. Cycles 2002, 16, 9–1. [Google Scholar]
  80. Keough, J.R.; Thompson, T.A.; Guntenspergen, G.R.; Wilcox, D.A. Hydrogeomorphic factors and ecosystem responses in coastal wetlands of the Great Lakes. Wetlands 1999, 19, 821–834. [Google Scholar] [CrossRef]
  81. Baldocchi, D.D.; Wilson, K.B. Modeling CO2 and water vapor exchange of a temperate broadleaved forest across hourly to decadal time scales. Ecol. Modell. 2001, 142, 155–184. [Google Scholar] [CrossRef]
  82. Churkina, G.; Schimel, D.; Braswell, B.H.; Xiao, X. Spatial analysis of growing season length control over net ecosystem exchange. Glob. Change Biol. 2005, 11, 1777–1787. [Google Scholar] [CrossRef]
  83. Angert, A.; Biraud, S.; Bonfils, C.; Henning, C.; Buermann, W.; Pinzon, J.; Tucker, C.; Fung, I. Drier summers cancel out the CO2 uptake enhancement induced by warmer springs. Proc. Natl. Acad. Sci. USA 2005, 102, 10823–10827. [Google Scholar]
  84. Moore, K.E.; Fitzjarrald, D.R.; Sakai, R.K.; Goulden, M.L.; Munger, J.W.; Wofsy, S.C. Seasonal variation in radiative and turbulent exchange at a deciduous forest in central Massachusetts. J. Appl. Meteorol. 1996, 35, 122–134. [Google Scholar] [CrossRef]
  85. Wilson, K.B.; Baldocchi, D.D.; Hanson, P.J. Spatial and seasonal variability of photosynthetic parameters and their relationship to leaf nitrogen in a deciduous forest. Tree Physiol. 2000, 20, 565–578. [Google Scholar] [CrossRef]
  86. Feng, L.; Hu, C.; Chen, X.; Cai, X.; Tian, L.; Gan, W. Assessment of inundation changes of Poyang Lake using MODIS observations between 2000 and 2010. Remote Sens. Environ. 2012, 121, 80–92. [Google Scholar] [CrossRef]
  87. Ye, C.; Zhao, X.; Wu, G.; Wang, X.; Liu, Y. Vegetation biomass spatial-temporal variations and the influence of the water level in Poyang Lake National Nature Reserve. J. Lake Sci. 2013, 25, 707–714. (In Chinese) [Google Scholar]

