3.2. Hydrogeological Characterization
The geologic units of the Copiapó river basin can be grouped into unconsolidated deposits and undifferentiated bedrock. The unconsolidated deposits have hydrogeological potential to store and transmit important volumes of groundwater, as well as to facilitate the recharge of the aquifer. The aquifer’s mean hydraulic conductivity is 22 m/day with a minimum of 2 m/day and a maximum of 470 m/day. Estimated transmissivities are 868, 100 and 12,200 m
2/day for the mean, minimum and maximum respectively, and the storage coefficient ranges between 0.1 and 0.2 [
23]. The undifferentiated bedrock is made up of impermeable rocks with no water storage capacity. For further details on the hydrogeological characterization the reader is referred to the work performed by DICTUC [
23].
Table 4.
Distribution of the groundwater rights granted in the aquifer of the Copiapó River basin.
Table 4.
Distribution of the groundwater rights granted in the aquifer of the Copiapó River basin.
| Number of ground water rights granted in the aquifer of the Copiapó River Basin |
|---|
| Sector | Irrigation | No. | Human consumption | No. | Mining | No. | Other uses | No. | Total | No. |
|---|
| 1 | 3% | 9 | 0% | 0 | 0% | 0 | 1% | 1 | 2% | 10 |
| 2 | 18% | 56 | 7% | 2 | 7% | 5 | 6% | 5 | 14% | 68 |
| 3 | 14% | 43 | 0% | 0 | 7% | 5 | 17% | 14 | 13% | 62 |
| 4 | 6% | 19 | 69% | 20 | 46% | 31 | 10% | 8 | 16% | 78 |
| 5 | 30% | 91 | 17% | 5 | 27% | 18 | 35% | 29 | 30% | 143 |
| 6 | 28% | 86 | 7% | 2 | 12% | 8 | 31% | 26 | 25% | 122 |
| Total | 100% | 304 | 100% | 29 | 100% | 67 | 100% | 83 | 100% | 483 |
| Water flow granted (ground water) in the aquifer of the Copiapó River Basin |
| Sector | Irrigation | L/s | Human consumption | L/s | Mining | L/s | Other uses | L/s | Total | L/s |
| 1 | 6% | 619 | 0% | 0 | 0% | 0 | 3% | 100 | 4% | 719 |
| 2 | 25% | 2,482 | 2% | 38 | 13% | 399 | 14% | 447 | 19% | 3,366 |
| 3 | 23% | 2,276 | 0% | 0 | 5% | 159 | 25% | 777 | 18% | 3,211 |
| 4 | 4% | 393 | 79% | 1,234 | 66% | 2,002 | 11% | 342 | 22% | 3,971 |
| 5 | 22% | 2,172 | 16% | 256 | 14% | 418 | 33% | 1,022 | 22% | 3,868 |
| 6 | 21% | 2,066 | 2% | 32 | 2% | 69 | 14% | 453 | 15% | 2,620 |
| Total | 100% | 10,008 | 100% | 1,560 | 100% | 3,047 | 100% | 3,141 | 100% | 17,756 |
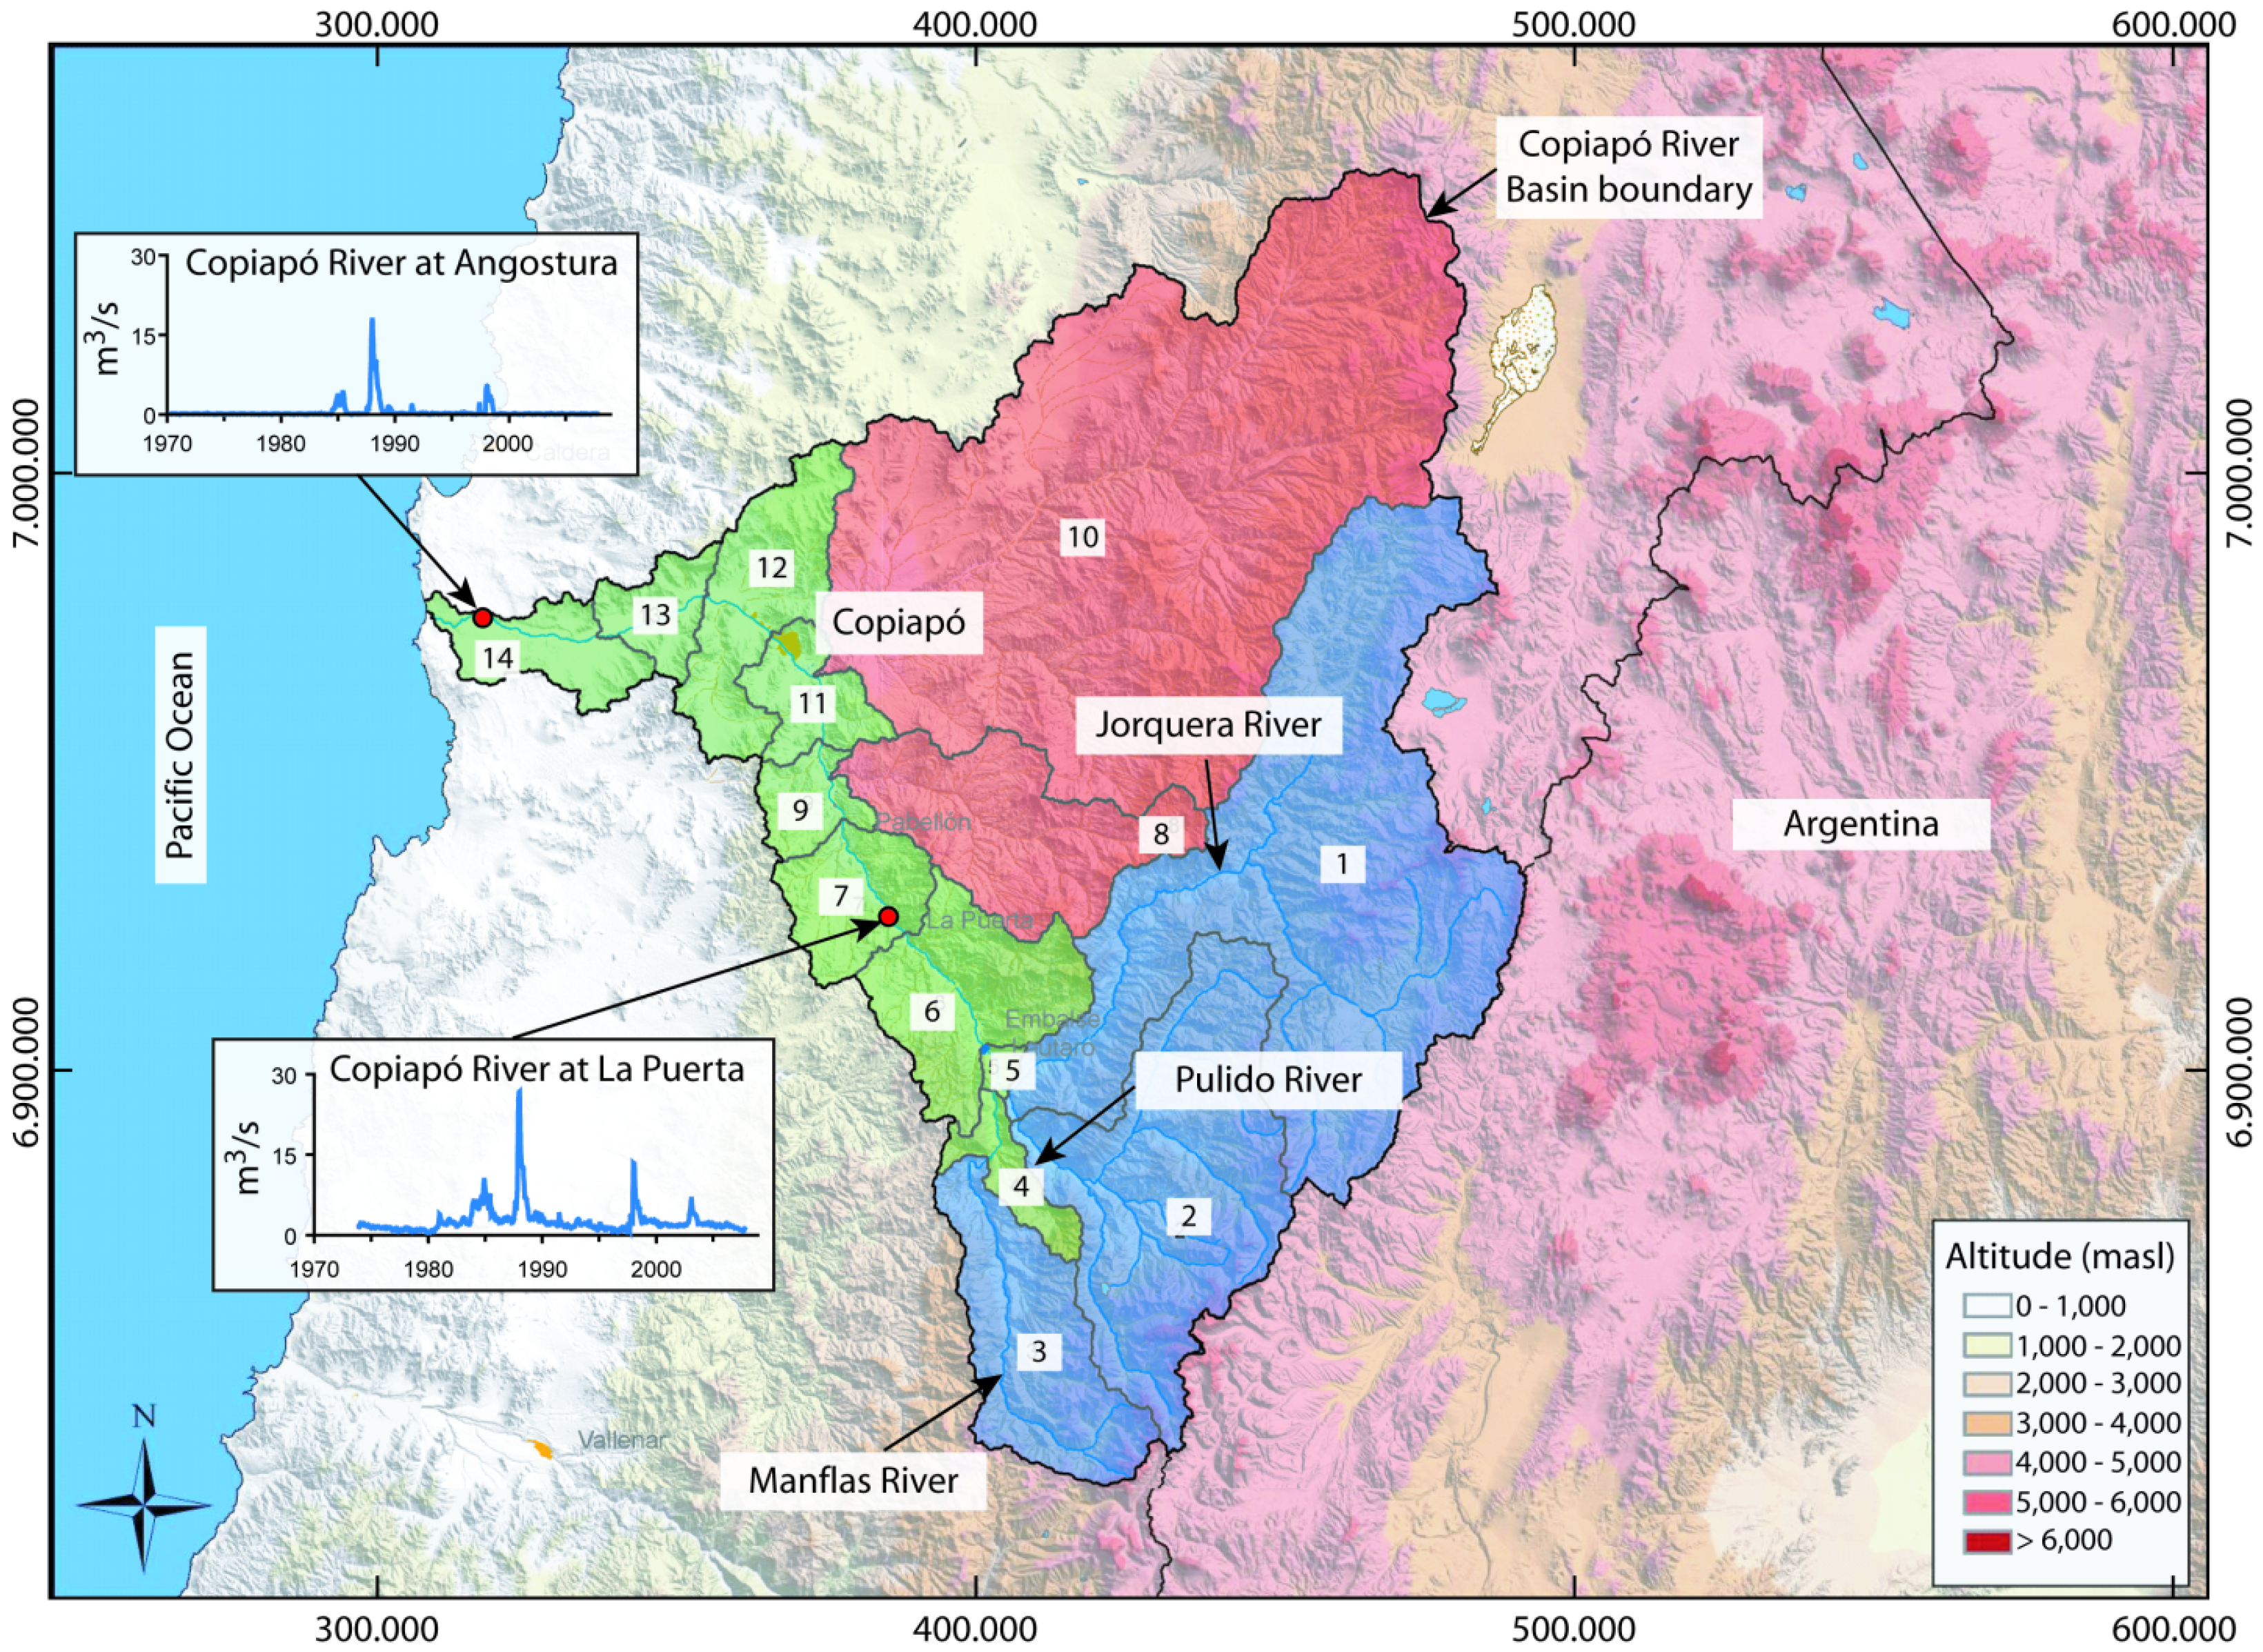
Historical recharge in the Copiapó River basin was estimated using the collected hydrologic data on a monthly basis, and allowed calculation of the water supply in the Copiapó River basin.
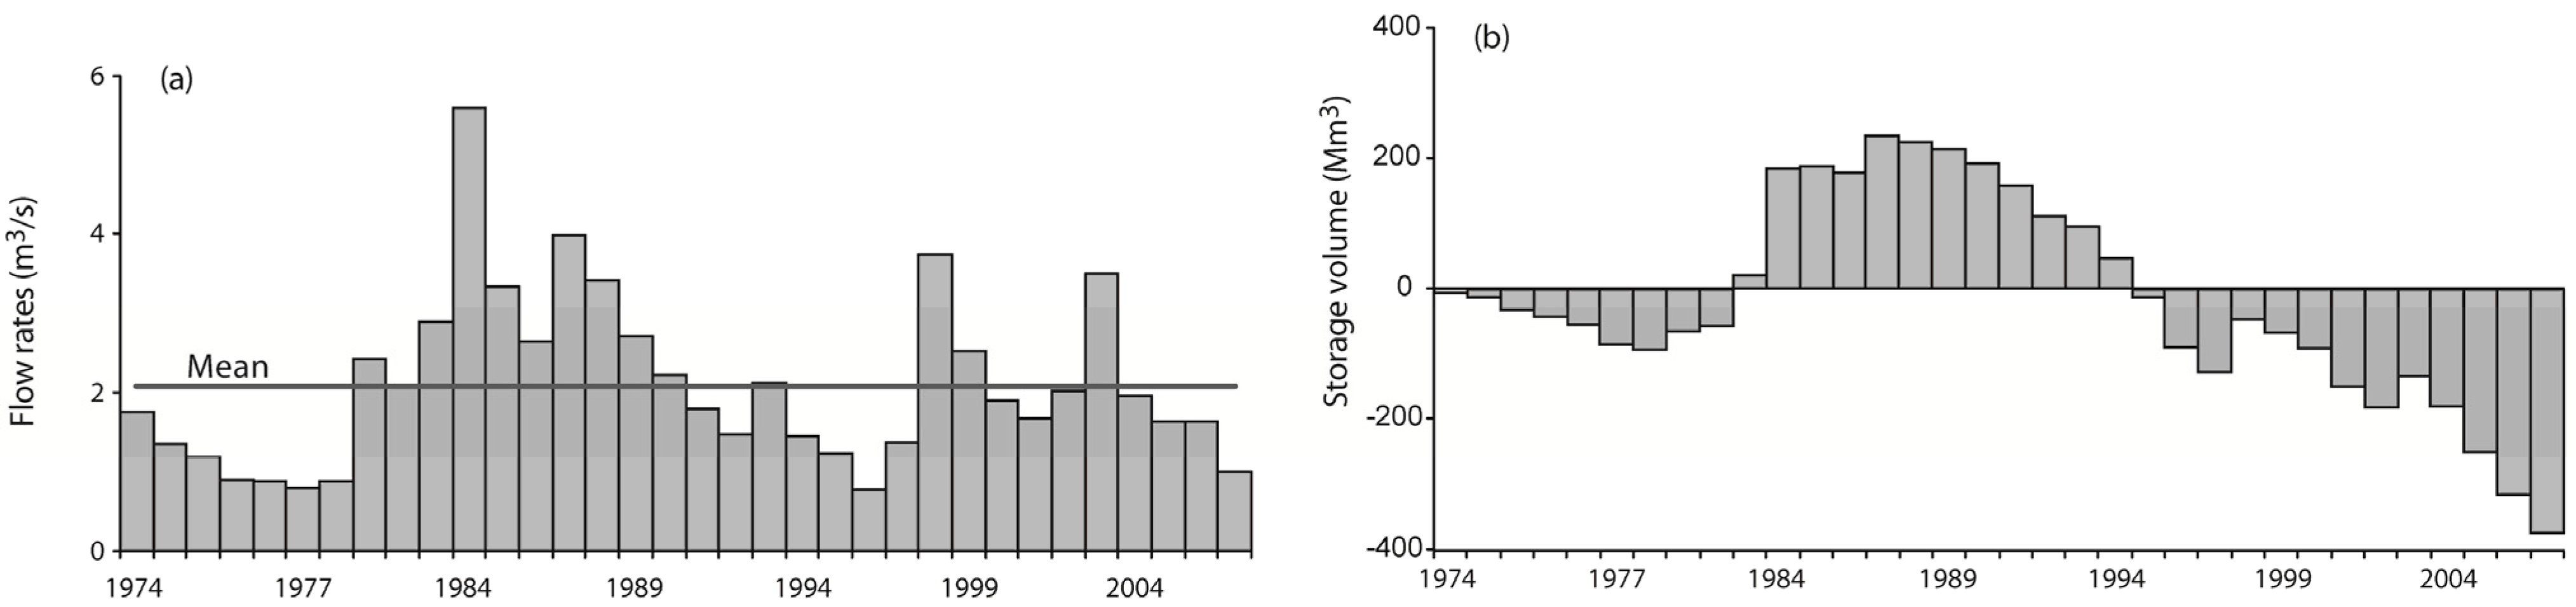
Figure 3a shows that the mean water supply of ~2 m
3/s is exceeded only in 13 out of 34 years. In addition, the temporal evolution of the aquifer storage volume since January 1974 (
i.e., the reference year with zero volume) can be estimated from records of water level in different wells (
Figure 3b). An important reduction in the stored volume starting from 1995 is observed, which is explained by the combined effect of drought and increasing water use by the different consumers.
Figure 3.
Estimated water balance in the Copiapó River basin. (a) Water supply; (b) Annual fluctuations in the aquifer’s storage volume. The reference (null) volume corresponds to 1974.
Figure 3.
Estimated water balance in the Copiapó River basin. (a) Water supply; (b) Annual fluctuations in the aquifer’s storage volume. The reference (null) volume corresponds to 1974.
3.3. Water Resources Management Model Calibration
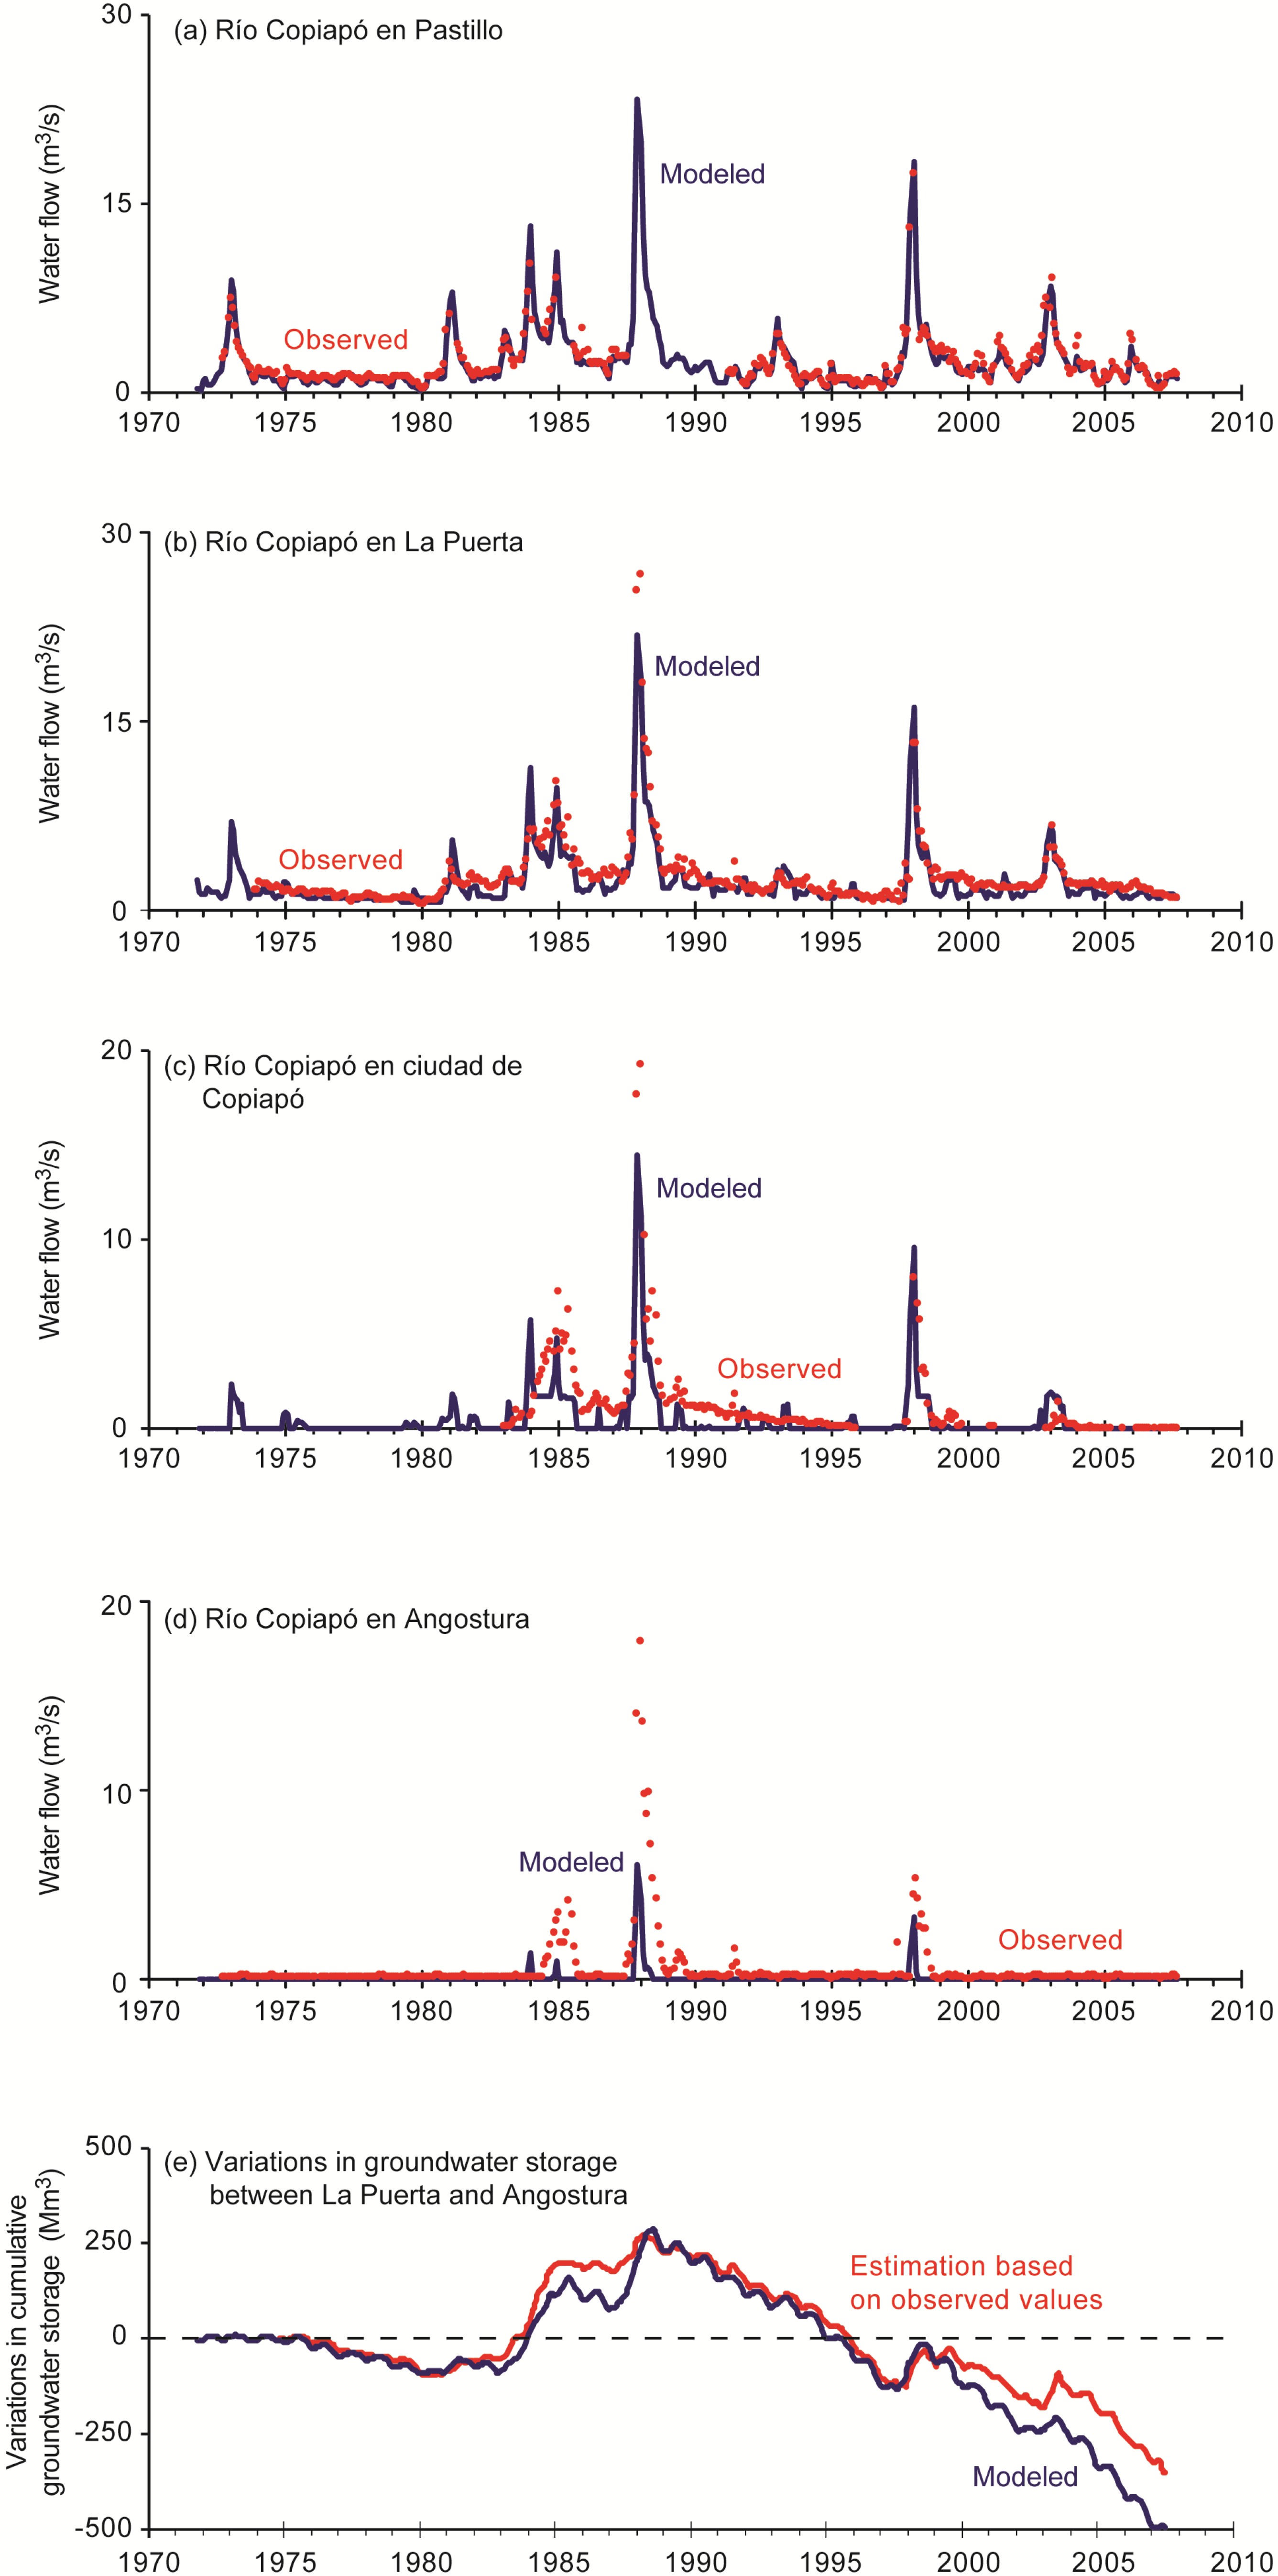
Figure 4a–d compares measured and calibrated streamflow rates in some of the selected DGA’s streamflow gages located in the Copiapó River. In general, simulated values and observations have a good agreement, particularly at “Río Copiapó en Pastillo” and at “Río Copiapó en La Puerta” (
Figure 4a–b and
Table 5). In these fluvial stations, both the mean observed and simulated water flows are well represented, as well as their standard deviation and their cumulative flows, with Nash-Sutcliffe [
32] coefficient of efficiencies (
E) of 0.905 and 0.493 for “Río Copiapó en Pastillo” and “Río Copiapó en La Puerta”, respectively. Downstream these stations is located the “Río Copiapó en ciudad de Copiapó” stream gauge (
Figure 4c). Albeit the simulated streamflows in this station do not perfectly match the observed flows (
Table 5), the trends between simulated and measured streamflows are similar, with an
E = 0.568. As shown in
Table 5, observed streamflows in the gauge nearest the outlet to the ocean,
i.e., “Río Copiapó en Angostura” (
Figure 4d)—where there are practically no water users– were the ones with a worse representation in the IWRM model (
E = 0.071), even when the simulations represented well the timing of the observed peaks. Despite this issue, the calibration of the aquifer volume time-series (
Figure 4e) shows good agreement between the modeled and estimated cumulative water volumes in the aquifer (
Table 5), with
E = 0.436. The model simulated the decreasing trend starting in 1976 and subsequent slight recovery between 1980 and 1988. Sustained declines have been observed and modeled ever since. Note that
Figure 4e shows variations in cumulative groundwater storage using the volume of the year 1974 as a reference volume, which allows observation of periods of water abundance or scarcity. For instance, the periods 1976–1984 and 1996-present correspond to seasons of water scarcity. It is worth to remark that what is seen as a substantial underestimation in groundwater storage for the period 2000–2008 (
Figure 4e), is actually less than 2.5% in terms of the stored volume (the observed storage is ~8900 Mm
3 and the storage estimated by the model is ~8700 Mm
3) and is within the uncertainty of the estimations based on the observed data.
Figure 4.
Results from the calibration process in the Copiapó River basin. (a)–(d) Stream flows at selected fluvial stations; (e) Cumulative fluctuations in the aquifer’s storage volume. The reference (null) volume corresponds to 1974.
Figure 4.
Results from the calibration process in the Copiapó River basin. (a)–(d) Stream flows at selected fluvial stations; (e) Cumulative fluctuations in the aquifer’s storage volume. The reference (null) volume corresponds to 1974.
Table 5.
Observed and simulated data obtained during the entire calibration period.
Table 5.
Observed and simulated data obtained during the entire calibration period.
| Surface waters |
|---|
| Fluvial stations | Obs. Flow (m3/s) * | Sim. Flow (m3/s) * | E (-) ** | Sim./obs. cumulative flow (m3/s) |
|---|
| Río Copiapó en Pastillo | 2.29 ± 1.85 | 2.46 ± 2.64 | 0.905 | 0.932 |
| Río Copiapó en La Puerta | 2.63 ± 2.66 | 2.19 ± 2.28 | 0.493 | 0.832 |
| Río Copiapó en ciudad de Copiapó | 1.47 ± 2.68 | 0.48 ± 1.34 | 0.568 | 0.509 |
| Río Copiapó en Angostura | 0.53 ± 1.69 | 0.06 ± 0.43 | 0.071 | 0.114 |
| Groundwater |
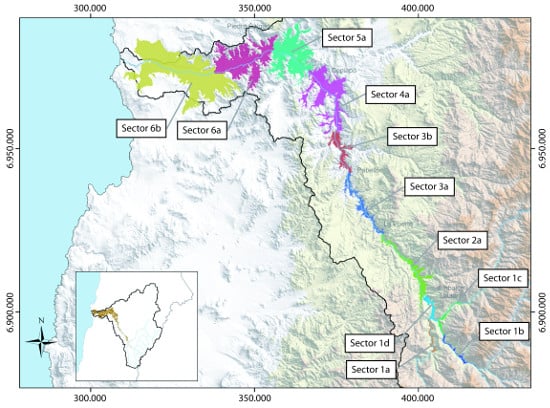
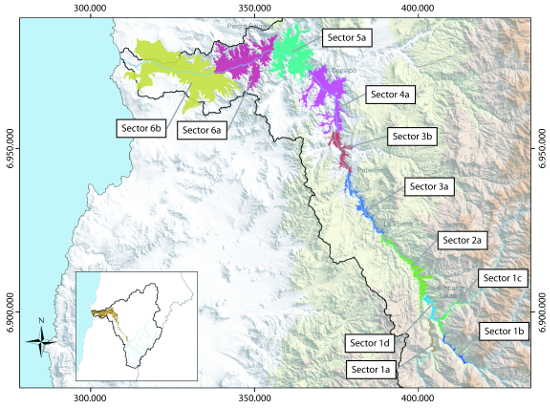
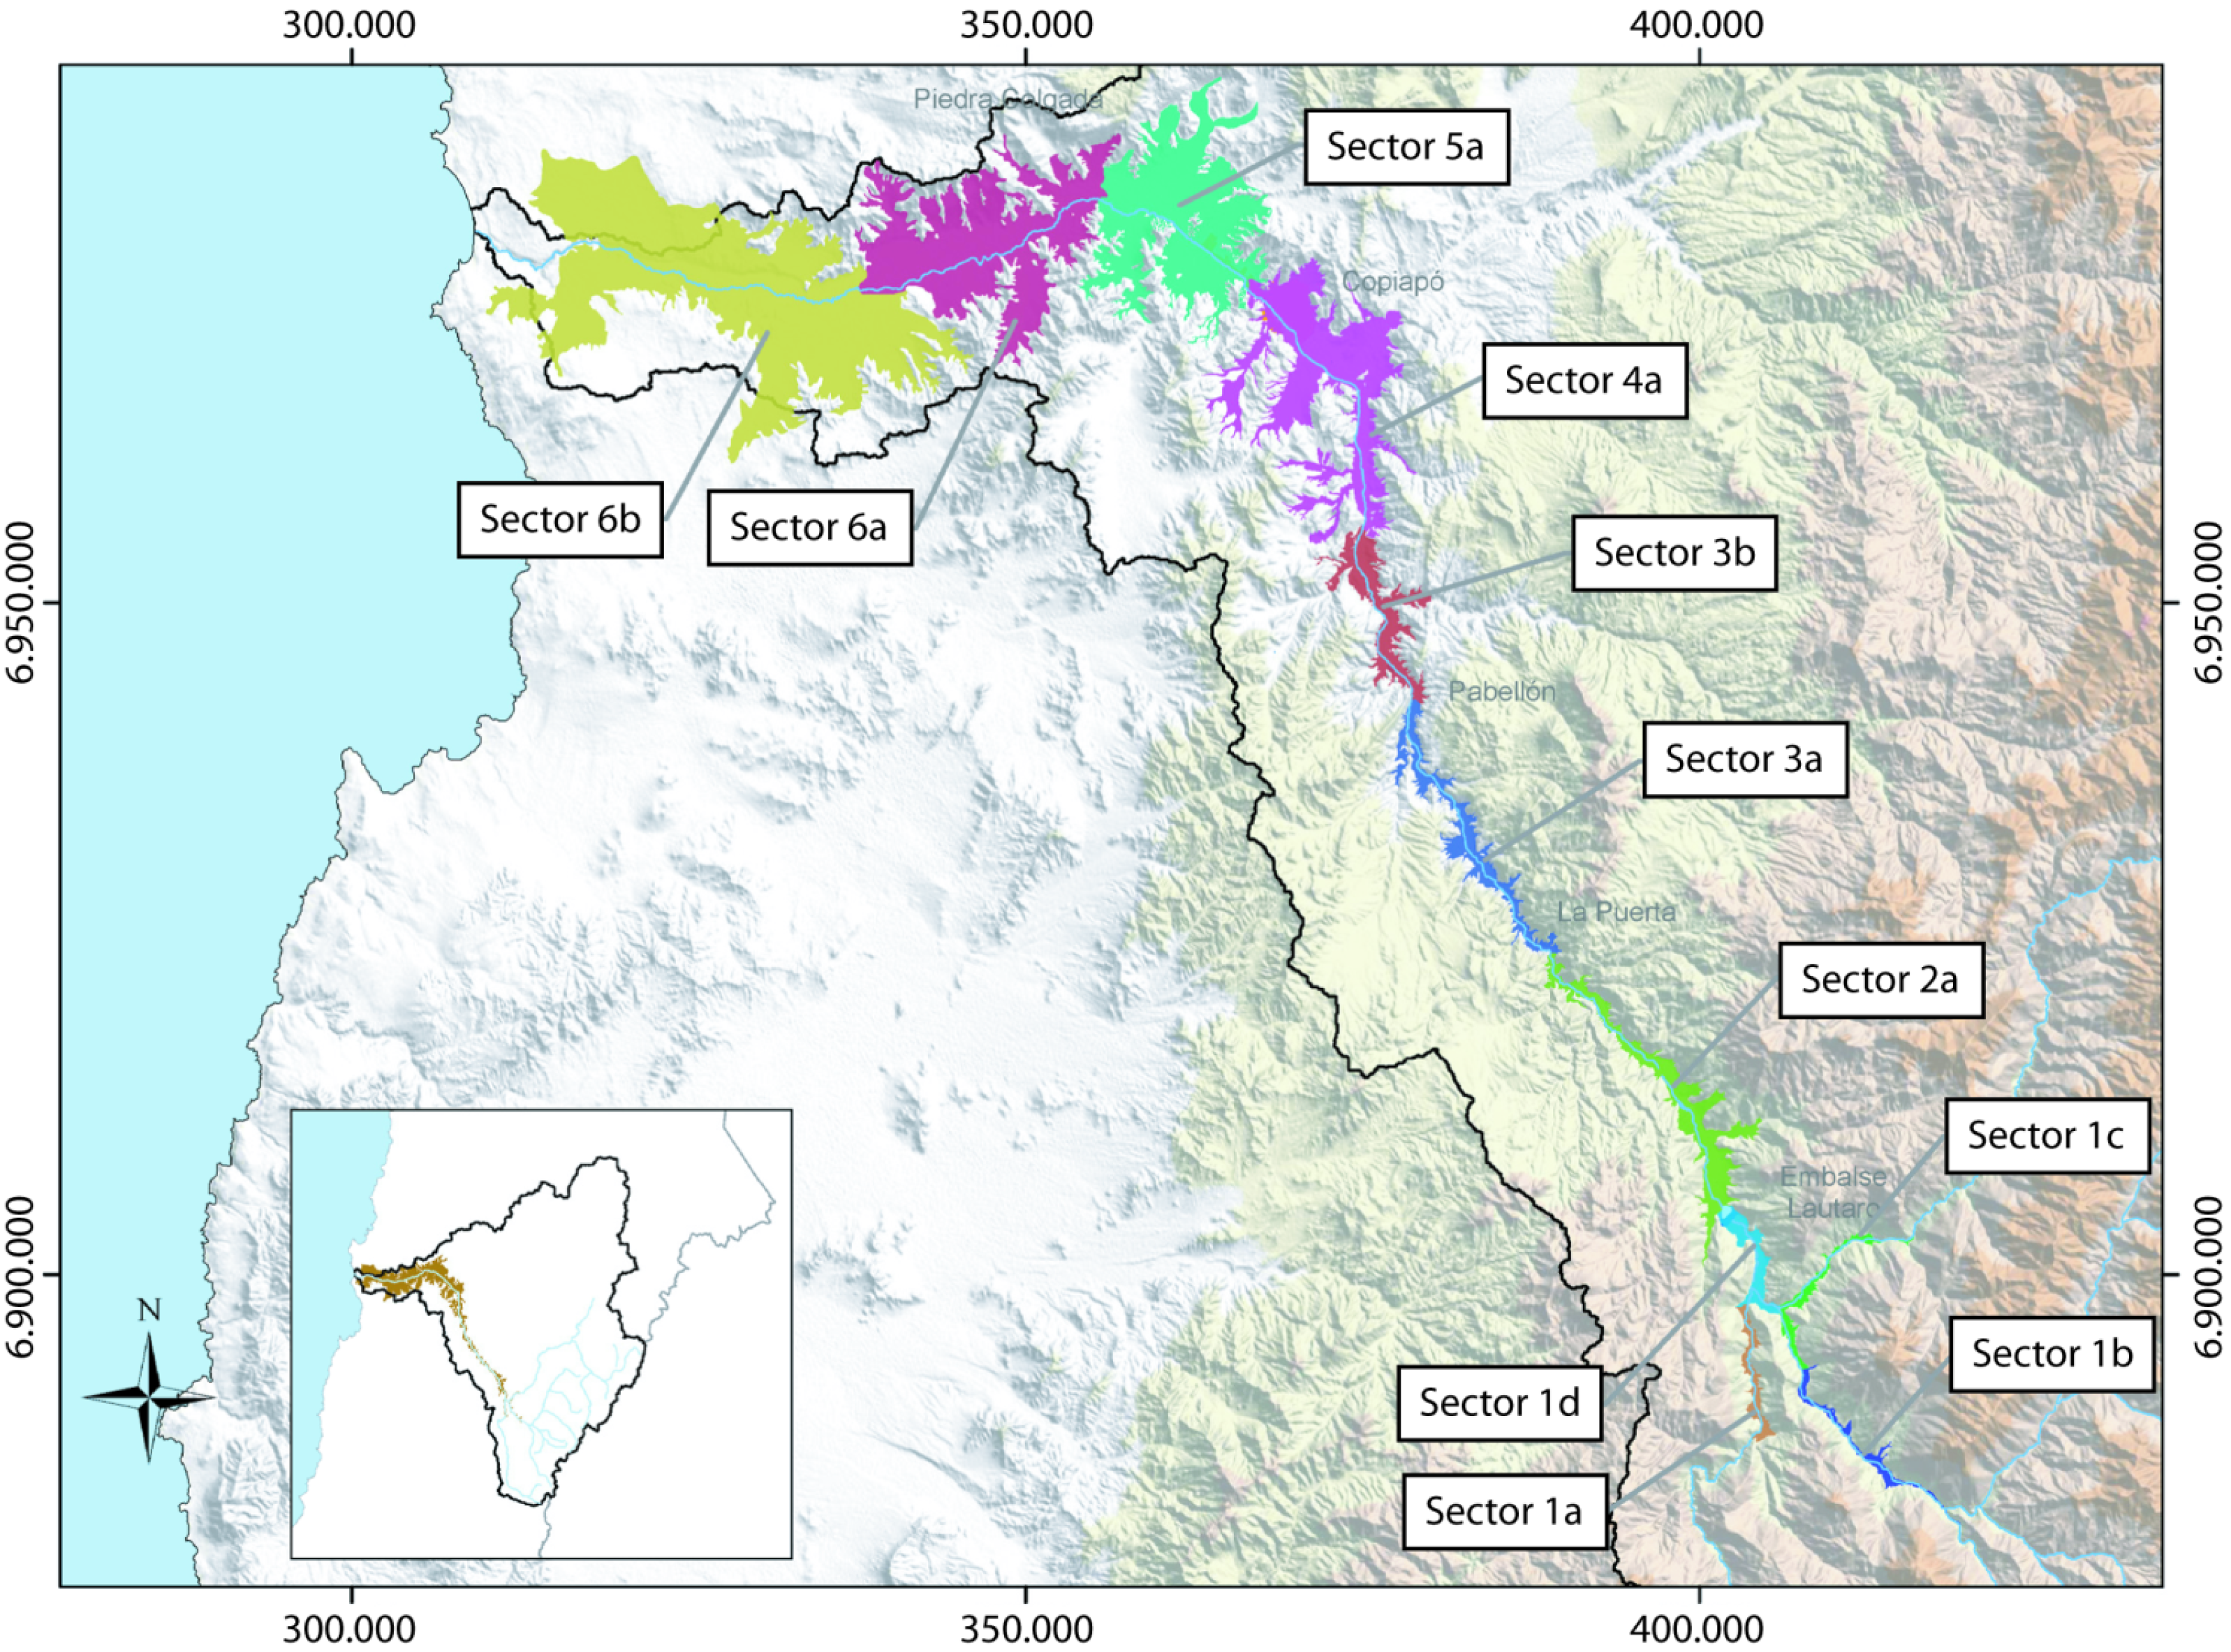
| Sector | Obs. Volume (Mm3) * | Sim. Volume (Mm3)* | Maximum Volume (Mm3) | Sim./obs. Cumulative Volume (Mm3) |
| Sector 1a | 24 ± 3 | 16 ± 9 | 34 | 0.728 |
| Sector 1b | 39 ± 2 | 44 ± 7 | 48 | 1.125 |
| Sector 1c | 38 ± 5 | 38 ± 6 | 66 | 1.104 |
| Sector 1d | 142 ± 9 | 123 ± 29 | 163 | 0.923 |
| Sector 2a | 545 ± 3 | 538 ± 20 | 588 | 0.994 |
| Sector 3a | 187 ± 20 | 176 ± 20 | 257 | 0.941 |
| Sector 3b | 189 ± 18 | 190 ± 23 | 256 | 1.012 |
| Sector 4a | 1036 ± 35 | 1027 ± 55 | 1024 | 0.993 |
| Sector 5a | 2378 ± 56 | 2395 ± 47 | 2583 | 1.009 |
| Sector 6a | 1603 ± 22 | 1607 ± 18 | 1663 | 1.005 |
| Sector 6b | 3131 ± 5 | 3130 ± 6 | 3262 | 1.002 |
| Total | | | 9944 | |
3.4. Integrated Water Resource Management Scenarios
The uses and water demands in Scenario 1 (or baseline scenario) correspond to the basins’ current situation, calculated as the monthly average of the net water consumption over the last few years of the calibration period. These monthly series of water demand were repeated for each year during the simulation period.
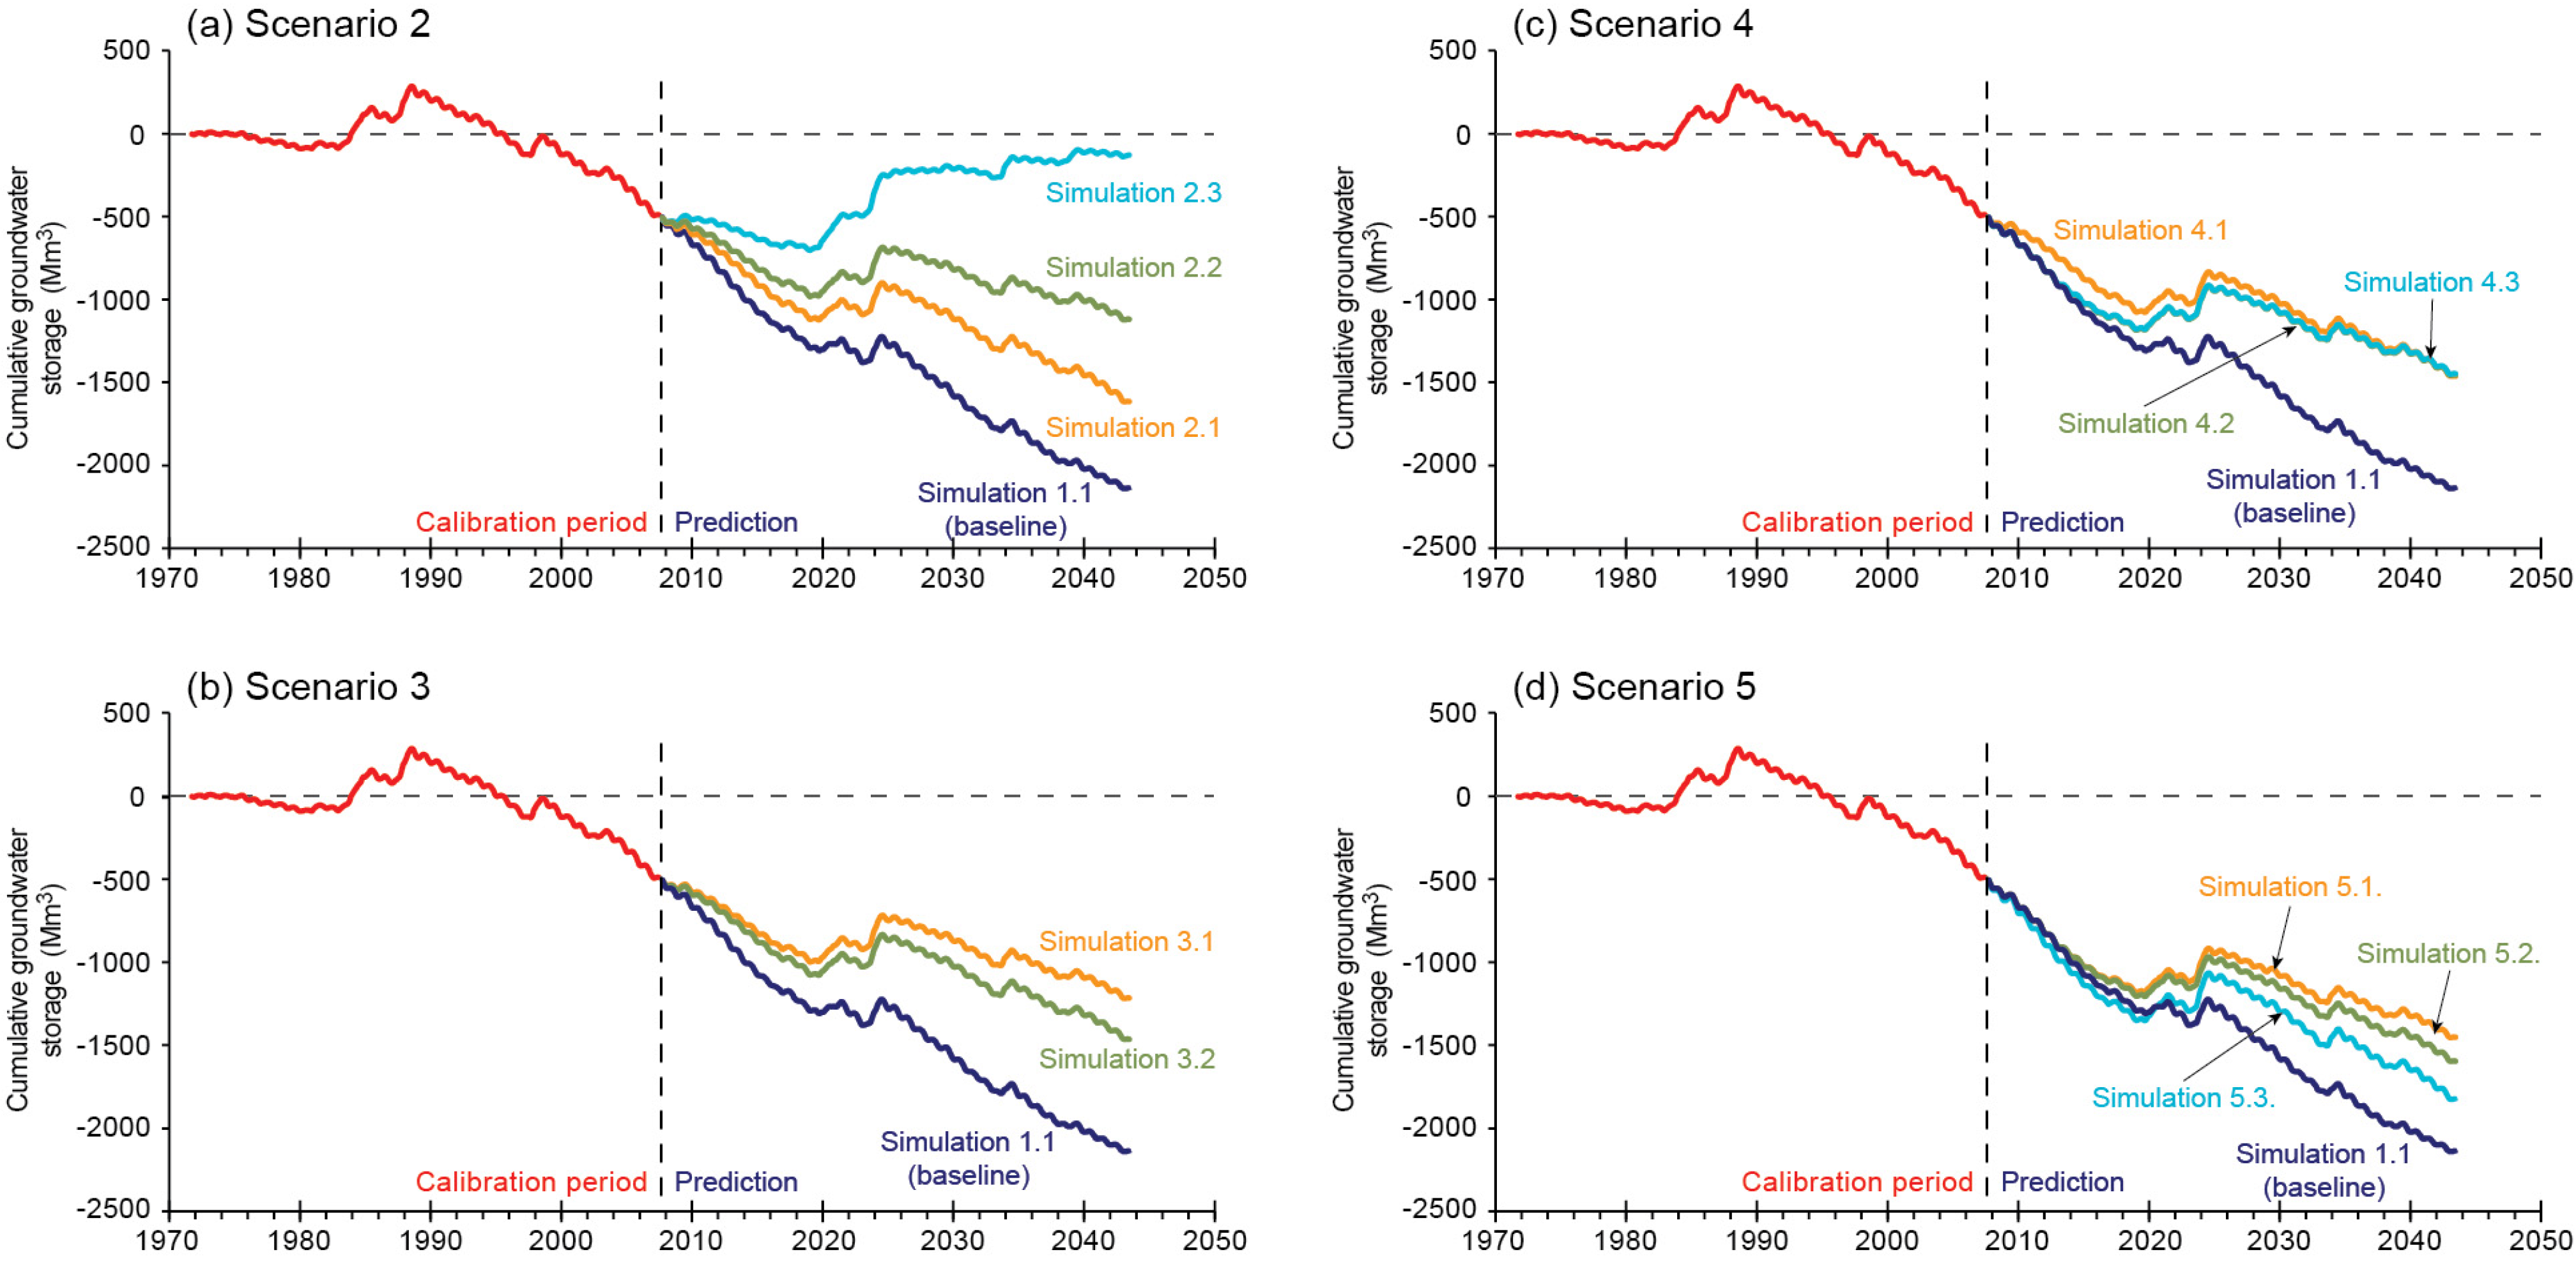
Figure 5 presents the predicted stored volume in the entire aquifer of the Copiapó River basin. The baseline scenario (Simulation 1.1) shown in
Figure 5 suggests that if no water management actions are taken, a sustained and significant decline of the water stored in the aquifer will be observed throughout the watershed. Moreover, the largest decrease in the stored volume occurs for the baseline scenario (~2200 × 10
6 m
3 by the end of the simulation period—equivalent to a 21.2% decrease of the initial aquifer’s volume). Thus, actions are urgently needed to assuage the water scarcity expected for the basin.
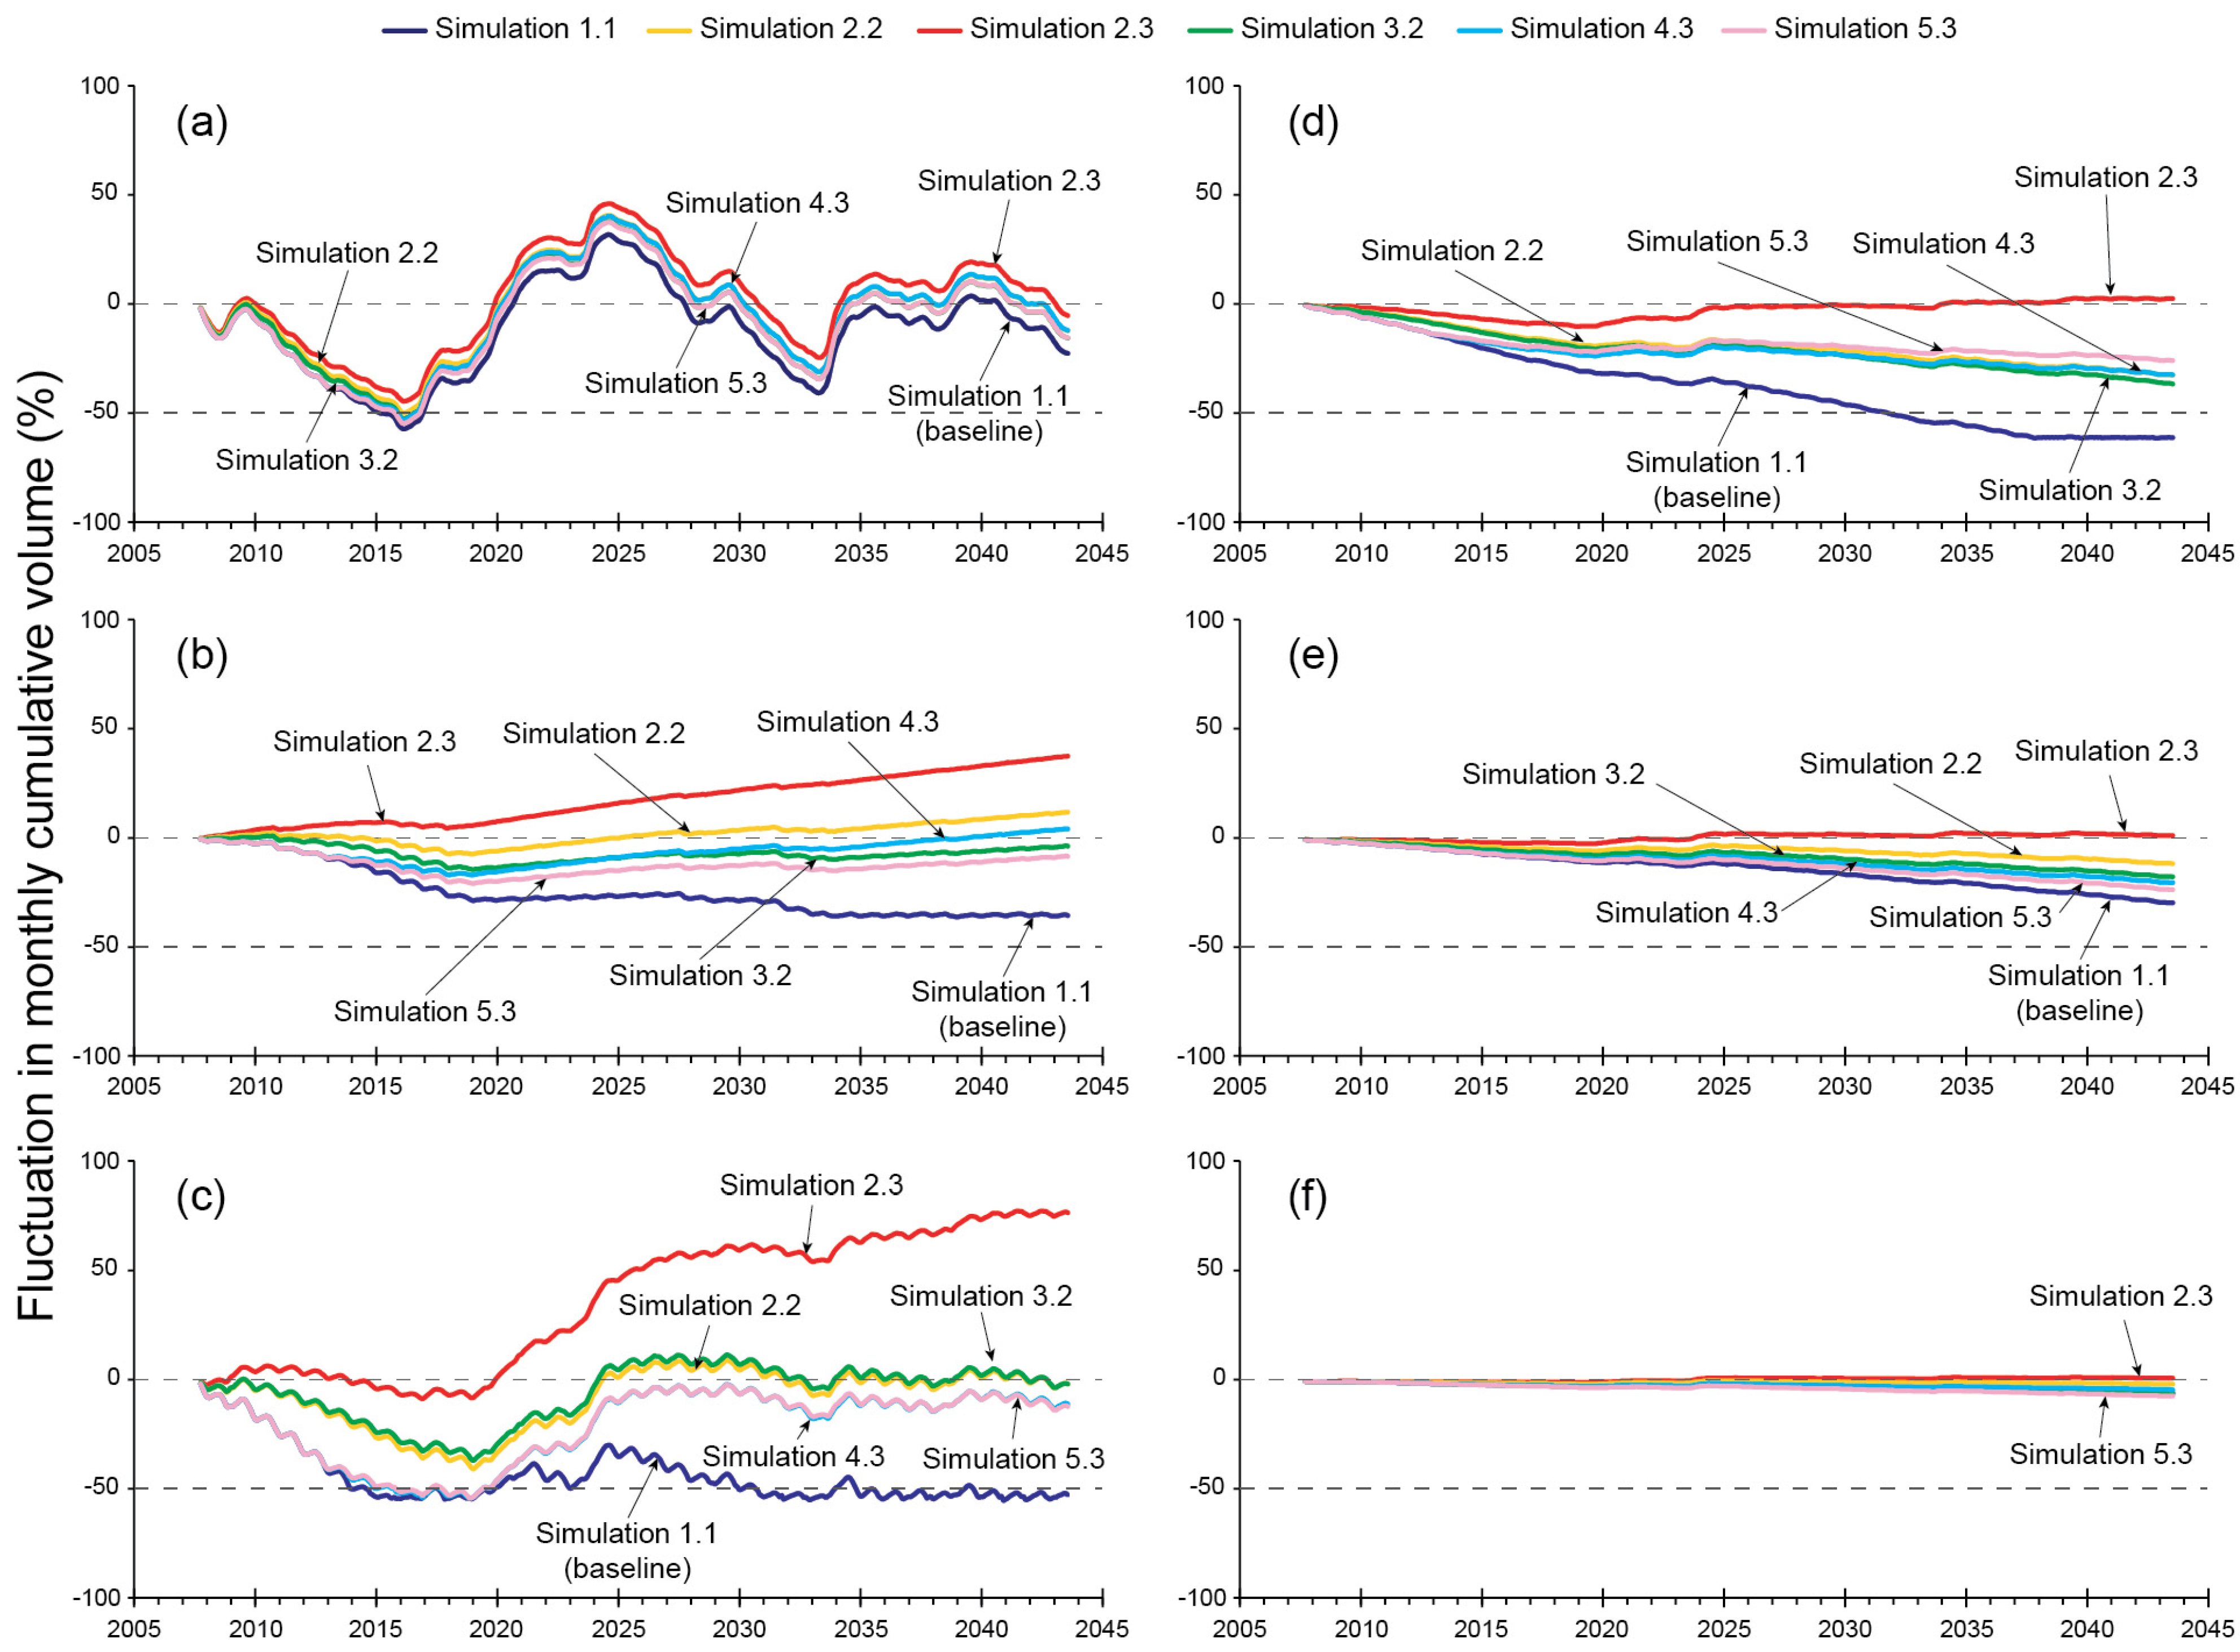
Figure 6 shows the fluctuations in monthly cumulative volume (%) in the administrative sectors for the different scenarios. In the baseline case, the stored volume decreases in all the aquifer sectors. At the end of the simulation, the largest reductions occur in Sectors 3 and 4 (
i.e., around 50% of the initial volume), while no significant fluctuations are predicted for Sector 6, most likely due to a high degree of disconnection from the rest of the aquifer [
23]. The main water demands in the most vulnerable zones of the watershed are agricultural irrigation (Sector 3), and mining industry and human consumption (Sector 4). Therefore, policy makers must work closely with these water users to develop new policies that can reduce the risk of water shortage while maintaining their production levels. The decrease in stored volume is also relevant in Sector 2, in which water is mainly used for agricultural irrigation. Sector 5, which uses most of its waters for agricultural purposes, has a reduction in stored volume that is approximately half that observed in Sector 4. Major fluctuations are simulated in Sector 1, which are explained by the sensitivity of this Sector to meteorological conditions. For instance, the conditions observed between years 2030 and 2033 correspond to a hydrological drought, which results in a decrease in the water volume stored in the aquifer. In Sector 1, there is only a small amount of groundwater flow granted (~0.72 m
3/s, as shown in
Table 1). Thus, variations in this sector due to anthropogenic causes are not expected.
Figure 5.
Cumulative aquifer storage volume for different scenarios. The reference (null) volume corresponds to 1974. (a) Scenario 2; (b) Scenario 3; (c) Scenario 4; (d) Scenario 5.
Figure 5.
Cumulative aquifer storage volume for different scenarios. The reference (null) volume corresponds to 1974. (a) Scenario 2; (b) Scenario 3; (c) Scenario 4; (d) Scenario 5.
The following scenarios (2–5) were defined to study different strategies that may help to alleviate this water crisis. These scenarios were defined in conjunction with the Water Agency to analyze the choices that stakeholders and water managers have to reduce risk of water shortage and to adapt to face the future water resource availability.
Scenario 2 was defined to analyze the effect of reducing uniformly all the water demands within the basin in 20%, 30% and 50%.
Figure 5(a) shows that larger reductions in the water demand yield larger volumes stored in the aquifer. For instance, a 50% uniform reduction of water demands (Simulation 2.3) results in a stored volume similar to that of the initial aquifer volume. In addition, Simulation 2.3 shows that there could be more water available in the different aquifer sectors within the basin (
Figure 6). In particular, stored water in Sectors 2 and 3 significantly exceed the baseline scenario volumes. Note however that a 50% reduction in water demand throughout the entire basin is very unlikely given increasing economic activities and population growth. A more reasonable 30% reduction of the present water demand (Simulation 2.2) does not decrease the current aquifer’s volume stored in Sectors 1, 2, 3, and 6 (
Figure 6), while the volume of Sectors 4 and 5 declines without recovery (being Sector 4 the most vulnerable).
Figure 6.
Fluctuations in monthly cumulative volume (%) in the administrative aquifer sectors for different simulations. (a) Aquifer Sector 1; (b) Aquifer Sector 2; (c) Aquifer Sector 3; (d) Aquifer Sector 4; (e) Aquifer Sector 5; (f) Aquifer Sector 6. The reference (null) volume corresponds to 1974.
In Scenario 3, a segmented reduction in agricultural, mining and industry, and potable water use was studied. The details of this reduction are presented in
Table 3. Note that no action was taken in Sector 6 since the baseline scenario showed no significant change in its water volume during the simulation period.
Figure 5b shows that Simulation 3.1 yields larger water volumes stored in the aquifer compared to the baseline scenario. The watershed stored volume, however, still decreases by ~1250 × 10
6 m
3. Simulation 3.2 has a segmented reduction of water demand similar to that of Simulation 3.1, but assumes that water for human consumption cannot be reduced in the future. This situation still delivers better results than the baseline scenario in terms of water stored in the entire aquifer. In terms of stored water in the different sectors (
Figure 6), Simulation 3.2 ranks between Scenarios 1 and 2 for effectiveness in scarcity mitigation, greatly improving upon the baseline situation observed in Sectors 2, 3 and 4. Nevertheless, volumes stored in aquifer Sectors 4 and 5 decrease without recovery.
Scenario 4 studied uniform reduction of water demand and translocation of water between different aquifer sectors. In this scenario and for all its simulations (described in
Table 3), it is assumed that a water management action takes five years to be implemented. Therefore, the current water demand is kept constant through the fifth year of simulation and starting from the sixth year the water demand is reduced by 30% for all uses except for potable water, which is maintained constant. In all of the Scenario 4 simulations, a similar volume of water is observed in the aquifer at the end of the simulation period (
Figure 5c). This suggests that water translocation between sub-catchments may not be the best IWRM choice for this watershed. Even when the results show that groundwater storage of Scenario 4 is higher than that observed in the baseline case, Scenario 2 still is the case that achieves the highest aquifer storage.
Scenario 5 studied IWRM options with segmented reduction of water demand and translocation of water between different aquifer sectors (the description of each simulation is presented in
Table 3). This scenario also considers that water management actions take five years to be implemented. Thus, starting from the sixth year, a segmented reduction in all water uses except potable water is analyzed. As shown in
Figure 5d, Simulation 5.1 results in the largest water volume in the aquifer but still show a decreasing trend. In terms of water stored in the different aquifer sectors (
Figure 6), Scenario 5 ranks between Scenarios 1 and 2, greatly improving upon the baseline situation observed in Sectors 2, 3 and 4. The volume in Sectors 4 and 5, however, declines without recovery throughout the simulation.
The simulated mean water balance in the entire aquifer shows a recharge of ~4 m3/s and a discharge of ~1.4 m3/s. The difference between recharge and discharge (~2.6 m3/s) constitutes the maximum amount of groundwater that can be sustainably exploited in the valley. Moreover, the average pumping rate is ~2 m3/s for Simulation 2.3, and varies between 3.2 and 4.0 m3/s for the other simulations. Hence, only Simulation 2.3 implies an increase in the average volume stored in the aquifer, and is the only option environmentally sustainable in the long-term.
It is important to recall that the conditions utilized for the simulations assumed stationary historical biophysical conditions, without accounting for the effects of climate change, which is expected to exacerbate current stresses on water resources. For instance, a 10%–30% decrease in runoff is projected over some dry regions at mid-latitudes due to decreases in rainfall and higher rates of evapotranspiration [
39,
40,
41]. Therefore, climate change should have negative impacts on water supply, agriculture, energy production, health, and on other aspects. In the study zone, an increase in the radiative forcing should reduce the availability of water and increase the water demand for irrigation of crops–worsening the results obtained from the IWRM model. Thereby, social and economic development in the region must consider an adaptive capacity to reduce the risk of water shortage. Examples of planned adaptation in the water sector include improvements in [
41]: water storage and conservation techniques, water reuse, desalination, and water-use and irrigation efficiency. These adaptation capacities should be framed within a national water-policy framework, which has to be supported by more advanced IWRM models that consider the effects of climate change more appropriately than the model presented in this work. IWRM will also help to define key constraints (e.g., financial, technological or physical barriers) and opportunities (e.g., synergies with other sectors) of implementing these adaptation capacities.
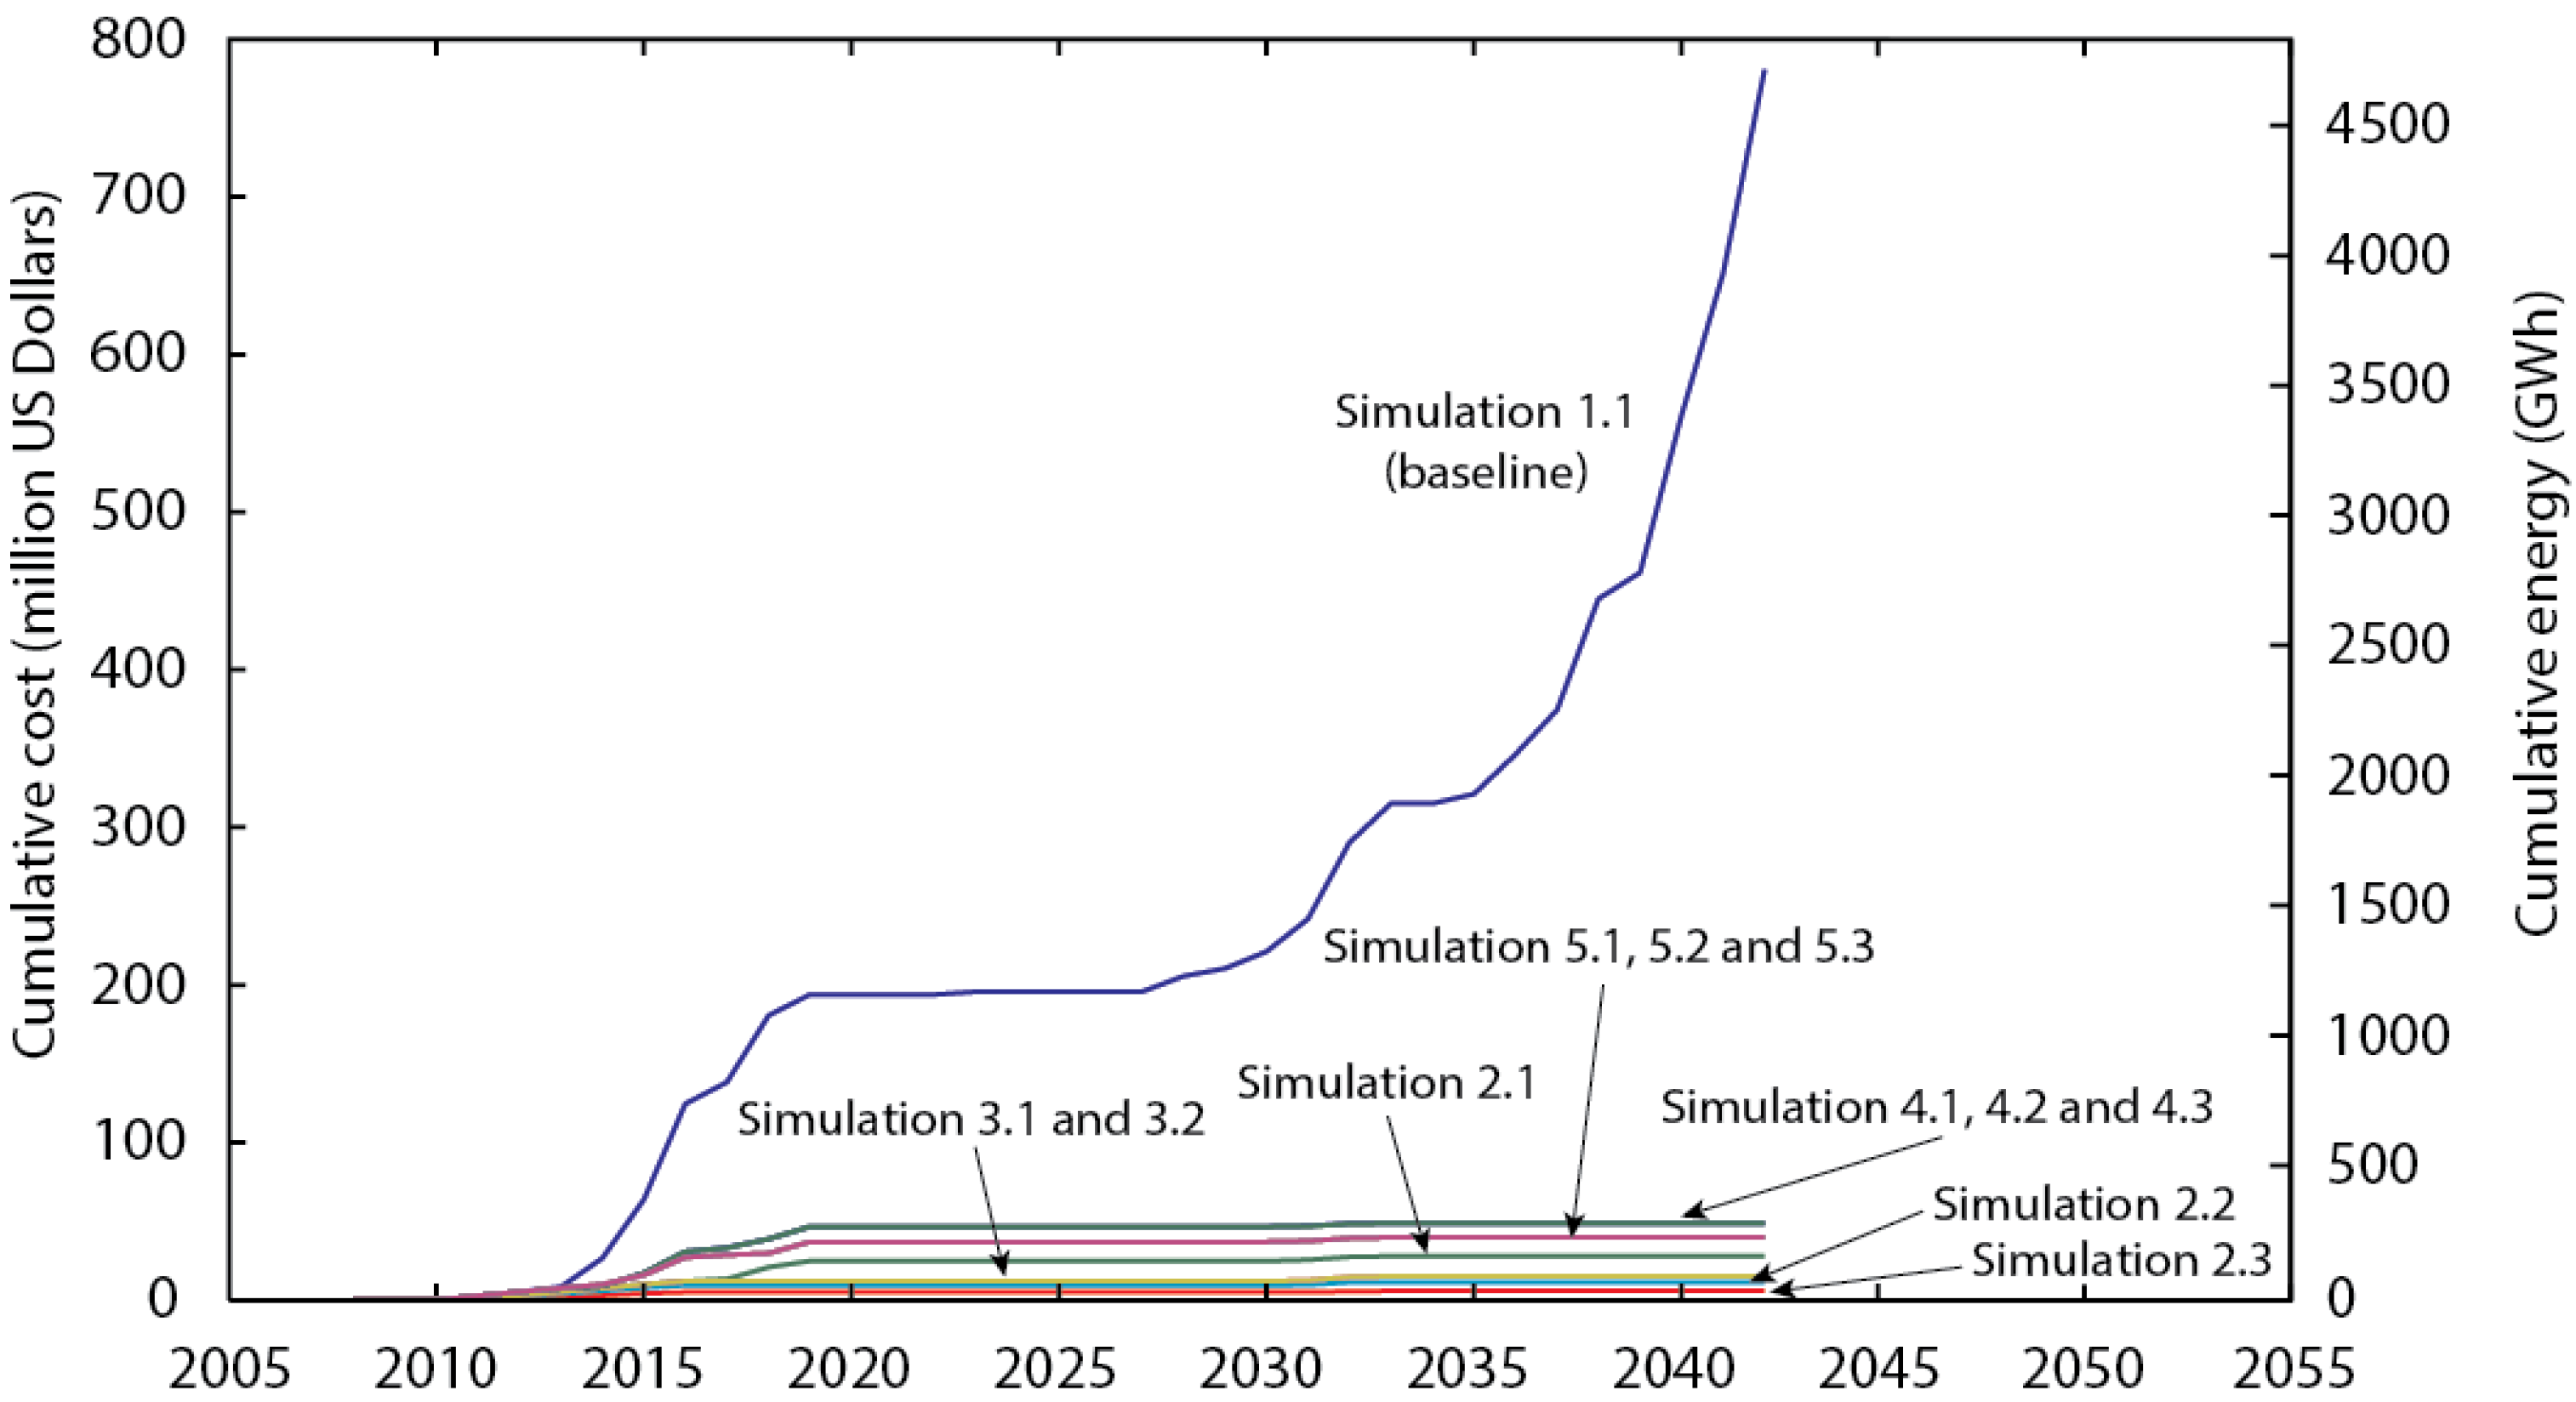
3.5. Impacts of Water Resource Management on Energy Requirements for Water Supply
To address the water-energy nexus at the basin scale, we utilized the results obtained from the IWRM model to investigate how much additional energy is required to eliminate the water deficit. The cumulative costs and energetic requirements for the IWRM scenarios are shown in
Figure 7. It was found that the baseline case (Simulation 1.1) requires a significant input of both energy (which is also associated with an important investment capital) to eliminate the water deficit when compared with any of the water resource management scenarios. In this scenario, almost 60% of the energetic requirements are used to circulate freshwater through the distribution system. Although the total cumulative cost for Scenarios 2–5 rises along with the base scenario until the year 2017 (a drought period), the deficit and thus total cost of not making a management decision (Simulation 1.1) greatly exceeds those of any water management scenario.
Figure 7 also shows that between the years 2010 and 2020 all the water resource management scenarios experience water stress, which results in additional cost and energy requirements. After the year 2035, however, what is seen as a relatively insignificant deficit for water resource management Scenarios 2–5 results in a drastic rise in cost for Simulation 1.1. This drastic increase in cost most likely occurs because the aquifer has reached a critical state from which it cannot recover and that none of the other scenarios reach. The existence of this critical level was also found by DICTUC [
23], and represents a very complex situation in which minor deficits in the potable water wells of the city of Copiapó are significant. Because of the critical state of the aquifer in the baseline scenario of inaction, the aquifer will nearly have been pumped dry and any demand unable to be satisfied by surface water will directly result in a deficit, a quite common situation in the Copiapó river basin. The managed scenarios, however, will have groundwater reserves to mitigate this deficit.
Figure 7.
Costs and energetic requirements associated with an increase in the water supply by reverse osmosis.
Figure 7.
Costs and energetic requirements associated with an increase in the water supply by reverse osmosis.
Table 6 present the energetic requirements and their associated costs estimated at the end of the simulations. These costs are estimated by the Centro de Despacho Económico de Carga (CDEC, The system operator in charge of the coordinating grid operation in Chile) to be ~US$0.166/kWh [
42], and correspond to the marginal production costs of the Termopacífico thermoelectric power plant, the power plant nearest Copiapó. Between the years 2008 and 2042, the baseline scenario has an estimated cost of $781 million US Dollars with energetic requirements on the order of 4702 GWh when 3.8 kWh/m
3 are assumed to be required to drive SWRO. The previous cost results in a volumetric marginal cost of ~$1.48/m
3 that includes both the energy required to pump the fluids and to drive SWRO. A sensitivity analysis considering rates of 3 and 7 kWh/m
3 for SWRO desalination lead to energetic requirements of 4280 GWh and 6391 GWh, respectively; and associated fuel costs of US$710 million ($1.35/m
3) and US$1,061 million ($2.01/m
3), respectively. The estimated range of the total water cost is within the range of reported SWRO desalination plants [
38,
43]. On the other hand, the water resource management scenarios significantly reduce these costs and energetic needs. Cost reductions of more than 90% are observed in all water resource scenarios. Overall, any of the water resource management scenarios studied here are significantly more economic than the option of inaction (Simulation 1.1). Note that we are only comparing the relative cost of covering water deficits associated with different management actions, but we are not comparing the costs of implementing these actions, which may be higher due to investment and social costs.
Table 6.
Energetic requirements and corresponding costs for each IWRM scenario.
Table 6.
Energetic requirements and corresponding costs for each IWRM scenario.
| Scenario | Simulation | Energy for SWRO (GWh) * | Total Energy Required (GWh) * | Cost ($ Million US Dollars) ** |
|---|
| 1. Current status. | 1.1 | 2006 (1584–3695) | 4702 (4280–6391) | 781 (710–1061) |
| 2. Uniform reduction of water demand. | 2.1 | 122 (97–225) | 168 (143–271) | 28 (24–45) |
| 2.2 | 52 (41–95) | 70 (59–114) | 12 (10–19) |
| 2.3 | 26 (20–48) | 35 (30–57) | 6 (5–9) |
| 3. Segmented reduction of water demand. | 3.1 | 67 (53–123) | 91 (77–147) | 15 (13–24) |
| 3.2 | 67 (53–123) | 91 (77–147) | 15 (13–24) |
| 4. Water resource management with uniform reduction of water demand and translocation of water between aquifer zones. | 4.1 | 207 (163–381) | 294 (250–468) | 49 (42–78) |
| 4.2 | 207 (164–382) | 294 (250–468) | 49 (42–78) |
| 4.3 | 207 (163–381) | 294 (250–468) | 49 (42–78) |
| 5. Water resource management with segmented reduction of water demand and translocation of water between aquifer zones. | 5.1 | 171 (135–316) | 241 (205–385) | 40 (34–64) |
| 5.2 | 171 (135–316) | 241 (205–385) | 40 (34–64) |
| 5.3 | 171 (135–316) | 241 (205–385) | 40 (34–64) |
To integrate the energy and water cycles it is also important to quantify the water footprint of energy production and conversion, defined as the amount of water consumed to produce a unit of energy [
44]. This footprint has to be measured both in terms of water quantity, water quality, and considering other social, environmental and ecological aspects. Because the influence of energy production and conversion is much more difficult to assess in the latter aspects [
45], here we only provide estimates in terms of water quantity. Lazarova
et al. [
44] and Olsson [
45] provide a summary of water footprint of energy production and conversion for different energy sources. When considering conventional coal combustion, the water footprint values range from ~1 to 3 L/kWh. Using this range and the previous energetic requirements at the end of the simulations, we estimated that the water footprint should range from 0.1 × 10
6 to 1.4 × 10
6 m
3. Smaller water requirements were related to Scenario 2, and larger water needs were required for Scenarios 4 and 5, which also are associated with translocation of water between aquifer zones. In Scenarios 4 and 5, the water footprint is on the order of 5% of the water deficit in the basin.
Based purely upon environmental sustainability, reducing water demand by 50% (Simulation 2.3) is the best management case as the aquifer is actually recharged rather than being depleted. Simulation 2.3 is the most economic option when considering the amount of energy input necessary to neutralize the water deficit; however, it is also likely the most costly option in social terms as it would require drastic measures of water reduction by all users. Although this scenario would merely reduce production capacity of the mining sector, reducing half of the water available for irrigation most likely will cause the withering of crops and completely eliminate the agricultural economy. A much more likely possibility would be reducing water demand by 20% or 30% (Simulations 2.1 or 2.2), values seen in practice through technological advancement in water reuse and recycling [
37]. Hence, future studies should explicitly address the feasibility of water reuse and recycling to achieve more sustainable levels of water demand.
Conventional fossil fuel combustion, however, should not be the only energy source considered to reduce the water deficit within the basin. If an IWRM scheme is to be sustainable, it must use renewable energy sources to increase the amount of available water. Being that Copiapó is located in one of the driest deserts on Earth at near-tropic latitude, with solar radiation levels on the order of 2350 kWh/m
2 per year [
46], solar energy is a promising renewable energy source that could be used to reduce the water deficit in the basin. Using the average yearly radiation, assuming typical photovoltaic solar panel efficiencies to generate electricity [
46], and considering the energy required to increase the amount of available water in the basin, we estimated the required area of solar panels to provide the energy necessary to completely eliminate the water deficit. The base scenario (Simulation 1.1) would require on the order of 200 ha of solar panels whereas the IWRM scenarios would require less than ~10 ha. In terms of water footprint, a photovoltaic power plant requires on the order of 0.1 L/kWh for array washing and potable water needs [
47]. This water footprint is much smaller than that estimated for conventional coal combustion, which is on the order of 1–3 L/kWh [
44,
45]. Although a more detailed economic and scientific analysis would be required before the feasibility of a project of this scale may be assessed, an order-of-magnitude estimate of renewable energy sources coupled with sustainable management decisions offers reason to believe in the benefits of water recycling and supply powered by solar energy, and calls for further exploration. The implementation of this type of projects has to be framed within national water and energy policies, which have to encourage use of new technologies and of alternative energy sources supported by an IWRM. These policies will allow following a more sustainable approach for water and energy use in basins where multiple users face intense competition for limited freshwater resources for socio-economical activities.

 ,
, 


