
An Unstructured Numerical Model to Study Wind-Driven Circulation Patterns in a Managed Coastal Mediterranean Wetland: The Vaccarès Lagoon System

Abstract
:1. Introduction

2. Materials and Methods
2.1. Monitoring Data
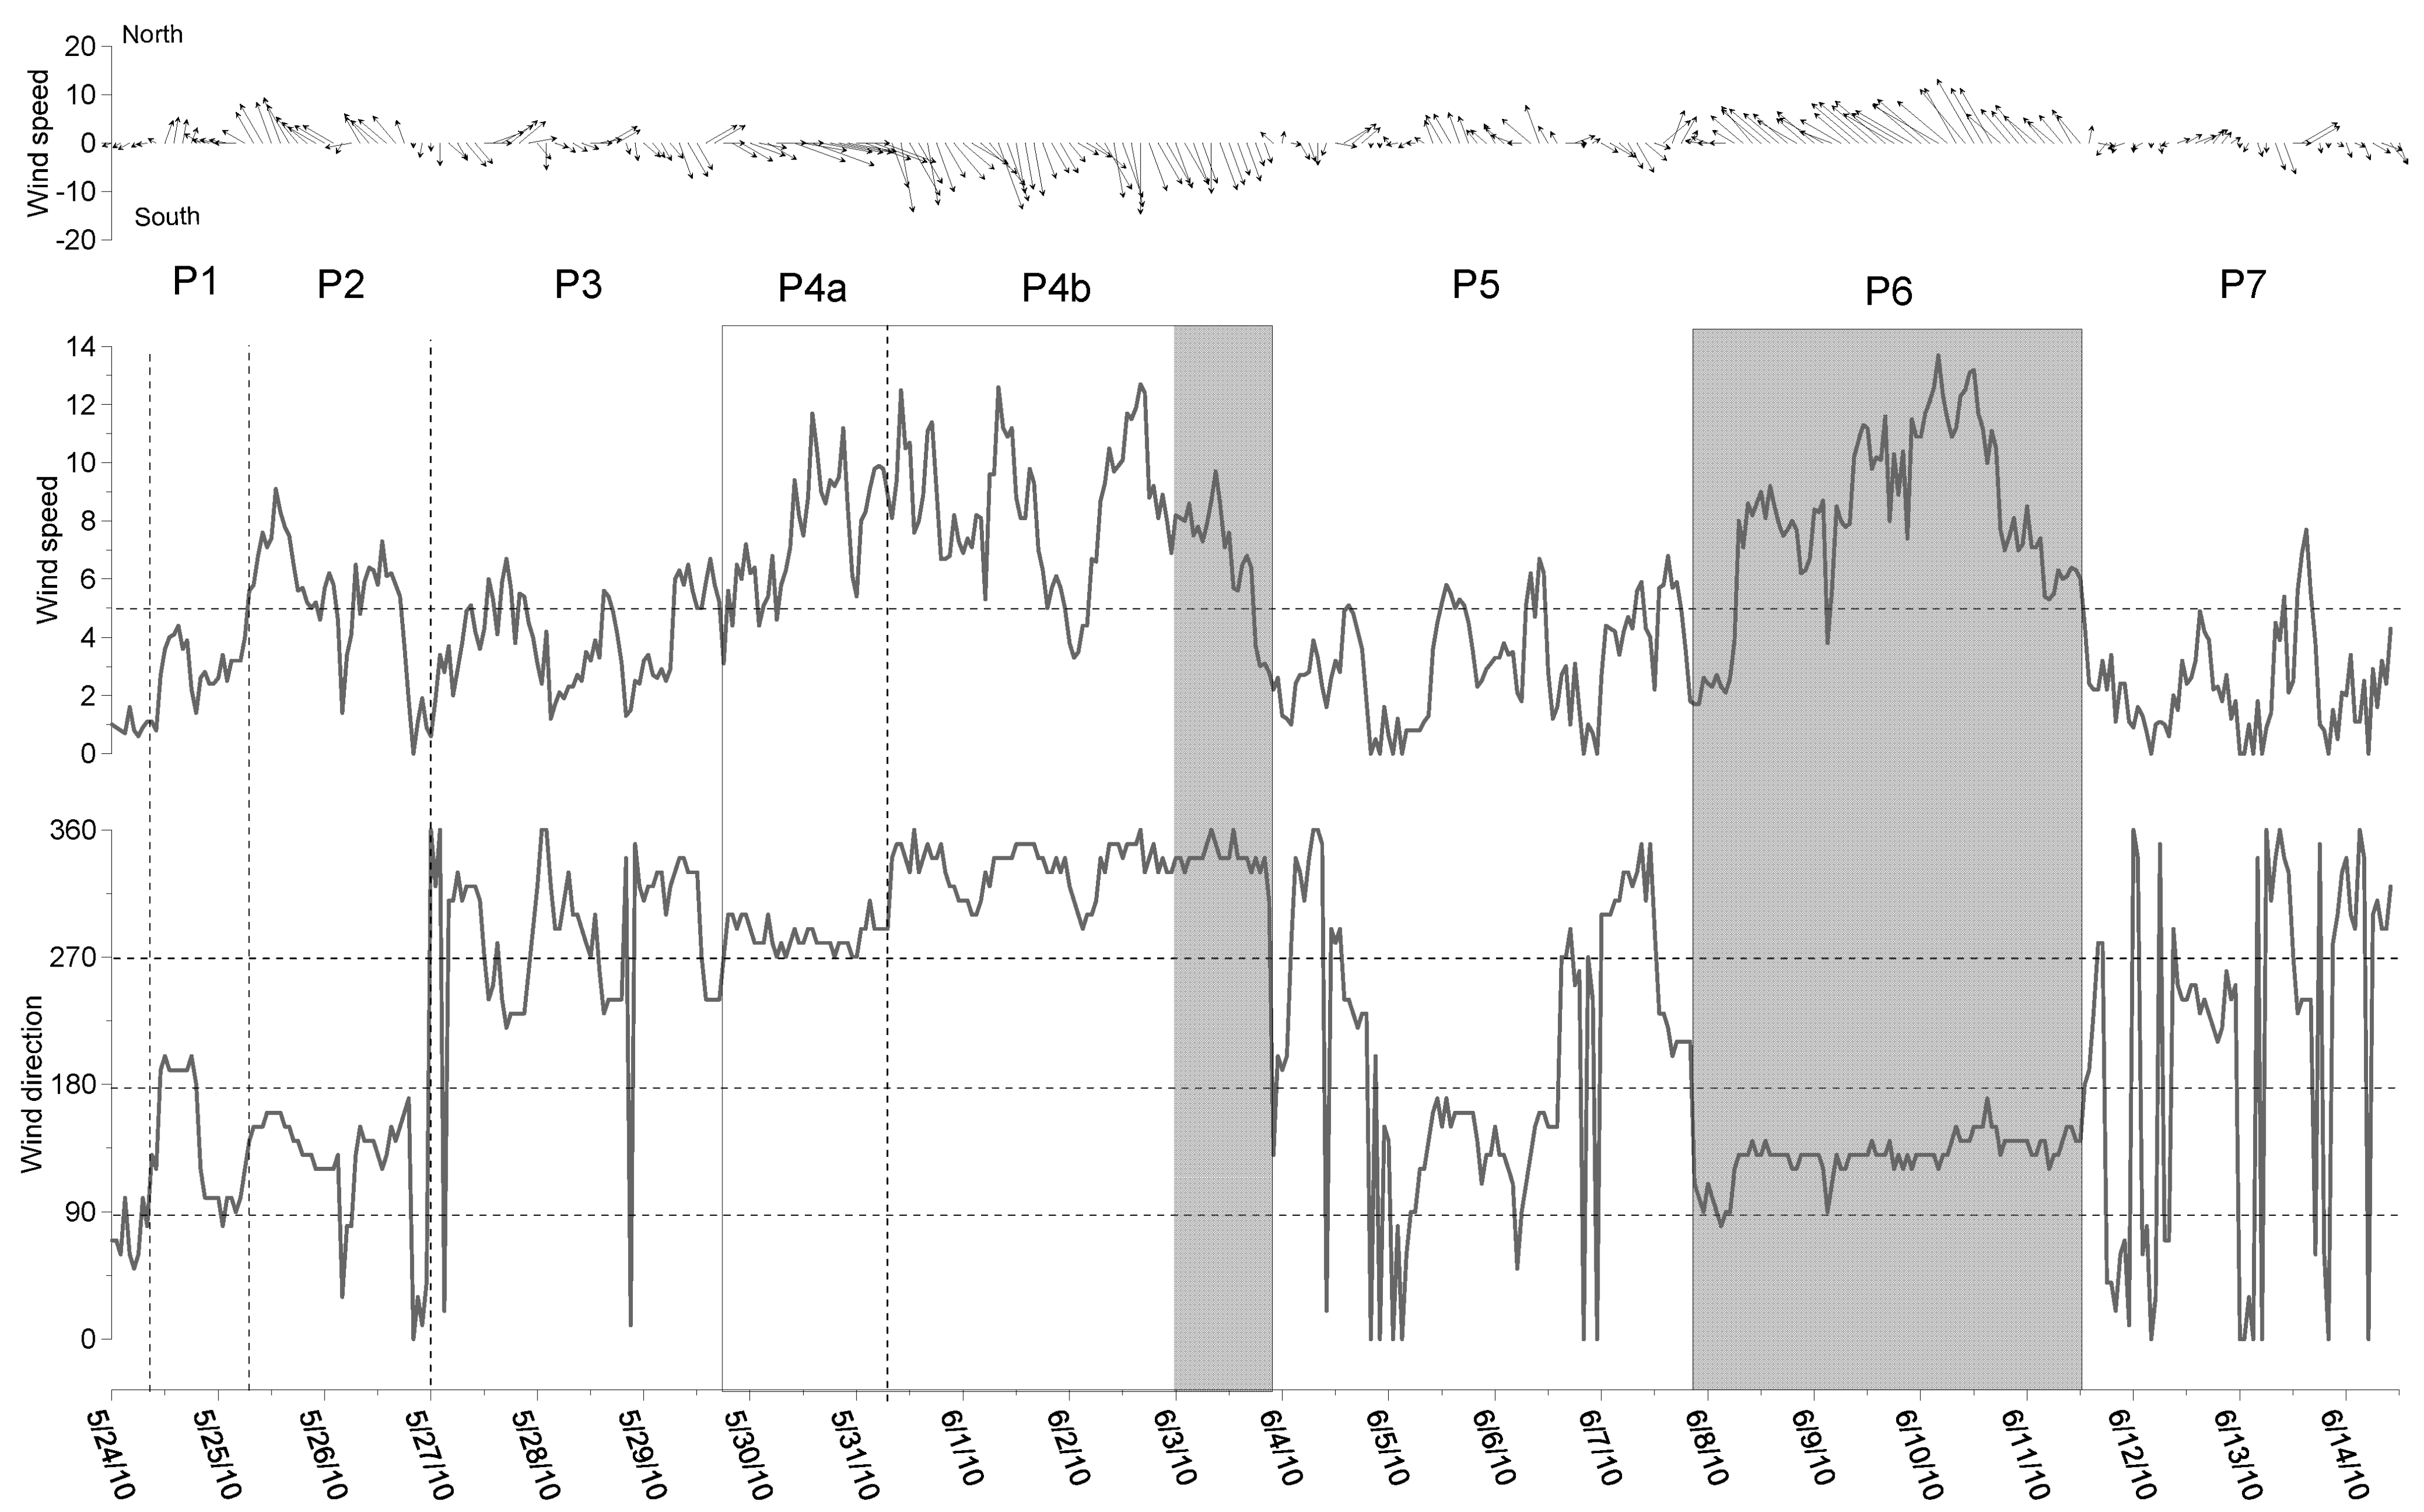
2.1.1. Hydro-Meteorological Data
2.1.2. Water Levels


2.1.3. Flow Data
2.1.4. Bathymetry
2.2. The Numerical Model
2.2.1. General Overview of the Model
2.2.2. Mesh and Altitude
2.2.3. Bed Friction

2.2.4. Boundary and Initial Conditions
2.2.5. Rainfall and Evaporation
2.2.6. Wind
2.2.7. Areas Alternately Dry and Wet
3. Results
3.1. Calibration


| Location | MAE (m) | RMSE (m) | NRMSE (%) | d |
|---|---|---|---|---|
| Location 1 | 0.01 | 0.02 | 3 | 0.96 |
| Location 2 | 0.01 | 0.02 | 2 | 0.90 |
| Location 3 | 0.03 | 0.04 | 18 | 0.94 |
| Location 4 | 0.02 | 0.02 | 7 | 0.95 |
| Location 6 | 0.02 | 0.02 | 10 | 0.96 |
| Location 7 | 0.02 | 0.02 | 6 | 0.99 |
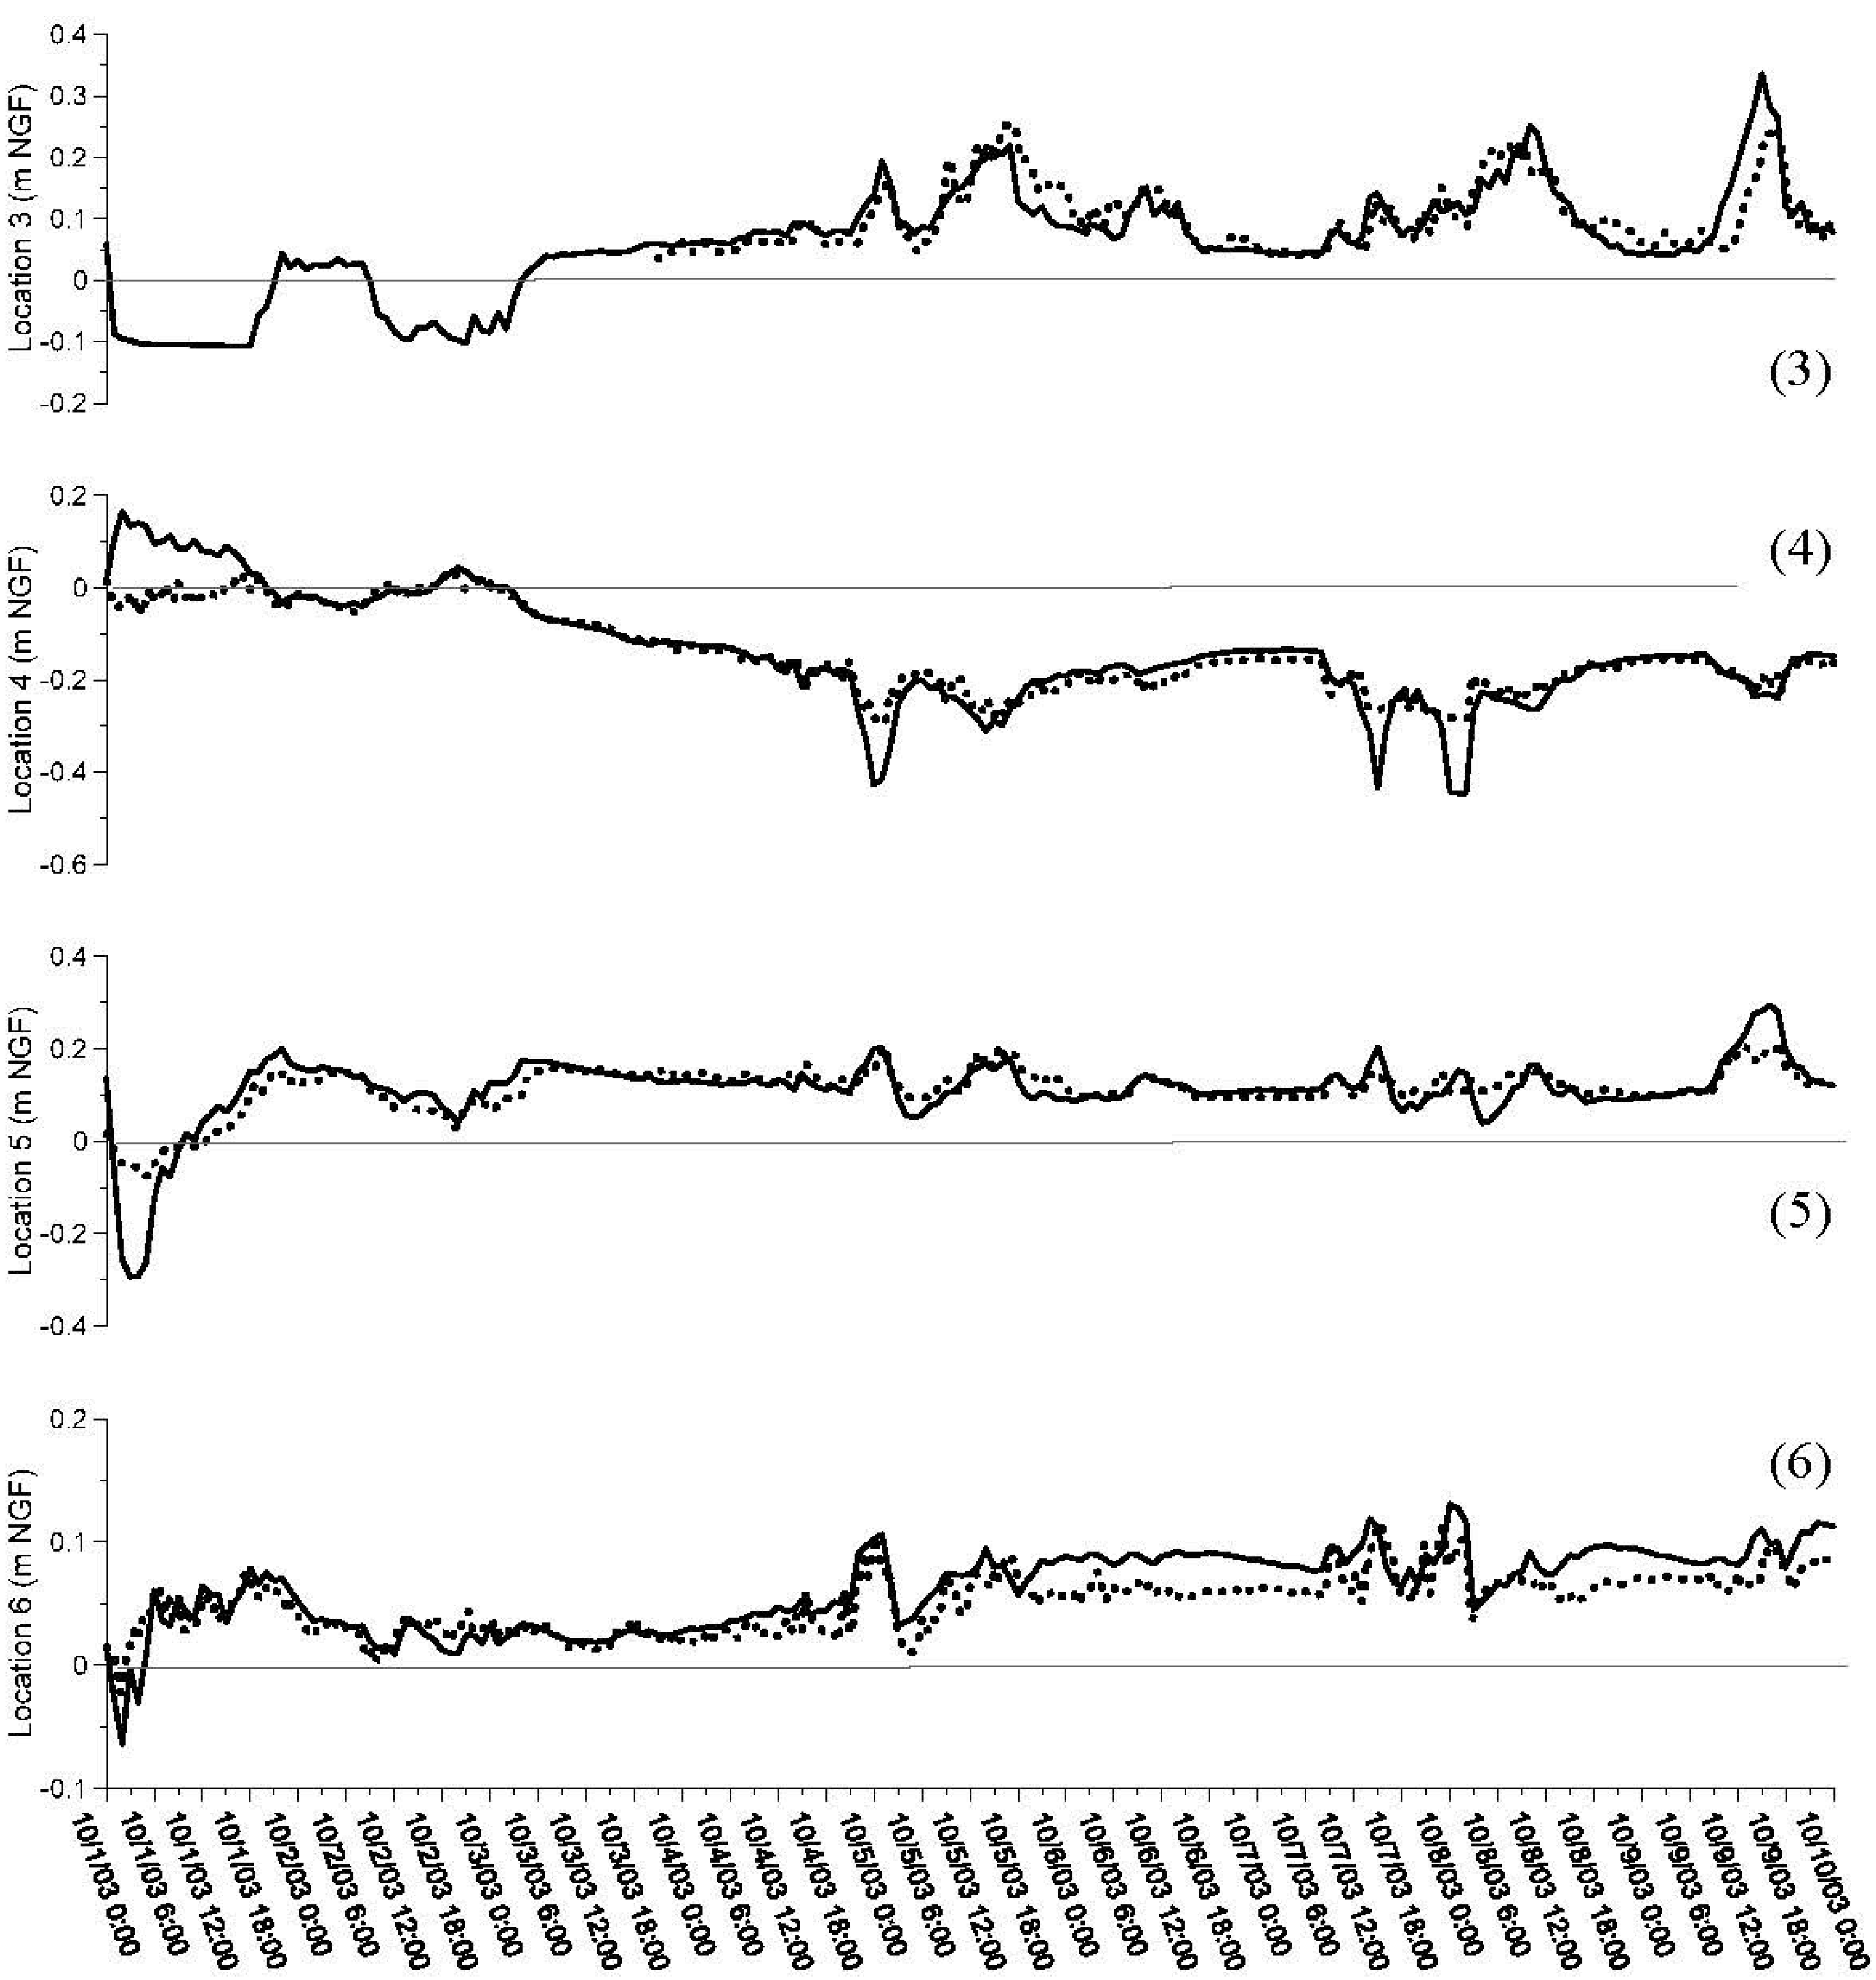
3.2. Validation

3.2.1. Run 2: 1 October 2003–10 October 2003


| Location | MAE (m) | RMSE (m) | NRMSE (%) | d |
|---|---|---|---|---|
| Location 1 | 0.03 | 0.03 | 6 | 0.94 |
| Location 2 | 0.01 | 0.02 | 3 | 0.95 |
| Location 3 | 0.02 | 0.03 | 15 | 0.88 |
| Location 4 | 0.03 | 0.05 | 34 | 0.94 |
| Location 5 | 0.03 | 0.04 | 9 | 0.86 |
| Location 6 | 0.02 | 0.02 | 10 | 0.86 |
3.2.2. Run 3: 14 December 2003–18 December 2003
3.2.3. Conclusions for Model Validation

| Location | MAE (m) | RMSE (m) | NRMSE (%) | d |
|---|---|---|---|---|
| Location 1 | 0.02 | 0.03 | 3 | 0.89 |
| Location 2 | 0.02 | 0.03 | 3 | 0.90 |
| Location 3 | 0.02 | 0.03 | 5 | 0.96 |
| Location 4 | 0.02 | 0.02 | 4 | 0.87 |
| Location 5 | 0.02 | 0.03 | 3 | 0.91 |
| Location 6 | 0.01 | 0.02 | 3 | 0.96 |
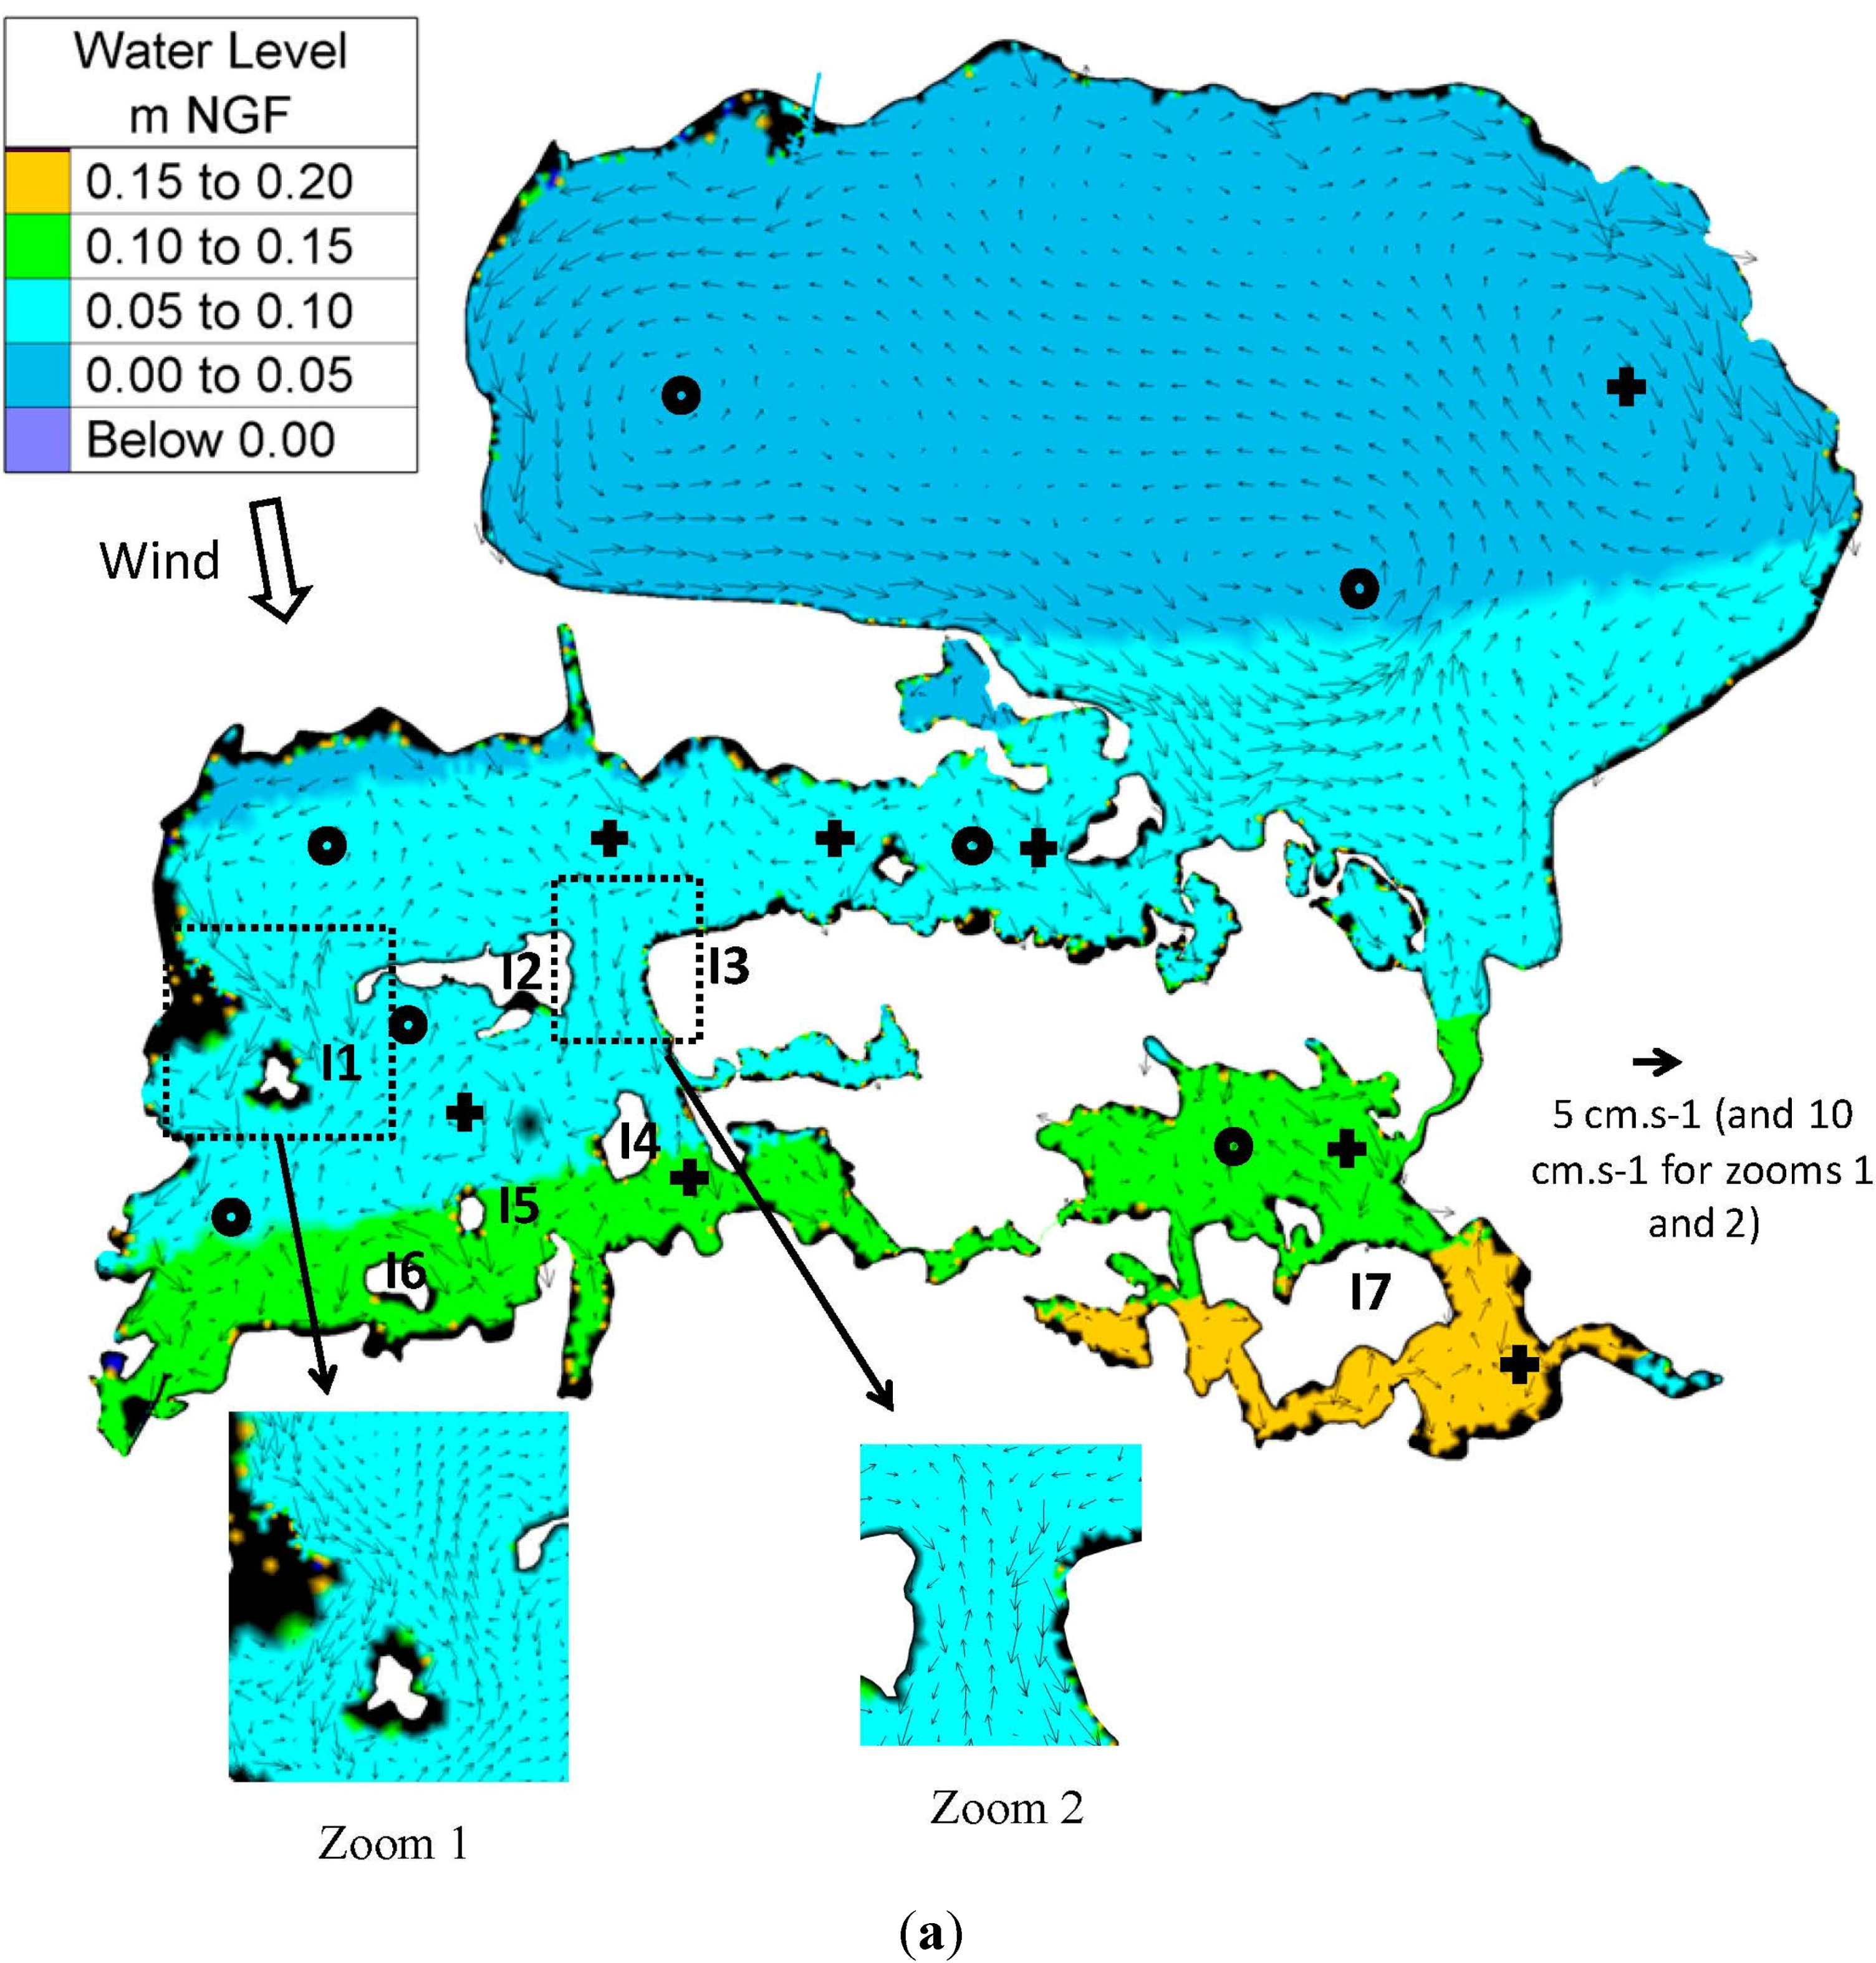
3.3. Steady State Circulation Patterns and Water Levels


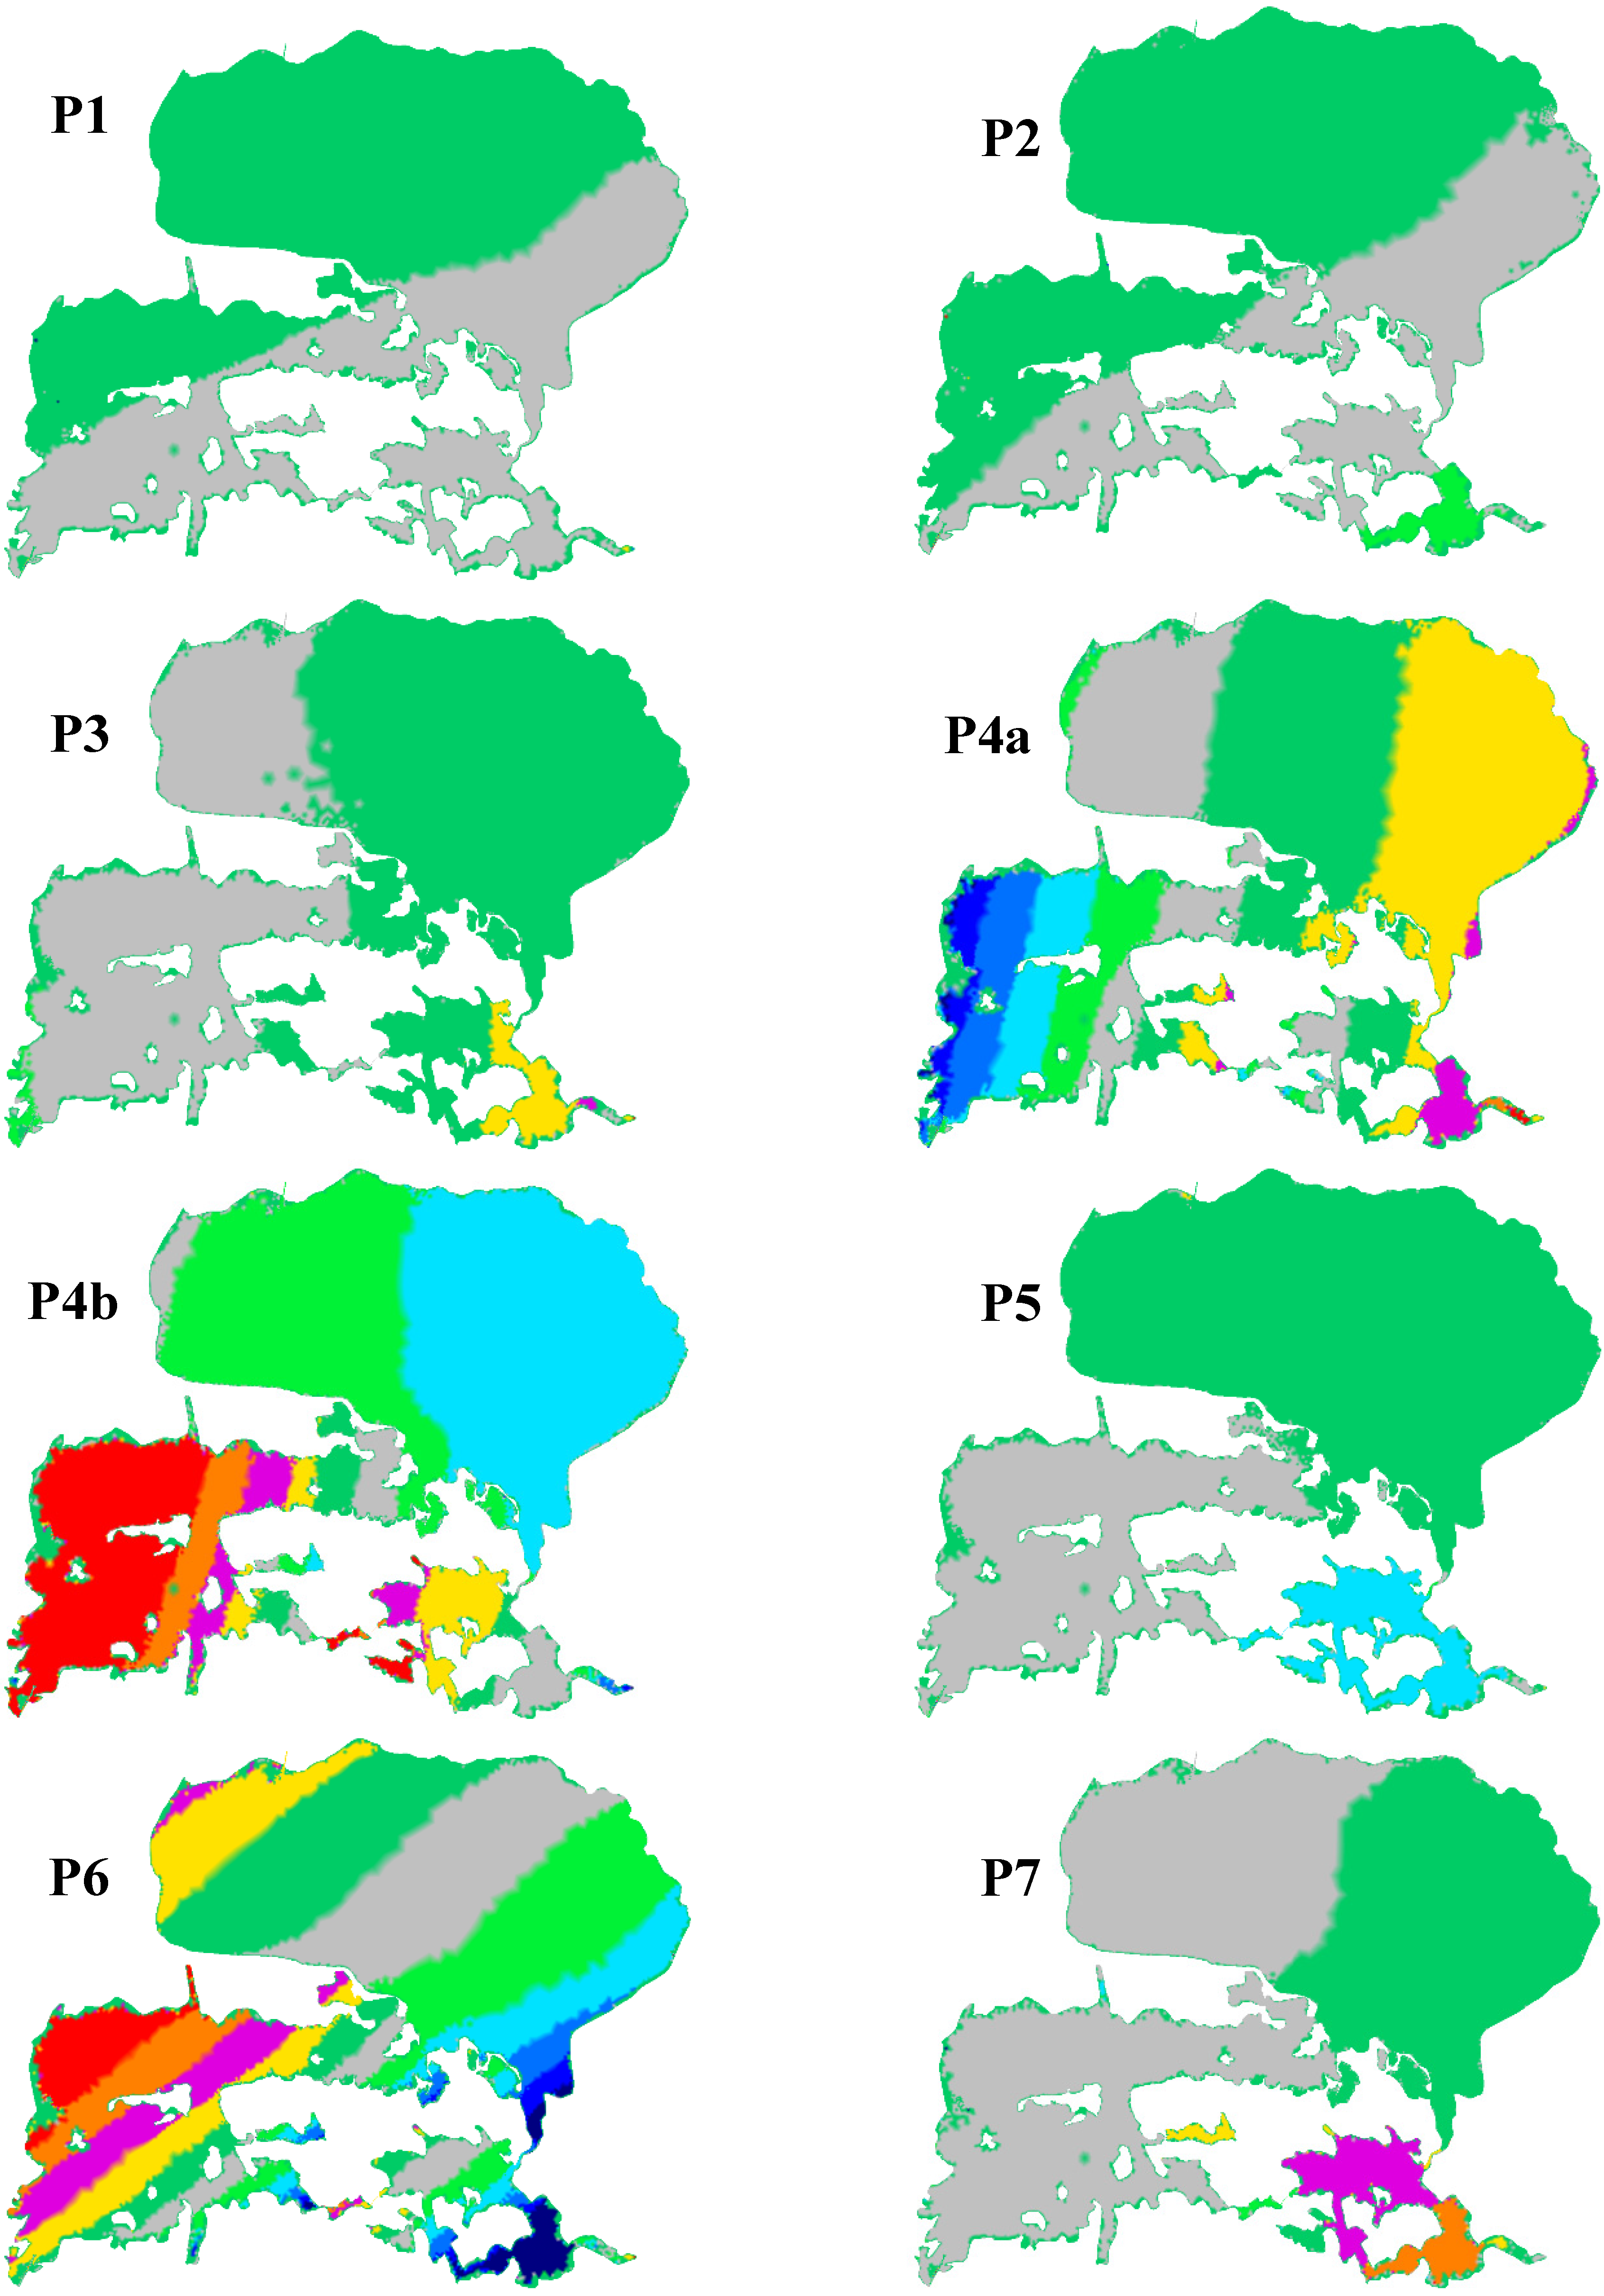
3.4. Unsteady Circulation Patterns/Water Levels Variations and Volume Exchanges between the Different Lagoons


4. Discussion
5. Conclusions
Supplementary Files
Supplementary File 1Acknowledgments
Author Contributions
Conflicts of Interest
References
- Scott, D.; Rose, P.M. Atlas of Anatidae Populations in Africa and Western Eurasia; Wetlands International Publication; Wetlands International: Wageningen, the Netherlands, 1996; Volume 41. [Google Scholar]
- Chauvelon, P.; Tournoud, M.-G.; Sandoz, A. Integrated hydrological modelling of a managed coastal Mediterranean wetland (Rhone delta, France): Initial calibration. Hydrol. Earth Syst. Sci. Discuss. 2003, 7, 123–132. [Google Scholar] [CrossRef]
- Chiron, S.; Comoretto, L.; Rinaldi, E.; Maurino, V.; Minero, C.; Vione, D. Pesticide by-products in the Rhône delta (Southern France). The case of 4-chloro-2-methylphenol and of its nitroderivative. Chemosphere 2009, 74, 599–604. [Google Scholar] [PubMed]
- Comoretto, L.; Arfib, B.; Talva, R.; Chauvelon, P.; Pichaud, M.; Chiron, S.; Höhener, P. Runoff of pesticides from rice fields in the Ile de Camargue (Rhône river delta, France): Field study and modeling. Environ. Pollut. 2008, 151, 486–493. [Google Scholar] [CrossRef] [PubMed]
- Comoretto, L.; Arfib, B.; Chiron, S. Pesticides in the Rhône river delta (France): Basic data for a field-based exposure assessment. Sci. Total Environ. 2007, 380, 124–132. [Google Scholar] [CrossRef] [PubMed]
- Crivelli, A.J.; Auphan, N.; Chauvelon, P.; Sandoz, A.; Menella, J.-Y.; Poizat, G. Glass eel recruitment, Anguilla anguilla (L.), in a Mediterranean lagoon assessed by a glass eel trap: Factors explaining the catches. Hydrobiologia 2008, 602, 79–86. [Google Scholar] [CrossRef]
- Poizat, G.; Rosecchi, E.; Chauvelon, P.; Contournet, L.; Crivelli, A. Long-term fish and macro-crustacean community variation in a Mediterranean lagoon. Estuar. Coast. Shelf Sci. 2004, 59, 615–624. [Google Scholar] [CrossRef]
- Service hydrographique et océanographique de la marine (SHOM). Ouvrage de marée, références altimétriques maritimes. Ports de France métropolitaine et d'outre-mer. Cotes du zéro hydrographique et niveaux caractéristiques de la marée; SHOM: Brest, France, 2011. [Google Scholar]
- Chauvelon, P. A wetland managed for agriculture as an interface between the Rhône river and the Vaccares lagoon (Camargue, France): Transfers of water and nutrients. Hydrobiologia 1998, 373/374, 181–191. [Google Scholar] [CrossRef]
- Loubet, A. Modélisation de l’Hydrosystème Vaccarès: Contribution à une Gestion Adaptative des Ressources en eau Dans le Delta du Rhône, France; Aix-Marseille University: Marseille, France, 2012. [Google Scholar]
- Millet, B.; Robert, C.; Grillas, P.; Coughlan, C.; Banas, D. Numerical modelling of vertical suspended solids concentrations and irradiance in a turbid shallow system (Vaccares, Se France). Hydrobiologia 2010, 638, 161–179. [Google Scholar] [CrossRef] [Green Version]
- Banas, D.; Grillas, P.; Auby, I.; Lescuyer, F.; Coulet, E.; Moreteau, J.C.; Millet, B. Short time scale changes in underwater irradiance in a wind-exposed lagoon (Vaccarès lagoon, France): Efficiency of infrequent field measurements of water turbidity or weather data to predict irradiance in the water column. Hydrobiologia 2005, 551, 3–16. [Google Scholar] [CrossRef]
- Hervouet, J.-M. TELEMAC modelling system: An overview. Hydrol. Process. 2000, 14, 2209–2210. [Google Scholar] [CrossRef]
- Open TELEMAC-MASCARET, the mathematically superior suite of solvers. Available online: http://www.opentelemac.org (accessed on 15 June 2015).
- Dias, J.M.; Lopes, J.F. Implementation and assessment of hydrodynamic, salt and heat transport models: The case of Ria de Aveiro Lagoon. Environ. Model. Softw. 2006, 21, 1–15. (In Portugal) [Google Scholar] [CrossRef]
- Ferrarin, C.; Umgiesser, G. Hydrodynamic modeling of a coastal lagoon: The Cabras lagoon in Sardinia, Italy. Ecol. Model. 2005, 188, 340–357. [Google Scholar] [CrossRef]
- Schoen, J.H.; Stretch, D.D.; Tirok, K. Wind-driven circulation patterns in a shallow estuarine lake: St Lucia, South Africa. Estuar. Coast. Shelf Sci. 2014, 146, 49–59. [Google Scholar] [CrossRef]
- Umgiesser, G.; Canu, D.M.; Cucco, A.; Solidoro, C. A finite element model for the Venice Lagoon. Development, set up, calibration and validation. J. Mar. Syst. 2004, 51, 123–145. [Google Scholar] [CrossRef]
- Zacharias, I.; Gianni, A. Hydrodynamic and dispersion modeling as a tool for restoration of coastal ecosystems. Application to a re-flooded lagoon. Environ. Model. Softw. 2008, 23, 751–767. [Google Scholar] [CrossRef]
- Hervouet, J.-M. Hydrodynamics of Free Surface Flows: Modelling with the Finite Element Method; John Wiley & Sons: Hoboken, NJ, USA, 2007. [Google Scholar]
- Saad, Y.; Schultz, M. GMRES: A Generalized minimal residual algorithm for solving nonsymmetric linear systems. SIAM J. Sci. Stat. Comput. 1986, 7, 856–869. [Google Scholar] [CrossRef]
- Smagorinsky, J. General circulation experiments with the primitive equations. Mon. Weather Rev. 1963, 91, 99–164. [Google Scholar] [CrossRef]
- Coulomb, A. Le marégraphe de Marseille: Patrimoine et modernité. XYZ 2009, 118, 17–24. [Google Scholar]
- Guéry, R.; Pirazzoli, P.; Trousset, P. Les variations du niveau de la mer depuis l’antiquité à Marseille et à La Couronne. Doss. Hist. Archéol. 1981, 50, 8–17. [Google Scholar]
- Charpentier, A.; Grillas, P.; Lescuyer, F.; Coulet, E.; Auby, I. Spatio-temporal dynamics of a Zostera noltii dominated community over a period of fluctuating salinity in a shallow lagoon, Southern France. Estuar. Coast. Shelf Sci. 2005, 64, 307–315. [Google Scholar] [CrossRef]
- Chérain, Y. Le suivi de l’herbier de zostères de l’étang du Vaccarès: Evolutions méthodologiques et résultats. Courr. Nat. 2014, 282, 28–33. [Google Scholar]
- Penman, H.L. Natural evaporation from open water, bare soil and grass. Proc. R. Soc. Lond. Ser. Math. Phys. Sci. 1948, 193, 120–145. [Google Scholar] [CrossRef]
- Smith, S.D.; Banke, E.G. Variation of the sea surface drag coefficient with wind speed. Q.J. R. Meteorol. Soc. 1975, 101, 665–673. [Google Scholar] [CrossRef]
- Liu, W.-C.; Hsu, M.-H.; Kuo, A.Y. Three-dimensional hydrodynamic and salinity transport modelling of Danshuei River estuarine system and adjacent coastal sea, Taiwan. Hydrol. Process. 2007, 21, 3057–3071. [Google Scholar] [CrossRef]
- Patro, S.; Chatterjee, C.; Singh, R.; Raghuwanshi, N.S. Hydrodynamic modelling of a large flood-prone river system in India with limited data. Hydrol. Process. 2009, 23, 2774–2791. [Google Scholar] [CrossRef]
- Csanady, G.T. Wind-induced barotropic motions in long lakes. J. Phys. Oceanogr. 1973, 3, 429–438. [Google Scholar] [CrossRef]
- Kranenburg, C. Wind-driven chaotic advection in a shallow model lake. J. Hydraul. Res. 1992, 30, 29–46. [Google Scholar] [CrossRef]
- Liang, Q.; Borthwick, A.G.L.; Taylor, P.H. Wind-induced chaotic advection in shallow flow geometries. Part I: Circular basins. J. Hydraul. Res. 2006, 44, 170–179. [Google Scholar] [CrossRef]
- Liang, Q.; Borthwick, A.G.L.; Taylor, P.H. Wind-induced chaotic advection in shallow flow geometries. Part II: Non-circular basins. J. Hydraul. Res. 2006, 44, 180–188. [Google Scholar] [CrossRef]
- De Pascalis, F.; Pérez-Ruzafa, A.; Gilabert, J.; Marcos, C.; Umgiesser, G. Climate change response of the Mar Menor coastal lagoon (Spain) using a hydrodynamic finite element model. Estuar. Coast. Shelf Sci. 2012, 114, 118–129. [Google Scholar] [CrossRef]
- Hilmi, K. Modélisation Numérique de la Circulation de Deux Milieux Paraliques du Littoral Marocain: La Lagune de Oualidia (Atlantique) et la Lagune de Nador (Méditerranée); Faculté des Sciences de Ben M’Sick: Casablanca, Maroc, 2005. [Google Scholar]
- Karim Bloundi, M.; Faure, P.; Duplay, J. Organic contamination identification in sediments from a Mediterranean coastal ecosystem: The case of the Nador lagoon (Eastern Morocco). Comptes Rendus Geosci. 2008, 340, 840–849. [Google Scholar] [CrossRef]
- Umgiesser, G.; Chao, J.; Bajo, M.; Scroccaro, I.; Cucco, A. Residence time modelling in the Nador Lagoon, Morocco. In Proceedings of the First International Conference on Coastal Conservation and Management in the Atlantic and Mediterranean (ICCCM05), Tavira, Portugal, 17–20 April 2005; das Neves, L., Sena, A., Ferreira, O., Veloso Gomes, F., Traveira Pinto, F., Eds.; 2005; pp. 389–397. [Google Scholar]
- Ferrarin, C.; Arturas, R.; Saulius, G.; Georg, U.; Lina, B. Hydraulic regime-based zonation scheme of the Curonian Lagoon. Hydrobiologia 2008, 611, 133–146. [Google Scholar] [CrossRef]
- Höhener, P.; Comoretto, L.; al Housari, F.; Chauvelon, P.; Pichaud, M.; Chérain, Y.; Chiron, S. Modeling anthropogenic substances in coastal wetlands: Application to herbicides in the Camargue. Environ. Model. Softw. 2010, 25, 1837–1844. (In France) [Google Scholar] [CrossRef]
- Umgiesser, G.; Ferrarin, C.; Cucco, A.; de Pascalis, F.; Bellafiore, D.; Ghezzo, M.; Bajo, M. Comparative hydrodynamics of 10 Mediterranean lagoons by means of numerical modeling. J. Geophys. Res. Oceans 2014, 119, 2212–2226. [Google Scholar] [CrossRef]
© 2015 by the authors; licensee MDPI, Basel, Switzerland. This article is an open access article distributed under the terms and conditions of the Creative Commons Attribution license (http://creativecommons.org/licenses/by/4.0/).
Share and Cite
Boutron, O.; Bertrand, O.; Fiandrino, A.; Höhener, P.; Sandoz, A.; Chérain, Y.; Coulet, E.; Chauvelon, P. An Unstructured Numerical Model to Study Wind-Driven Circulation Patterns in a Managed Coastal Mediterranean Wetland: The Vaccarès Lagoon System. Water 2015, 7, 5986-6016. https://doi.org/10.3390/w7115986
Boutron O, Bertrand O, Fiandrino A, Höhener P, Sandoz A, Chérain Y, Coulet E, Chauvelon P. An Unstructured Numerical Model to Study Wind-Driven Circulation Patterns in a Managed Coastal Mediterranean Wetland: The Vaccarès Lagoon System. Water. 2015; 7(11):5986-6016. https://doi.org/10.3390/w7115986
Chicago/Turabian StyleBoutron, Olivier, Olivier Bertrand, Annie Fiandrino, Patrick Höhener, Alain Sandoz, Yves Chérain, Eric Coulet, and Philippe Chauvelon. 2015. "An Unstructured Numerical Model to Study Wind-Driven Circulation Patterns in a Managed Coastal Mediterranean Wetland: The Vaccarès Lagoon System" Water 7, no. 11: 5986-6016. https://doi.org/10.3390/w7115986