1. Introduction
The element Mercury (Hg) is still in the focus of environmental research due to its toxicity and ability to bioaccumulate throught the food chain. It is known as a substance causing significant negative neurological and other health effects. Since the initiation of the
Minamata Convention of Mercury in the year 2009, the development of a global legally binding instrument for the reduction of global mercury emissions is constantly in progress. The objective of this convention is “to protect the human health and the environment from anthropogenic emissions and releases of mercury” [
1]. The establishment of this international convention is the necessary answer to the fact that mercury, once emitted into the environment, is highly mobile and subject to global transport. Global aspects are, therefore, preferentially in the current focus of mercury research. One major concern about mercury in the environment is the unacceptably high concentrations found in fish with the consequence that in many countries fish consumption is recommended to be restricted not only for sea fish but also for freshwater fish. With respect to Germany, the input of mercury into the river systems decreased significantly during the last few decades [
2]. However, contamination of aquatic biota with Hg is still unacceptable high. According to the EU Directive 2008/105/EC [
3] the Environmental Quality Standard (EQS) for aquatic biota should be limited to 20 μg/kg wet weight. However, current Hg levels,
i.e., in
Abramis brama from major German rivers, are in the range of 73–346 μg/kg (2009) and exceed the EQS by a factor of 3.7–17.3 [
4]. These concentration ranges were confirmed to be still valid in 2013 [
5]. The values meet, in general, the limit values for fish consumption of 0.5 mg/kg to 1.0 mg/kg wet weight depending on the type of fish and values exceeding these limits have only occasionally been reported. The source identification for Hg in rivers is, thus, still of great concern and several attempts have been undertaken to quantify the contribution of different sources for Hg in German river systems. According to Fuchs
et al. [
2] 2720 kg Hg are released in Germany into the rivers each year (balance period: 2003–2005). Based on calculations using the Modelling Nutrient Emissions into River Systems (MONERIS), nine dominating sources have been considered with the approximated contributions listed in
Table 1. Data are calculated and roughly estimated from a diagram since the data base for the diagram is not completely provided.
Table 1.
Point and diffuse mercury emissions in Germany into the river basin districts and seas in the balance period 2003–2005 [
2].
Table 1.
Point and diffuse mercury emissions in Germany into the river basin districts and seas in the balance period 2003–2005 [2].
| Type of sources | Contributing sources | Load (kg/a) | Approximate contribution (%) |
|---|
| Point Sources | Municipal wastewater treatment plants | 939 | 34.52 |
| Direct industrial discharges | 130 | 4.78 |
| Historical mining activities | 10 | 0.37 |
| Diffuse Sources | Urban systems | -- | 16.32 |
| Tile drainage | -- | 12.65 |
| Groundwater inflow | -- | 12.10 |
| Erosion from soil | -- | 11.19 |
| Surface runoff | -- | 5.41 |
| Atmospheric deposition onto water surface | -- | 2.66 |
One year later (2011) these data have been revised and the contribution of municipal WWTPs has been adjusted to only 5% without saying which sources will increase instead [
6]. The data indicate a high degree of inconsistency regarding the proportion of Hg contributed to German rivers by municipal WWTPs since results coming from the MONERIS model are questionable. The inconsistency (35%
vs. 5%) is due to the fact that Hg loads of municipal WWTPs might be overestimated due to the fact that the limit of quantification of the analytical method (DIN EN 1483) generally applied for the monitoring of the Hg concentrations in sewage effluents is very high (0.2 μg/L). Most of the measured values are below this limit. In this case, the German wastewater control demands to assume a Hg concentration of the half of the limit of quantification. The Hg load of municipal WWTPs is consequently overestimated in general due to the absence of data with values below 0.2 μg/L.
The purpose of the present study was to apply a sensitive method for the determination (detection limit of 0.43 ng/L) of the total mercury content (THg) in the water cycle of Frankfurt am Main including the river Main and its tributaries, precipitation, stormwater runoff, effluents of two municipal WWTPs, stormwater management structures such as combined sewer overflows and stormwater retention basins and drinking water. Additionally, data on Hg concentrations in sewage sludge from municipal WWTPs were made available by Stadtentwässerung Frankfurt am Main (SEF). From these data a mass balance of Hg loads should be derived to quantify sources and sinks for Hg in the urban water cycle of the city.
2. Materials and Methods
2.1. Study Area and Sampling Points
Collection of samples was carried out over the period from June 2014 to February 2015. The study area is shown in
Figure 1. The surface area of Frankfurt am Main (dark gray) is 239.8 km
2. Some adjoining municipalities (light grey), contributing a surface are of 195 km
2, also deliver their sewage water to the municipal WWTPs of Frankfurt am Main.
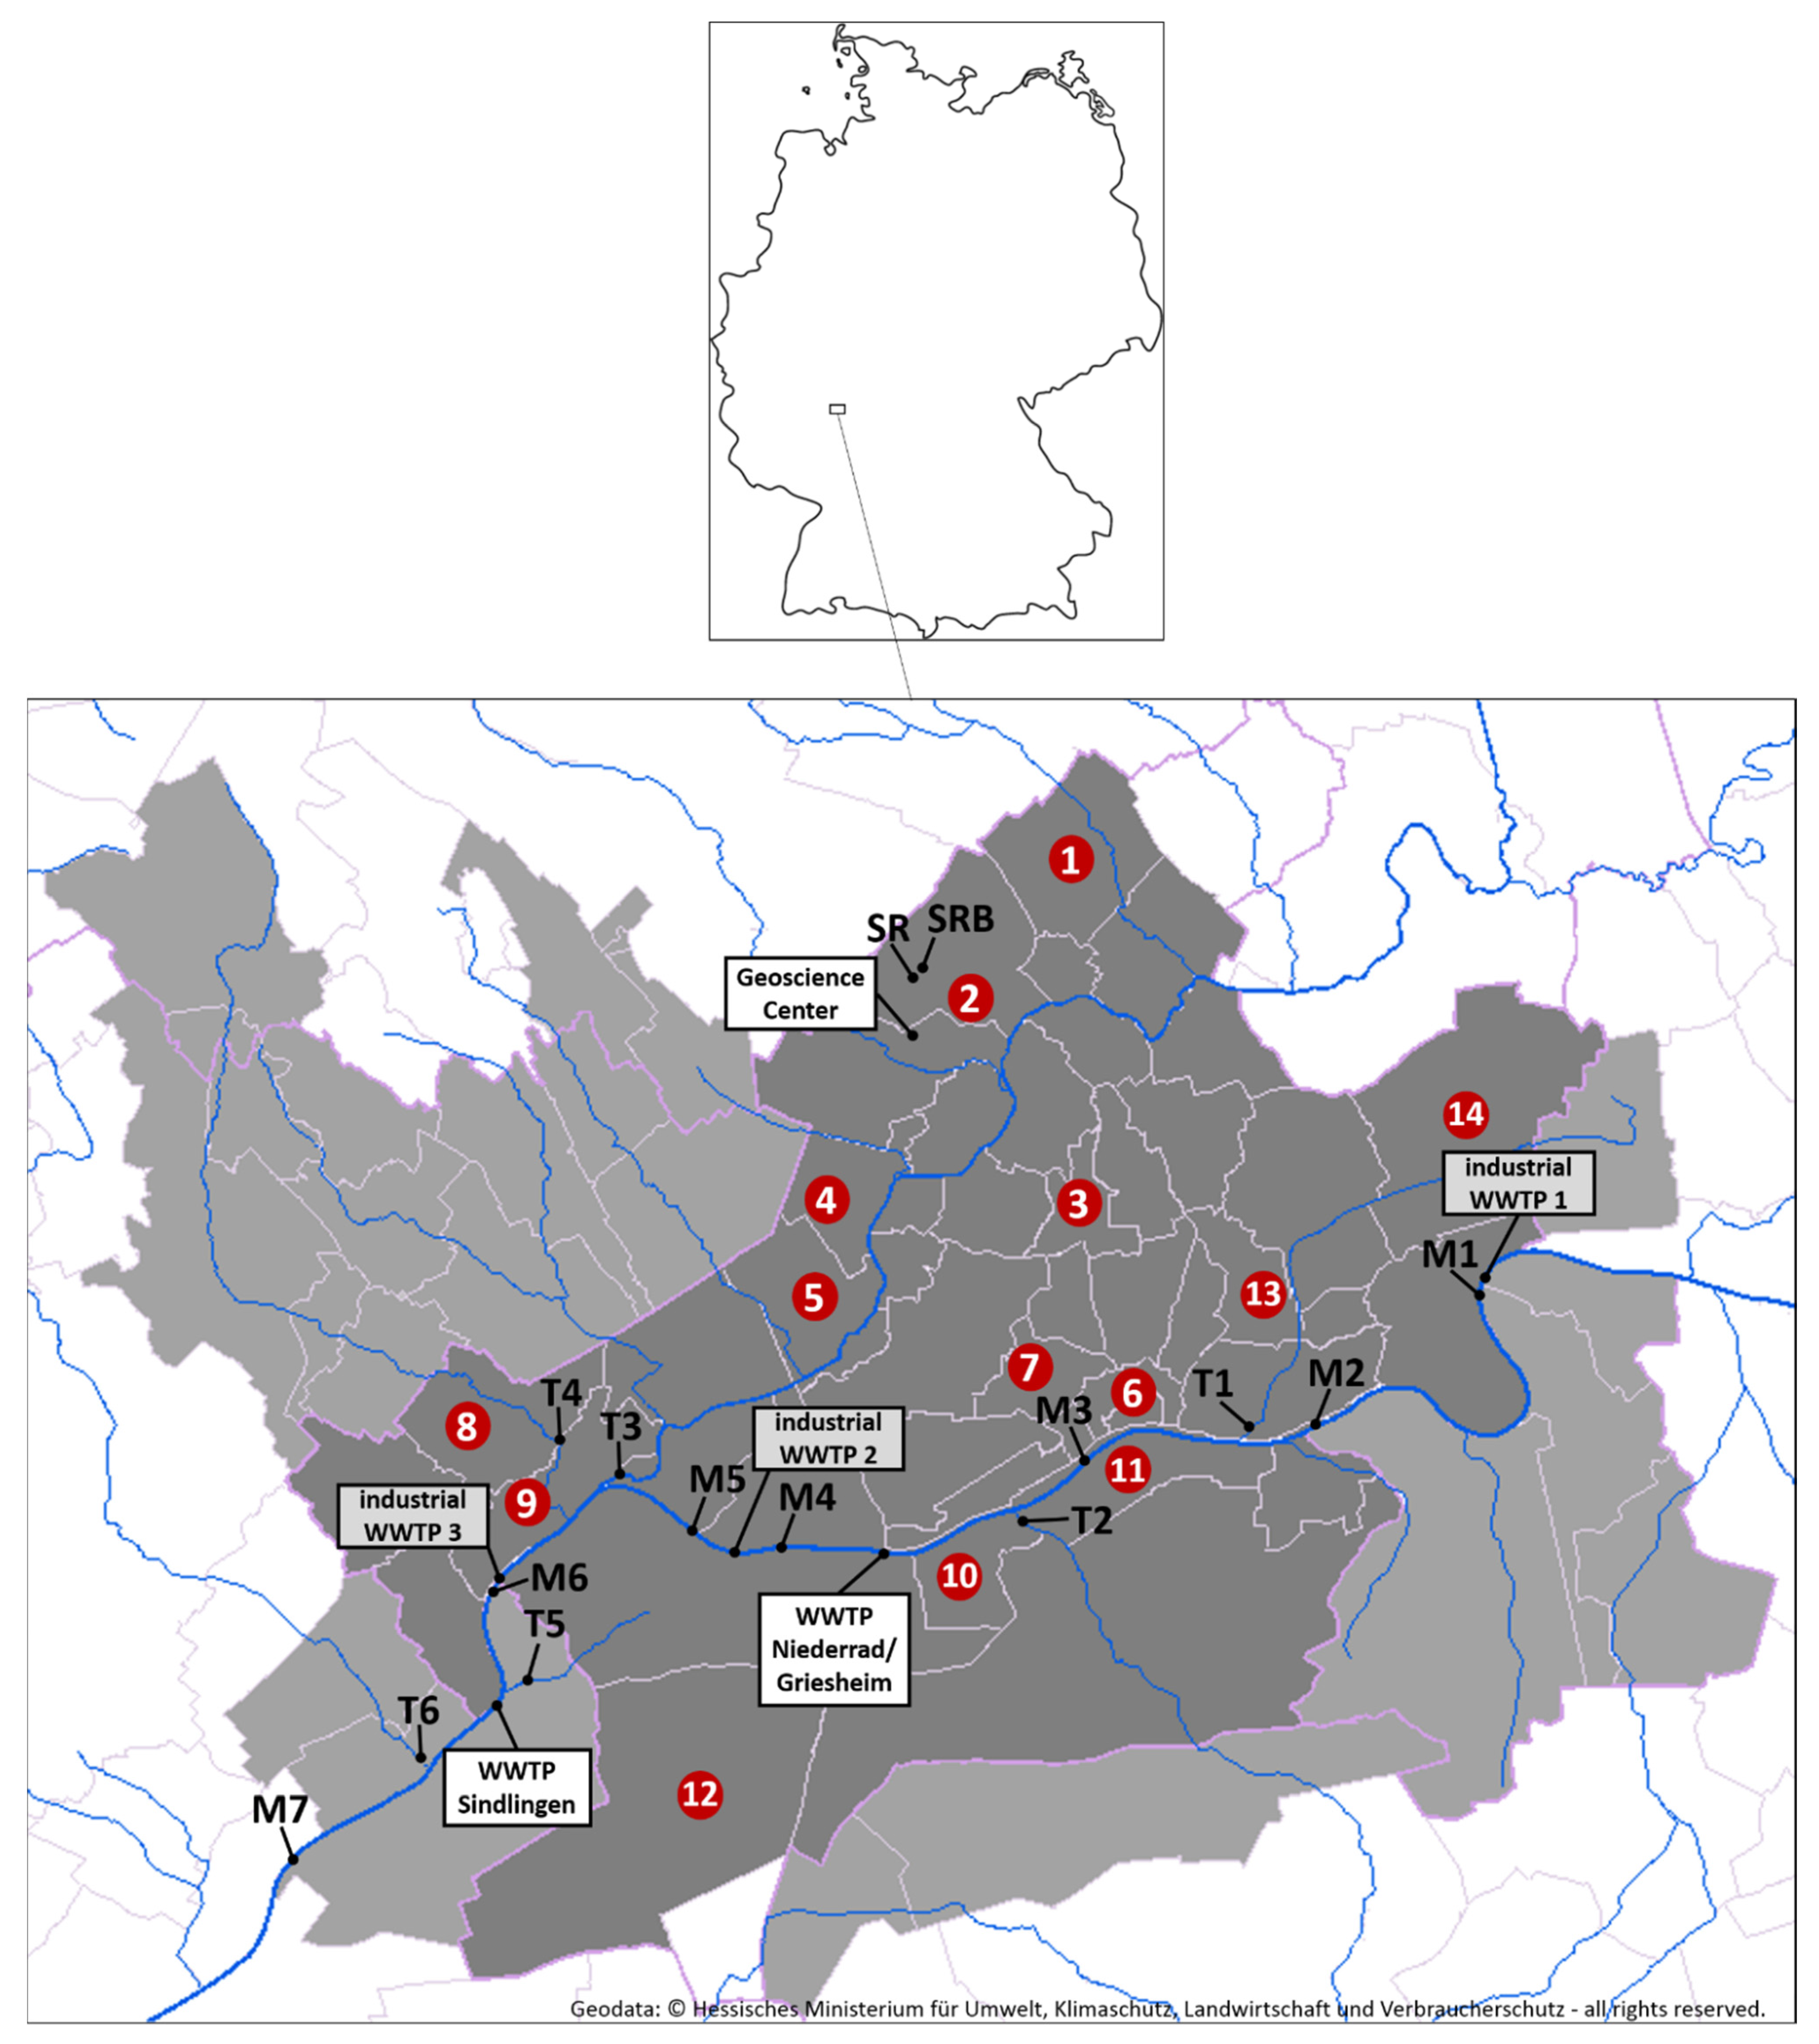
Figure 1 additionally shows the sampling points at the river Main (M1–M7) used for determination of the concentrations and loads of THg from the point of entering to the point of leaving the study area. The river Main crosscuts the city of Frankfurt am Main, with approximately 57% of the study area being located north of the Main and 43% south of the Main. Along the river at M1–M7 spot samples were collected twice (on 22 October 2014 and 02 December 2014) at both sides of the river only from the surface of the water up to 50 cm depth. The distance between M1 and M7 is 29.72 km. Moreover six tributaries of the river Main (T1–T6; Riedgraben, Luderbach, Nidda, Liederbach, Kelsterbach and Schwarzbach near Hattersheim) have been analyzed to determine their possible contribution to the THg load in the river Main (each with
n = 1). Samples of precipitation (
n = 48) have been collected at Goethe University on top of the Geoscience Center (50°10′25.8708″ N, 8°38′01.4172″ E) to calculate the amount of THg entering the study area by wet deposition. Effluents of two municipal WWTPs (Niederrad/Griesheim and Sindlingen) have been analyzed (
n = 24). These WWTPs discharge together on average 101,000,000 m
3/a (78,000,000 m
3/a in case of Niederrad/Griesheim and 23,000,000 m
3/a for Sindlingen) into the river Main. The WWTP Niederrad/Griesheim discharges its treated wastewater on the left side and the WWTP Sindlingen on the right side of the Main into the river. In addition three WWTPs of industrial parks discharge their wastewater directly into river Main at locations shown in
Figure 1. These WWTPs belong to industrial park Fechenheim (industrial WWTP 1), industrial park Griesheim (industrial WWTP 2) and industrial park Höchst (industrial WWTP 3). The exact volume of the treated wastewater discharged from these industrial WWTPs into the river Main is not reported but can be estimated to be roughly 15,000,000 m
3/a (sum for all three WWTPs). Sampling of effluents from these WWTPs was not possible.
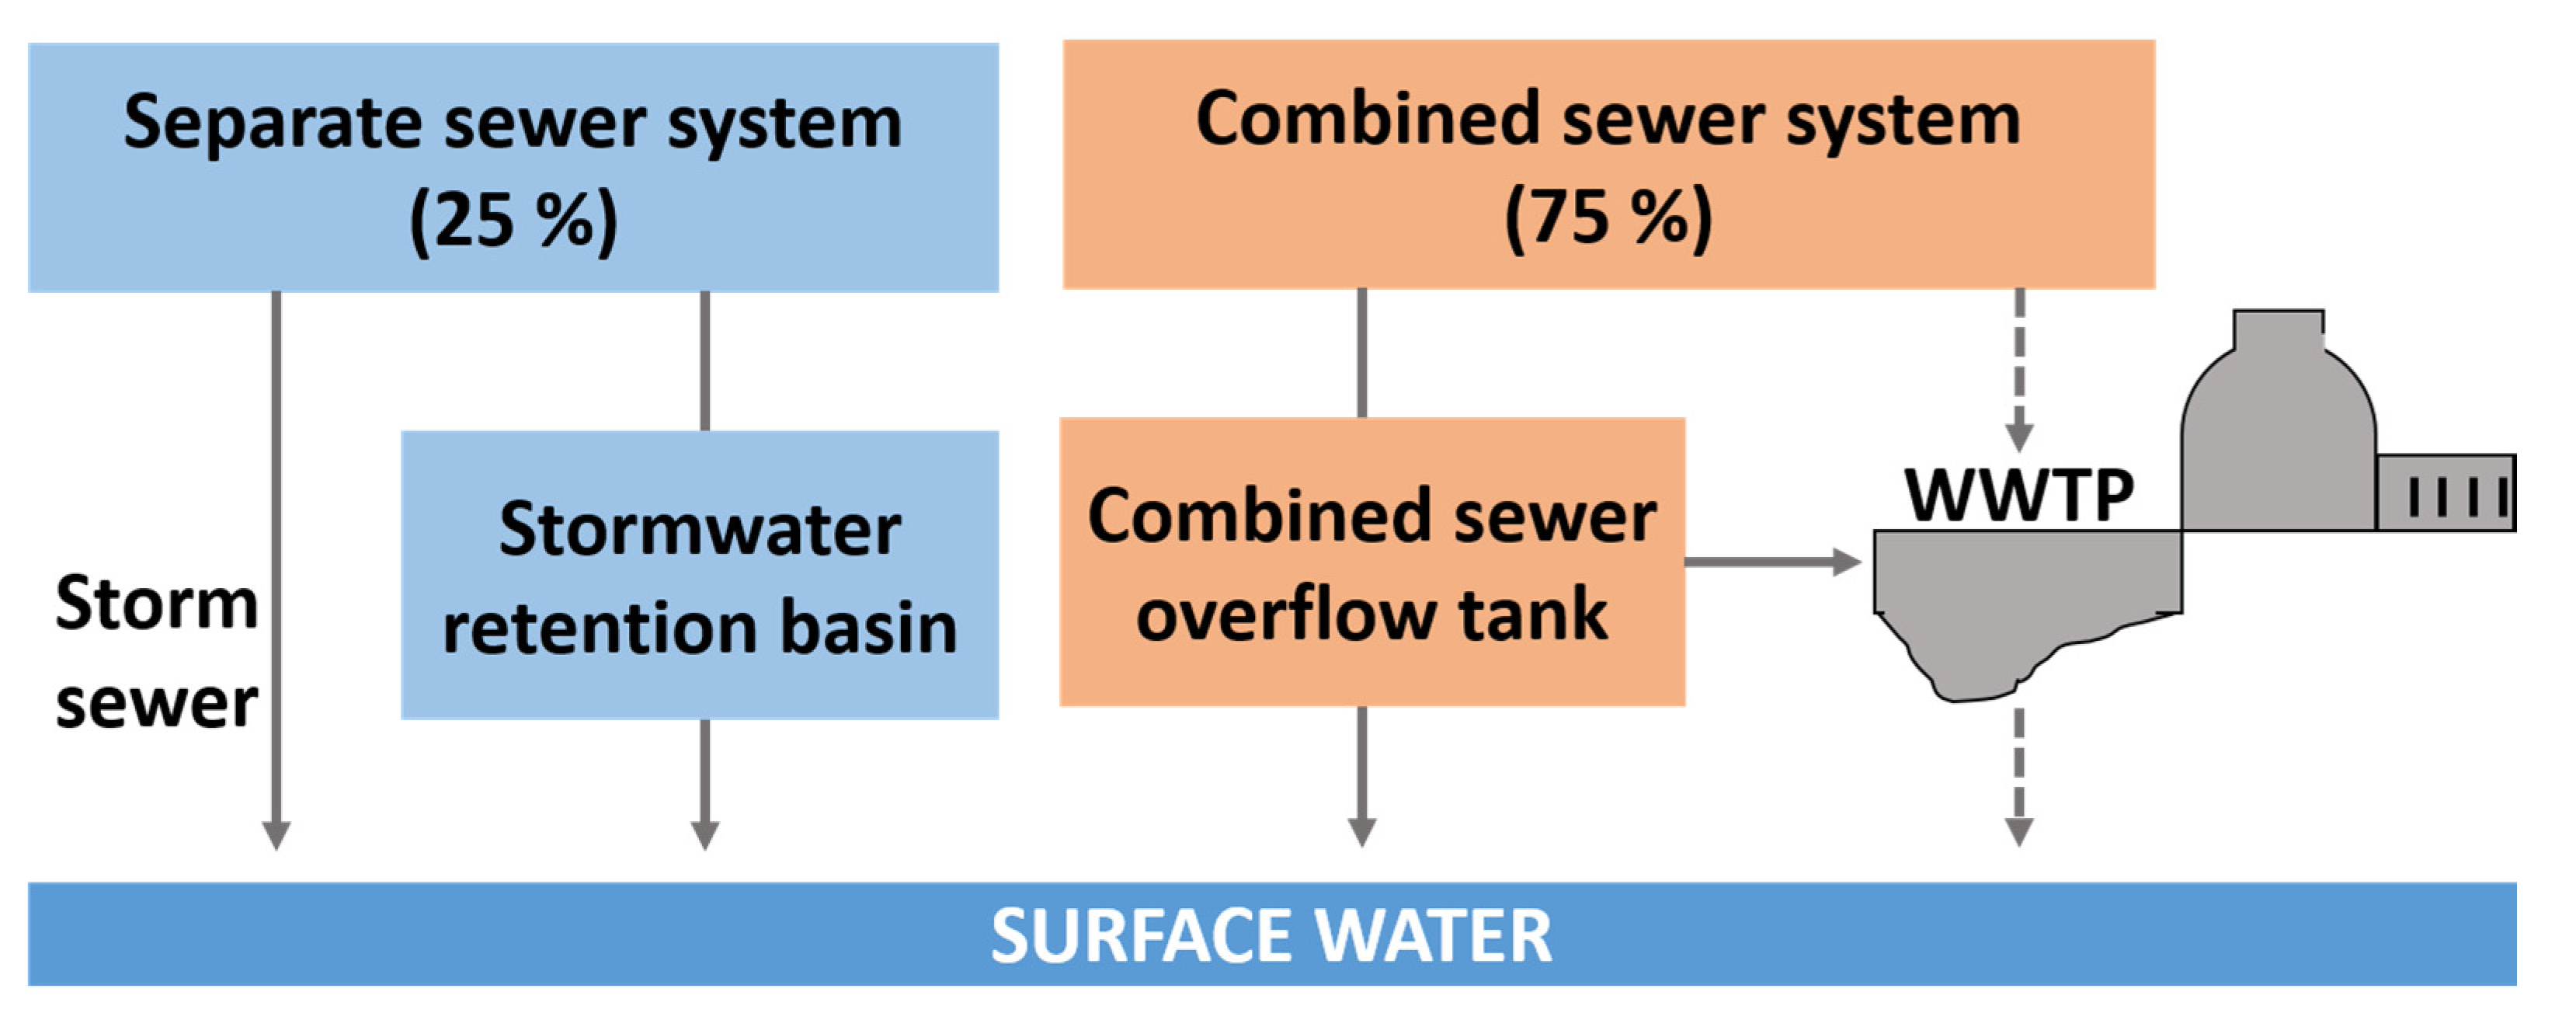
In most parts of the study area (75%) surface runoff is combined with sewage water and delivered together to the WWTPs in a combined sewer system. 25% of the surface runoff is collected in stormwater retention basins or transferred directly by a separate sewer system to the river Main and its tributaries (
Figure 2). Roof and street runoff can reach the river Main on two different pathways. In the separate sewer system the roof and street runoff is transported either directly or via stormwater retention basins into the Main and its tributaries. In the combined sewer system the roof and street runoff is generally transferred to the WWTPs and treated together with the sewage. During heavy rain events part of the stormwater and sewage water is transferred into the river Main and its tributaries via combined sewer overflow tanks.
Water samples from surface runoff (
n = 5) and from a stormwater retention basin (
n = 5) have also been analyzed for comparison with concentrations measured in precipitation (SR and SRB in
Figure 1). Finally, drinking water (
n = 14) from different urban districts (numbers in red dots in
Figure 1) has been analyzed to determine its possible contribution to the wastewater.
After sample collection samples were preserved by adding 10 mL/L of pretested concentrated HCl, stored in Duran® (Wertheim, Germany) glass bottles from Schott, Mainz or in Boston Round Clear Glass Bottles from Thermo Scientific, USA and cooled at 4 °C in the dark until processing in laboratory within 7 days after sampling.
Figure 1.
Study area with city of Frankfurt (dark grey) and some adjoining municipalities (light grey), which deliver their sewage water to the two municipal WWTPs of Frankfurt am Main (Niederrad/Griesheim and Sindlingen). Additionally, locations of three industrial WWTPs discharging their wastewater into the river Main are shown. Sampling locations at river Main are indicated by M1–M7 and sampling locations of tributaries by T1–T6. Numbers in red dots indicate the urban district where drinking water samples have been collected. SR = sampling point for surface runoff, SRB = sampling point of stormwater retention basin.
Figure 2.
Pathways of sewer systems in the study area, modified after [
2].
Figure 2.
Pathways of sewer systems in the study area, modified after [
2].
2.2. Chemicals
Potassium bromate (KBrO3) and potassium bromide (KBr), both p.a., have been purchased from Merck, Darmstadt, Germany for preparation of bromine(I)chloride (BrCl) solution. Hydrochloric acid (HCl, 36.5%–38.0% and <0.005 ppm Hg) was obtained from J.T. Baker®, Avantor, PA, USA. Tin(II)chloride-dihydrate (SnCl2·2H2O) (p.a.) has been provided by Merck, Darmstadt, Germany. Hydrochloric acid (37%, <0.001 pp Hg, p.a., Merck, Darmstadt, Germany) was used for the preparation of the SnCl2 solution. Hg standard solutions were prepared from Standard Reference Material® NIST (Gaithersburg, MD, USA) 1641d (1.557 mg Hg/kg ± 0.020 mg/kg mercury in water, acidified to 2% nitric acid). L-(+)-ascorbic acid has been purchased from J.T. Baker®, Avantor, PA, USA.
2.3. Analytical Method
EPA Method 1631 has been used for the determination of total mercury (THg) in water samples by cold vapor atomic fluorescence spectrometry (CVAFS) using the AFS-PSA 10.035 Millennium Merlin 1631 instrument. BrCl is applied as oxidizing agent to convert all mercury species in the samples to Hg
2+. The subsequent reduction of Hg
2+ to Hg
0 is carried out by SnCl
2 [
7].
The BrCl solution was prepared by dissolving 1.1 g KBrO3 and 1.5 g KBr in 20 mL of ultrapure water and 80 mL of concentrated HCl (36.5%–38.0%, J.T. Baker®, Avantor, USA). The SnCl2 solution was prepared from 666 mL ultrapure water and 333 mL of concentrated HCl (37%, <0.001 pp Hg, p.a., Merck, Darmstadt, Germany) and 40 g SnCl2·2H2O. Both components were given into a 2 L volumetric flask which was filled with ultrapure water till to the calibration mark. This solution was finally purged with nitrogen (5.0). The solution for continuous blank determination was prepared by dilution of concentrated HCl (36.5%–38.0%, J.T. Baker®, Avantor, USA) with ultrapure water to a final concentration of 1%. 1 L of the 1% HCl was combined with 5 mL of the prepared BrCl solution. 1 hour after combining both solutions and after short stirring, 100 mg of L-(+)-ascorbic acid were added and stirred until a clear solution is available. L-(+)-ascorbic acid had to be added to destroy residual free oxidizer, since purging of free halogens onto the gold trap would result in damage to the trap.
2.4. Sample Preparation and Calibration
To 1 L of acidified natural water sample 5 mL of BrCl solution were added and the mixture was vigorously stirred. More BrCl solution was added in case that the solution was not yellow coloured. After 1 h the sample was stirred briefly and 100 mg of L-(+)-ascorbic acid was added to remove free halogens from the solution. 25 mL of each samples was transferred into PFA sampling tubes and placed into the autosampler for analysis.
For calibration of the instrument, Hg standard solutions were prepared by use of “Standard Reference Material® 1641d, Mercury in Water (acidified to 2% nitric acid), 1.557 mg Hg/kg ± 0.020 mg/kg, NIST, USA”. Glass ampules of this standard solution (10 mL) were filled into a 250 mL volumetric flask which was filled with blank solution (see above) to the calibration mark. In 500 mL-PFA volumetric flasks, from this stock solution by use of blank solution 5 diluted standard solutions were prepared with final concentrations of 0; 5; 10; 15 and 20 ng Hg/L. 2.5 mL BrCl solution were added to each standard solution. After 1 h, L-(+)-ascorbic acid (100 mg) was added and the flask was finally filled up to exactly 500 mL. 50 mL of each standard solution were placed into the autosampler for the duplicate analysis.
From the water samples triplicate analyses were carried out. Samples were measured again after dilution in case that the measured concentrations were outside of the calibration range. For quality assurance duplicate analysis of the Hg standard solution has been carried out always after 10 sample measurements (mean recovery: 96.6% ± 10.4%, n = 102). Calibration of the instrument was renewed when the measured value of Hg in the standard solution was more than ± 1 ng/L deviating from the standard concentration. The limit of detection was calculated to be 0.43 ng/L (n = 10) based on three times of the standard deviation obtained from 10 measurements of the blank solution.
3. Results and Discussion
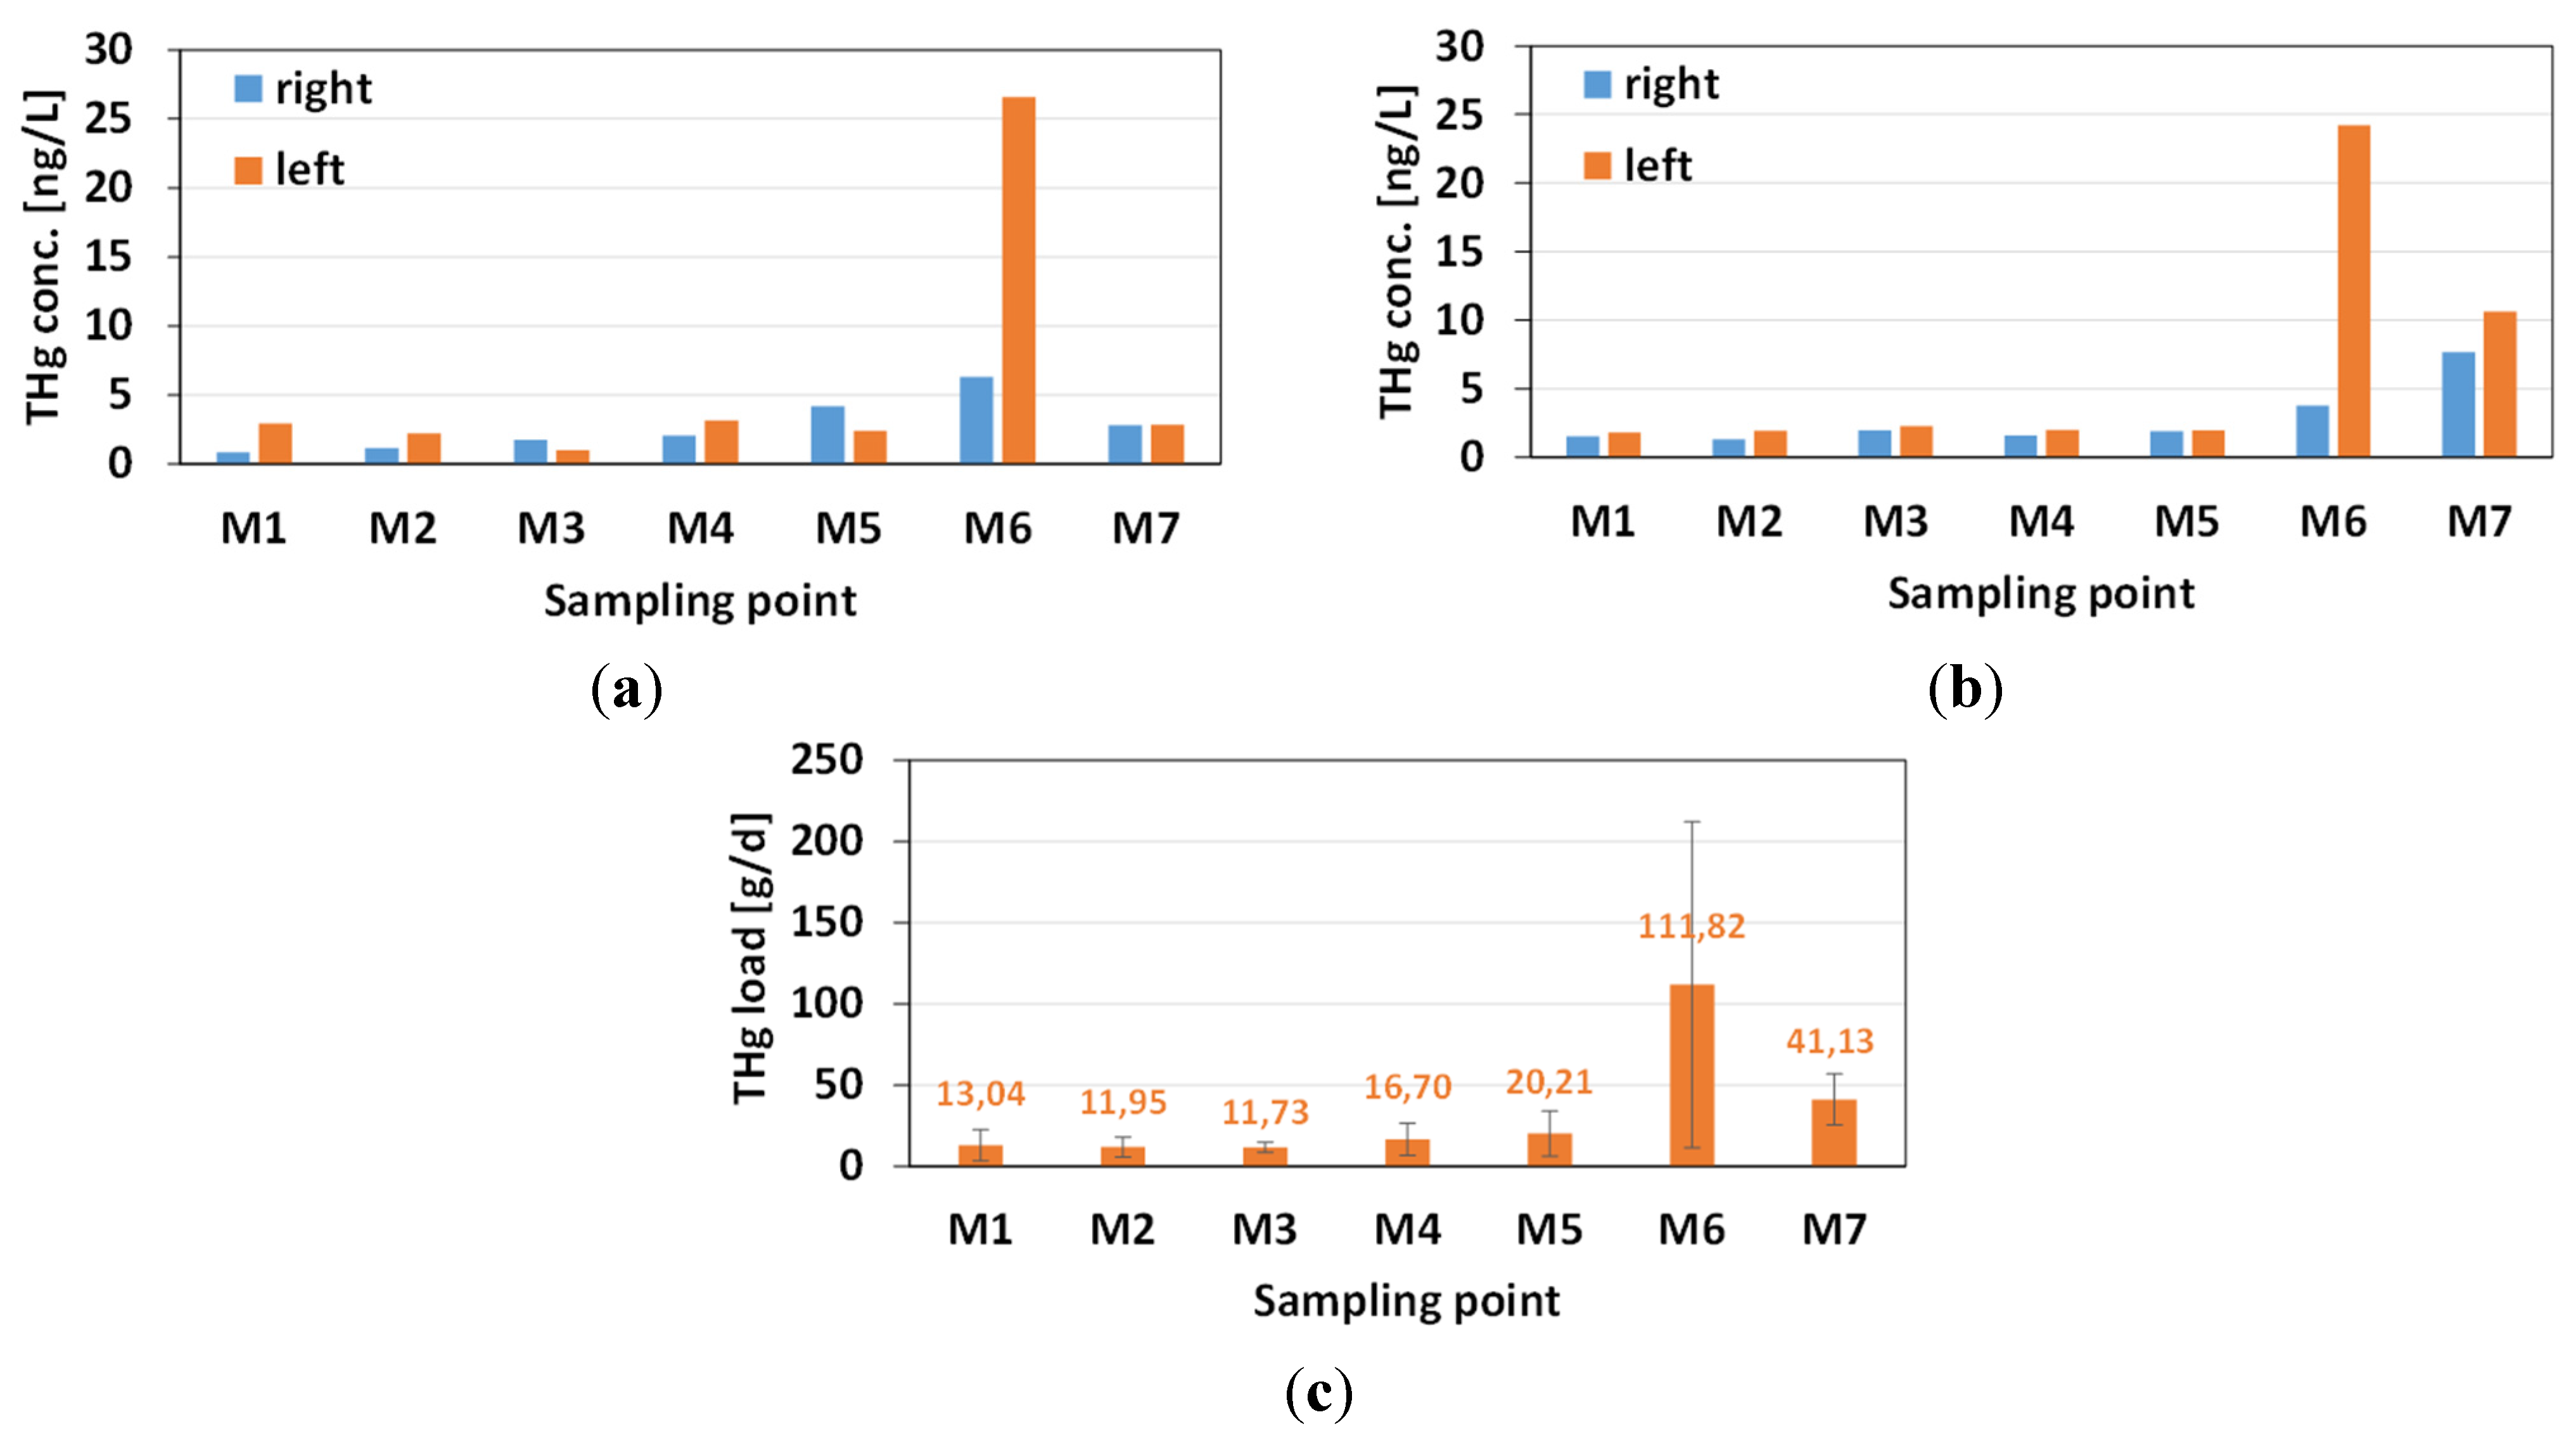
THg concentrations obtained from spot samples collected twice (on 22 October 2014 and 02 December 2014) at the right and left side of the river varied from 0.85 ng/L to 26.62 ng/L as shown in
Figure 3a,b. The lowest value was determined at M1 (right side), representing the location at the inflow of the river Main into the study area. The highest value (26.62 ng/L) has been measured at M6 on the left side downstream of a large industrial park. At M7, where the river Main is leaving the study area, the THg concentrations decreased again (on average 6.48 ng/L), probably due to dilution of the Main water by the tributaries Schwarzbach and Kelsterbach. Differences between the concentrations of the two sampling campaigns can be explained by different hydrometeorological conditions causing various discharges of the river. The mean daily water discharge of river Main was 108 m
3/s on 22 October 2014 and 58 m
3/s on 2 December 2014. Concentrations on 22 October 2014 tend to be lower than on 2 December 2014. This finding is consistent with other studies. Both Quémerais
et al. and Kocman
et al. detected higher THg concentrations at higher discharges [
8,
9]. This can be attributed to the increased suspension of sediment and the associated entry of particulate Hg (HgP) in the overlying water column. Additionally, several parameters which vary from day to day (pH, temperature, amount and composition of sewage discharges) will have an impact on the THg concentration in the river and must be considered.
Figure 3.
Results from the determination of THg concentrations at 7 sampling points of river Main (M1–M7) at the right and left side on (a) 22 October 2014; (b) 02 December 2014 and (c) the calculated mean THg loads from both sampling campaigns and both sites of the river.
Figure 3.
Results from the determination of THg concentrations at 7 sampling points of river Main (M1–M7) at the right and left side on (a) 22 October 2014; (b) 02 December 2014 and (c) the calculated mean THg loads from both sampling campaigns and both sites of the river.
The measured values are comparable to data of THg concentrations from other studies. Tong
et al. [
10] reported a worldwide background value for THg in natural surface waters of 5 ng/L. Schudoma [
11] published background values of THg for non-polluted rivers ranging from 5 to 20 ng/L. Pirrone & Mahaffey [
12] reported typical THg concentrations in worldwide surface watercourses ranging from 0.3 to 100 ng/L including anthropogenically affected water courses. According to Fergusson [
13] concentrations of THg in large rivers range from 0.1 to 2800 ng/L, with higher values being related to severe anthropogenic contamination. The monitoring program of the Hessian Agency for the Environment and Geology (HLUG) on THg concentrations in hessian rivers provided highest concentrations of 38 ng/L with an average value of 8 ng/L (
n = 51) in river Main at the sampling point Bischofsheim (12 km downstream from M7) [
14]. From other German rivers (Isar and Danube) THg concentrations ranging from 0.41 to 0.64 ng/L have been reported [
15]. In comparison to these data, the THg concentration range (0.85–26.62 ng/L; on average 5.16 ng/L) determined in the present study in the water of the river Main represents values indicating that the anthropogenic pollution of the Main is still low at sampling point M1 (0.85 ng/L). Higher values further downstream from M1 reflect influence by anthropogenic pollution. The exceptionally high THg concentration of 26.62 ng/L measured in water from location M6 (left side) can be attributed to the influence of a large industrial park, at which during the time of sampling a chlor alkali electrolysis plant was still operating. The Environmental Quality Standard (EQS) of a maximum admissible concentration of 70 ng/L for dissolved Hg in freshwater proposed by the European Water Framework Directive (Directive 2008/105/EC) has not been reached in any water sample taken from the river Main in the study area.
The average loads of THg per day in the Main calculated from two sampling campaigns and combining data obtained from left side and right side of the Main are shown in
Figure 3c. For calculation of the load increase only THg concentrations in samples collected at M1 (inflow into the study area) and M7 (outflow from the study area) were considered. According to the data, the inflow of Hg at M1 was about 5 kg/a and the outflow was 15 kg/a. Further studies were aimed at the identification of sources that could explain the triplication of THg load in the river on a distance of 29.72 km. Possible sources for the observed increase are:
Tributaries to the river Main;
Atmospheric deposition on the river surface;
Stormwater from the separate sewer system (storm sewer/stormwater retention basins) and from the combined sewer system (combined sewer overflow tanks);
Effluents of two municipal WWTPs;
Sewage water from combined sewer overflow tanks during heavy rain events;
Effluents of three industrial WWTPs;
Groundwater infiltration.
In the present study, only the contribution of sources 1–5 could be investigated. There were no options to study effluents of industrial WWTPs since these effluents are located below the water surface and samples were not provided by the institution responsible for wastewater control of direct dischargers. Sampling of the groundwater inflow was also not possible.
3.1. Tributaries to River Main (Source No. 1)
Data on THg concentrations and loads in tributaries (source No. 1) were obtained from spot sampling close to the mouth into the river Main. Results shown in
Table 2 indicate that the concentrations varied between 0.82 and 13.98 ng/L and loads varied from 0.02 to 3.75 g/day. Assuming that these loads are valid for the whole year, the increase of the THg load of the river Main contributed by the tributaries will sum up to 1.51 kg/a.
Table 2.
THg concentration in samples from 6 tributaries (T1–T6) near the mouth into the river Main, arithmetic mean annual discharges at the mouth and calculated daily THg loads.
Table 2.
THg concentration in samples from 6 tributaries (T1–T6) near the mouth into the river Main, arithmetic mean annual discharges at the mouth and calculated daily THg loads.
| Sampling Point | Tributary | THg (ng/L) | Discharge (MQ) * (m3/s) | Load (g/day) |
|---|
| T1 | Riedgraben | 2.48 | 0.13 | 0.03 |
| T2 | Luderbach | 13.98 | 0.08 | 0.10 |
| T3 | Nidda | 3.32 | 13.06 | 3.75 |
| T4 | Liederbach | 0.82 | 0.31 | 0.02 |
| T5 | Kelsterbach | 8.01 | 0.12 | 0.08 |
| T6 | Schwarzbach (Hattersheim a. M.) | 1.72 | 1.11 | 0.16 |
| | | | | ∑ = 4.14 |
3.2. Atmospheric Deposition on the River Surface (Source No. 2)
The atmospheric deposition on the water surface (source No. 2) is composed of dry deposition and wet deposition. The contribution of wet deposition can be determined by THg concentrations measured on the roof of Geoscience Center located in Frankfurt am Main. From 48 rain water samples a monthly average THg concentration of 19.15 ng/L (volume weighted value from Sept 2014 till Jan 2015) was calculated. The surface area of the Main in the study is approximately 5 km
2 (surface area of the tributaries was neglected) and the mean annual precipitation in Frankfurt am Main is 629 mm/a [
17]. Using these data, the direct wet deposition flux of THg amounts to 12.1 μg/(m
2·a) resulting in a wet deposition of 0.06 kg/a onto the surface of the river. For the determination of dry deposition of THg on the river Main literature data based on EMEP calculations were used [
18]. The data indicate that in the area of southern Hesse the THg deposition amounts to 15–20 μg/(m
2·a) which would result in 0.07–0.10 kg/a. This is in good agreement with our calculation of the wet deposition rate. Combining both calculations, the dry deposition rate of THg onto the river Main amounts to 0.01–0.04 kg/a. The calculated value of 19.15 ng/L for the monthly volume weighted concentration and 12.1 μg/(m
2·a) for the wet deposition flux in the study area is similar to those values previously reported by Zhu
et al. [
19] in urban areas in Japan, UK and USA and by Zhao
et al. [
20] in the Three Gorges Reservoir in Chongqing, China with 18 ng/L (annual weighted concentration) and 13 ± 2.4 μg/(m
2·a).
3.3. Stormwater from the Separate Sewer System (Storm Sewer/Stormwater Retention Basins) and from the Combined Sewer System (Combined Sewer Overflow Tanks) (Source No. 3)
From roof runoff and street runoff, 5 samples were analyzed to investigate whether the THg concentrations were similar to those determined from precipitation and to assess the load of THg that reaches the river Main and its tributaries through the separate sewer system in those areas of the city that are not equipped with the combined sewer system. Concentrations varied from 5.96 to 35.89 ng/L (mean: 23.30 ± 14.10 ng/L). These concentrations are slightly higher than those detected in precipitation which can be explained by the fact that roof and streets accumulate Hg by dry and wet deposition (condensate) causing no runoff in the time between rain events. The measured THg concentrations are close to those reported in previous studies. Eckley & Branfireun (2008) [
21] analyzed individual event mean THg levels in surface water runoff from a parking lot (asphaltic concrete) and from a mixed land-cover (roofs, streets, parking lots and grassland) in Ontario, Canada and found similar values of 2.6–37.2 ng/L (mean: 16.0 ± 12.1 ng/L).
Roof and street runoff gets into the rivers either via the separate sewer system or during overflow of the combined sewer system during heavy rain events. The amount of runoff which is not transported by the combined system to the WWTPs is calculated by subtraction of the amount of surface runoff, which is transported by the combined sewer system to the WWTPs, from the total runoff of all impervious areas according to the following equation:
Vsr,imp is the volume of the total surface runoff of all impervious surfaces in study area. This volume is calculated by multiplication of the impervious area (108.9 km2) with the mean annual amount of precipitation (629 L/(m2·a)). Assuming that 30% of the precipitation is evaporated again, the amount of precipitation that reaches the sewer systems decreases to 440.3 L/(m2·a). Using these data, the Vsr,imp in the study area amounts in total to 48 × 106 m3/a. The volume of runoff from impervious surfaces that is transported in the combined sewer system to the WWTPs (Vsr,wwtp) is about 22 × 106 m3/a and consequently the volume of runoff getting untreated into the rivers (Vsr,river) is about 26 × 106 m3/a. By use of the above mentioned average THg concentration in surface runoff of 23 ng/L the total annual transfer amount of THg to the Main from runoff can be expected to be 0.6 kg/a. However, measurements carried out on the outflow of a retention basin (n = 5) provided much lower concentrations with values ranging from 3.63 to 7.52 ng/L (mean: 5.04 ± 1.48 ng/L) indicating that 78% of the THg is transferred into the sediment while the surface runoff is flowing through the basin. 78% of 0.6 kg/a (worst case) are 0.13 kg/a, representing probably a more realistic value.
3.4. Effluents of Two Municipal WWTPs (Source No. 4)
Twenty-eight effluent samples (24-hour flow proportional composite samples) of both municipal WWTPs in the study area (source No. 4) have been analyzed with respect to THg concentration and concentrations were ranging from <LOD to 3.63 ng/L (
Table 3). Average concentrations were calculated using ½ LOD values for all samples where concentrations were below the LOD and by dividing the calculated average annual Hg load by the average annual discharge (78,000,000 m
3/a in case of Niederrad/Griesheim and 23,000,000 m
3/a for Sindlingen). Based on this assumption, the effluent concentrations from WWTP Niederrad/Griesheim were on average 0.76 ng/L and for WWTP Sindlingen 0.87 ng/L. Considering the daily discharges into the river during the time of sampling, average daily Hg loads were calculated (166 mg/day for Niederrad/Griesheim and 55 mg/day for Sindlingen) resulting in a total annual Hg input from both WWTPs into the river Main of 0.079 kg/a.
Compared to results obtained from other studies, effluent concentrations of THg in WWTPs of Frankfurt am Main tend to be low. Zierhut
et al. [
22] analyzed effluents of the WWTP Großlappen in Munich, Germany and determined an average concentration of 1.70 ng/L. By far higher values have been reported from effluents of WWTPs in Winnipeg (Canada) with values ranging from 3 to 14 ng/L [
23], from the WWTP called METRO in Onondaga County, USA with values of 48.6 ± 27.1 ng/L (in winter season) and 24.1 ± 22.5 ng/L (in summer season) [
24] and from the WWTP of Harbin, China with values of 39 µg/L [
25].
Most of the drinking water supplied in the study area is ending up in the sewage after usage. Therefore, it is important to know the maximum amount of Hg added to the sewage via drinking water usage. Fifteen drinking water samples from 14 districts in Frankfurt am Main have been analyzed for the THg concentrations in order to determine the amount of Hg, which is thereby introduced into the aquatic system. In the study area of Frankfurt am Main including the adjoining municipalities, approximately 60,500,000 m3 of drinking water is supplied per year to households and industry. After usage this amount will roughly be transferred to the WWTPs for treatment. The limit for THg in German drinking water is set to 1 µg/L by the drinking water ordinance. Result of drinking water analyses on samples from Frankfurt am Main have shown, that the values were far below the limit value and ranged from <LOD (0.43 ng/L) to 2.57 ng/L resulting in an average value of 0.54 ng/L when for samples with concentrations <LOD a value of ½ LOD is calculated. The amount of Hg in the sewer system originating from drinking water was 0.033 kg/a considering the calculated average concentration of 0.54 ng/L in the drinking water provided in the study area and a total annual consumption of 60,500,000 m3.
Table 3.
Concentrations and loads of THg in effluent samples from the municipal WWTPs Niederrad/Griesheim and Sindlingen. Loads were calculated using ½LOD values for all samples where concentrations were below the LOD.
Table 3.
Concentrations and loads of THg in effluent samples from the municipal WWTPs Niederrad/Griesheim and Sindlingen. Loads were calculated using ½LOD values for all samples where concentrations were below the LOD.
| Sampling Date | WWTP Niederrad/Griesheim | WWTP Sindlingen |
|---|
| THg (ng/L) | Discharge (m3/day) | Load (mg/day) | THg (ng/L) | Discharge (m3/day) | Load (mg/day) |
|---|
| 07 June 2014 | 3.63 | 165,800 | 601.60 | 0.74 | 40,100 | 29.60 |
| 20 June 2014 | <LOD | 158,000 | 33.97 | 2.07 | 36,100 | 74.67 |
| 21 June 2014 | 0.84 | 155,100 | 130.49 | 1.05 | 35,900 | 37.72 |
| 22 June 2014 | 2.14 | 151,200 | 322.87 | 0.99 | 36,100 | 35.59 |
| 23 June 2014 | 0.58 | 167,200 | 97.16 | 0.75 | 37,400 | 28.06 |
| 24 June 2014 | 0.91 | 186,800 | 170.00 | 2.76 | 37,800 | 104.40 |
| 25 June 2014 | 1.21 | 184,800 | 222.90 | 0.99 | 37,300 | 36.85 |
| 26 June 2014 | 1.45 | 167,100 | 242.81 | 1.74 | 36,700 | 63.78 |
| 27 January 2015 | -- | -- | -- | <LOD | 69,200 | 14.88 |
| 28 January 2015 | <LOD | 246,200 | 52.93 | <LOD | 66,400 | 14.28 |
| 29 January 2015 | <LOD | 389,800 | 83.81 | 0.68 | 120,300 | 81.76 |
| 30 January 2015 | <LOD | 377,400 | 81.14 | 1.20 | 117,300 | 140.43 |
| 31 January 2015 | <LOD | 239,500 | 51.49 | 0.66 | 79,500 | 52.64 |
| 01 February 2015 | <LOD | 337,800 | 72.63 | -- | -- | -- |
| Average | 0.76 | | 166 | 0.87 | | 55 |
Hg can leave WWTPs on two different pathways, via the effluents into the rivers and via sewage sludge. In Frankfurt am Main sewage sludge from all WWTPs is combined and combusted in a sewage sludge combustion plant. Hg is routinely determined in the fresh centrifugalized sewage sludge. Concentrations are on average about 0.7 µg/kg dry weight. In the combustion plant about 35,000 tons of sewage sludge (dry weight) are burned per year. From these data the amount of Hg precipitated in the sewage sludge was calculated to about 24.5 kg/a. The amount of Hg in the sewer system originating from drinking water (0.033 kg/a) is a negligible contribution in comparison to the total mercury amount of 24.5 kg/a ending up in sewage sludge after treatment of wastewater. The determination of Hg in raw sewage using EPA Method 1631 is not possible due to the high amount of solid material. However, the average concentration of Hg in wastewater (sewage water and stormwater) can be calculated from the annual load of Hg in the sewage sludge (24.5 kg/a) and the load in the effluent (0.079 kg/a) resulting in a total load of 24.579 kg/a (
Lww) in the inflow of the WWTPs by using Equation (2).
The concentration of Hg in the wastewater (Cww) can be calculated by dividing Lww by the volume of wastewater treated in the WWTPs of Frankfurt am Main (Vww). The Vww treated in the combined sewer system was about 101,000,000 m3 per year of which 79% represent sewage water and 21% stormwater. From these data the average concentration of Hg in the combined sewer is calculated to 243 ng/L. The Hg concentration in the 21,500,000 m3 of stormwater is expected to be the same as determined from the surface runoff (23 ng/L) which is equivalent to a total of 0.495 kg/a. The proportion of sewage water (Vsw = 79,500,000 m3) contained the residual amount of 24.085 kg Hg/a (Lsw), yielding an average concentration of 303 ng/L (Csw).
3.5. Sewage Water from Combined Sewer Overflow Tanks During Heavy Rain Events (Source No. 5)
One possibility to determine the amount of Hg that gets into the river Main by sewage water from the combined sewer overflows (CSO) during heavy rain events is the determination of the annual volume of overflow and the concentration of Hg in the overflow. The discharge of untreated sewage via combined sewer overflow tanks depends on the amount and intensity of heavy rain events. This amount is strongly influenced by meteorological parameters and varies from year to year. Therefore, a “best case scenario” and a “worst case scenario” were considered. For the “worst case scenario” a maximum of 3.4% of the total sewage water was assumed to be discharged via combined sewer overflow into the river. This limit was determined by the permitted amount of organic carbon calculated from the chemical oxygen demand (COD) that was allowed to be discharged into the river Main via combined sewer overflows according to Hessian guidelines.
Based on practical experience, for the “best case scenario” an annual total proportion of 1.7% of sewage water was assumed to be discharged from the combined sewer system into the river Main. The volume of sewage water that was discharged into the river Main via combined sewer overflows (
Vsw,river) was computed according to the following equation:
with
where
Vsw is the annual average volume of sewage water (79,500,000 m
3).
The load of THg transported to the river Main is calculated from the volume of overflow (Vsw,river) and the concentration of THg in the sewage water (Csw = 303 ng/L) using Equation (4).
When applying the “best case scenario”, the amount of THg discharged by sewage overflow into the river Main was 0.409 kg/a and by application of the “worst case scenario” the THg load amounted to 0.819 kg/a.
3.6. Direct Discharge from Industrial WWTPs (Source No. 6)
In the study area, three industrial sites (Fechenheim, Griesheim and Hoechst) are operating their own WWTPs. These WWTPs discharge their treated wastewater directly into river Main below the water surface. Monitoring of the effluent is under control of the regional council (RP Darmstadt). Hg is routinely determined and the reported values are in general below the very high LOQ set to 0.2 µg/L by the DIN EN 1483 method. Data from Hg determinations by use of more sensitive analytical methods are not available. According to the Pollutant Release and Transfer Register (PRTR) [
26] each of the three industrial WWTPs releases less than 1 kg Hg/a into the river Main, resulting, in the worst case, in a total release of 3 kg/a. At one of the industrial sites (Hoechst) a chlor alkali electrolysis plant was operated during the time of sampling. This plant alone releases 2.5 kg Hg/a into the river Main [
27]. It is not reported whether this amount is only released by the effluent of the WWTP or also through other pathways.
3.7. Groundwater (Source No. 7)
A further possible source for Hg in the river Main is the infiltration of groundwater. This source has not been considered due to the missing availability of data. However this source can be expected to be low since south of the Main drinking water is produced from groundwater, leading to an exfiltration of river water into the aquifer rather than to an infiltration of groundwater into the Main.
3.8. Hg Mass Balance
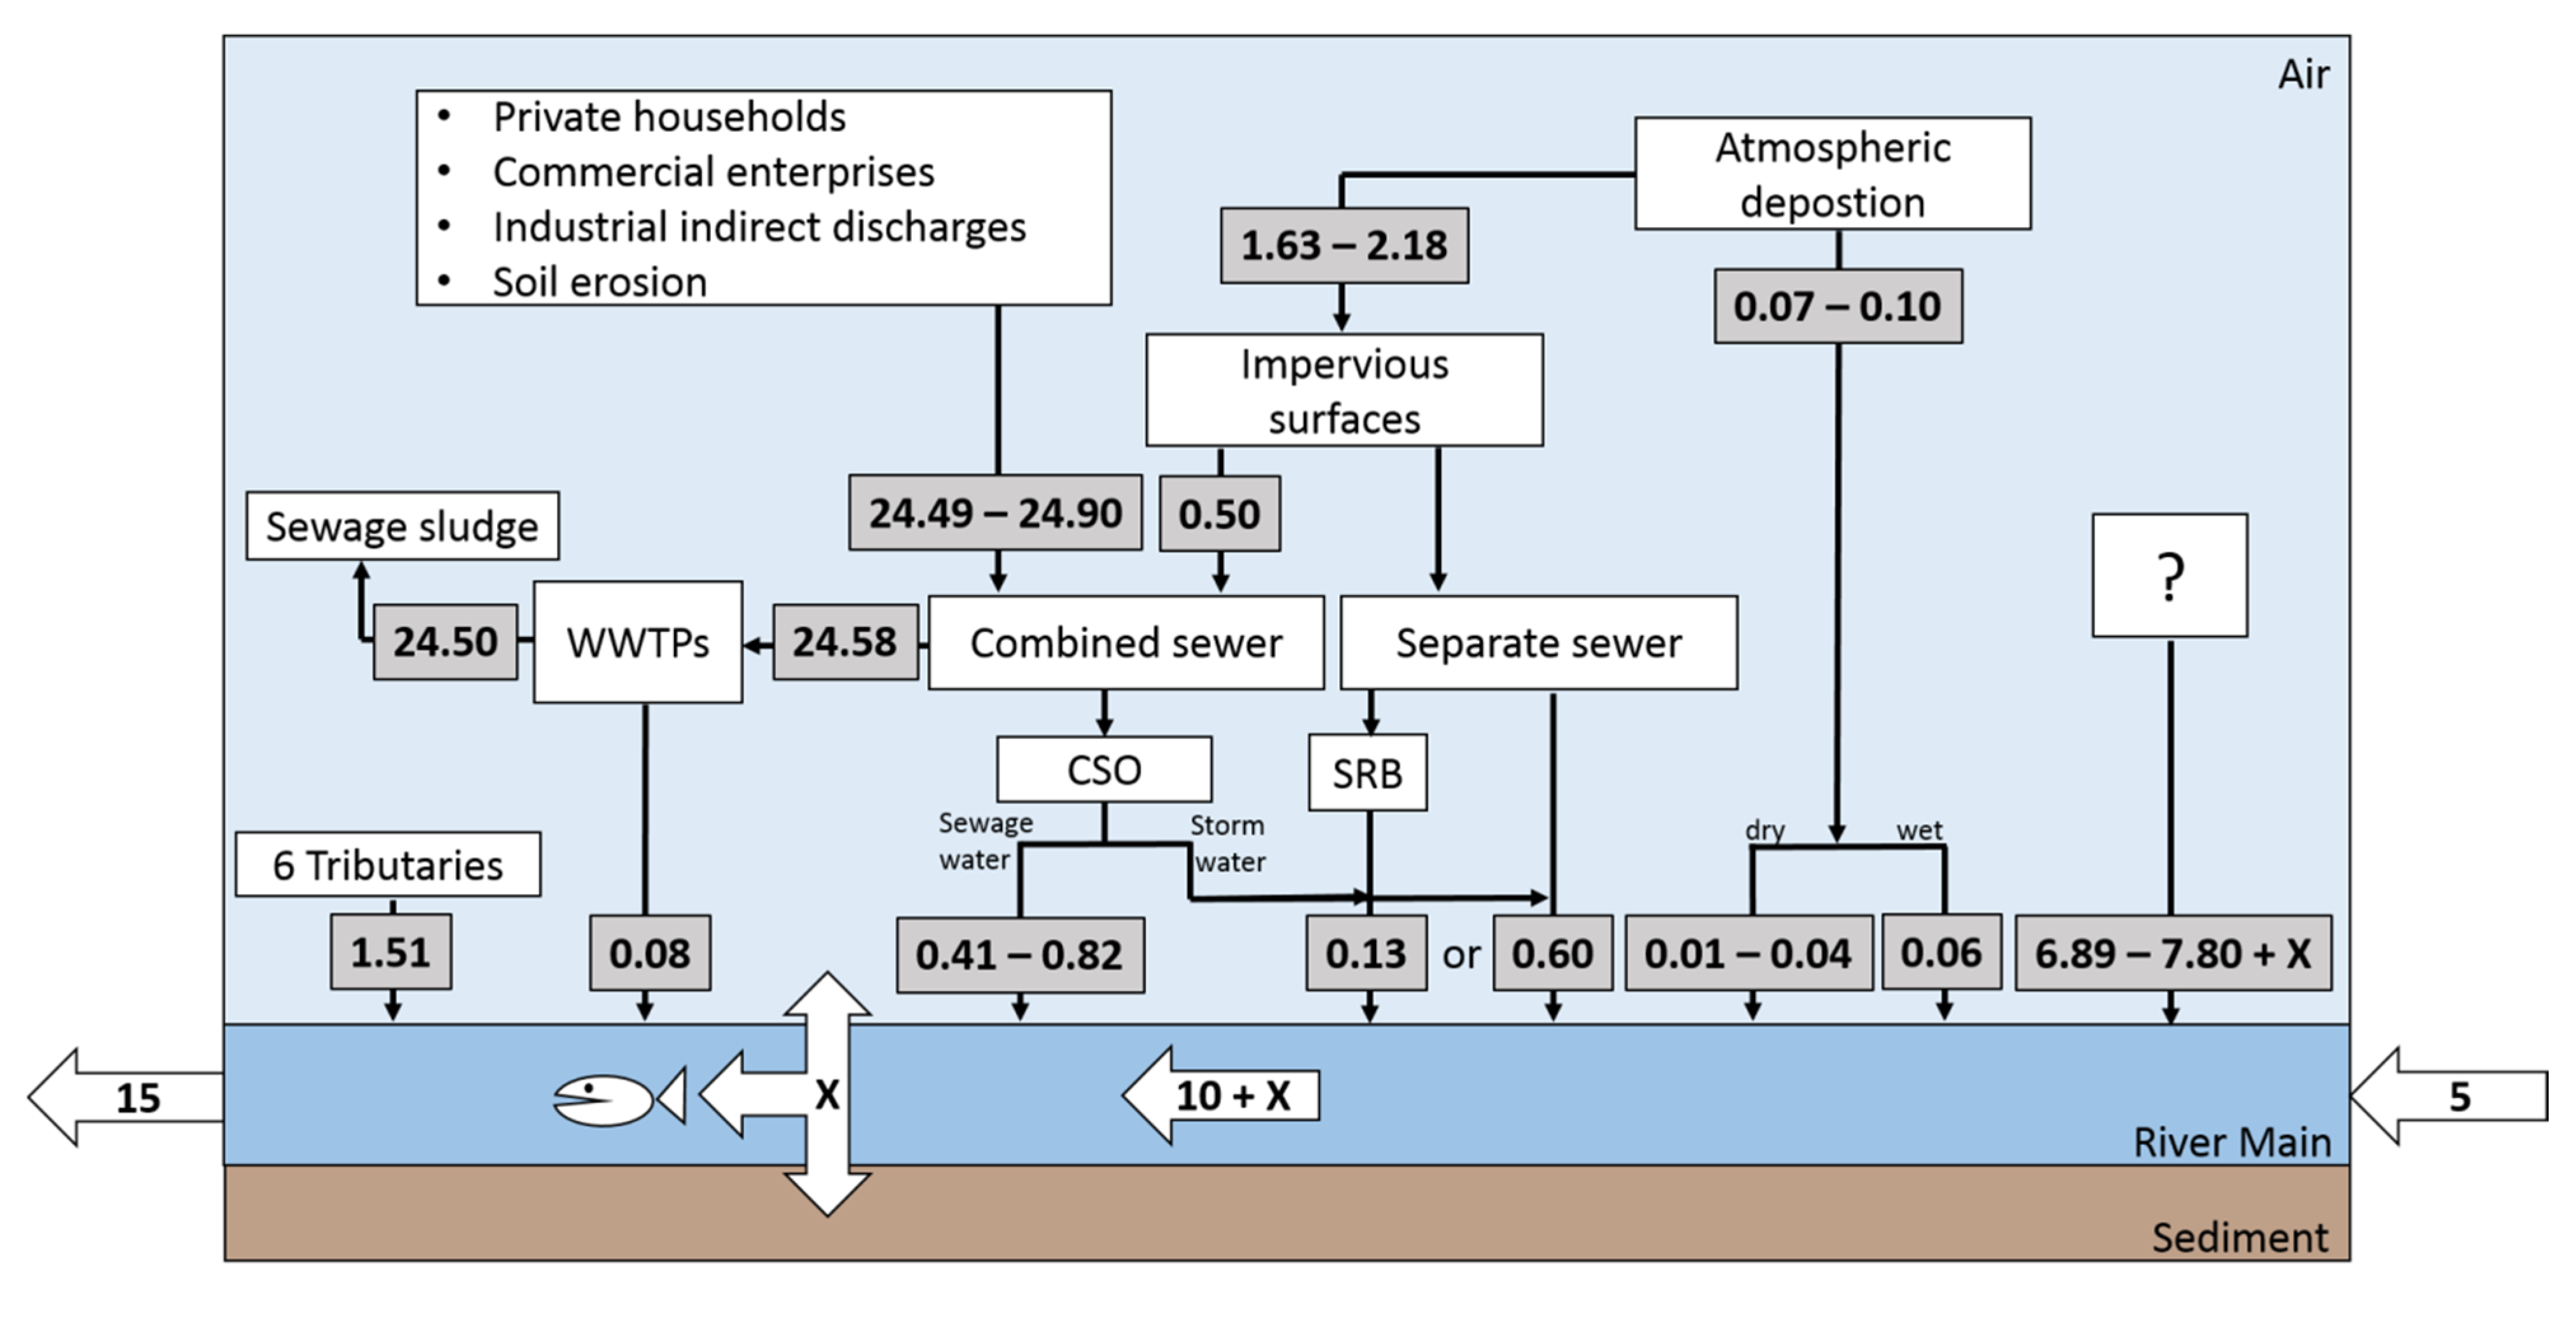
The scheme shown in
Figure 4 integrates all Hg mass fluxes in the water cycle of the river Main catchment in the study area of Frankfurt am Main. The load of the Main increases from the inflow into the study area to the outflow from 5 to 15 kg/a. Several water pathway have been analyzed to find an explanation for the observed increase. Wet deposition on the river surface contributes only 0.06 kg. Dry deposition amounts to 0.01–0.04 kg based on EMEP calculations. 0.6 kg Hg/a are added by stormwater runoff from the separate sewer system assuming that the total Hg in the runoff reaches the river. However, the runoff is collected mostly in stormwater retention basins (SRB). According to our calculations 78% of the Hg is deposited in the sediments of the retention basins and, consequently, only 0.13 kg reach the river from the runoff in the separate sewer system.
Figure 4.
Mass balance of Hg in the water cycle in the study area of Frankfurt am Main. Loads, represented by the numbers in the diagram, are given in kg/a. CSO = combined sewer overflow, SRB = stormwater retention basin.
Figure 4.
Mass balance of Hg in the water cycle in the study area of Frankfurt am Main. Loads, represented by the numbers in the diagram, are given in kg/a. CSO = combined sewer overflow, SRB = stormwater retention basin.
More abundant is the amount of Hg getting into the river from the combined sewer overflow (CSO). This depends on the amount and duration of heavy rain events thoughout the year. In order to consider the variation from year to year, two scenarios (“best case scenario” and “worst case scenario”) have been implemented. In the “worst case scenario” with an average annual overflow of 3.4%, the Hg increase would result in 0.82 kg/a. In the “best case scenario” an annual average overflow proportion of 1.7% is considered, resulting in the addition of 0.41 kg/a Hg to the river. The contribution of Hg coming from the effluents of all municipal WWTPs discharging the treated wastewater into the river Main is very low with a value of 0.08 kg/a. Six tributaries of the river Main in the study area were analyzed for THg and from the results a contribution of 1.51 kg has been calculated. The analyzed possible sources explain an increase of the Hg load in the river Main of 2.20–3.11 kg/a. As a result, for 6.89–7.80 kg/a of the load increase from 5 to 15 kg/a, other sources have to be considered. These sources are either three industrial WWTPs or infiltration of Hg from groundwater into the river or a combination of both sources. Reliable data on the contribution of industrial WWTPs are not available due to the fact that the applied analytical method for monitoring of their wastewater effluents is operating with a very high LOQ of 0.2 µg/L. According to Hofmann [
27] 2.5 kg Hg/a are contributed only by the chlor alkali electrolysis located at the industrial site Hoechst. This lowers the so far unexplainable amount of Hg getting into the river Main in the study area to 4.39–5.30 kg/a. The THg input into the river Main by effluents of the three industrial WWTPs is unknown but ranges between 0 (best case) and 3 kg Hg/a (worst case). In the worst case scenario these values would lower the unexplainable Hg load in the river Main to 1.39–2.30 kg/a. This balance gap is low considering that data from the infiltation of Hg by groundwater are not available.
A further important result from the study is the observation that about 24.50 kg Hg are annually transferred into the sewage sludge by the municipal WWTPs. Considering the measured THg concentrations in surface runoff (23 ng/L) and the total amount of surface runoff (21,500,000 m
3/a), only 0.50 kg Hg/a in the sewage can be expected to orginate from precipitation. 0.41–0.82 kg/a are transferred to the river by the combined sewer overflow and 24.49 kg/a Hg (“best case scenario”) and 24.90 kg/a Hg (“worst case scenario”) must be added to the sewer system to explain the 24.50 kg of Hg determined in sewage sludge. Possible sources for the Hg in the urban sewer system are private households, commercial enterprises, industrial indirect dischargers and soil erosion. Reisinger
et al. [
28] estimated the contribution of private households to the Hg input into the sewage to 0.02 g/inhabitant and year in Austria. When this calculation is applied to the study area of Frankfurt am Main and the adjoining muicipalities (all together about 1,000,000 inhabitants) the contribution of Hg from private households would amount to 20 kg/a in total. Sörme
et al. [
29] reported for the city of Stockholm (Sweden) an average per capita emission of Hg into the sewer system of 60 µg/day by faeces and 3 µg/day by urine. Transfer of these numbers to the City of Frankfurt am Main would result in a total emission of 23 kg/a from private households into the sewage system which is higher compared to the data provided for Austria [
28]. Dental amalgam has been proposed to be the predominant source of Hg in faeces and urine by far [
29,
30]. The Association of Metropolitan Sewerage Agencies (AMSA) reported in 2000 [
31] that in the United States, more than 80% of the mercury in residential sewer systems is sourced from dental amalgam excreted by humans and approximately 15% can be attributed to food, toiletry and household products from private households. When the calculations of Reisinger
et al. and AMSA are applied to the study area of Frankfurt am Main the contribution of Hg coming from dental amalgam from private households would amount to 16 kg/a. It is not possible to specify the contribution of the other three possible sources (commertial enterprises, industrial indirect dischargers and soil erosion) to the residual 4.49–4.90 kg Hg/a.
4. Conclusions and Future Implications
Hg has been analyzed in the water cycle of the City of Frankfurt am Main including the river Main as the dominating transport path of water in the study area. Together with the river Main, 5 kg Hg/a enter and 15 kg Hg/a leave the study area. Results of precipitation, surface water streams and the sewer system analyzed within the present study explain an increase of the Hg load into the river of only 2.20–3.11 kg/a, with the municipal WWTPs contributing only 0.08 kg/a via wastewater effluents. A very high load increase 6.89–7.80 kg/a remains unexplained. Effluents of three industrial WWTPs discharging their wastewater directly into the river below the water table and the contribution from groundwater infiltration could not be analyzed. The contribution of both sources has to be elucidated in future studies.
Municipal WWTPs were revealed to be the dominating sink for Hg in the urban water cycle, since Hg is almost completely (99.7%) transferred into the sewage sludge. Only 0.5 kg/a of the 24.5 kg/a of Hg precipitated in the sewage sludge originate from precipitation, and drinking water in Frankfurt am Main contributes 0.033 kg. Thus, the majority of the amount of Hg in the sewer system must originate from domestic sewage, commercial enterprises, industrial indirect dischargers and soil erosion. According to data provided in previous studies [
29,
30,
31], feaces and to a minor extent urine are contaminated with dental amalgam and have to be regarded as a major source of Hg in the domestic sewage. Further studies have to clarify whether such high proportions of Hg in domestic sewage systems originating from dental amalgam coming from private households are still present. Dental surgeries are nowadays equipped with amalgam precipitators and should be of minor importance.
The results of the present study contradict the results coming from the MONERIS model regarding the point and diffuse mercury emissions into the aquatic environment based on the balance period 2003–2005 [
2]. The major difference is visible with respect to the contribution of municipal wastewater treatment plants, which transfer most of the mercury from the wastewater into the sludge and not into the rivers.
Furthermore, the obtained data allows us to assess the effectiveness of the combined sewer system in comparison to the separate sewer system with respect to the elimination of Hg from sewage and stormwater. Assuming that the study area of Frankfurt am Main would be equipped only with a separate sewer system, the Hg load of surface runoff would be completely transferred to the river. This would cause an additional 0.5 kg/a to be discharged directly into the river. On the other hand, the sewage water overflow from the combined sewer system during heavy rain events that currently discharges 0.41 kg Hg/a (“best case scenario”) and 0.82 kg Hg/a (“worst case scenario”) into the river Main would not take place when using only a separate sewer system. In the “best case scenario”, the transfer of Hg to the river Main is lower by 0.09 kg/a (= 0.50 kg/a–0.41 kg/a) in the currently applied sewer system (75% combined, 25% separate) in comparision to a (hypothetical) separate sewer system for the whole city. In the “worst case scenario”, the amount of Hg discharged into the river Main would decrease by 0.32 kg/a (= 0.50 kg/a–0.82 kg/a) by switching from the actually applied sewer system to a separate sewer system. These calculations show that the upgrade of the whole city with a separate sewer system would cause no significant improvement with respect to the Hg input into the river. The advantage of the combined sewer system is the higher proportion of Hg transfer from the surface runoff into the sewage sludge during water treatment in the WWTPs. The disadvantage of the combined sewer system is that during heavy rain events, part of the sewage water and its Hg load will be transferred into the river.


