Article

Agricultural Best Management Practice Abundance and Location does not Influence Stream Ecosystem Function or Water Quality in the Summer Season

Department of Geography, Western University & Canadian Rivers Institute, 1151 Richmond Street, London ON N6A 5B7, Canada
*
Author to whom correspondence should be addressed.
Water 2015, 7(12), 6861-6876; https://doi.org/10.3390/w7126661
Submission received: 15 October 2015 / Revised: 20 November 2015 / Accepted: 26 November 2015 / Published: 4 December 2015
(This article belongs to the Special Issue BMP Development, Implementation, and Performance)

Abstract

:
Best management practices (BMPs) are tools commonly used to mitigate negative impacts of agriculture on water quality; however, the relationship between BMPs and aquatic ecological function is unknown. Our research goal was to determine the association between both stream ecosystem metabolism and water quality, and the abundance and location of four different BMPs in agricultural catchments. Dissolved oxygen was measured over a two-week period in mid-June and used to estimate ecosystem metabolism of 13 headwater streams representing a gradient of BMP implementation in Southern Ontario, Canada. Stepwise regression analyses were used to associate stream metabolism and water quality with metrics describing the abundance and location of BMPs within each catchment. Studied streams exhibited rates of metabolism comparable to catchments from other agricultural regions. However, metrics of BMP implementation were not associated with either stream metabolism or water quality. Our results suggest that BMPs in the studied agricultural catchments are not improving water quality or mitigating water quality impacts on stream metabolism during the summer season. We propose that seasonality of catchment hydrology and time lag effects associated with past agricultural land use may be masking the mitigation benefits of BMPs on stream ecosystem conditions during the summer season.

1. Introduction

Streams draining catchments dominated by agricultural land uses are often exposed to a variety of non-point source contaminants known to degrade water quality and alter key stream ecosystem processes [1]. Agricultural practices can release nutrients and sediments to streams in agricultural areas through use of fertilizers, soil tillage, livestock husbandry and grazing [2,3,4]. Nutrients from fertilizers and animal waste (i.e., nitrogen and phosphorus) are essential limiting resources for the growth of aquatic vegetation and elevated inputs from agricultural sources have been reported to increase primary productivity in streams [5]. Excess primary productivity may cause periodic hypoxic conditions at night due to plant respiration, as well as from heterotrophic respiration following the die off of plant biomass, stressing ecological communities [6]. However, agricultural practices also have the potential to limit primary production through increased sediment loading and associated reductions in water clarity limiting light penetration to benthic habitats [7]. Growing evidence of the impacts of agriculture on the health of receiving streams and associated downstream ecosystems has made the need to implement effective management strategies to mitigate agricultural effects a major issue in agricultural regions worldwide [8].
In response to the growing recognition of the economic and environmental consequences of nutrient and sediment release from agricultural lands, managerial and structural conservation strategies, or Best Management Practices (BMPs), have been developed to help mitigate the effects of these common stressors. Structural BMPs are designed to reduce loss of pollutants to aquatic ecosystems by enhancing filtration, cementation, and uptake of pollutants in runoff on, or at the edge, of agricultural lands [9]. Common structural BMPs include planting and maintenance of riparian buffer strips, livestock exclusion fences, manure storage facilities, and erosion control structures. Additionally, structural BMPs can be strategically implemented in locations identified as significant contributors of surface water pollutants to help maximize mitigation effects [10,11,12,13].
Many past studies have examined the effectiveness of BMPs in mitigating the impacts of agriculture at small scales and noted improved quality of agricultural runoff [14,15,16]. However, past studies exploring the relationship between BMPs and stream ecological condition have shown more equivocal results, despite also frequently reporting reduced concentrations of nutrients and sediments associated with BMP use [14,15,17,18,19,20,21]. To date, past studies have largely focused on taxonomic based measures of community condition, particularly aquatic invertebrates. However, potential for rehabilitation of ecological diversity in agricultural streams may be limited by historical depletion of the regional species pool frequently associated with widespread human activity [22,23,24]. As such, ecological benefits associated with BMP use may be most apparent in rehabilitation of ecological processes, such as nutrient dynamics and organic matter input, that are more directly linked to the nutrient and sediment input rates that BMPs are designed to manage [25]. There has, however, been limited examination of the response of river ecosystem processes, such as stream metabolism, to the implementation of BMPs.
Stream metabolism is the combination of primary productivity and ecosystem respiration and is thus a measure of the balance between production and consumption of organic matter in a stream. As such, stream metabolism is a critical ecological process providing insight into ecosystem biomass and trophic dynamics [26,27]. Combined, gross primary productivity (GPP) and ecosystem respiration (ER) can be used to determine the Net Ecosystem Metabolism (NEM; NEM = GPP − ER) and the production to respiration ratio (P/R; P/R = GPP/ER) of the stream. These parameters indicate the trophic status (i.e., net heterotrophic or net autotrophic) of a stream providing an estimate of the food base and the flow of energy at a catchment scale [27]. Stream metabolism has been widely recommended as a biological indicator to assess the functional status of riverine environments [27,28,29]. Furthermore, the response of stream metabolism to key stressors commonly associated with agricultural activities (i.e., temperature, sediment, nutrient concentration, and organic matter) has been extensively analyzed and reviewed [27]. Stream metabolism is thus very well suited to serve as an indicator of the response of stream processes to mitigation effects of agricultural BMPs.
The goal of this study was to examine the mitigation effects of agricultural BMPs on water quality and stream metabolism in the summer season. This goal was achieved by assessing variation in stream water quality and ecosystem metabolism among agricultural headwater streams and associating these ecosystem metrics with the number and location of four common structural BMPs (i.e., manure storage facilities, livestock access restriction fences, erosion control structures, and riparian buffers) present in each catchment. It was predicted that headwater catchments containing a larger number of BMPs and BMPs located within areas of greater connection to hydrologic flow routes would show improved ecosystem condition, as indicated by decreasing concentrations of nutrients and sediments, as well as rates of stream metabolism.

2. Materials and Methods
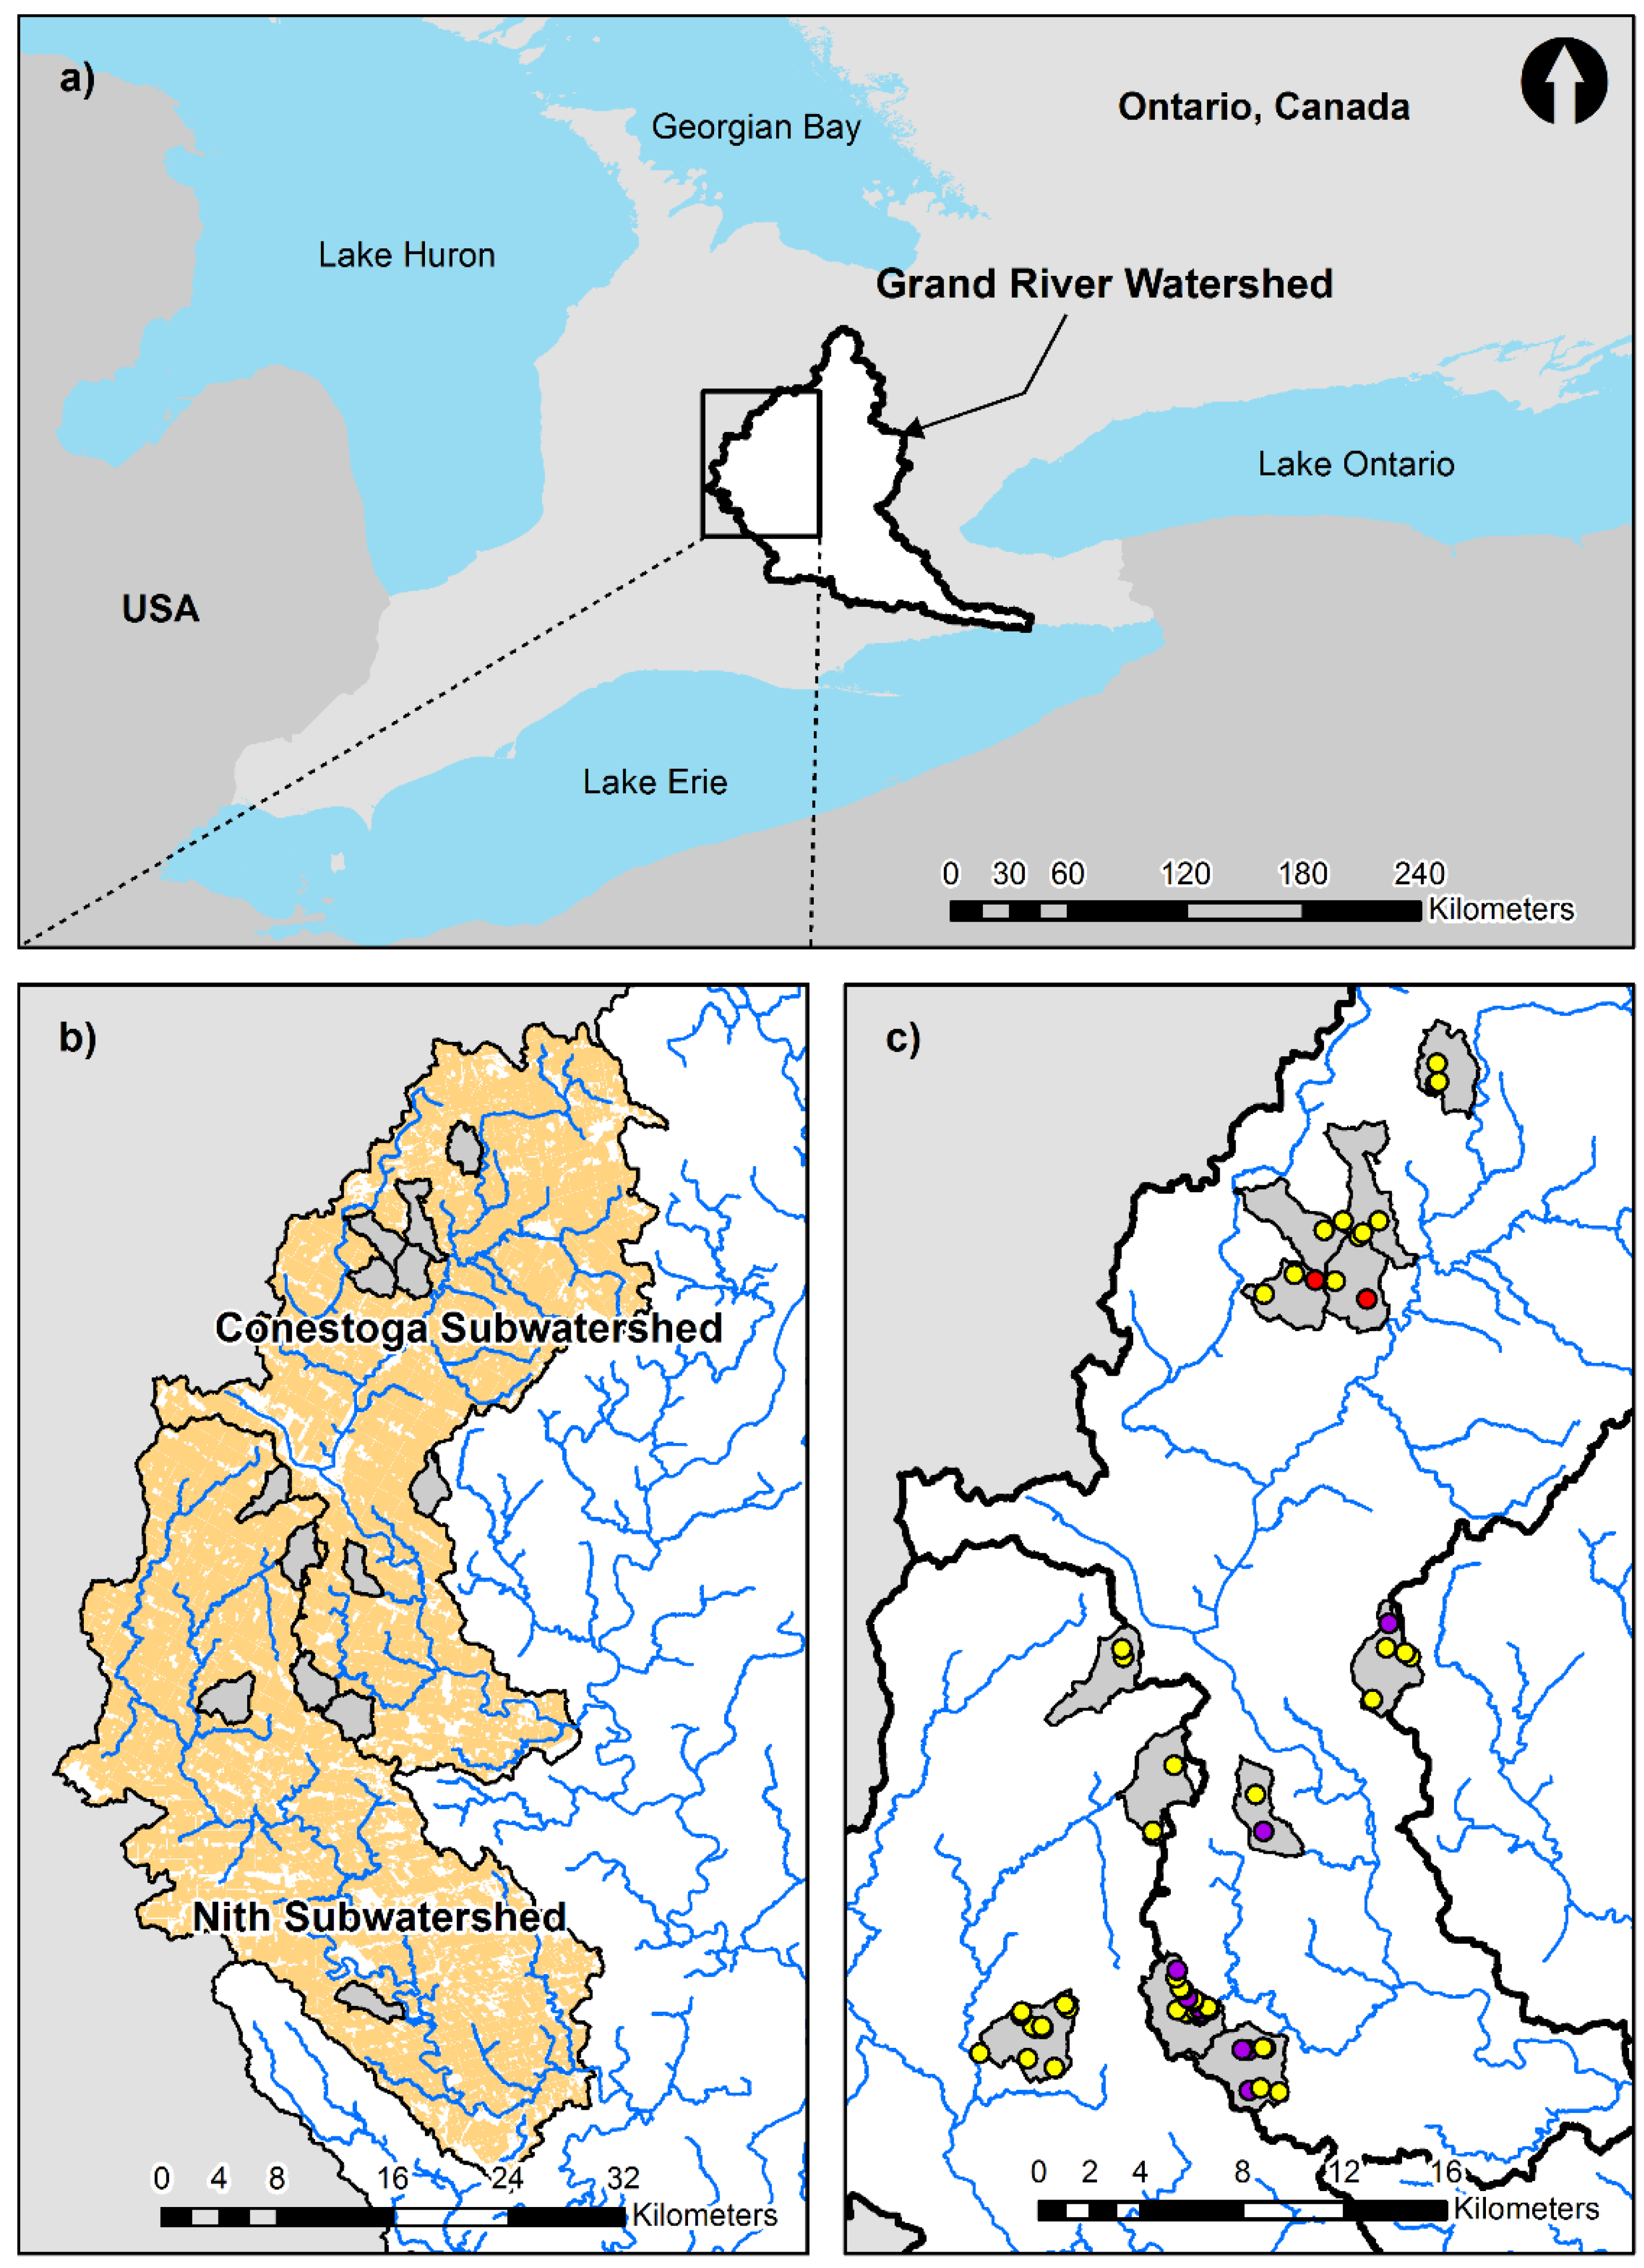
2.1. Study Area

Our study was situated within the Grand River Watershed (GRW), which is located in Southwestern Ontario, Canada (Figure 1a). The watershed covers an area of approximately 7000 km2 containing the major urban centers of Kitchener, Waterloo, Guelph, Cambridge, and Brantford. Settlement in the GRW occurred in the early 1800s along with the onset of deforestation and agricultural practices. Agricultural practices intensified from the 1960s onward with the introduction of synthetic fertilizers and pesticides. Contemporary land use patterns in the GRW continue to be dominated by agriculture, covering approximately 80% of the landscape, with fragmented, natural vegetation covering about 19% of the total area [30]. Major agriculture types in the watershed include a combination of cash crops (i.e., soybeans and corn) and livestock operations (i.e., dairy cattle, beef, hog, and poultry) [31]. Climate in the GRW is temperate, with the central area (43.45° N, 80.38° W) having an average annual temperature, precipitation, and relative humidity of 7.0 °C, 916.5 mm, and 87.8%, respectively [32].
Figure 1. Map showing the location of the Grand River Watershed within the Great Lakes region of North America (a); and locations of the 13 headwater study catchments (grey) within the Nith and Conestoga subwatersheds of the Grand River Watershed (b). Map showing examples of the distributions of analyzed BMPs (Yellow: manure storage structure, Purple: livestock access restriction fence, and Red: erosion control structure) within study catchments (c). Orange surface areas represent agricultural land use.
Water 07 06661 g001

Site Selection and BMP Description

For our study, 13 sampling sites were established on small agricultural streams within the headwaters of the Nith and Conestoga subwatersheds (Figure 1b,c). Both subwatersheds are characterized by an agricultural landscape (~83% agriculture), till soils (~76% of the soils), and a flat to rolling topography [33]. Study sites were selected to incorporate regional variation in BMP employment and comparable physiography and land cover among the catchments. Selected catchments were limited to those with areas between 5 and 12 km2, till based soils (>65%), low natural (<25%) and urban (<5%) land covers, high agricultural (>85%) land use, locations accessible for sampling, and those with streams unimpeded by dams or other structures. The streams selected for sampling have not been subject to routine chemical or ecological monitoring in the past and thus historical or pre-BMP data was not available.
This study focused on four structural BMPs: (1) manure storage systems (MS); (2) livestock access restrictions (LAR); (3) erosion control structures (EC); and, (4) riparian buffer areas (RBA) (Table 1). Structural BMPs have the advantage of being able to be strategically located on the landscape in hydrologically connected areas to maximize mitigation benefits. Furthermore, these BMPs are readily identifiable on the landscape using orthoimages. BMPs in the study area were predominantly implemented through collaboration between landowners and the Rural Water Quality Program administered by the Grand River Conservation Authority (GRCA). BMPs in this database were located in the study catchments using a Geographic Information System (GIS). Additional BMPs implemented by individual farmers were identified using high-resolution (0.5 m) orthoimages [34]. Sampling sites encompassed the full range of BMP abundance and location of the four different BMPs present in the region.
Table 1. Descriptions and expected benefits of four structural best management practices included in this study.
NameAcronymDescriptionExpected Benefits
Manure StorageMSImpermeable structures designed to store livestock manureReduction in non-point organic matter and nutrient pollution
Livestock Access RestrictionLARFences constructed adjacent to waterways preventing livestock from disturbing stream channelsReduction in organic matter, nutrient, and sediment inputs
Erosion ControlECStructures preventing soil erosion by wind and/or waterReduction in sediment and particulate nutrient inputs
Riparian Buffer AreaRBAArea of vegetation either planted or left intact within a 30 m buffer on either side of a watercourseReduction in non-point organic matter, nutrient, sediment, and other contaminant inputs
A set of BMP metrics were calculated for each of the 13 selected catchments based on the type and location of BMPs present in the catchment (Table 2). Abundance descriptors included # of BMPs per farm, % RBA, length of LAR, % river with LAR, and % river protected. Location was characterized by hydrologic distance to stream, hydrologic distance to sampling point, flow accumulation, and % flow accumulation. The calculated BMP metrics were placed into one of two groups, BMP summary and BMP type. The BMP summary group consisted of five metrics that were calculated as a summation of all BMPs (i.e., MS, LAR, and EC) present in the catchment, excluding riparian area. In the BMP type group there was a total of 28 metrics describing the abundances and locations of the individual BMP types (i.e., MS, LAR and EC) within the catchments. The extent of RBAs was also included in the BMP type group as a metric describing the vegetated proportion of the total riparian area. Location based metrics were not calculated for RBAs due to difficulties in differentiating the stream channel from the riparian zone given the small stream channel widths (<2 m) and level of resolution available for land cover and DEM layers. EC metrics were not individually examined because of low abundance (n = 2); however, EC BMPs were included in the BMP summary group metrics.
Table 2. BMP metrics and associated descriptions used to quantify abundance and location of agricultural BMPs in small catchments in southern Ontario.
Metric TypeMetric NameDescriptionApplicable BMPs
BMP AbundanceStructural BMP(s) per farmRatio of BMP abundance to the number of farms within a catchmentMS, LAR, EC, BMP summary
% Riparian vegetationPercentage of riparian vegetation present in a 30 m buffer area around the stream networkRBA
Length of LARLength of LAR adjacent to the streamLAR
% River with LARProportion of the stream length with LAR adjacentLAR
% River protectedProportion of the stream with either LAR and/or riparian vegetation adjacentRBA & LAR
BMP LocationHydrologic distance to streamOverland distance from BMP to stream channelMS, LAR, EC, BMP summary
Hydrologic distance to sampling pointCombined overland and instream distances water must travel from BMP to sampling siteMS, LAR, EC, BMP summary
Flow accumulationCatchment area that contributed surface runoff to BMPMS, LAR, EC, BMP summary
% Flow accumulationThe summed area contributing surface runoff to BMPs divided by the total catchment areaMS, LAR, EC, BMP summary

2.2. Field Sampling

Daily rates of stream metabolism were estimated at our 13 study sites from instream dissolved oxygen (DO) measurements collected over a two-week period (10 June to 26 June) in summer of 2014. An early summer sampling period was chosen in order to encompass a time period where plants in both aquatic and terrestrial systems were expected to be actively growing [35]. Concentrations of DO were recorded at 15-minute intervals over the two-week sampling period using a D-Opto logger (Zebra-Tech Ltd). Stream metabolism was estimated for each study reach using the open-system, single station method [36]. In this method a single DO logger is used to measure DO changes over time at a specific point along the study reach. The DO change is assumed to be uniform throughout the upstream reach. Therefore, potential drivers occurring along this reach are presumed to influence metabolism measurements. Probe deployment followed the recommendations of Grace and Imberger [36]. Logger malfunction at one site resulted in this site being excluded from analyses leaving 12 sites included in the study.
To determine whole stream metabolism of each study site, the nighttime regression method was used to calculate the reaeration coefficient (k) as recommended by Young et al. [37]. This regression was performed using the River Metabolism Estimator v1.2 spreadsheet macro in Microsoft Excel v14.4.6 [38] developed by Young and Collier [39]. Regressions were considered reliable if the calculated k coefficient was positive, and the value of R2 was greater than 0.4 [sensu 39]. Abiding to these constraints, the calculation of the k coefficient for one site was modified due to the occurrence of weak R2 values in the nighttime regressions throughout the sampling period. As the recorded data appeared reliable, the k coefficient of this site was determined using the O’Connor-Dobbins empirical equation as recommended by Young et al. [37] for streams with relatively low reaeration coefficients (i.e., <50 day−1). Calculated k coefficients were used to determine daily values of gross primary production (GPP) and ecosystem respiration (ER) based on the following general equation:
Δ DO = GPP R + k ( D )
where ΔDO is the change in DO concentration (g O2 m−3) over the 15 min interval, GPP is volumetric GPP (g O2 m−3), R is volumetric ER (g O2 m−3), k is the oxygen reaeration coefficient, and D is the DO deficit (g O2 m−3) over the measurement interval. Rates of GPP and ER were then corrected and standardized into areal daily rates using equations 45 through 49 from Grace and Imberger [36]. Two other metabolism parameters were used to describe the relationship between GPP and ER, the NEM and the P/R ratio. NEM was calculated as the difference between the values of GPP and ER and the P/R ratio was calculated as the quotient of GPP over ER. Daily values of the calculated metabolism parameters (i.e., GPP, ER, NEM, and P/R) from all reliable sampling days were then averaged by site to give an estimation of metabolism rates for the two-week sampling period.
Physicochemical characteristics of each stream were assessed and recorded at the time and location of logger deployment. Measurements collected were nutrients, pH, conductivity, flow velocity, channel depth, channel width, discharge, temperature, and canopy cover. Instream nutrients were measured twice at each of the 13 study reaches by collecting grab water samples at the time of logger deployment and retrieval. Samples were collected according to the Canadian Aquatic Biomonitoring Network (CABIN) protocol [40] and analyzed for nitrogen and phosphorous species (i.e., total nitrogen (TN), ammonium (NH4), nitrite and nitrate (NO2-NO3), total phosphorus (TP), total dissolved phosphorus (TDP), and soluble reactive phosphorus (SRP)) using a flow injection analysis [41]. Water samples were also analyzed for turbidity and the amount of total suspended solids (TSS) following the nephelometric method and a standard dry weighting method, respectively [41]. pH and conductivity were measured in a well-mixed area of each reach using a Hoskin Scientific Professional Plus Probe (Model: Pro 10102030). Flow velocity was measured at a series of evenly spaced points (0.1 m or 0.2 m increments channel width pending) across a bank to bank transect perpendicular to the thalweg with a current velocity meter (Swoffer Instruments Inc. Model: 2100). Measurements were averaged to provide an overall estimate of velocity for each sampled reach. The channel cross-sectional depth was measured using a similar approach. Stream depths were measured from 10 evenly spaced points across five transects spaced 10 m apart upstream of the logger. The depths from all measured points along each reach were then averaged to provide an estimate of the average stream depth along the study reach. Stream water temperature at each site was recorded every 15-min alongside the DO measurements by the D-Opto logger. Temperature measurements were averaged over the entire sampling period as descriptors of each site. The immediate riparian canopy coverage of each site at the location of the D-opto logger was measured using a densiometer (Forestry Suppliers Inc. No. 43888). Canopy measurements were taken in the middle of the stream channel at waist height at the most downstream, middle and most upstream transect locations. Measurements of the proportion of canopy cover were taken facing the upstream, downstream, right bank, and left bank directions. All 12 canopy measures were averaged for the site as an overall measure of reach canopy cover.

2.3. Data Analysis

Stream metabolism may be affected by a variety of external environmental variables that can mask the potential influence of BMPs. In small, low flow streams proximate variation in light availability is known to be an important factor that can alter the local metabolism rates [42]. Thus, in order to isolate the potential impact of BMPs on stream metabolism rates for among site differences in channel shading of the sampling reach, the effect of light availability was removed by calculating the residuals of the relationship between the canopy cover metric, and both GPP and ER stream metabolism metrics using a least squared regression analysis. Residuals from these regressions were outputted as the new values for each metabolism parameter for use in further statistical analyses. These regressions were completed using SYSTAT 13 v.13.00.05 [43].
Calculated BMP metrics were assessed for collinearity within the BMP summary and type groups. A variance inflation factor (VIF) >5 was set as the threshold for metric collinearity (VIFx = 1/1 − Rx2). The same procedure was used to assess collinearity amongst water quality parameters (i.e., TN, NH4, NO2-NO3, TP, TDP, SRP, turbidity, and TSS). The collinearity analysis was performed in SYSTAT 13 v.13.00.05 [43].
Multiple least squared regression analysis was used to determine the strength and direction of the association between the non-collinear BMP metrics and the stream metabolism residuals, as well as water quality parameters, for the sampled catchments. Separate regression analyses were performed on each residual metabolism metric and water quality species with each of the BMP metric groupings (i.e., BMP summary and BMP type) serving as independent predictive variables in their respective analyses. For the analysis, a backwards-stepwise regression method was used (confidence interval = 0.95; probability = 0.10). Regression models were considered significant if p < 0.10. This method was also used to determine the association between the stream metabolism residuals and the non-collinear water quality parameters. To reduce the likelihood of TYPE I error associated with stepwise regressions we followed recommendations by Blanchet et al. [44] and first tested the statistical significance of a global model and ensured that the resultant R2 from the stepwise process was not larger than that of the global model. Non-significant global models were not analyzed further using stepwise analyses. Regression analyses were performed in SYSTAT 13 v.13.00.05 [43].

3. Results

The majority of measured physical parameters exhibited minimal variation among the study catchments (i.e., CV < 0.5; Table 3). Sampled headwater streams were similar in regards to average channel depth (mean = 0.14 ± 0.06 m), average channel width (mean = 1.65 ± 0.56 m), water temperature (mean = 17.96 ± 1.42 °C), pH (mean = 7.87 ± 0.27) and conductivity (mean = 575.84 ± 87.74 µS/cm). However, flow velocity, discharge and canopy cover revealed greater variation among sites (i.e., large = CV > 0.5). Flow velocity ranged from <0.01 m/s to 0.13 m/s, with a mean velocity of 0.05 m/s. Average discharge was 0.02 m3/s and ranged from <0.01 m3/s to 0.05 m3/s. Canopy cover ranged from a minimum of 6.92% to a maximum of 85.75% cover. Mean canopy coverage was 29.27%. Water quality parameters (i.e., TN, NH4, NO2-NO3, TP, SRP, TDP, turbidity, and TSS) sampled during logger deployment and retrieval generally exhibited large variation among the study catchments. The exception was TN concentrations collected at logger retrieval (CV = 0.33). Furthermore, concentrations of all examined nutrient species and TSS were at least 1.3 fold different between sampling events with samples taken during logger retrieval having a consistently larger mean, median, maximum, and standard deviation among sites.
A total of 60 BMP structures were identified in our 13 study catchments. This total consisted of 40 MS structures, 18 LAR fences, and 2 EC structures (Table 4). The total number of BMPs per study catchment ranged from 1 to 16 with an average BMP implementation of 4.62 structures per catchment. On average each catchment contained 3.08 MS structures, 1.38 LAR fences, and 0.15 EC structures. Average BMP use was less than one BMP per farm (mean = 0.41). BMP implementation was on average 0.29, 0.09, and 0.02 BMPs per farm for MS, LAR, and EC, respectively. Abundance metrics of LAR and EC structures exhibited larger variation among the study sites, as these BMPs were less common and not found in all catchments. Of the 13 study catchments selected, LAR fences were present in six and EC structures in two. BMP location showed substantial variation in regards to the flow accumulation area and hydrologic distance from the BMP to the river in both the BMP summary and BMP type groups, with the exception of LAR flow distance to the river (CV = 0.46). In contrast, location metrics involving the hydrologic distance from the BMP to the instream sampling point exhibited minimal variation among the catchments for all BMP metrics except EC (CV = 0.76). The length of LAR adjacent to the stream was variable among catchments and ranged from 63 m to 2846 m (CV = 1.03). Likewise, the percentage of river protected by LAR structures exhibited a large variation among catchments (CV = 1.65). The percentage of RBA surrounding the study streams ranged from 0% to 42% among the catchments with an average of 20%. Combining the proportion of river protected through LAR and RBA, the minimum percentage of protected channel length was 5% and the maximum was 61%.
Table 3. Descriptive statistics for physico-chemical parameters collected from 13 study streams. Water quality parameters were measured during logger deployment (shaded rows) and after the sampling period during logger retrieval (unshaded rows). Values of <0.01 indicate concentrations or velocities below detection limits.
Site CharacteristicMean Min.Max.Med.St. Dev.CV
Average stream depth (m)0.140.060.270.120.060.42
Average stream width (m)1.650.852.861.590.560.34
Flow velocity (m/s)0.05<0.010.130.030.061.07
Discharge (m3/s)0.02<0.010.050.010.021.04
Temperature (°C)17.9615.8019.8817.991.420.08
Canopy cover (%)29.276.9285.7525.0822.500.77
pH7.877.528.377.860.270.03
Conductivity (µS/cm)575.84472.00753.00551.0087.740.15
TN (N mg/L) 1.990.754.681.871.110.56
3.391.565.803.381.120.33
NH4+ (N mg/L)0.070.010.460.030.121.73
0.30<0.012.620.040.732.41
NO2–NO3 (N mg/L)1.120.094.000.521.201.07
2.200.064.082.331.360.62
TP (P mg/L)0.220.020.920.070.301.37
0.320.021.700.080.461.47
SRP (P mg/L)0.15<0.010.710.020.251.62
0.210.011.240.050.351.63
TDP (P mg/L)0.160.010.680.030.231.50
0.220.011.130.060.321.49
Turbidity (NTU)7.751.5327.463.977.700.99
7.571.1024.274.937.681.02
TSS (mg/L)7.532.4025.604.406.600.88
10.161.6028.535.209.380.92

3.1. VIF Analysis

Of the five metrics in the BMP summary group, none were found to be collinear (i.e., BMPs/farm, BMP % flow accumulation, BMP mean flow accumulation, BMP flow distance to sampling point, and BMP flow distance to river). In the BMP type grouping 19 of 28 metrics were found to be collinear, leaving only nine remaining metrics for further analysis, which included MS/farm, MS median flow accumulation, MS % flow accumulation, MS flow distance to sampling point, MS flow distance to river, LAR/farm, LAR median flow accumulation, LAR % flow accumulation, and % RBA. Among the water quality parameters, all phosphorus species were collinear leaving six of eight independent variables for further analysis including TN, NH4, NO2-NO3, TP, turbidity, and TSS.
Table 4. Descriptive statistics of BMP metrics for the 13 sampled catchments. BMP descriptions are separated based on metric grouping (i.e., BMP summary or BMP type).
BMP MetricCountMeanMin.Max.Med.SDCV
BMP Summary
# of BMPs (w/o RBA)604.621.0016.003.004.370.95
BMP per farm 0.410.120.940.350.240.59
BMP dist. sampling point (m) 34571883523434669990.29
BMP dist. river (m) 44810610203373300.74
BMP flow accumulation (m2)Mean2803113991793333061.18
%0.129.0×10−50.812.0×10−30.262.16
BMP Type
# of MS403.081.008.002.002.400.78
MS per farm 0.290.080.620.290.150.52
MS dist. sampling point (m)Mean356219405234346610740.30
Med.365717555234354410630.29
MS dist. river (m)Mean55612216943024690.84
Med.53410916942714740.89
MS flow accumulation (m2)Mean7244429214008031.11
Med.5643324083086751.20
%1.2×10−31.9×10−50.015.3×10−41.7×10−31.43
# of LAR181.380.008.000.002.361.71
LAR per farm 0.090.000.470.080.141.49
LAR dist. sampling point (m)Mean272018274651217311020.41
Med.269717534651214911230.42
LAR dist. river (m)Mean734513662330.46
Med.684313657350.51
LAR flow accumulation (m2)Mean760648919789655372650.96
Med.375048910838195839921.06
%0.261.5×10−30.810.080.351.34
Length of LAR (m) 107863284687111091.03
% river protected—LAR 0.040.000.200.000.061.65
# of EC20.150.001.000.000.382.44
EC per farm 0.020.000.170.000.062.45
EC dist. sampling point (m)Mean322614824969322624660.76
Med.322614824969322624660.76
EC dist. river (m)Mean7175313817179391.31
Med.7175313817179391.31
EC flow accumulation (m2)Mean71173001393371.1796.401.35
Med.71173001393371.1796.401.35
%0.310.010.600.310.421.38
% RBA 0.200.000.420.170.150.75
% river protected—LAR + RBA 0.290.050.610.220.170.59

3.2. Stream Ecosystem Metabolism

Estimated k coefficients were moderately variable among catchments (CV = 0.53) and had a mean value of 21.99 day−1 (Table 5). The calculated magnitudes of mean daily GPP and ER exhibited more variation than did the k coefficients and both varied approximately 40-fold across the study sites. GPP rates ranged from 0.88 to 35.93 g O2/m2/day with a mean of 11.75 g O2/m2/day for all selected sites. ER occupied a comparable range from 0.73 to 26.78 g O2/m2/day and had an average of 11.11 g O2/m2/day. Sites were typically production dominated (GPP > ER) with an average NEM of 0.64 and P/R ratio of 1.48. However, negative NEM values and P/R values of less than one were observed at 4 of the 12 study catchments.
GPP and ER were negatively associated with the amount of riparian canopy cover at each sampling site. GPP exhibited the strongest association with canopy cover having an R2 value of 0.342 (n = 12, p = 0.027), whereas ER had an R2 value of 0.169 (n = 12, p = 0.102). Based on the significance of the relationships between canopy cover, and GPP, residuals were used in subsequent regressions concerning GPP. Despite the lack of statistical significance between canopy cover and ER, we considered there to be sufficient variance in ER explained by light availability to warrant using residuals in further regressions regarding ER.
Table 5. Summary of the reaeration coefficient (k), gross primary productivity (GPP), ecosystem respiration (ER), net ecosystem metabolism (NEM), and production to respiration ratio (P/R) of 12 headwater streams in the Grand River Watershed.
Metabolism ParameterMeanMin.Max.MedianSt. Dev.CV
k (day−1)21.996.4144.8417.7711.750.53
GPP (gO2/m2/day)11.750.8835.938.4510.670.91
ER (gO2/m2/day)11.110.7326.789.028.950.81
NEM (gO2/m2/day)0.64−5.829.161.224.206.53
P/R1.480.396.491.181.621.09
Global regression analyses between stream metabolism residuals (i.e., GPP and ER) and BMP summary metrics showed that BMP abundance and location did not explain a significant amount of variation in stream metabolism among the study catchments. Furthermore, global models between stream metabolism residuals and BMP type metrics also showed no significant associations. Similarly, global regression analyses between water quality parameters (i.e., TN, NH4, NO2-NO3, TP, SRP, TDP, turbidity, and TSS) and both BMP summary and type metrics revealed non-significant results. Lastly, the results of global regression models between stream metabolism residuals and non-collinear water quality parameters also revealed no significant associations.

4. Discussion

Ecosystem metabolism of streams draining agricultural land is known to be elevated due to the impact of cultivation related stressors, such as increased light and nutrient inputs [45]. The average metabolic rates of the 12 streams in our study exhibited a range of 0.88–35.93 g O2/m2/day for daily GPP and 0.73–26.78 g O2/m2/day for daily ER. Metabolism values from the studied agricultural catchments (i.e., 78%–97% cover) are comparable to values reported by previous studies in agricultural streams in Central USA (e.g., Wiley et al. [45]: GPP = 0.1–44.2 g O2/m2/day, ER = 6.2–41.6 g O2/m2/day; Bernot et al., 2010 [46]: GPP = 0.1–16.2 g O2/m2/day, ER = 0.9–15.7 g O2/m2/day; Frankforter et al. [47]: GPP = 0–8.4 g O2/m2/day, ER = 0.03–36 g O2/m2/day). Although the maximum rates of GPP and ER from our study sites are almost two-fold higher than rates from Bernot et al. [46] and Frankforter et al. [47], this difference may be attributed to the shallow (mean = 0.14 m) and relatively slow moving (mean = 0.05 m/s) streams assessed in our study. Shallow depths are associated with increased light availability and associated primary production at the streambed in all areas of the stream [48]. Likewise, low flow rates can allow for the accumulation of nutrients and organic matter in the sediments and water column, facilitating uptake by biota and increasing instream production and respiration [49]. Our study also examined metabolism over a two-week period in summer. Temporal differences associated with seasonality have been seen to alter the magnitude of stream metabolism, with greatest rates generally occurring from spring through autumn [50]. However, the greater light intensity and duration, and resultant increase in water temperature in the summer months can promote a greater activity of both photosynthetic and heterotrophic organisms facilitating higher metabolic rates.
Concentrations of major nutrients sampled in our study were variable among catchments, and frequently exceeded both national and provincial water quality guidelines. The average TP concentration of all samples was approximately 9-fold greater than the provincial threshold for the protection of aquatic life (0.03 mg/L) [51] and reflective of a hyper-eutrophic status (>0.1 mg/L) [52]. Likewise, the average NH4 concentration was approximately 10-fold greater than the proposed national guideline (0.019 mg/L) [53]. However, the average nutrient concentrations of all collected samples (TN = 2.69 mg/L, NH4 = 0.185 mg/L, NO2-NO3 = 1.66 mg/L, TP = 0.27 mg/L, SRP = 0.18 mg/L, TDP = 0.19 mg/L) were comparable to results of studies on other small agricultural streams in the North American Great Lakes region. For example, Gabel et al. [21] reported concentrations of 0.087, 0.179, and 1.101 mg/L for TDP, NH4, and NO3 respectively, among seven agricultural streams with abundant BMPs. Additionally, Chambers et al. [54] found an average TN concentration of 2.68 mg/L and TP concentration of 0.08 mg/L along a gradient of agricultural catchments in Southern Ontario (6.7%–100% cover). Likewise, sediment descriptors (Turbidity = 7.66 NTU, TSS = 8.84 mg/L) in our study were also similar to measures reported in streams from other agricultural catchments containing a variety of BMPs (e.g., Yates et al. [18]: Turbidity = 8.10 NTU, TSS = 21.3 mg/L). Although differences are noted between phosphorus and TSS parameters, this may be attributed to the type of agricultural practice, and BMP characteristics within the catchments.
Our study found BMP abundance and location metrics to be unassociated with rates of stream metabolism. The lack of association is not surprising in light of the fact that BMPs were not associated with summer concentrations of major nutrient forms and that nutrient concentrations were not related to stream metabolism. Our finding that both stream metabolism residuals and water quality parameters are not associated with BMP metrics may be attributable to one, or a combination, of three potential hypotheses: (1) BMP implementation has not exceeded the threshold required to initiate an ecosystem response; (2) limited connection between BMPs and the hydrologic system during the summer season; and (3) legacy effects of past agricultural activities and practices.
Stream ecosystems often display a threshold response to a variety of environmental factors [1,55], including management practices [18]. Although our study catchments comprised a substantial range of BMP implementation, a significant change in stream ecological condition was not associated with the increases in abundance or improved location of BMPs attained in the Grand River Watershed. As such it may be that the combined effects of BMPs in our study area are insufficient to reduce nutrient losses to streams and initiate a measurable change in water quality and stream metabolism. This explanation is supported by predicted nutrient loss reductions from models testing BMP implementation strategies in Great Lakes river basins [56]. In this past study, a scenario of BMP implementation levels considered feasible through conservation efforts similar to the Rural Water Quality Program were insufficient to generate substantive reductions in nutrient losses. However, a scenario of more extensive and more targeted BMP implementation was found to generate significant reductions in nutrient yield. Based on these findings the Rural Water Quality Program may need to adopt strategies that encourage more intensive implementation and improved targeting of BMPs toward hydrologically connected areas in order to enhance the condition of streams in the Grand River watershed.
BMPs assessed in past studies have been shown to reduce nutrient levels in agricultural streams (e.g., [21,57,58,59,60,61,62]). However, results from our study did not suggest that BMPs were enhancing water quality in the studied streams. The absence of associations between BMPs and water nutrients may be attributed to seasonal climate variation [63,64]. Greater evapotranspiration rates in summer months can remove soil water and dry out the land resulting in precipitation infiltrating the soil in all but the largest of events. Under these warm, dry conditions the land is less likely to generate significant surface runoff and BMPs designed to capture nutrients and sediments in runoff have less influence on surface water quality. Furthermore, the availability of nutrients on the landscape is abated during the summer season from actively growing crops and reduced agricultural inputs. In contrast, during spring and autumn agricultural inputs intensify and soils are more often saturated due to lower evapotranspiration rates and large amounts of precipitation or melt water. Saturated conditions will result in greater overland connection between the land and hydrologic system where structural BMPs may more effectively reduce transport of contaminants. Indeed, Holmes [65], found significant negative associations between instream nutrient concentrations and BMP abundance and location metrics based on samples collected in November from similar sized catchments in the GRW. As our study did not find any of the calculated BMP metrics to be significant predictors of nutrient concentrations, it is possible that instream nutrient concentrations are being driven by processes other than surface runoff (e.g., groundwater flow) during the drier, summer season. Additional studies are needed to assess the seasonal effectiveness of BMPs in mitigating agricultural stressors known to impact ecosystem function.
A third potential hypothesis for the lack of association between current BMP use and a response in ecosystem condition is the potential for agricultural stressors, in this case nutrients, to persist through legacy effects. Many studies have outlined the importance of legacy effects in ecological assessments of stream ecosystems [66,67,68,69]. Alterations to the ecological condition of stream ecosystems as a result of agriculture have been observed to influence the current physical, chemical, and biological characteristics, including the whole-stream GPP, even after 55-years of agriculture abandonment and succession [68]. In regards to BMPs implemented in active agricultural catchments such as the ones in our study, Meals et al. [70] proposed that the lack of response in water quality and affiliated indicator parameters is likely a result of lag time. Lag time realizes the persistence and legacy of agricultural stressors and encompasses the time required for the BMP to produce a beneficial effect, for that effect to be delivered to the aquatic system, and for the aquatic system to respond to the effect [70]. Depending on the aim of a BMP, this lag time can vary from years to several decades differing with the BMP treatment and mitigation target, spatial scale, hydrologic flow pattern, flushing rate, and intensity and residence time of the stressor [70]. For example, long-term effects of nitrogen fertilizer use in small agricultural watersheds has been proposed to last greater than 30 years if leeched into soil and ground water pools, which can be a particularly important non-point source input into streams during dry seasons [71]. Likewise, the presence of phosphorus in agricultural soils can be evident for approximately 14 years [72,73]. As the BMPs implemented through the Rural Water Quality Program were instituted from 3 to 15 years prior to sampling it is possible that not enough time has passed for the beneficial effects of the BMPs to impact stream ecosystem function. Although BMPs are advocated as effective conservation strategies [74], the abundance and persistence of agricultural stressors may be overwhelming and delaying the effectiveness of BMPs in improving the function of agricultural streams in the GRW. As BMPs in our study are still relatively young, it is recommended that continued BMP implementation and long term monitoring be employed as a strategy to achieve and realize ecosystem improvements.

Author Contributions

Data analyses and written manuscript were completed by Nolan J. T. Pearce. Study design and field sampling, as well as manuscript review were completed by Adam G. Yates.

Conflicts of Interest

The authors declare no conflict of interest.

References

  1. Allan, J.D. Landscapes and riverscapes: The influence of land use on stream ecosystems. Annu. Rev. Ecol. Evol. Syst. 2004, 35, 257–284. [Google Scholar] [CrossRef]
  2. Carpenter, S.R.; Caraco, N.F.; Correll, D.L.; Howarth, R.W.; Sharpley, A.N.; Smith, V.H. Nonpoint pollution of surface waters with phosphorus and nitrogen. Ecol. Appl. 1998, 83, 559–568. [Google Scholar] [CrossRef]
  3. Belsky, A.J.; Matzke, A.; Uselman, S. Survey of livestock influences on stream and riparian ecosystems in the western United States. J. Soil Water Conserv. 1999, 541, 419–431. [Google Scholar]
  4. Voora, V.A.; McCandless, M.; Roy, D.; Venema, H.D.; Oborne, B. Water quality trading in the lake winnipeg basin: A multilevel architecture. J. Gt. Lakes Res. 2012, 38, 183–192. [Google Scholar] [CrossRef]
  5. Young, R.G.; Huryn, A.D. Effects of land use on stream metabolism and organic matter turnover. Ecol. Appl. 1999, 94, 1359–1376. [Google Scholar] [CrossRef]
  6. Riseng, C.M.; Wiley, M.J.; Black, R.W.; Munn, M.D. Impacts of agricultural land use on biological integrity: A causal analysis. Ecol. Appl. 2011, 218, 3128–3146. [Google Scholar] [CrossRef]
  7. Henley, W.F.; Patterson, M.A.; Neves, R.J.; Lemly, A.D. Effects of sedimentation and turbidity on lotic food webs: A concise review for natural resource managers. Rev. Fish. Sci. 2000, 82, 125–139. [Google Scholar] [CrossRef]
  8. Kleinman, P.J.A.; Sharpley, A.N.; Withers, P.J.A.; Bergstrom, L.; Johnson, L.T.; Doody, D.G. Implementing agricultural phosphorus science and management to combat eutrophication. Ambio 2015, 44, 297–310. [Google Scholar] [CrossRef] [PubMed]
  9. Stuart, V.; Harker, D.B.; Scott, T.; Clearwater, R.L. Watershed Evaluation of Beneficial Management Practices (WEBs): Towards Enhanced Agricultural Landscape Planning—Four-Year Review (2004/5–2007/8); Agriculture and Agri-Food Canada: Ottawa, ON, Canada, 2010. [Google Scholar]
  10. Tomer, M.D.; Dosskey, M.G.; Burkart, M.R.; James, D.E.; Helmers, M.J.; Eisenhauer, D.E. Methods to prioritizing placement of riparian buffers for improved water quality. Agrofor. Syst. 2009, 75, 17–25. [Google Scholar] [CrossRef]
  11. Tamini, L.D.; Larue, B.; West, G. Technical and environmental efficiencies and best management practices in agriculture. Appl. Econ. 2012, 4413, 1659–1672. [Google Scholar] [CrossRef] [Green Version]
  12. Legge, J.T.; Doran, M.E.; Herbert, J.A.; O’Neil, G.; Mysorekar, S.; Sowa, S.; Hall, K.R. Prioritizing locations for implementing agricultural best management practices in a Midwestern watershed. J. Soil Water Conserv. 2013, 68, 22–33. [Google Scholar] [CrossRef]
  13. Giri, S.; Nejadhashemi, A.P.; Woznicki, S.; Zhang, Z. Analysis of best management practice effectiveness and spatiotemporal variability based on different targeting strategies. Hydrol. Process. 2014, 283, 431–445. [Google Scholar] [CrossRef]
  14. Owens, L.B.; Edwards, W.M.; van Keuren, R.W. Sediment losses from a pastured watershed before and after stream fencing. J. Soil Water Conserv. 1996, 511, 90–94. [Google Scholar]
  15. Vowell, J.L. Using stream bioassessment to monitor best management practice effectiveness. For. Ecol. Manag. 2001, 1431, 237–244. [Google Scholar] [CrossRef]
  16. Bagshaw, C.S.; Thorrold, B.; Davison, M.; Duncan, I.J.H.; Matthews, L.R. The influence of season and of providing a water trough on stream use by beef cattle grazing hill-country in New Zealand. Appl. Anim. Behav. Sci. 2008, 1092, 155–166. [Google Scholar] [CrossRef]
  17. Wang, L.; Lyons, J.; Kanehl, P. Effects of watershed best management practices on habitat and fish in Wisconsin streams. J. Am. Water Resour. Assoc. 2002, 38, 663–680. [Google Scholar] [CrossRef]
  18. Yates, A.G.; Bailey, R.C.; Schwindt, J.A. Effectiveness of best management practices in improving stream ecosystem quality. Hydrobiologia 2007, 5831, 331–344. [Google Scholar] [CrossRef]
  19. Rao, N.S.; Easton, Z.M.; Schneiderman, E.M.; Zion, M.S.; Lee, D.R.; Steenhuis, T.S. Modeling watershed-scale effectiveness of agricultural best management practices to reduce phosphorus loading. J. Environ. Manag. 2009, 903, 1385–1395. [Google Scholar] [CrossRef] [PubMed]
  20. Chaubey, I.; Chiang, L.; Gitau, M.; Mohamed, S. Effectiveness of best management practices in improving water quality in a pasture-dominated watershed. J. Soil Water Conserv. 2010, 656, 424–437. [Google Scholar] [CrossRef]
  21. Gabel, K.; Wehr, J.; Truhn, K. Assessment of the effectiveness of best management practices for streams draining agricultural landscapes using diatoms and macroinvertebrates. Hydrobiologia 2012, 6801, 247–264. [Google Scholar] [CrossRef]
  22. Olden, J.D.; Poff, N.L. Ecological processes driving biotic homogenization: Testing a mechanistic model using fish faunas. Ecology 2004, 85, 1867–1875. [Google Scholar] [CrossRef]
  23. Donohue, I.; Jackson, A.L.; Pusch, M.T.; Irvine, K. Nutrient enrichment homogenizes lake benthic assemblages at local and regional scales. Ecology 2009, 90, 3470–3477. [Google Scholar] [CrossRef] [PubMed]
  24. Maloney, K.O.; Munguia, P.; Mitchell, R.M. Anthropogenic disturbance and landscape patterns affect diversity patterns of aquatic benthic macroinvertebrates. J. N. Am. Benthol. Soc. 2011, 30, 284–295. [Google Scholar] [CrossRef]
  25. Palmer, M.A.; Hondula, K.L.; Koch, B.J. Ecological restoration of streams and rivers: Shifting strategies and shifting goals. Annu. Rev. Ecol. Evol. Syst. 2014, 45, 247–269. [Google Scholar] [CrossRef]
  26. Meyer, J.L. Can P/R ratio be used to assess the food base of stream ecosystems? Oikos 1989, 54, 119–121. [Google Scholar] [CrossRef]
  27. Young, R.G.; Matthaei, C.D.; Townsend, C.R. Organic matter breakdown and ecosystem metabolism: Functional indicators for assessing river ecosystem health. J. N. Am. Benthol. Soc. 2008, 273, 605–625. [Google Scholar] [CrossRef]
  28. Fellows, C.S.; Clapcott, J.E.; Udy, J.W.; Bunn, S.E.; Harch, B.D.; Smith, M.J.; Davies, P.M. Benthic metabolism as an indicator of stream ecosystem health. Hydrobiologia 2006, 5721, 71–87. [Google Scholar] [CrossRef]
  29. Yates, A.G.; Brua, R.B.; Culp, J.M.; Chambers, P.A. Multi-scaled drivers of rural prairie stream metabolism along human activity gradients. Freshw. Biol. 2012, 58, 675–689. [Google Scholar] [CrossRef]
  30. Grand River Conservation Authority (GRCA). About the Grand River Watershed. The Geography of the Grand River. Available online: http://www.grandriver.ca/index/document.cfm?Sec= 74&Sub1=7 (accessed on 23 February 2015).
  31. Yates, A.G.; Bailey, R.C. Selecting objectively defined reference sites for stream bioassessment programs. Environ. Monit. Assess. 2010, 170, 129–140. [Google Scholar] [CrossRef] [PubMed]
  32. Government of Canada. Canadian Climate Normals 1981–2010 Station Data. Waterloo Wellington-A Ontario Canada Climate. Available online: http://climateweathergcca/climate_normals/results_1981_2010_ehtml?stnID=4832&lang=e&dCode=4&dispBack=1 (accessed on 6 February 15).
  33. Holysh, S.; Pitcher, J.; Boyd, D. Regional Ground Water Mapping: An Assessment Tool For Incorporating Groundwater into the Planning Process; Grand River Conservation Authority: Cambridge, ON, Canada, 2000. [Google Scholar]
  34. Ontario Ministry of Natural Resources (OMNR). Southwestern Ontario Orthophotography Project (2006): 1 km Coverage, Scholars Portal, Ontario Council of University Libraries, 2012. Available online: http://geo2scholarsportalinfo/#r/search/_queries@=SWOOP;&fields@=;&sort=relevance&limit=entitled (accessed on 17 November 2014).
  35. Hall, C.A. Migration and metabolism in a temperate stream ecosystem. Ecology 1972, 53, 585–604. [Google Scholar] [CrossRef]
  36. Grace, M.R.; Imberger, S.J. Stream Metabolism, Performing and Interpreting Measurements; Water Studies Centre Monash University, Murray Darling Basin Commission, New South Wales Department of Environment and Climate Change: Melbourne, Australia, 2006. [Google Scholar]
  37. Young, R.G.; Townsend, C.R.; Matthaei, C. Functional indicators of river ecosystem health—An interim guide for use in New Zealand. Cawthron Rep. 2004, 870, 495–523. [Google Scholar]
  38. Microsoft Excel, Version 1446; Microsoft Corporation: Redmond, WA, USA, 2010.
  39. Young, R.G.; Collier, K.J. Contrasting responses to catchment modification among a range of functional and structural indicators of river ecosystem health. Freshw. Biol. 2009, 54, 2155–2170. [Google Scholar] [CrossRef]
  40. Reynoldson, T.; Logan, C.; Pascoe, T.; Thompson, S.; Strachan, S.; Mackinlay, C.; McDermott, H.; Paull, T. Canadian Aquatic Biomonitoring Network (CABIN) Field Manual: Wadeable Streams; Environment Canada: Dartmouth, NS, Canada, 2012. [Google Scholar]
  41. Rice, E.W.; Baird, R.B.; Eaton, A.D.; Clesceri, L.S. Standard Methods for the Examination of Water and Wastewater, 22nd ed.; American Public Health Association, American Water Works Association, Water Environment Federation: Washington, DC, USA, 2012. [Google Scholar]
  42. Hill, W.R.; Mulholland, P.J.; Marzolf, E.R. Stream ecosystem responses to forest leaf emergence in spring. Ecology 2001, 82, 2306–2319. [Google Scholar] [CrossRef]
  43. SYSTAT 13, Version 130005; Systat Software: San Jose, CA, USA, 2008.
  44. Blanchet, F.G.; Legendre, P.; Borcard, B. Forward selection of explanatory variables. Ecology 2008, 89, 2623–2632. [Google Scholar] [CrossRef] [PubMed]
  45. Wiley, M.J.; Osborne, L.L.; Larimore, R.W. Longitudinal structure of an agricultural prairie river system and its relationship to current stream ecosystem theory. Can. J. Fish. Aquat. Sci. 1990, 47, 373–384. [Google Scholar] [CrossRef]
  46. Bernot, M.J.; Sobota, D.J.; Hall, R.O.; Mulholland, P.J.; Dodds, W.K.; Webster, J.R.; Tank, J.L.; Ashkenas, L.R.; Cooper, L.W.; Dahm, C.N.; et al. Inter-regional comparison of land-use effects on stream metabolism. Freshw. Biol. 2010, 55, 1874–1890. [Google Scholar] [CrossRef]
  47. Frankforter, J.; Weyers, H.; Bales, J.; Moran, P.; Calhoun, D. The relative influence of nutrients and habitat on stream metabolism in agricultural streams. Environ. Monit. Assess. 2010, 1681, 461–479. [Google Scholar] [CrossRef] [PubMed]
  48. Young, R.G.; Huryn, A.D. Interannual variation in discharge controls ecosystem metabolism along a grassland river continuum. Can. J. Fish. Aquat. Sci. 1996, 53, 2199–2211. [Google Scholar] [CrossRef]
  49. Acuña, V.; Giorgi, A.; Munoz, I.; Uehlinger, U.; Sabater, S. Flow extremes and benthic organic matter shape the metabolism of a headwater Mediterranean stream. Freshw. Biol. 2004, 49, 960–971. [Google Scholar] [CrossRef]
  50. Griffiths, N.A.; Tank, J.L.; Royer, T.V.; Roley, S.S.; Rosi-Marshall, E.J.; Whiles, M.R.; Beaulieu, J.J.; Johnson, L.T. Agricultural land use alters the seasonality and magnitude of stream metabolism. Limnol. Oceanogr. 2013, 58, 1513–1529. [Google Scholar]
  51. Ontario Ministry of Environment and Energy. Water Management—Policies, Guidelines, and Provincial Water Quality Objectives of the Ministry of Environment and Energy; PIBS 3303E; Queen’s Printer for Ontario: Toronto, ON, Canada, 1994.
  52. Canadian Council of Ministers of the Environment. Canadian water quality guidelines for the protection of aquatic life: Phosphorus: Canadian Guidance Framework for the Management of Freshwater Systems. In Canadian Environmental Quality Guidelines; Canadian Council of Ministers of the Environment: Winnipeg, MB, Canada, 2004. [Google Scholar]
  53. Canadian Council of Ministers of the Environment. Canadian water quality guidelines for the protection of aquatic life: Ammonia. In Canadian Environmental Quality Guidelines; Canadian Council of Ministers of the Environment: Winnipeg, MB, Canada, 1999. [Google Scholar]
  54. Chambers, P.A.; McGoldrick, D.J.; Brua, R.B.; Vis, C.; Culp, J.M.; Benoy, G.A. Development of environmental thresholds for nitrogen and phosphorus in streams. J. Environ. Qual. 2012, 41, 7–20. [Google Scholar] [CrossRef] [PubMed]
  55. Groffman, P.M.; Baron, J.S.; Blett, T.; Gold, A.J.; Goodman, I.; Gunderson, L.H.; Levinson, B.M.; Palmer, M.A.; Paerl, H.W.; Peterson, G.D.; et al. Ecological thresholds: The key to successful environmental management or an important concept with no practical application? Ecosystems 2006, 9, 1–13. [Google Scholar] [CrossRef]
  56. Bosch, N.S.; Allan, J.D.; Selegean, J.P.; Scavia, D. Scenario-testing of agricultural best management practices in Lake Erie watersheds. J. Gt. Lakes Res. 2013, 39, 429–436. [Google Scholar] [CrossRef]
  57. Clausen, J.C.; Meals, D.W. Water quality achievable with agricultural best management practices. J. Soil Water Conserv. 1989, 44, 593–596. [Google Scholar]
  58. Walker, J.; Graczyk, D. Preliminary evaluation of effects of best management practices in the black earth creek, wisconsin, priority watershed. Water Sci. Technol. 1993, 283, 539–548. [Google Scholar]
  59. Park, S.; Cooke, R.; Mcclellan, P.; Mostaghimi, S. Bmp impacts on watershed runoff, sediment, and nutrient yields. Water Resour. Bull. 1994, 30, 1011–1023. [Google Scholar] [CrossRef]
  60. Mayer, P.M.; Reynolds, S.K.; McCutchen, M.D.; Canfield, T.J. Meta-analysis of nitrogen removal in riparian buffers. J. Environ. Qual. 2007, 36, 1172–1180. [Google Scholar] [CrossRef] [PubMed]
  61. Bishop, P.L.; Hively, W.D.; Stedinger, J.R.; Rafferty, M.R.; Lojpersberger, J.L.; Bloomfield, J.A. Multivariate analysis of paired watershed data to evaluate agricultural best management practice effects on stream water phosphorus. J. Environ. Qual. 2005, 34, 1087–1101. [Google Scholar] [CrossRef] [PubMed]
  62. Makarewicz, J.C.; Lewis, T.W.; Bosch, I.; Noll, M.R.; Herendeen, N.; Simon, R.D.; Zollweg, J.; Vodacek, A. The impact of agricultural best management practices on downstream systems: Soil loss and nutrient chemistry and flux to Conesus Lake, New York, USA. J. Gt. Lakes Res. 2009, 35, 23–36. [Google Scholar] [CrossRef]
  63. Mulholland, P.J.; Hill, W.R. Seasonal patterns in streamwater nutrient and dissolved organic carbon concentrations: Separating catchments flow path and in-stream effects. Water Resour. Res. 1997, 33, 1297–1306. [Google Scholar] [CrossRef]
  64. Yates, A.G.; Brua, R.B.; Corriveau, J.; Culp, J.M.; Chambers, P.A. Seasonally driven variation in spatial relationships between agricultural land use and in-stream nutrient concentrations. River Res. Appl. 2013, 30, 476–493. [Google Scholar] [CrossRef]
  65. Holmes, R. Determining the Association between the Structure of Stream Benthic Macroinvertebrate Communities and Agricultural Best Management Practices. Master’s Thesis, The University of Western Ontatio, London, ON, Canada, October 2014. [Google Scholar]
  66. Burcher, C.L.; Benfield, E.F. Physical and biological responses of streams to suburbanization of historically agricultural watersheds. J. N. Am. Benthol. Soc. 2006, 25, 356–369. [Google Scholar] [CrossRef]
  67. Harding, J.S.; Benfield, E.F.; Bolstad, P.V.; Helfman, G.S.; Jones, E.B.D., III. Stream biodiversity, the ghost of land use past. Ecology 1998, 95, 14843–14847. [Google Scholar] [CrossRef]
  68. Maloney, K.O.; Feminella, J.W.; Mitchell, R.M.; Miller, S.A.; Mulholland, P.J.; Houser, J.N. Landuse legacies and small streams: Identifying relationships between historical land use and contemporary stream conditions. J. N. Am. Benthol. Soc. 2008, 27, 280–294. [Google Scholar] [CrossRef]
  69. Violin, C.R.; Cada, P.; Sudduth, E.B.; Hassett, B.A.; Penrose, D.L.; Bernhardt, E.S. Effects of urbanization and urban stream restoration on the physical and biological structure of stream ecosystems. Ecol. Appl. 2011, 21, 1932–1949. [Google Scholar] [CrossRef] [PubMed]
  70. Meals, D.W.; Dressing, S.A.; Davenport, T.E. Lag time in water quality response to best management practices: A review. J. Environ. Qual. 2010, 39, 85–96. [Google Scholar] [CrossRef] [PubMed]
  71. Tomer, M.D.; Burkart, M.R. Long-term effects of nitrogen fertilizer use on ground water nitrate in two small watersheds. J. Environ. Qual. 2003, 32, 2158–2171. [Google Scholar] [CrossRef] [PubMed]
  72. Giroux, M.; Royer, R. Long term effects of phosphate applications on yields, evolution of P soil test, saturation, and solubility in two very rich soils. Agrosolutions 2007, 18, 17–24. [Google Scholar]
  73. McCollum, R.E. Buildup and decline of soil phosphorus: 30-Year trends on a Typic Umprabuult. Agron. J. 1991, 83, 77–85. [Google Scholar] [CrossRef]
  74. Schnepf, M.; Cox, C. Environmental Benefits of Conservation on Cropland: The Status of Our Knowledge; Soil and Water Conservation Society: Ankeny, IA, USA, 2006. [Google Scholar]

