Article

Hydrodynamic Performances of Air-Water Flows in Gullies with and without Swirl Generation Vanes for Drainage Systems of Buildings

1
Department of Maritime Information and Technology, National Kaohsiung Marine University, No. 142, Hai-Chuan Road, Nan-Tzu District, Kaohsiung 811, Taiwan
2
Thermal Fluids Laboratory, National Kaohsiung Marine University, No. 142, Hai-Chuan Road, Nan-Tzu District, Kaohsiung 811, Taiwan
*
Author to whom correspondence should be addressed.
Water 2015, 7(2), 679-696; https://doi.org/10.3390/w7020679
Submission received: 25 November 2014 / Accepted: 3 February 2015 / Published: 10 February 2015
(This article belongs to the Special Issue Sustainable Drainage Systems)

Abstract

:
As an attempt to improve the performances of multi-entry gullies with applications to drainage system of a building, the hydrodynamic characteristics of air-water flows through the gullies with and without swirl generation vanes (SGV) are experimentally and numerically examined. With the aid of present Charge Coupled Device (CCD) image and optical systems for experimental study, the mechanism of air entrainment by vortex, the temporal variations of airflow pressure, the trajectories of drifting air bubbles and the self-depuration process for the gullies with and without SGV are disclosed. The numerical simulations adopt Flow-3D commercial code to attack the unsteady two-phase bubbly flows for resolving the transient fields of fluid velocity, vorticity and pressure in the gullies with and without SGV. In the twin-entry gully without SGV, air bubbles entrained by the entry vortex interact chaotically in the agitating bubbly flow region. With SGV to trip near-wall flows that stratify the drifting trajectories of the air bubbles, the air-bubble interactions are stabilized with the discharge rate increasing more than 7%. The reduction of the self-depuration period by increasing discharge rate is observed for the test gullies without and with SGV. Based on the experimental and numerical results, the characteristic hydrodynamic properties of the air-water flows through the test gullies with and without SGV are disclosed to assist the design applications of a modern drainage system in a building.

1. Introduction

To facilitate the efficient water supply and discharge for a building remains as a difficult task due to the complex flow bifurcations in water supply networks as well as the dynamic and unsteady interfacial air-water flow mechanisms developed in a drainage system. For preventing odor transmissions into habitat spaces through a drainage network, the gullies that reserve a water seal for many discharge branches have demonstrated their convenience for installation and maintenance, with opportunities to simplify the drainage system. A recent growing rate for the usage of gullies in Taiwan has proven their potential benefits for building industries. For each device installed in a drainage system, its impacts on the system stabilities, in particular on the variations of airflow pressures responsive to the intermittent discharge(s) through a drainage piping system, have to be identified prior to its widespread applications.
Unlike a siphonic roof drainage system, the random and intermittent falling water into the vertical stack via the various discharge branches in a drainage system is not generally at the full water condition but entrains airflow to formulate a variety of complex air-water flows with various two-phase flow patterns. The interfacial air-water flow structures are affected by the geometries of the pipe-line and appliances, the flow rate and the location in a drainage system. In a branch and the vertical stack of a building drainage network, the interfacial flow structures are typical of intermittent stratified, wavy and annular flows [1]. The momentum changes of air-water flows caused by varying flow direction, expansions and contractions, bifurcations and/or chocking the airways incur the locally positive or negative transient airflow pressures that propagate throughout the entire drainage system at the sonic speed [2]. The impacts of such transient propagation—including the effects on acoustic resonances, discharging capacities and local negative or positive pressures—depend on the air-water interfacial structures and on the reflection and transmission of pressure waves on the interfacial and solid boundaries. Following a transient water discharge from the branch into the vertical stack of a drainage system, the considerable pressure oscillations at the elbow bend of the vertical stack were demonstrated to affect the entire drainage network [2]. At locations where the water curtain or excursion develops to intermittently block a high momentum air stream, the trap seal is often diminished by the raised positive airflow pressure due to the water hammer effect [3]. As the water seal prevents the transmission of foul odors ingress into the habitable spaces through the interconnected drainage network in a building, the survival of each water seal during random discharges is of primary importance. The various design codes for architectures normally request a trap seal with about 50 mm water height corresponding to the permissible pressure excursion of ± 375 N·m−2 [1,2]. To achieve this design goal, the relevant experimental and numerical works have being carried out. As an attempt to suppress the positive pressure surges in a drainage system, the propagations of air pressure transient in a simulated drainage system by solving the St. Venant equations using the finite difference scheme was numerically performed [4]. With the complex two-phase air-water flow structures in a drainage system, the suppression of undesirable pressure transients still remains as a formidable task. In particular, the air-water flow phenomena in the various types of components and appliances of a drainage system are interdependent, leading to complicated interactive hydrodynamic responses [1,2,3,4]. As an attempt to moderate the positive airflow pressure surges initiated from the bottom elbow bend of a vertical stack [3,4], the pressure accumulator was installed to provide additional expansion space for alleviating the positive airflow transients [4]. The streamlined vortex fin(s) with sidewall grooves [3] was installed at the elbow-bend of a vertical stack to induce longitudinal swirls for penetrating the downstream water curtain developed in the elbow-bend. With the numerical schemes for attacking the two-phase flow problems in a drainage system [5,6,7,8], the entrainment model was developed for solving the hydrodynamic characteristics of multi-phase flows involving hydraulic jumps with air entrainments [7,8]. With the presence of entrained air to add the damping effect on the collapsing bubbles, the damages caused by cavitation were alleviated, thus recommending the installation of aeration devices to entrain air for alleviating the cavitation effect.
In view of a gully within which the common water seal for many discharge branches is trapped, the hydrodynamic characteristics for the through air-water flow are further complicated and dependent on the geometries of the flow pathways. In [9,10], the experimental measurements for the flow dynamics and the numerical simulations for the dynamic responses in the multi-outlet siphonic roof drainage systems were respectively reported. The fundamental air-water flow phenomena in the multi-entry gully were illustrated using a set of numerical results simulated by Flow 3-D code [11]. Based on the assumption of lumped bubbly flow for the multi-entry gully, the geometries of entry and discharge ports as well as the plenum chamber were shown as the predominant factors to affect the hydrodynamic performances for this type of multi-entry gullies [11]. Driven by the need to miniaturize the multi-entry gully for building applications, a streamlined bump [12] was fitted at the location downstream the discharge port. With the locally siphonic effects at the throat of the partitioned discharge port, the upstream air-water flows were substantially stabilized; while the maximum flow rates were limited by the choking nozzle effect at the discharge port. In order to raise the maximum discharge capacity for the shallow type multi-entry gully, a ring of SGV (swirl generation vanes) is fitted in the annular flow pathway for stabilizing the air-water flows by stratifying the air-bubble drifting trajectories along the swirl induced by the SGV. This study adopts experimental and numerical methods to probe into the air-water flow phenomena taking place in the shallow-type twin-entry gullies without and with SGV. The flow phenomena, in particular for the dynamic air-water interfacial flow structures, disclosed by this work are beneficial for gully design practice with the follow-on researches directing toward the acoustic aspect of flow induced vibrations and the miniaturization of gully with optimized discharge rate. In what follows, the experimental and numerical methods are briefly illustrated and followed by a set of selective results to comparatively examine the SGV effects on the hydrodynamic performances for this type of gully.

2. Research Methods

2.1. Experimental Apparatus and Test Details

Figure 1 depicts (a) test facilities with the optical device measuring the self-depuration performance (b) a twin-entry test gully with SGV. As depicted by Figure 1a, the supplied water from tank (1) is located at second floor of the in-house fifth-floor height drainage test facility, giving rise to the pressure potential of 1.2 m of water height to facilitate the required flow rates for experimental tests. As indicated in Figure 1a, the fresh water fed from tank (1) flows through a vertical stack (2) to the twin-entry test gully (3) via two horizontal entry pipes tangent to the gully drum. The present drainage system is complied with the new construction method using the single-pipe vertical stack with the Air Admitting Valve (AAV) (4) installed on top of the vertical stack. Airflow pressures are controlled in the typical range of ±375 Nm-2 via the auto air entrainments through the AAV (4) shown in Figure 1a. The net volume of water flow through the test gully (3) in Figure 1a is measured by the downstream water tank (5) with the time span detected by the electronic timer for accounting the averaged water flow rate through the test gully (3). A scale attached along the inner periphery of each transparent inlet pipe (6), (7), as indicated in Figure 1a, detects the water flow level for the stratified entry air-water flow in the horizontal branches (6), (7). The void fraction (α) of each entry mixed water stream can be accordingly determined. The air-water flow structures in the gully at each tested water flow rate at single- and/or twin-entry flow conditions are visualized from the snapshots imaged by the Charge Coupled Device (CCD) system. This imaging system records the flow snapshots at 300 fps with 600 pixels per gully width. The CCD camera (8) shown in Figure 1a is aimed at the angle normal to the test gully (3) with a constant focal length. The static airflow pressure is detected by a computerized digital micro manometer (9) in Figure 1a with the precision of 0.01 mm H2O. As indicated in Figure 1b, the pressure tap measuring the airflow pressure above the entry vortex of the test gully is located on the frame attached on the top plane of the test gully with the probing depth to be precisely measured. Another port of the digital micro manometer is vented to atmosphere so that the static airflow pressures at the measuring locations above the entry vortex are detected. This type of pressure measurement device utilizes the piezoelectricity to convert pressure signal into electrical potential. The pressure measurements are synchronously recorded with the flow images taken by the CCD system, which are constantly monitored by the on-line data acquisition system. The detailed temporal variations of the airflow pressure and the corresponding flow images detected at each test condition are simultaneously recorded for post data processing. The test gully is made from a transparent arctic block. At each pre-defined flow test condition, a light sheet is emitted toward the dyed test gully behind which the photometric receiver is installed to detect and record the temporal lumen variations. By way of analyzing the temporal photometric variation, which is responsive to the temporal variation of dye concentration within the test gully, the self-depuration performance is revealed.
Figure 1b depicts the twin-entry test gully with SGV. As shown in Figure 1b, the test gully is configured by a vertical primary drum that directs the entry mixed water streams from the horizontal twin-entry ports in the downward direction toward the gully base. The radial spreading air-water stream then sharply turns and flows upward in the annular pathway between the primary and secondary drums. Over the circumferential band on the outer cylindrical wall of the secondary drum, ten SGV are in-line arranged and oriented at 45 deg. relative to the upward stream. These vanes are fitted to trip the anti-clockwise annular swirl between the primary and secondary drums. The cross-section area of discharge port is equal to the sectional annular area between the primary and secondary drums. The upward air-water stream is spilled out of the annular pathway toward the discharge port. As the overlapping height between the primary and secondary drums is 50 mm, the minimum water seal height in the test gully is ensured above than 50 mm. A replaceable filter leaf is installed above the cylindrical core on the top of the test gully, which permits the air entrainments from the surrounding atmosphere. As the two entry ports are in tangent with the outer rim of the gully casing, a central vortex is induced in the primary drum after feeding the mixed water flow into the gully. The free surface of the entry vortex formulates the airway to entrain air into the liquid pool, which will be later demonstrated. It is noticed that present orientation for the SGV is attempted to induce the co-current swirl at the same direction as the free vortex formulated in the primary drum. With the co-current swirl in the annular flow pathway in which the air-water stream flows in upward direction, the drifting air bubbles are guided by the near-wall flows over the roughened cylindrical wall on the secondary drum.
Figure 1. (a) test facilities; (b) twin-entry test gully with swirl generation vane (SGV); (c) layout of numerical model.
Water 07 00679 g001
In order to examine the self-depuration performance of a gully, a set of optical device [12] is adopted to detect the temporal variations of the lumen level shaded by the dyed test gully. In the attempt to measure the self-depuration performance for the bulk flow of a test gully, the relative self-depuration properties are comparatively evaluated by measuring the temporal L/L1 variations. The photometric meter adopted by this work is a two-dimensional device, which is attached on the transparent cylindrical casing of the test gully as indicated in Figure 1a. As the air entrained into a test gully transforms into the air bubbles taking various shapes, the received photometric levels behind the test gully with fresh water flow are affected by the light scattering through these agitating air bubbles. Thus, the normalized lumen level through the test gully at each test condition with fresh water is initially detected by present computerized optical system. The photometric receiver transmits the received light signal to the Personal Computer (PC), giving rise the lumen reference to determine the completion of self-depuration process at each test condition. By way of feeding the mixed water at the particular test condition defined by ReL and α, namely the interfacial Reynolds number and void fraction of entry flow, the reference lumen levels at the pure water flow conditions (L1) are pre-determined. It is interesting to note that, as the resolving air bubbles in the test gully reflect and scatter light, the instant lumen values at each pure-water test conditions oscillate about the corresponding L1 reference. With self-depuration tests, the water trap stored in the test gully is dyed by the black ink to give the pre-defined lumen level (L0) for a particular set of tests. The L0 level at each “dark” test condition is controllable by adjusting the ink concentration and appears as a stable value due to the absence of air bubble prior to feeding the mixed water into the test gully. After charging the mixed water into the test gully, the instant lumen level (L) starts rising from L0 toward L1. The detailed temporal lumen (L) variation from L0 to L1 reflects the self-depuration performance for the test gully. For the test gullies with different geometries or different entry flow conditions, the L0 and L1 references are accordingly varied and measured. The temporal variation of normalized lumen in terms of L/L1 is used to quantitatively characterize the self-depuration performance for each test gully. The time lapse taken for L/L1 approaching 0.99 is defined as the self-depuration period correspond to the particular test condition.

2.2. Numerical Method and Simulation Details

With the Flow-3D code, the continuity equation and Navier-Stokes equation which describes the momentum conservation law for incompressible viscous flow within the fluid domain Ω surrounded by a piecewise smooth boundary Γ are described by Equations (1) and (2) respectively:
u   = 0
u t   +   ( u ) u = p + 1 Re 2 u + f
In Equations (1) and (2), u, p, f, Re, t respectively denote the fluid velocity vector, pressure, additional force source terms, Reynolds number and time. The solution in Ω domain satisfies the initial condition of u = u0 and the non-slip boundary conditions on the solid boundary Γ. The geometries for numerical simulations are identical with the experimental test models using the scaling factor of unity as shown by Figure 1c. The origin of present XYZ coordinate system locates at the center of the bottom plate. Within the calculation Ω domain, the numerical solutions are obtained using the fine grid cells of length 1.5 mm. The air pressures for the voids in the water stream are assumed as 1.013 × 10⁵ Pa (1 atm). Flow entry conditions for both gullies with and without SGV are identical with the total discharging rate of 30 L/min. For each entry port, the water flow rates, QA and QB, are set at QA = QB = 15 L/min with the void fraction of unity. This numerical study simulated the temporal variations of the interfacial air-water flow structures, including the 3-D distributions of Fr, vorticity and static pressure, for disclosing the complex two-phase flow phenomena in the test gullies without and with SGV. For the present numerical model, the intensity of non-linearity and convective effects are sensitive to the magnitude of volume flow rate from each inlet. The Sommerfeld radiation boundary conditions are selected as the outlet flow boundary conditions so that the study for the effects of wave interactions with the solid surfaces is permissible. Justified by the experimental observations, the lumped bubbly flows are selected as the interfacial flow structures throughout the calculations.

3. Results and Discussion

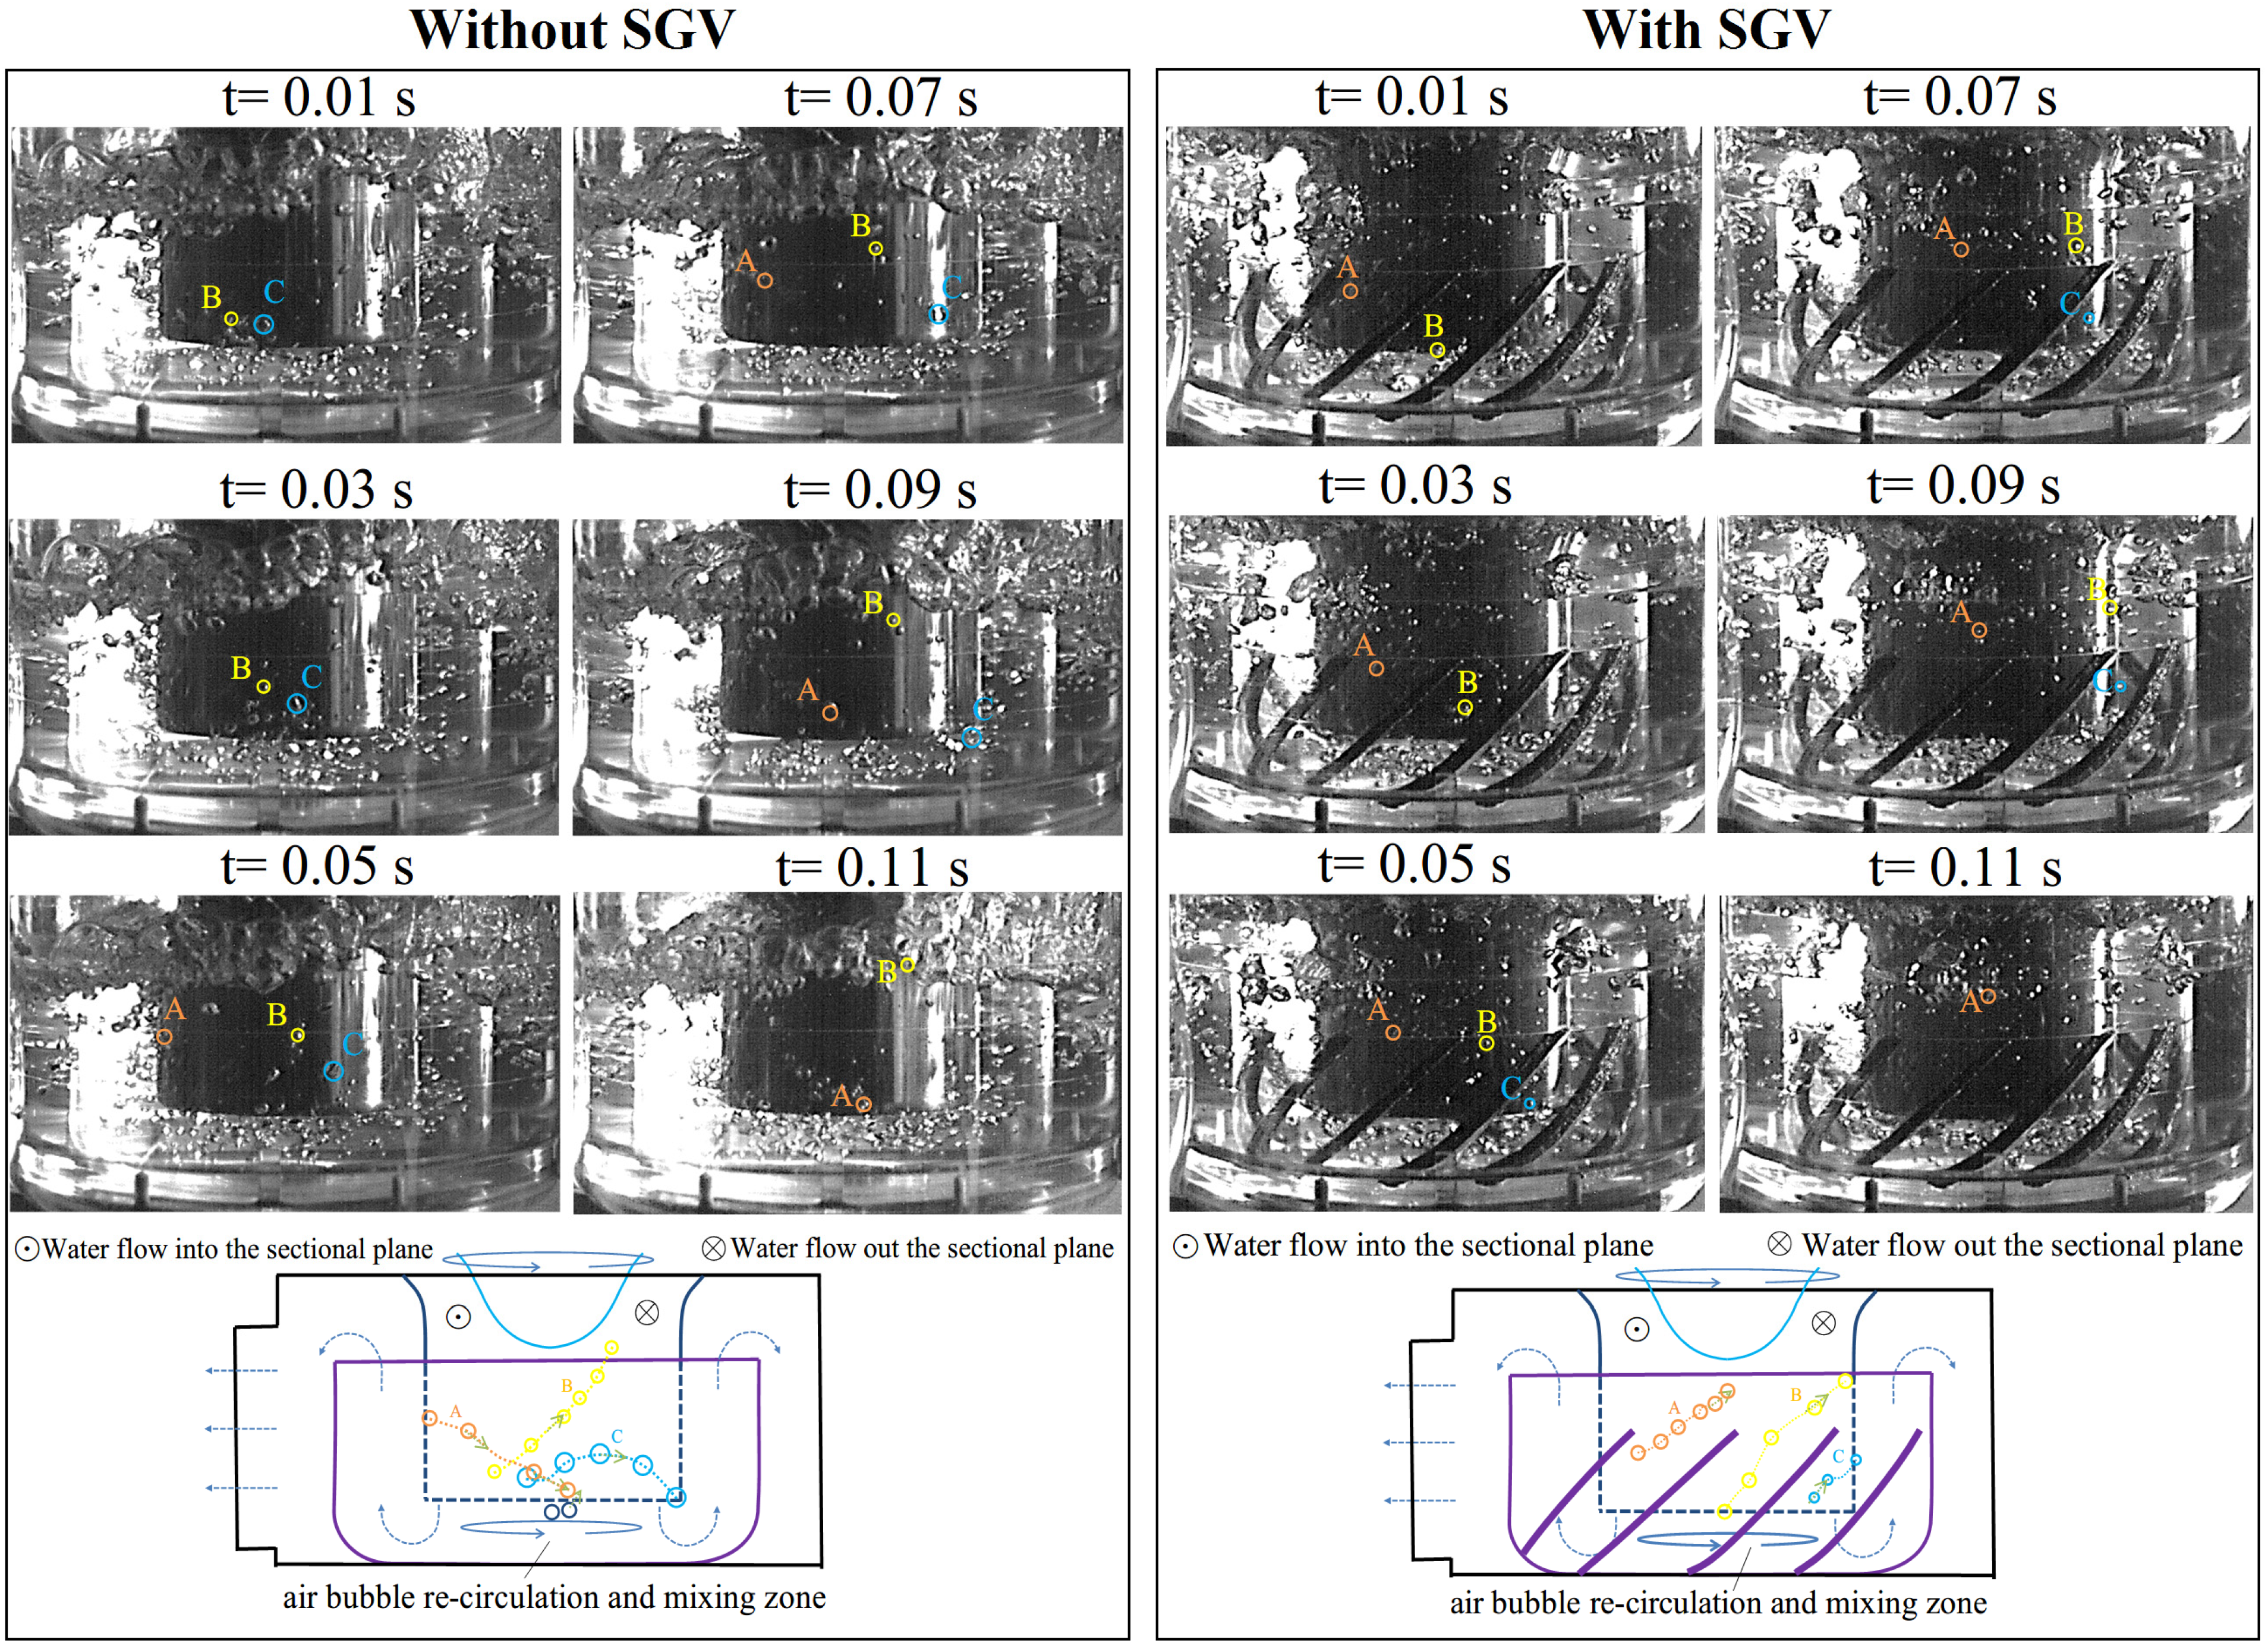
3.1. Flow Structures

For establishing the comparative reference results, the flow structures in the test gully without SGV are detected against which the flow structures detected from the test gully with SGV are compared to disclose the SGV impacts on the hydrodynamic performances. The basic flow structures identified from the flow snapshots detected at all the tested flow rates (Q) of 10, 20, 30 and 40 L/min with single and twin entry flows remain similar for each type of test gullies. The basic flow structures in the test gullies without and with SGV are comparatively presented in 
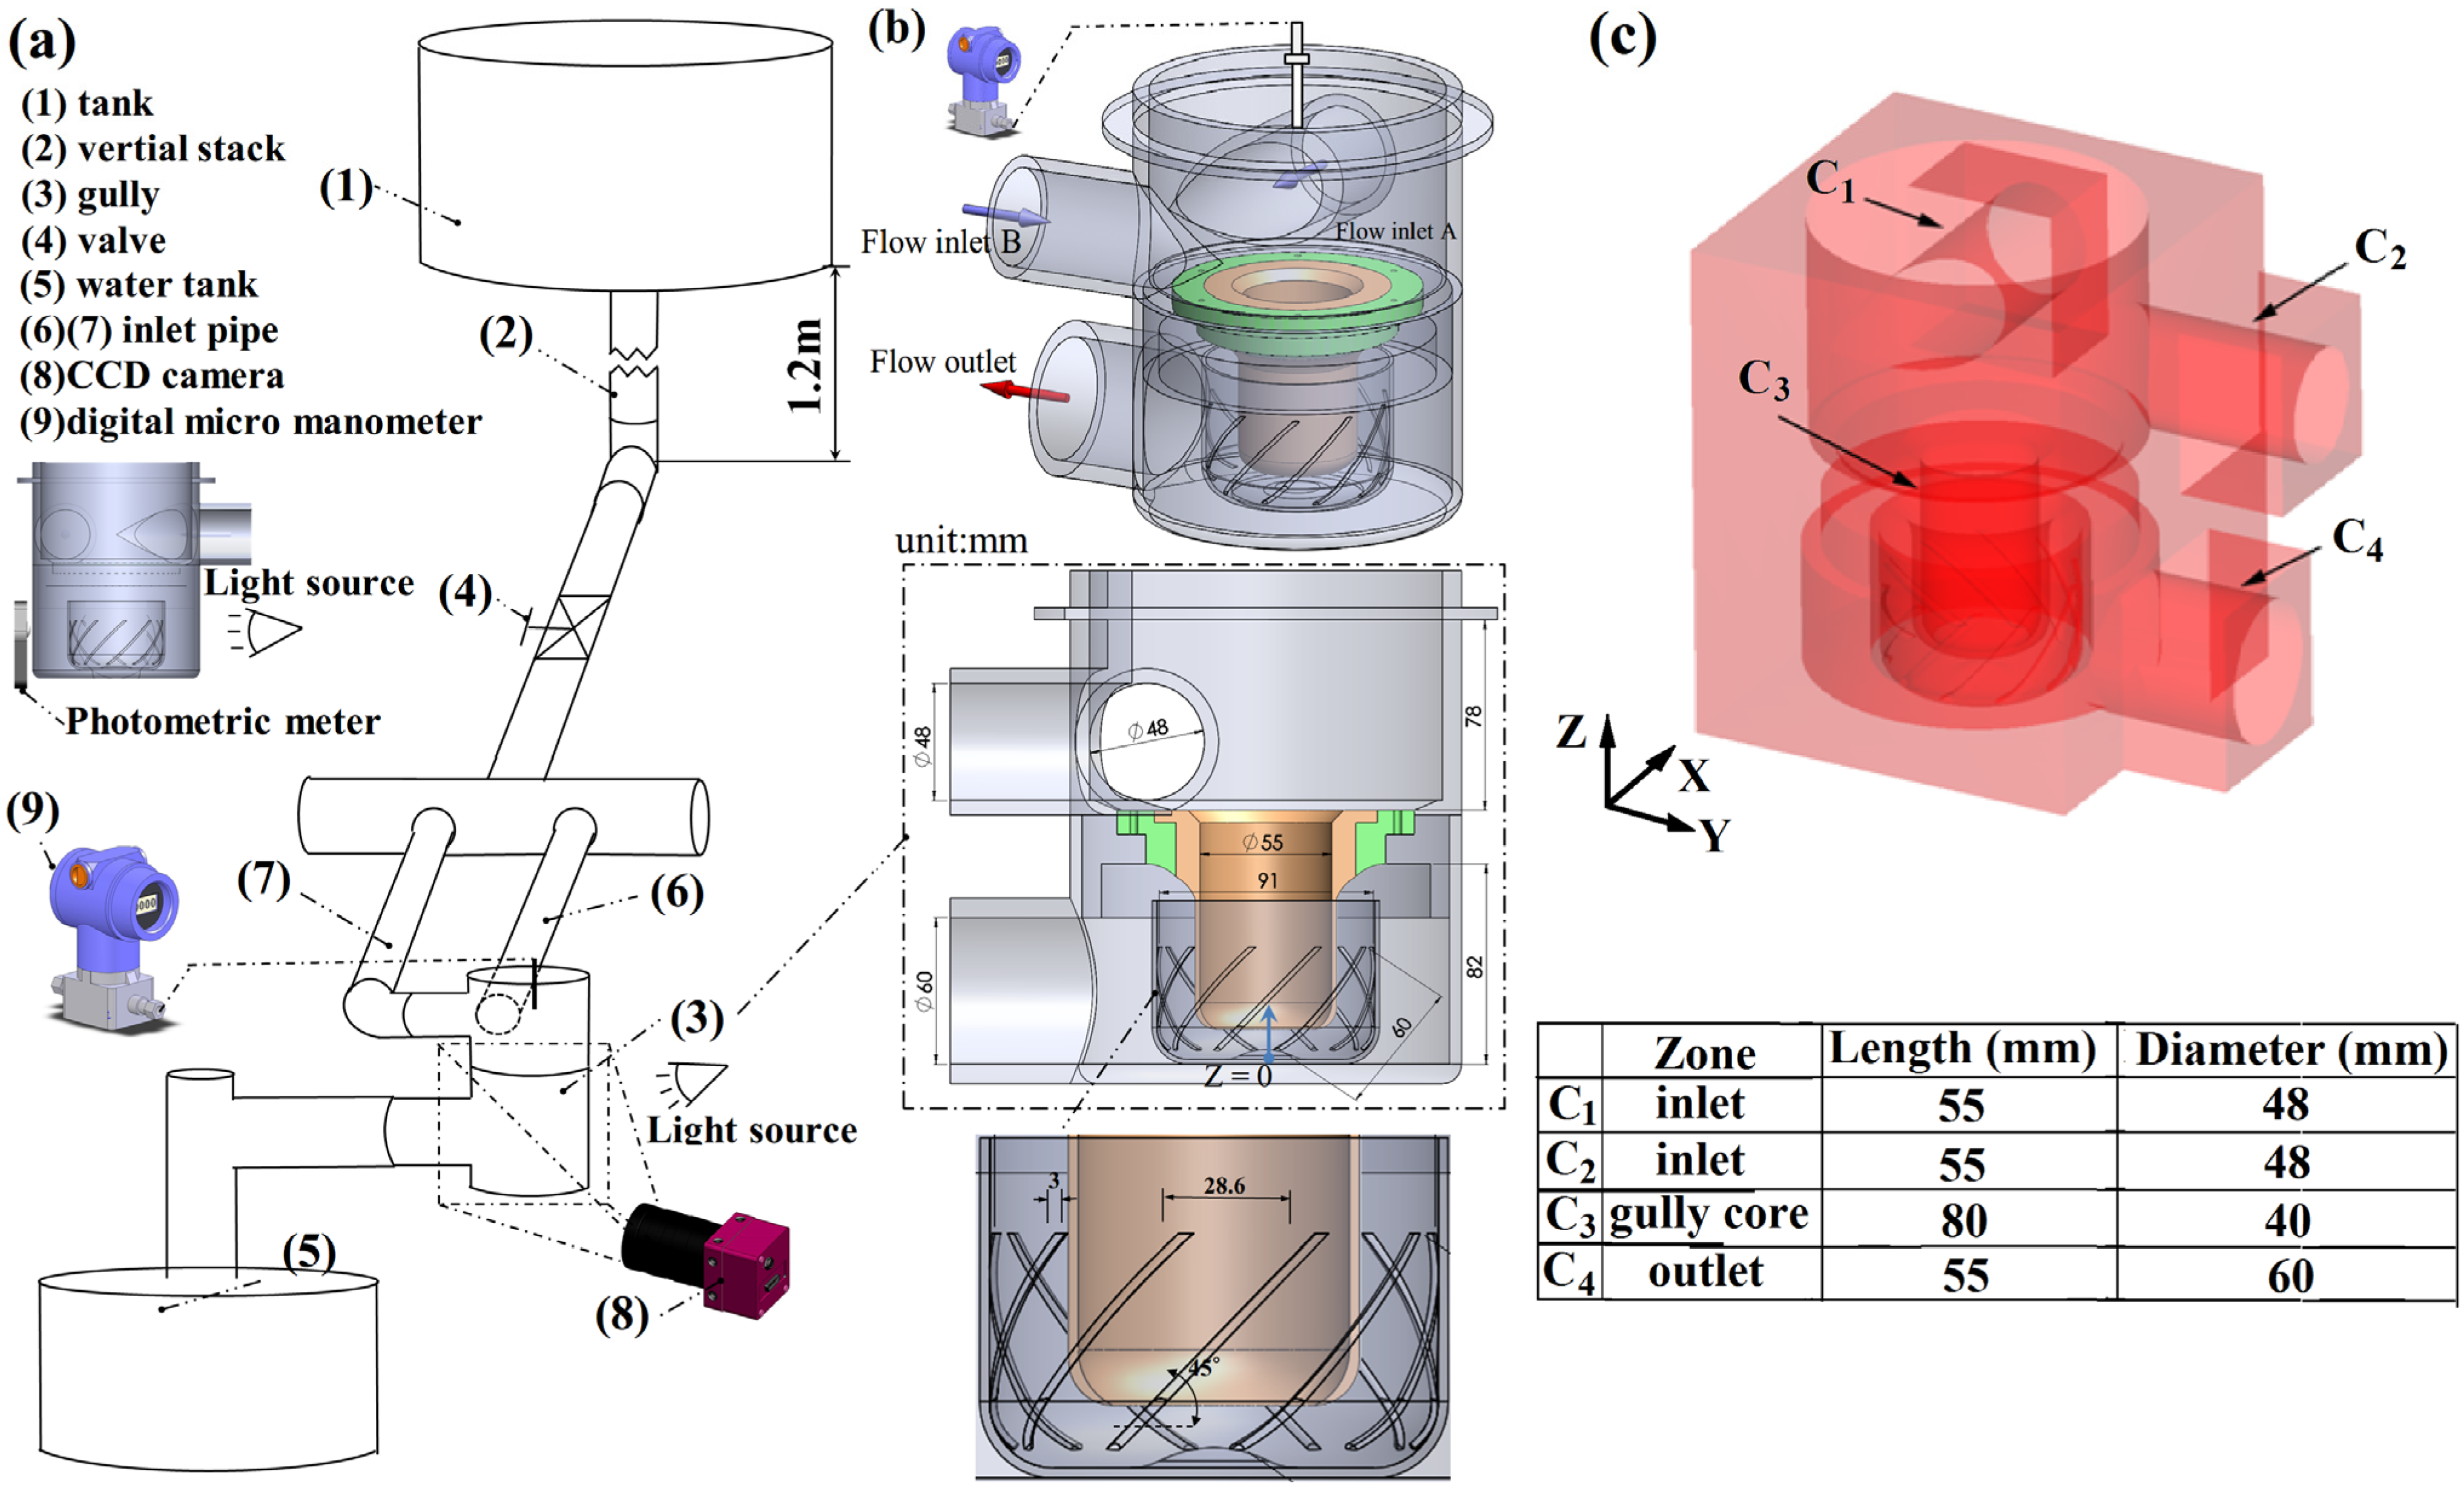
Figure 2 at the maximum discharging rates. Having charged the mixed water from the twin entry ports, an entry vortex is formulated to convect the downward air-water stream into the primary drum. Justified by the convex curvature along the free surface of the entry vortex, the regional hydrodynamic performances for this type of test gullies are governed by the free vortex flow. However, near the center of the entry vortex, the contour of vortex reverts to be concave, featuring the forced vortex. The entry vortex in the primary drum is thus a mixed vortex. After the downward vortical air-water stream impinging onto the base plate of the test gully, the radially spreading air-water flow turns to be up-lifted through the 180°. sharp bend into the annular pathway between primary and secondary drums. Air bubbles entrained by the entry vortex are formed and drifting in this annular flow pathway, emerging the noticeably differential air-water interfacial activities between the tested gullies without and with SGV as compared by Figure 2. Clearly, the near-wall flows tripped by the angled SGV stratify the air bubbles to drift in the direction along the SGV orientation. In the test gully without SGV, the chaotic interactions among the up-drifting air bubbles take place in the annular passage, triggering considerable flow instabilities to amplify the air-pressure oscillations above the free surface between the primary and secondary drums. With the stabilized air-bubbles drift in the annular pathway among the upward flows for the test gully with SGV, the maximum discharging rates at present pressure potentials tested are increased more than 7% from those through the test gully without SGV.
Numerical simulations successfully capture all the dominant flow structures detected by the experimental study for the test gullies with and without SGV. The numerical test results obtained at water inflow rate for each entry port at 15 L/min show favorable agreements with the experimental measurements, thus confirming the calculated flow and pressure fields at the air-water flow conditions. The distributions of instant fluid velocity and pressure over the middle vertical planes of Y = 0 and X = 0 at t = 10, 20 and 30 s with QA = QB = 15 L/min are collected in Figure 3. In primary drum and the annular pathway between primary and secondary drums, the typical gravity-driven hydrostatic pressure variations are observed. When the upward air-water stream spills out of the annular pathway, the radial spreading water screen emitted from the top rim of the secondary drum envelops air bubbles. The free surface surrounding the outer wall of the secondary drum takes the unsteady wavy pattern for both gullies as shown by Figure 3. In the annular pathway between the primary and secondary drums and at the wavy free surface outside the secondary drum, the agitating bubbly air-water flows formulate the unstable flow region in this type of gully. Except in the agitating bubbly air-water flow region among which the air-bubble drifts are considerably affected by SGV as seen in Figure 2, the air-water flows in the gullies with and without SGV as shown by Figure 3 share the similar pattern. Many small-scale vortices with short life cycles are intermittently developed and resolved in both gullies with and without SGV.
Figure 2. Air-water flow structures in test gully without SGV at QA + QB = 65 L/min andin test gully with SGV at QA + QB = 70 L/min.
Water 07 00679 g002
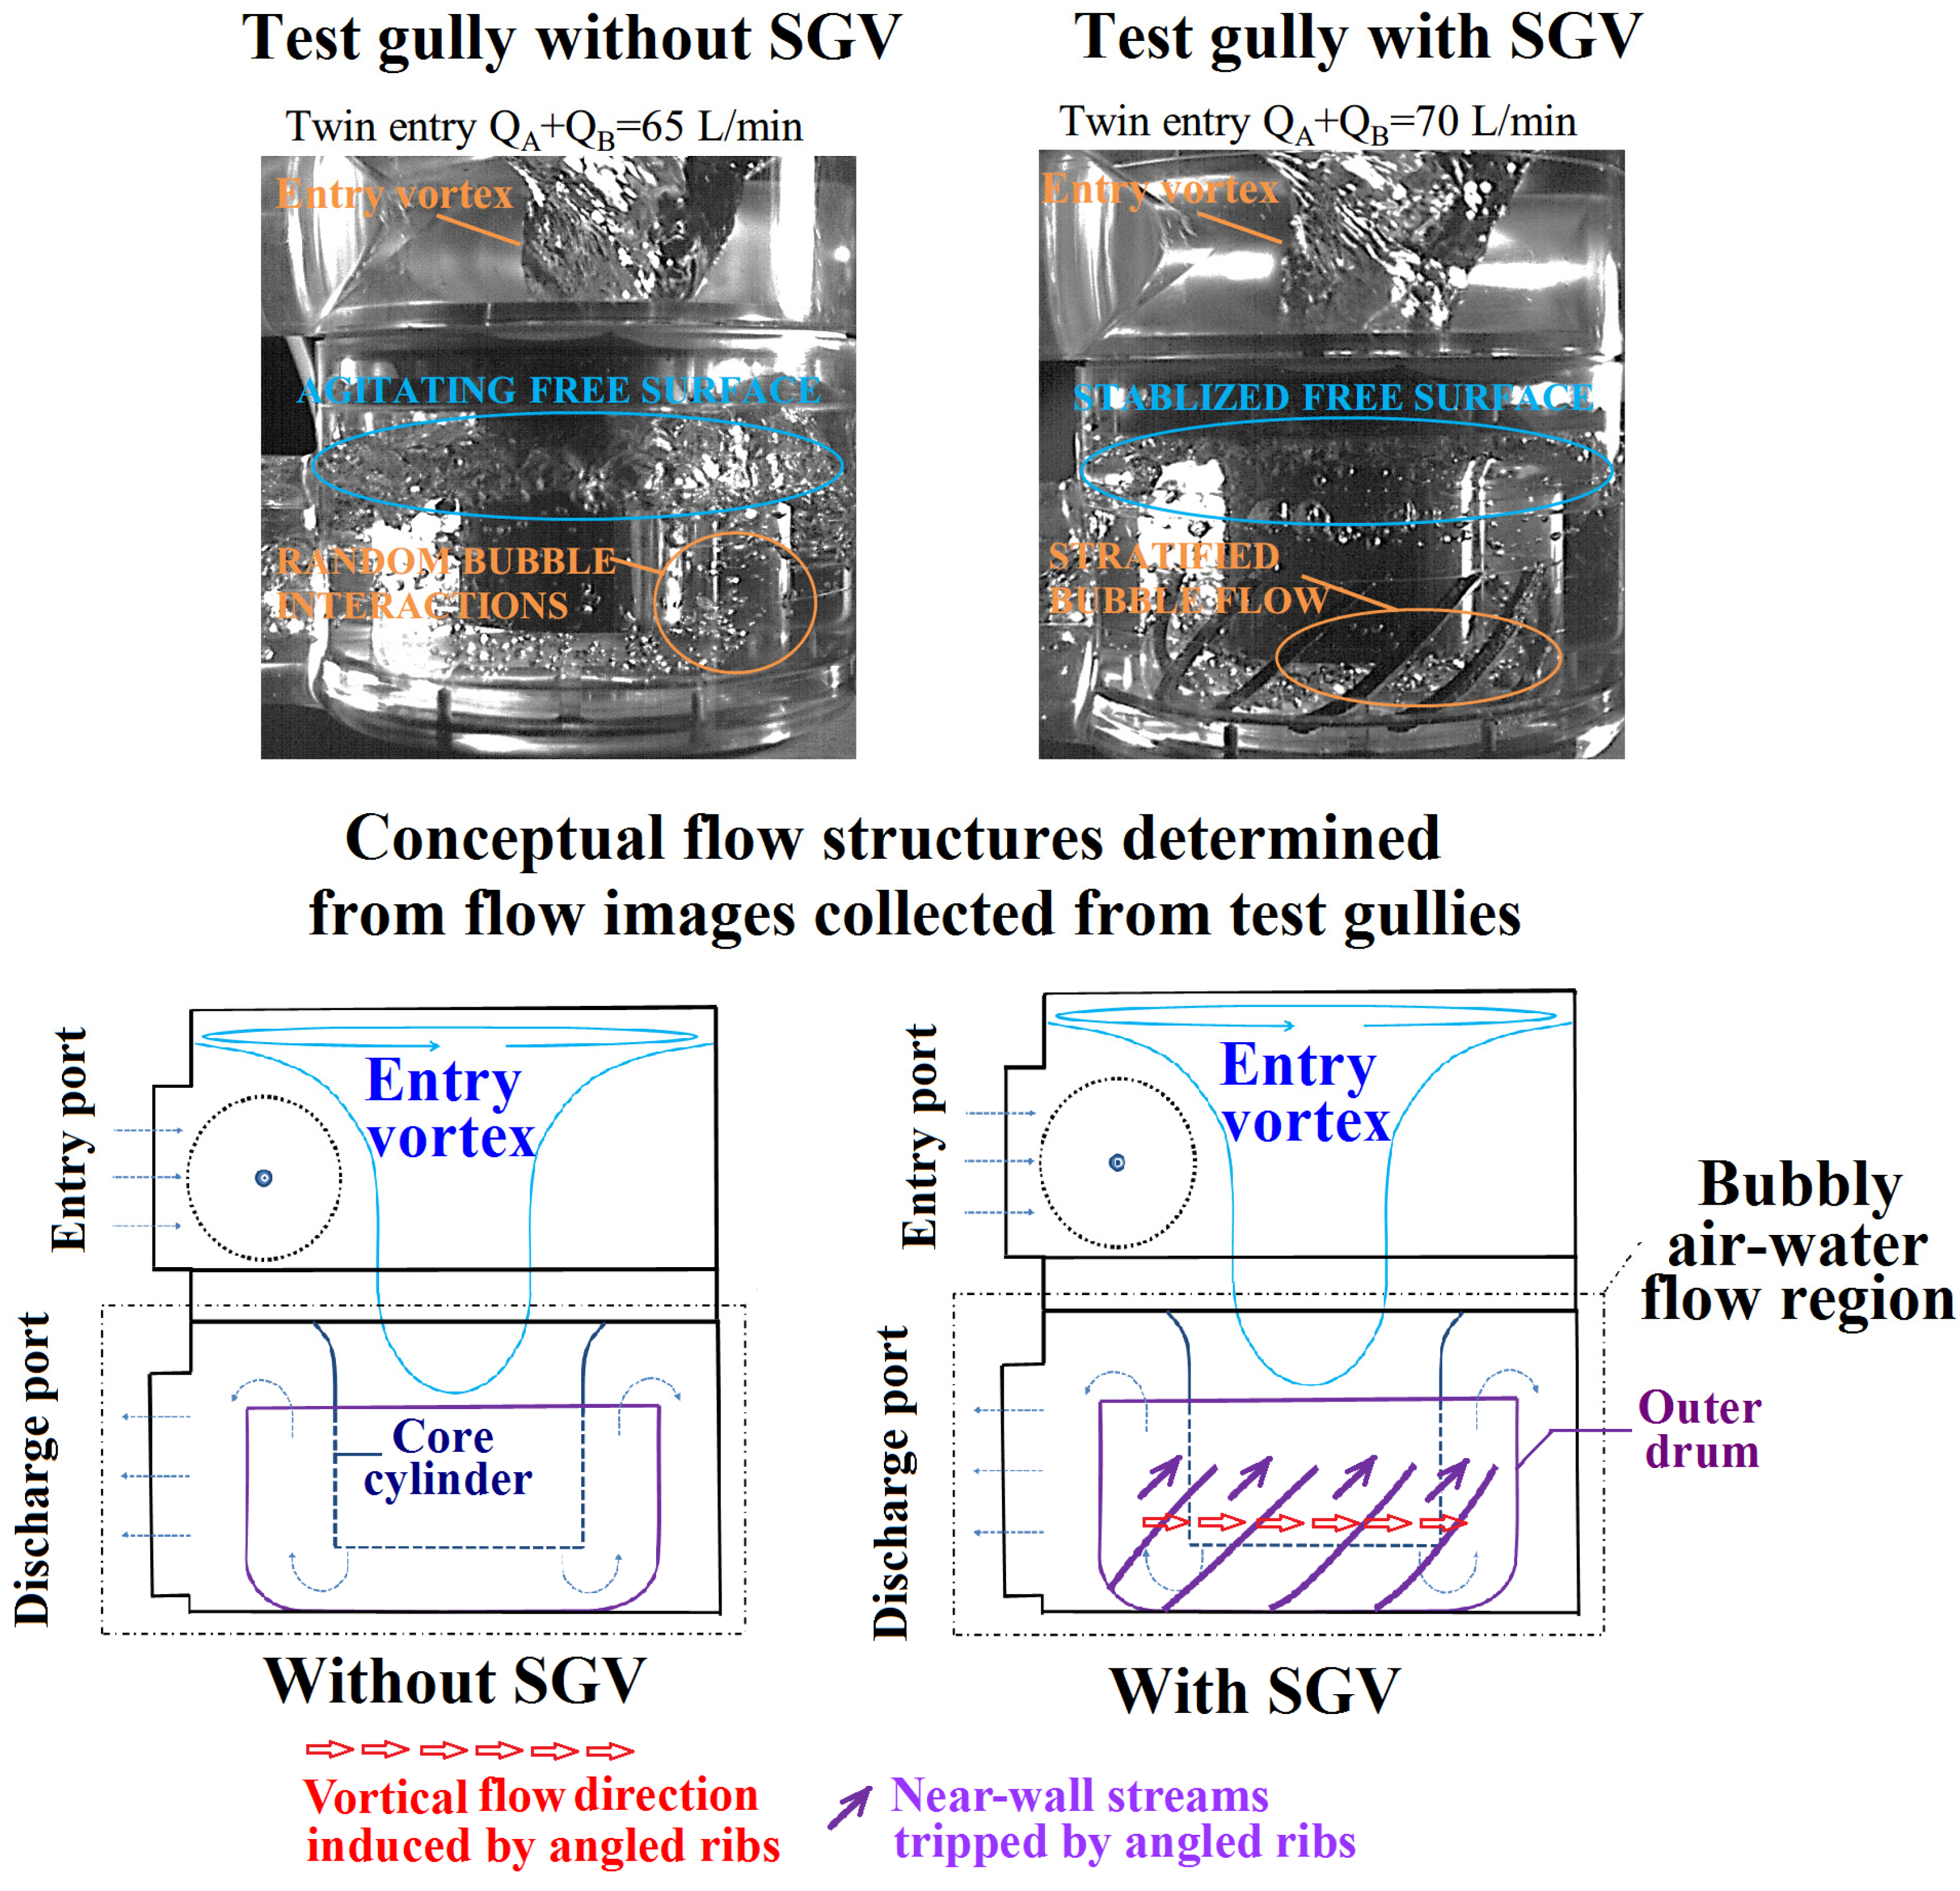
To depict the complex unsteady air-water flow structures in present gullies without and with SGV, the three dimensional distributions of instant Froude number (Fr) at t = 5 and 30 s are calculated and collected in Figure 4. Present Fr is defined as the ratio of fluid velocity to the gravitational wave velocity to physically respond the ratio of inertial to gravitational forces for indicating the relative resistances of submerged air bubbles moving through the water stream. As compared with Figure 4, the Fr levels among the agitating bubble flow region in the gully without SGV are higher than the counterparts in the gully with SGV. Even with the protruding SGV to add the associated frictional and form drags along the flow pathway in the gully with SGV, the flow resistances attributed to the chaotic air bubble agitations in the gully without SGV still supersede the additional flow resistances added by the SGV; which leads to the increased maximum flow rates under the same pressure heads from the discharges for the gully with SGV. In Figure 4, the complete 3-D flow structures formulated by the entry vortex, agitating bubbly flow region along the serpentine flow pathway and the discharge flow with unsteady wavy free-surface are similar for both gullies without and with SGV to signify the characteristic flow pattern for this type of gully.
Figure 3. Distributions of instant fluid velocity and pressure over middle vertical planes of Y = 0 and X = 0 at t = 10, 20 and 30 s with Q1 = Q2 = 15 L/min.
Water 07 00679 g003
Figure 4. Three dimensional distributions of instant Froude number reflecting the overall flow structures in gullies with and without SGV.
Water 07 00679 g004

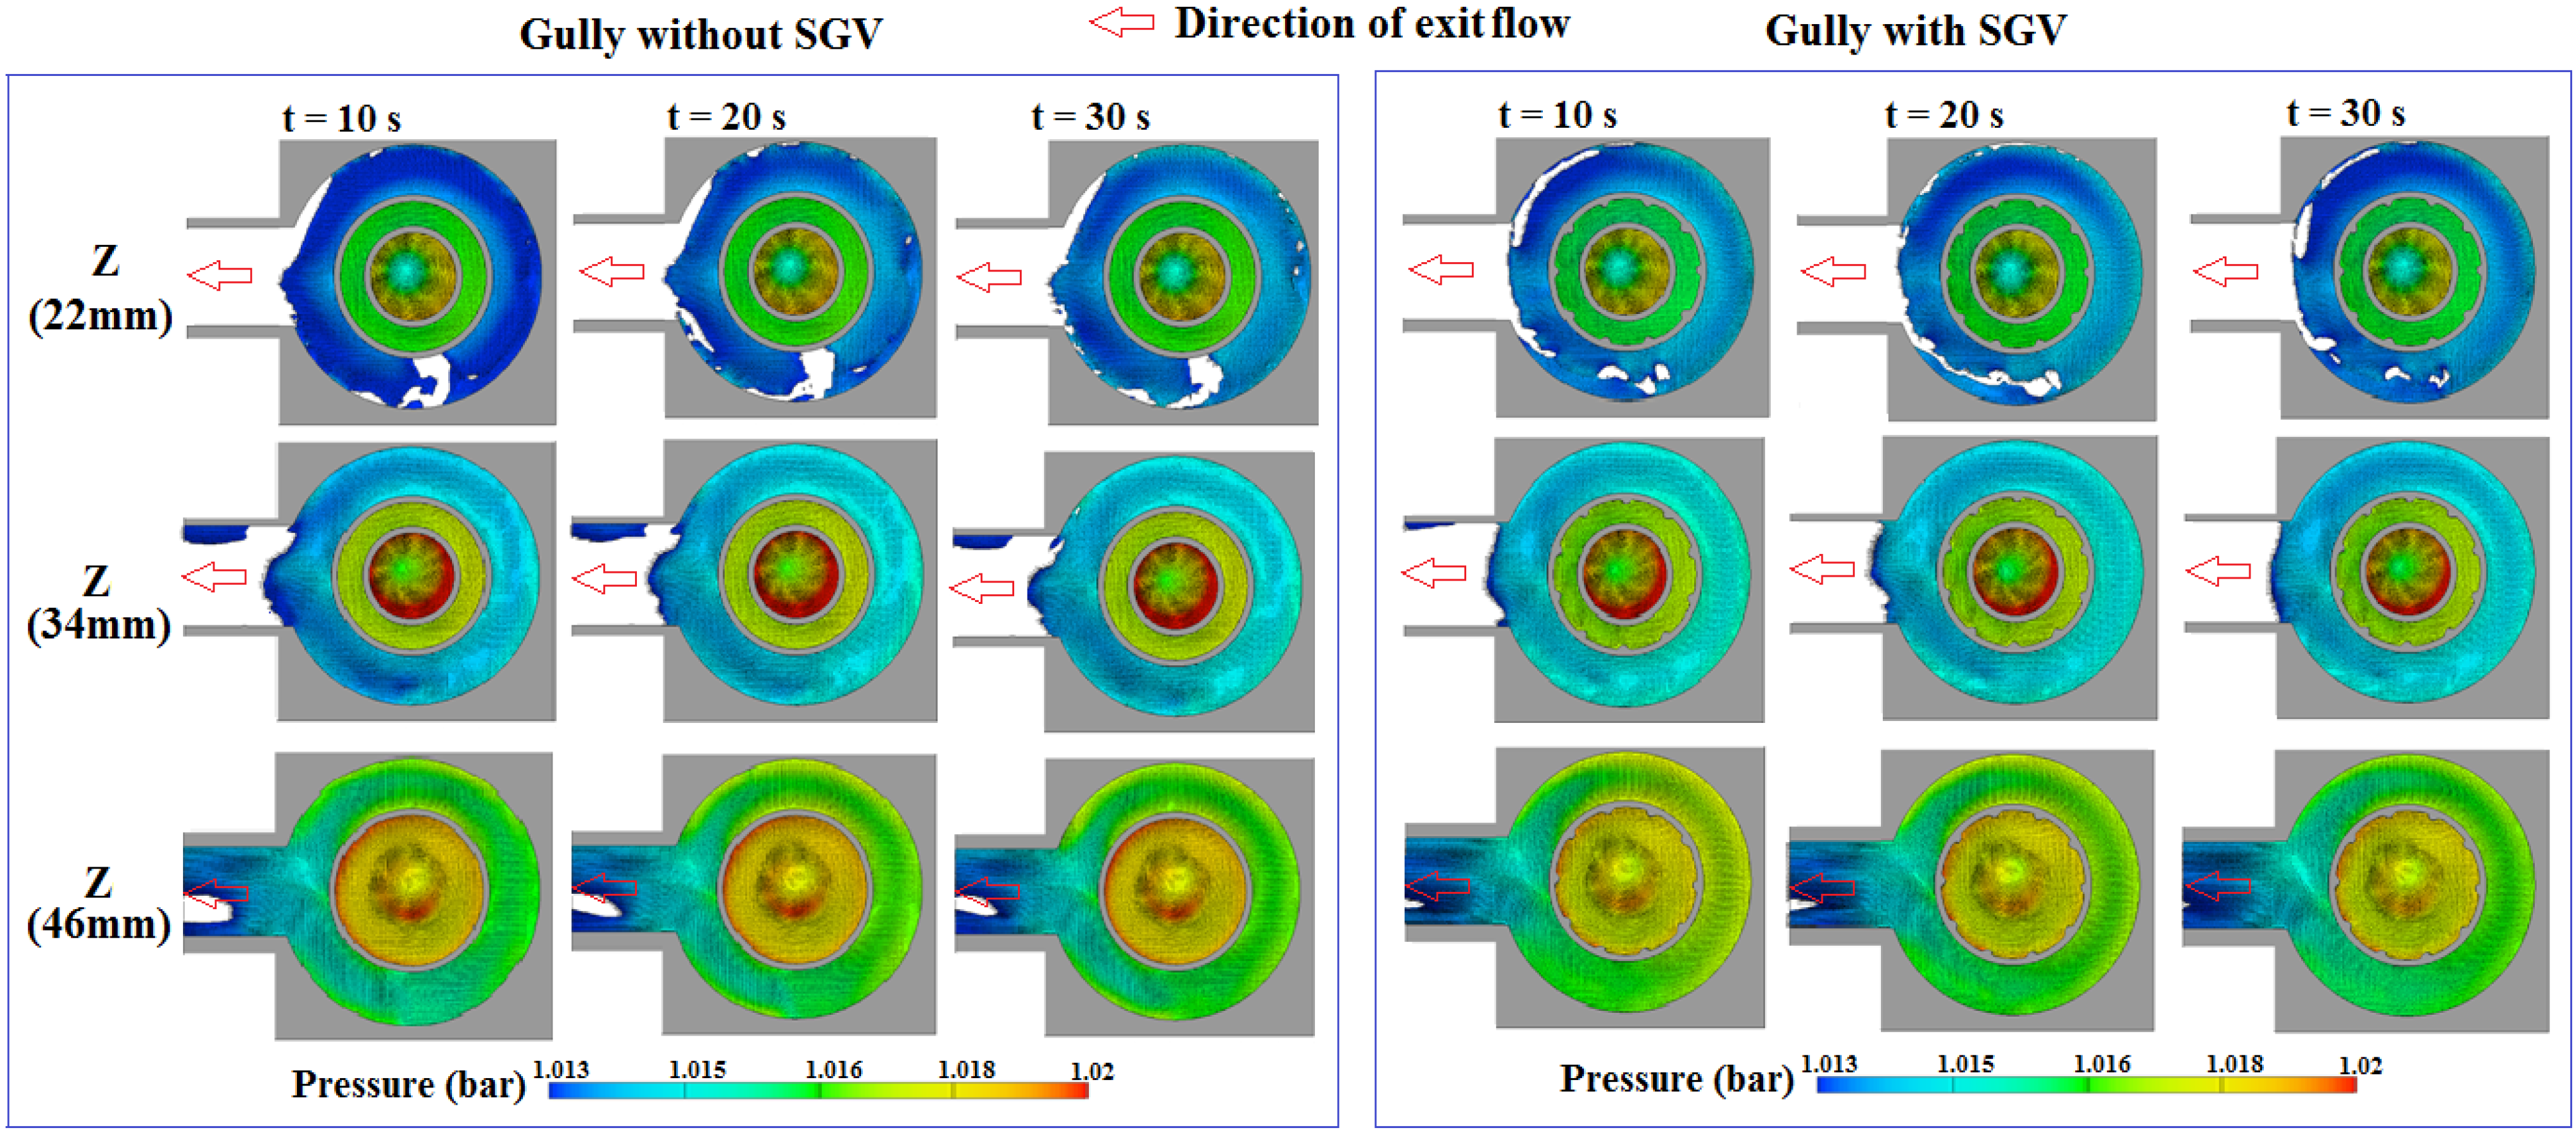
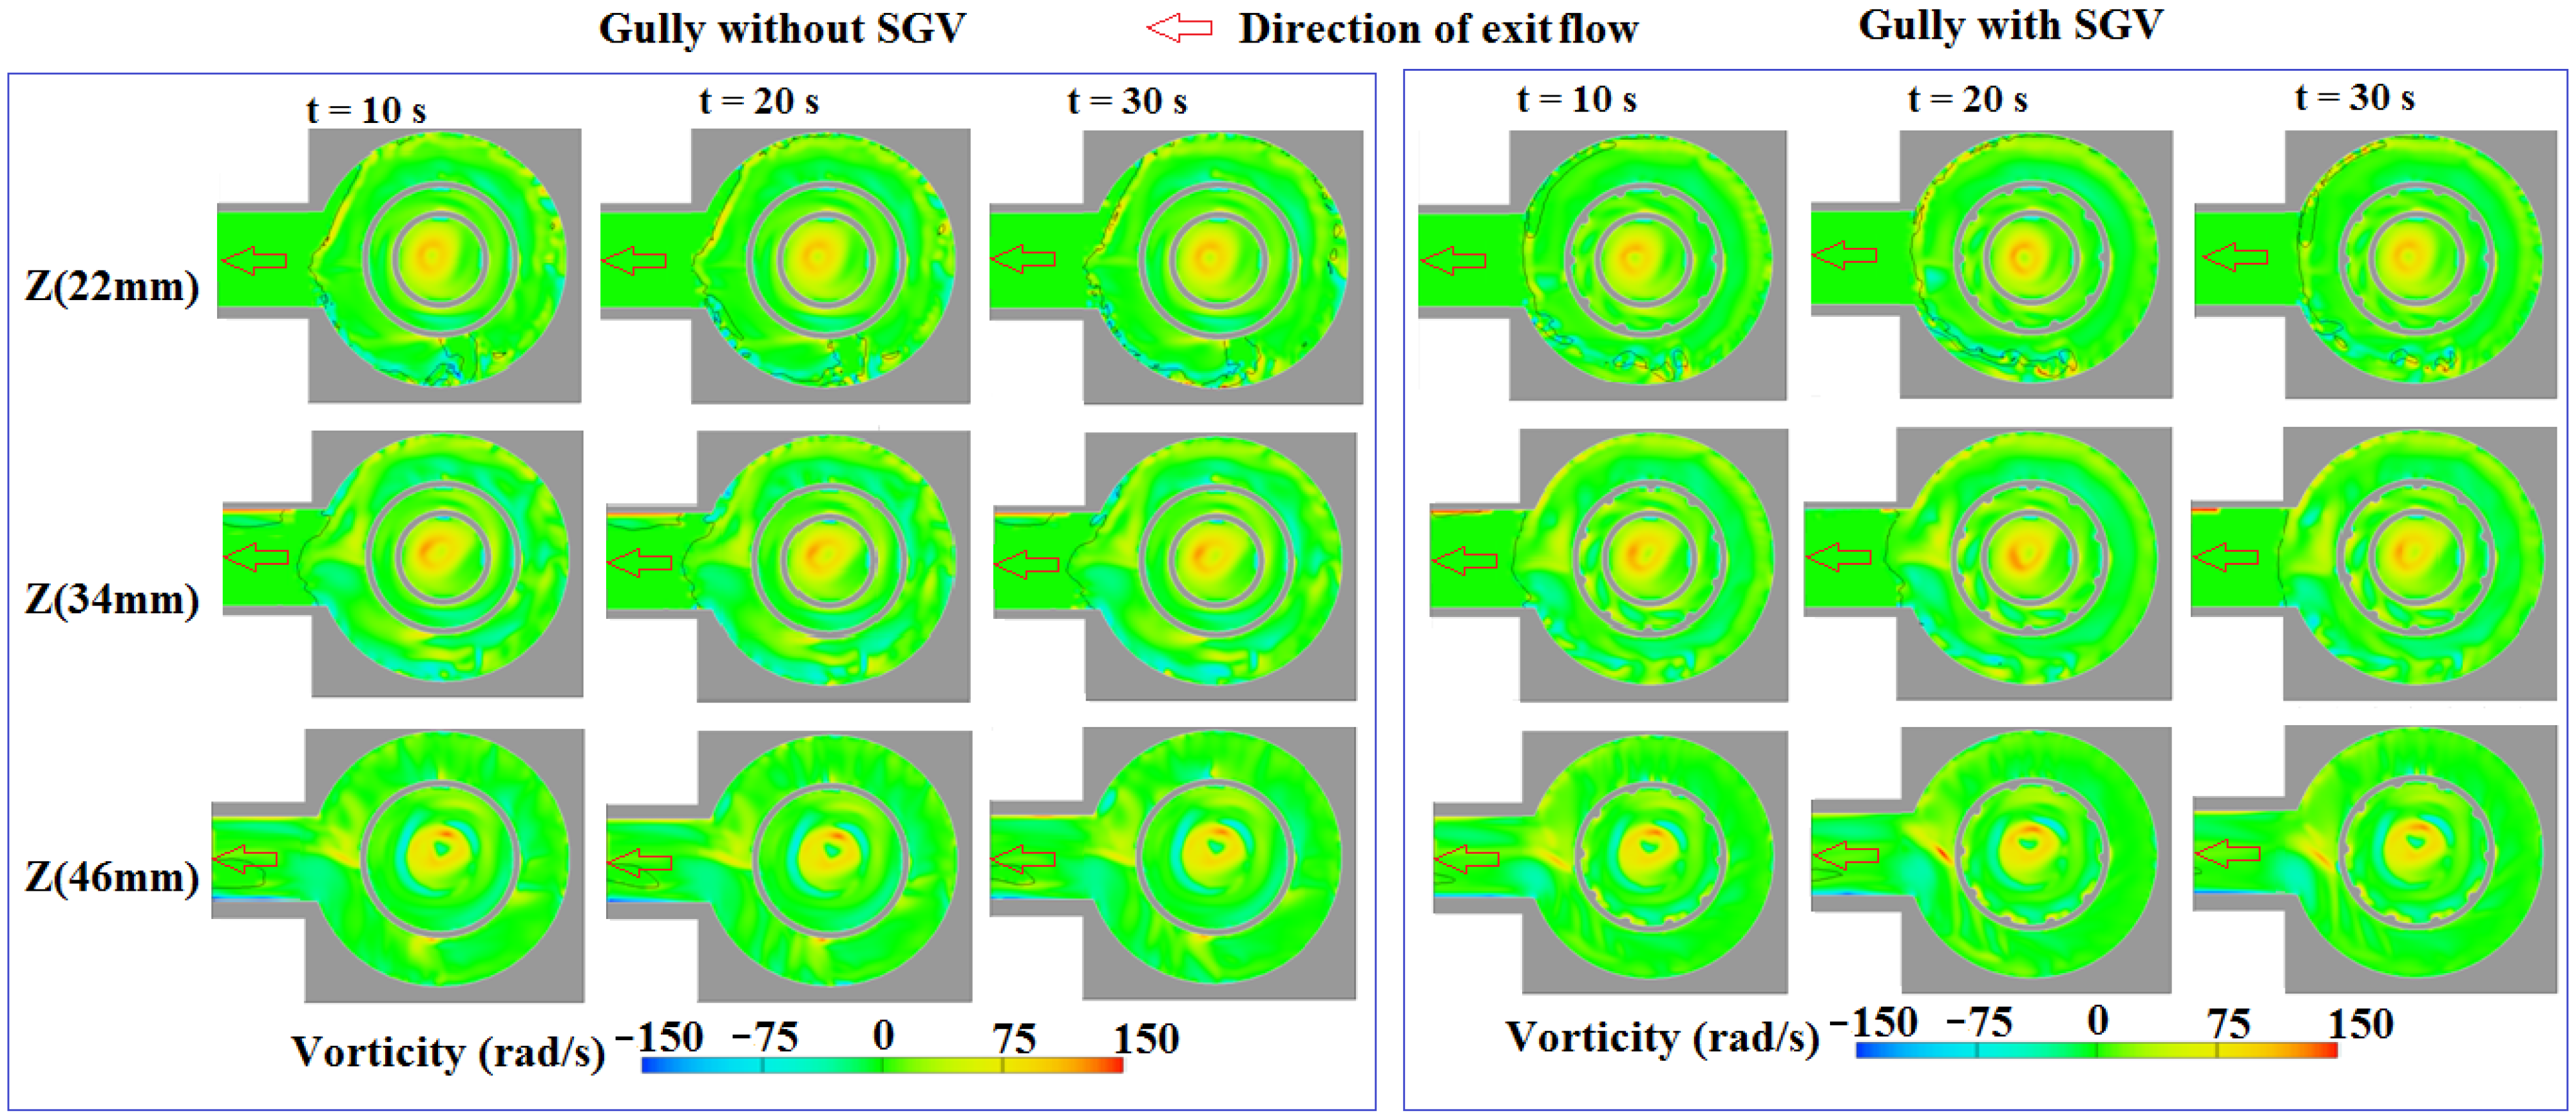
3.2. Air Entrainments by Entry Vortex

For this type of gully, the downstream air-water flow structures are affected by the flow phenomena caused by the entry vortex, which include the considerable air entrainments. Following the conventional vortex theory, considerable radial pressure variations over the free surface and among the vortex are generated and affected by local fluid velocities. This is demonstrated by Figure 5, which compares the distributions of instant velocity and pressure contours between the gullies with and without SGV over three horizontal XY planes at Z = 22, 34 mm that are sectioned through the annular pathway between the primary and secondary drums and at Z = 46 mm under the primary drum. As Z increases, the gravitational effect increases the hydrostatic pressures in general, which is evidently shown by sequentially examining the three pressure contours obtained at Z = 22, 34, 46 mm at each t selected shown by Figure 5. At Z = 22 mm, the XY section through the exit port is fully occupied by the airflow; whereas the evident anti-clockwise vortex circulation are already emerged to fully occupy the primary drum. At Z = 34 mm, the pressures along the vortex outer edge are further elevated but moderated at Z = 46 mm. When the downward vortex stream is radially spread on the XY plane at Z = 46 mm, the characteristic signatures for vortex are according weakened for both gullies as demonstrated by Figure 5. With all the flow fields sectioned through the XY planes at Z = 22, 34 and 46 mm, the vortex core consistently show the lowest pressure levels due to the high fluid velocities. As the fluids approach the center of vortex, the increased fluid velocities are accompanied with the reduced static pressures. Once the static pressures over the free surface of the entry vortex fall less than the atmospheric level, the surrounding air above the entry vortex is entrained into the swirling liquid pool and converted to the air-bubbles by the surface tension effect. With the air entrainments by the entry vortex, a considerable amount of drifting air bubbles in the flow pathways is consistently observed even if the void fraction (α) over the flow entry ports is zero at the a full-water conditions. Although the resolving air bubbles in the present test gully are partially attributed to the local pressure reductions along the flow pathway, the air entrainment by the entry vortex is considered as the manifesting mechanism responsible for introducing air bubbles into the water stream. This is demonstrated by Figure 6 in which a series of continuous flow snapshots are selected to illustrate the process of air entrainment by the entry vortex.
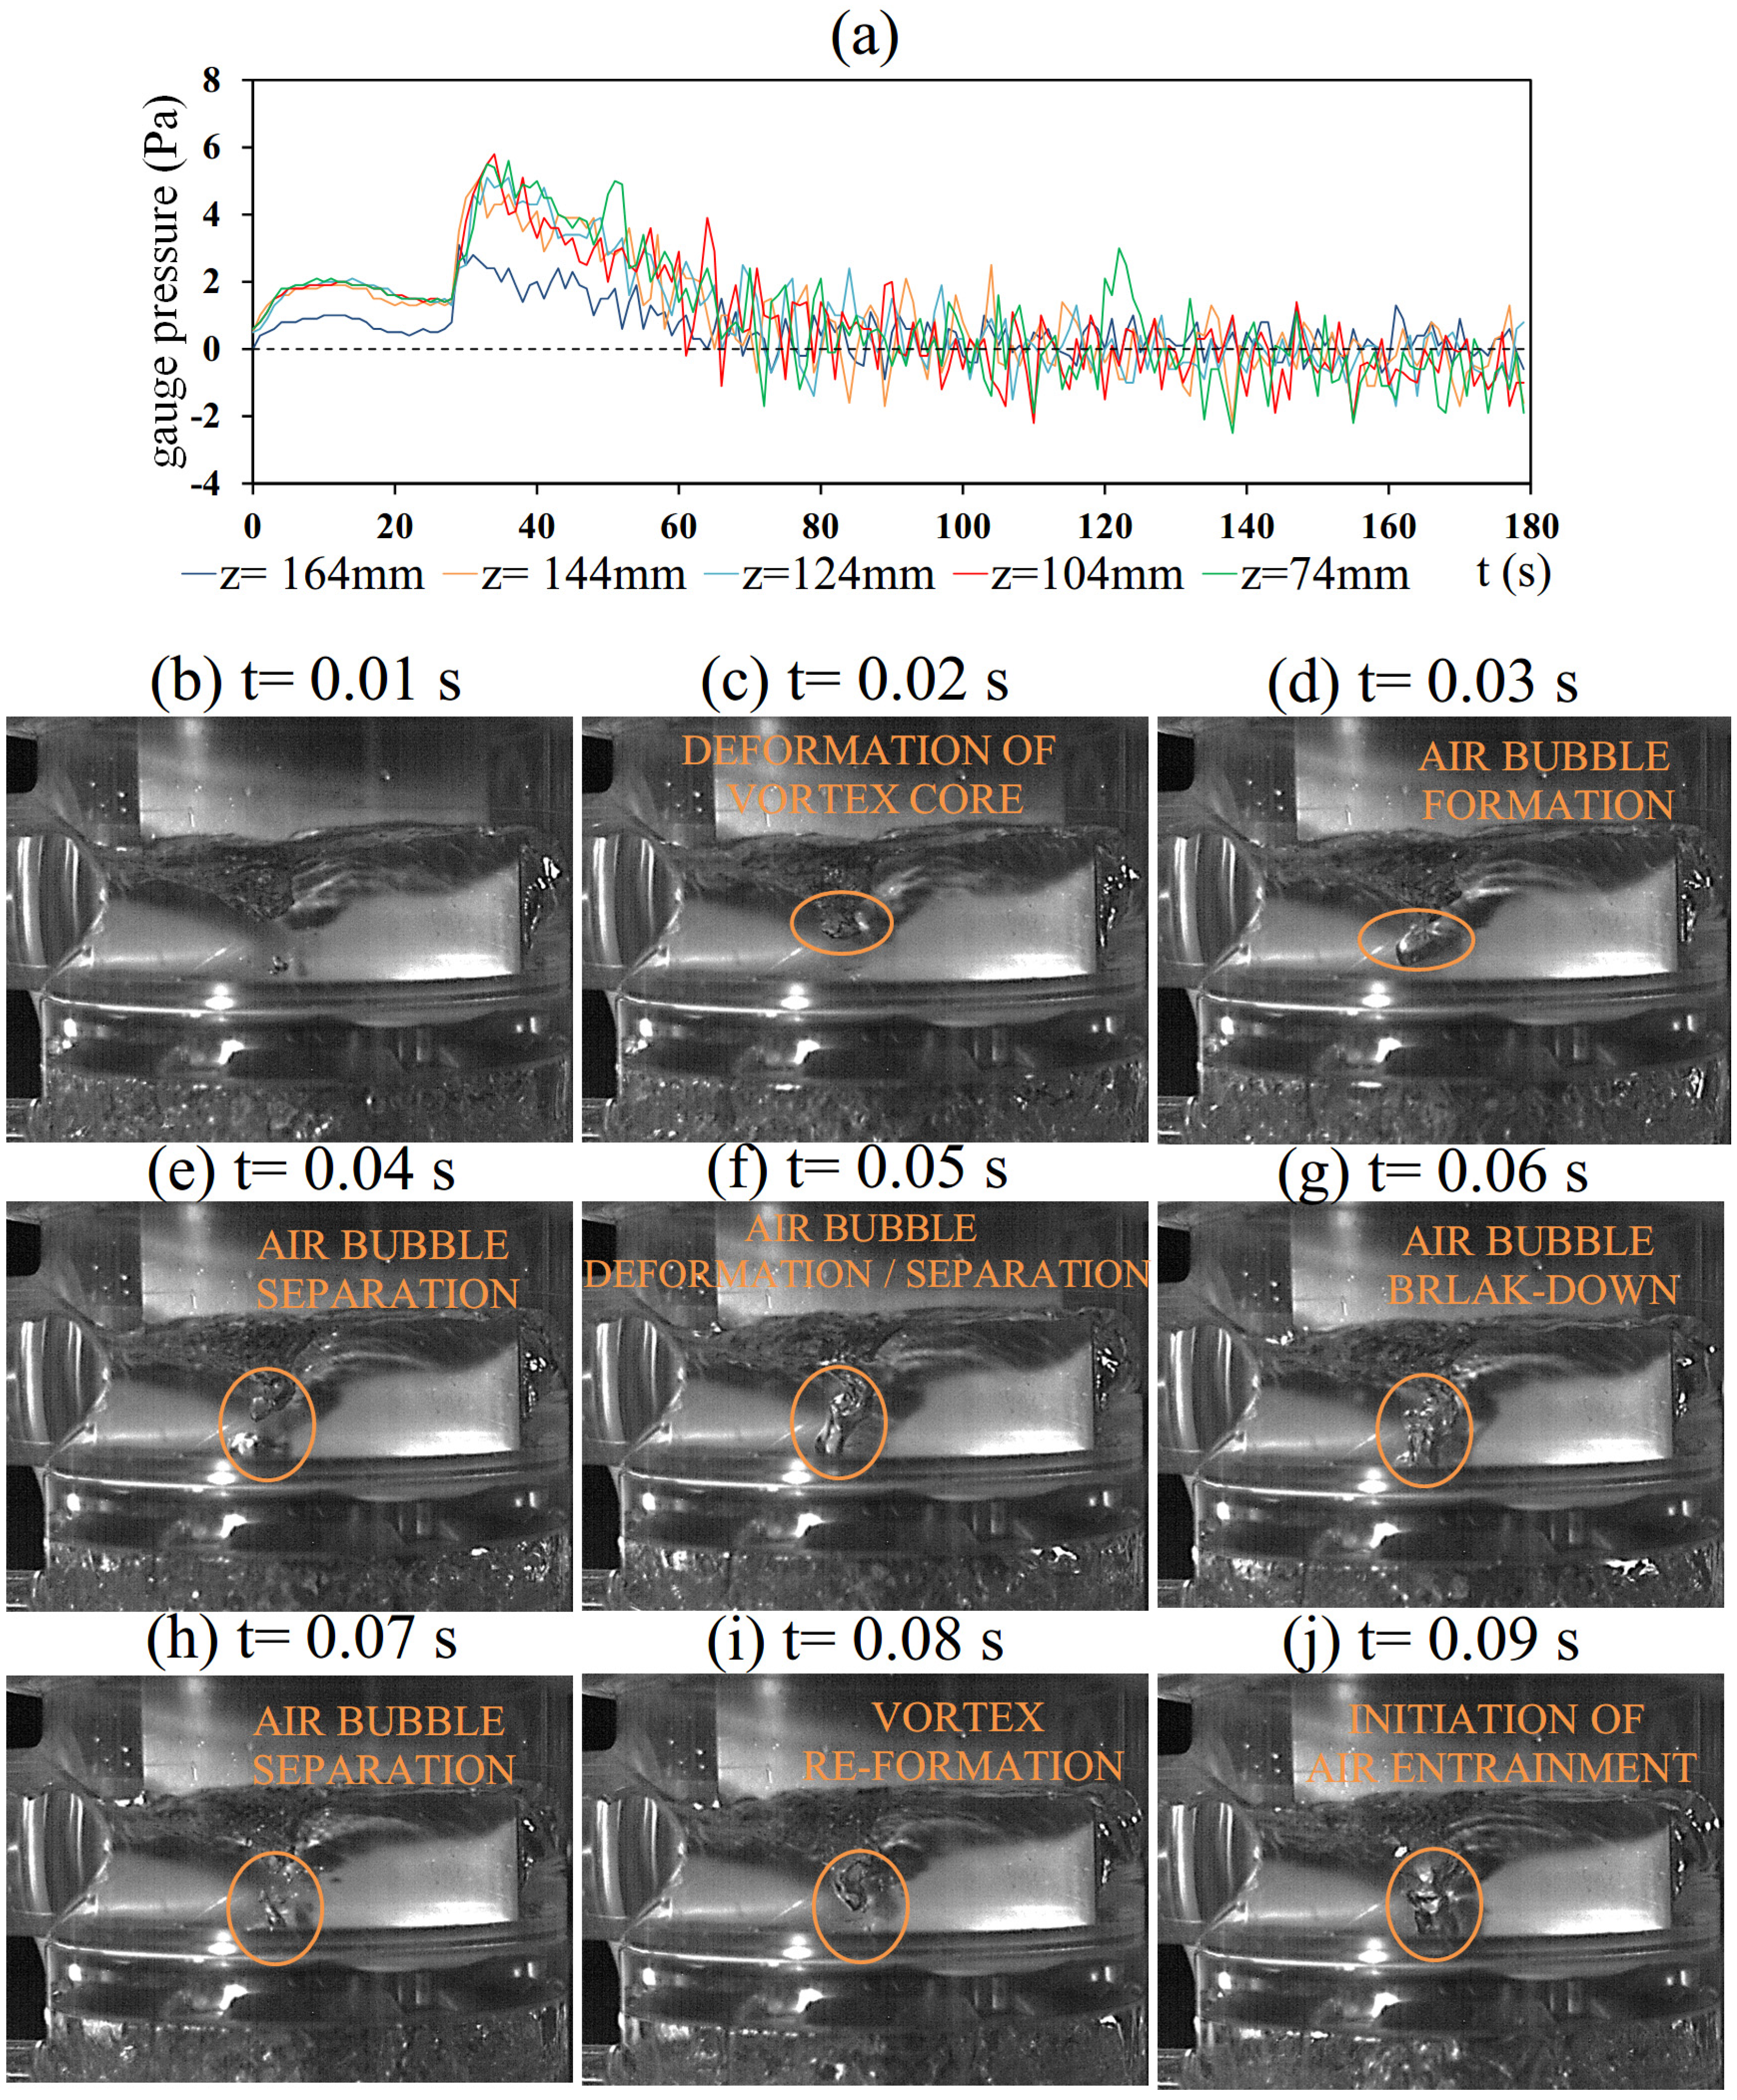
To experimentally verify and visualize the mechanisms for the air entrainment by the entry vortex, the temporal variations of the airflow pressures, starting from charging the mixed water into the test gully, are individually detected at the various Z locations along the vertical central core (X = Y = 0) as depicted in Figure 6a. At Z = 74 mm, the probe of pressure sensor is about 1 mm above the liquid surface of the entry vortex-core. All the temporal variations of the airflow static pressures collected in Figure 6a from the different Z locations follow a similar varying trend. Within an initial period about 30 s after feeding mixed water into the test gully at the single entry condition of Q = 30 L/min, the entry vortex remains as developing; whereas the liquid level in the gully is up-rising to compress the trapped air within the gully drum, leading to the positive pressure heads along the central core as shown by Figure 6a. At the instant that the discharge of mixed water flow is partially choked, the upstream pressure waves generate an abrupt pressure increase at all the measured Z locations as shown by Figure 6a. Followed by the sudden airflow pressure rises shown by Figure 6a, the growing strength of the entry vortex keeps accelerating and dragging the airflow adjacent to the free surface of the entry vortex, leading to the subsequent reducing trend of pressure reductions at all the Z locations seen in Figure 6j. The negative airflow pressures at the locations close to the free surface of entry vortex are then emerged and stayed to trigger the process of air entrainment as demonstrated by the following Figure 6b–j. Due to the complex and interactive air-water interfacial mechanisms among the vortex core region, the static airflow pressures start oscillating about the atmospheric level to promote the unsteady air entrainments by the entry vortex as t > 70 s for this particular test condition.
Figure 5. Distributions of instant velocity and pressure contour for gullies with/without SGV over horizontal XY planes at Z = 22, 34, 46 mm.
Water 07 00679 g005
The process of vortex deformation is initially observed at instants seen in Figure 6b–c by sharpening the vortex core in downward direction seen in Figure 6c. As a result of the driven pressure gradients on the free surface of the entry vortex, a lumped air bubble is formulated at the vortex core; but still coherently attached on the free surface of the entry vortex as shown by Figure 6d. After a short time lapse, the separation of air bubble into the liquid pool is observed as seen in Figure 6e; which can be occasionally followed by another sequence of vortex-core deformation and air-bubble separation seen in Figure 6f. The large-scale separated air bubble that submerges into the swirling liquid pool is generally broken into small air bubbles which scatter underneath the vortex core as indicated by Figure 6g–h. The interfacial air-bubble evolutions disclosed by sequentially viewing the flow snapshots detected at the instants shown by Figure 6b–h are followed by the subsequent vortex-core deformation as typified in Figure 6i to complete an air-entrainment process induced by the entry vortex. The successive process for another air entrainment is initiated with the flow image shown by Figure 6j. It is noticed, with present test gullies, the entire air entrainment process by entry vortex, as typified by Figure 6b–j, is completed within 1 s.
In addition to the considerable flow resistances by the air bubbles in the flow passages formulated in the gullies without and with SGV as demonstrated by Figure 4, the entrained air into the water stream also affect the vorticity distributions in the gullies. To explore the impact of entrained air on vorticity distributions, the instant vorticity contours for the gullies with/without SGV over horizontal XY planes at Z = 22, 34, 46 mm at t = 10, 20 and 30 s with QA = QB = 15 L/min, which corresponding to the Computational Fluid Dynamics (CFD) scenarios collected in Figure 3, are compared by Figure 7.
Figure 6. Temporal airflow pressure variations and corresponding flow snapshots demonstrating the process of air entrainment by entry vortex.
Water 07 00679 g006
It is interesting to note the ring of high vorticity circling around the center of entry vortex. Due to the air-entrainment taking place at the center of the entry vortex, the development of local angular momentum by the shearing action resulting from the particular fluid velocity field is interfered. As a result, the local vorticity at the center region of the entry vortex is weakened to be less than those emerging along the surrounding rim shown by Figure 7. Over the annular sections between the gully casing and the secondary drum, several spots show the negative vorticites, in particular along the air-water interfacial boundaries marking as the black solid lines in Figure 7. The counteracting circulations for the air bubbles in the water stream are suggested by present numerical results. Above all, with applications to drainage systems, present type of gullies can be classified as the appliance capable of entraining air into the drainage system. Flow instabilities are mainly attributed to the air bubble interactions in the agitating bubbly flow region specified by Figure 4.
Figure 7. Distributions of instant vorticity for gullies with/without SGV over horizontal XY planes at Z = 22, 34, 46 mm.
Water 07 00679 g007

3.3. Air Bubble Drifts in Test Gullies with/without SGV

As the primary contributions of present SGV for improving the hydrodynamic performances of this type of gullies, the near-wall water streams tripped by the angled SGV assist to guide the drifting air bubbles over the agitating bubbly flow region. This is demonstrated by Figure 8 in which the trajectories of drifting air bubbles in the test gullies without and with angled SGV are compared. The instant flow snapshots adopted to identify the drifting trajectories for the air bubbles in the agitating bubbly flow region are also shown in Figure 8. As summarized in the conceptual flow diagram for the test gully without SGV in Figure 8, the drifting trajectories of air bubbles mainly follow three routes indicated by the A, B, C traces in the flow snapshots as shown in Figure 8. Along the drifting routes A and B in the test gully without SGV, the complex bubble collisions and coalescences and oscillations are observed. Relative to the gully with SGV, the highly agitated free surface between the secondary drum and the gully outer cylindrical casing is observed for the test gully without SGV. By fitting the angled SGV along the cylindrical wall of the secondary drum, the air bubbles are drifting along with the near-wall water streams tripped by the angled SGV so that all the A, B, C trajectories for air bubble drifts in the agitating bubble flow region are guided/stratified along the angled SGV direction to moderate the flow instabilities caused by the random air bubble collisions and coalescences and oscillations.
Figure 8. Drifting trajectories of air bubbles in test gullies without/with SGV.
Water 07 00679 g008

3.4. Self-Depuration Performances

While the agitations of air-bubbles and the motion of free-surface in present test gullies without and with SGV are considerably different, the performances of self-depuration are similar. Figure 9 compares the temporal variations of L/L1 ratios at all the tested flow rates with single and twin flow entry conditions for the test gullies without and with SGV. As compared by Figure 9, the temporal variations of L/L1 ratios at all the tested flow conditions with single and twin flow entries follow the similar pattern. Prior to charging the mixed water into each test gully, the dye concentration is controlled to provide the referenced L/L1 ratios at about 0.4. After feeding the mixed water into each test gully, an initial start-up period with stable L/L1 levels proceeds about 10 s. Following the stable period with L/L1 ratios at about the reference “dark” condition, the L/L1 ratios increase sharply within a short period about 5 s. The physical implication for such rapid L/L1 increase is the significant improvement for the self-depuration performance attributed to the development of entry vortex which effectively discharges the dyed water and replenishes with the supplied fresh mixed water. While the air entrainment is mainly caused by the entry vortex, the self-depuration performance is considerably improved by the entry vortex which rapidly replaces the dyed water by the mixed water. After the period of rapid L/L1 increase, an exponential-like period of moderate L/L1 increase over the period about 3–10 s is followed. As Q increases, the initiation of the rapid L/L1 increase is advanced as shown by Figure 9. Thus, the consistent reduction of self-depuration period by increasing the discharge capacity is observed in Figure 9. The variations of self-depuration time for each test gully against total entry water flow rate at single and twin entry conditions are summarized in Figure 10. As compared with the three data trends obtained at single and twin flow entry conditions, the self-depuration time for the test gullies without and with SGV at the two single flow entry conditions labeled as QA and QB in Figure 10 are similar. By feeding the air-water mixed flows from present two perpendicular flow entry pipes in tangent with the gully drum, the flow momentums required to formulate the entry vortex are likely to be raised from the conditions with single entry flow. With the enhanced vortical strength for the entry vortex at the twin-entry flow conditions, the self-depuration time is consistently less than the single-entry counterpart for the test gullies without/with SGV as shown by Figure 10. Justified by the data trends revealed in Figure 10, the empirical correlations for the self-depuration time are devised as Equations (3)–(5) and (6)–(8) for present test gullies without and with gullies:
T = −14.38 ln(QA) + 73.77 (single flow entry A for gully without SGV)
T = −13.83 ln(QB) + 73.33 (single flow entry B for gully without SGV)
T = −15.01 ln(QA + QB) + 72.75 (twin flow entry A+B for gully without SGV)
T = −13.19 ln(QA) + 70.35 (single flow entry A for gully with SGV)
T = −13.1 ln(QB) + 68.81 (single flow entry B for gully with SGV)
T = −12.55 ln(QA + QB) + 63.37 (twin flow entry A+B for gully with SGV)
Figure 9. Temporal L/L1 variations for test gullies without/with SGV at single/twin entry conditions.
Water 07 00679 g009
Figure 10. Variations of self-depuration time for test gullies without/with SGV at single/twin entry conditions.
Water 07 00679 g010

4. Conclusions

This experimental and numerical work comparatively examined the hydrodynamic performances of two test gullies without and with SGV to enlighten the air-water flow structures, air entrainment mechanisms, air-bubble drifts and self-depuration properties. The conclusions emerge from this study are served as the design considerations with the applications to drainage systems in buildings. With the entry vortex formulated in the primary drum; this type of gullies is classified as the appliance that entrains air into the drainage system.
Air bubbles entrained by the entry vortex in present test gully without SGV interact chaotically in the agitating bubbly flow region. With SGV on the cylindrical wall of test gully, the near-wall flows tripped by the angled SGV stratify the drifting trajectories of the air bubbles, leading to the stabilized air-bubble interactions. Justified by the 3-D Fr distributions, the flow resistances attributed to the chaotic air bubble agitations in the gully without SGV supersede the flow resistances caused by the SGV. The maximum discharging rates for the test gully with SGV at present pressure head of 1.2 m water-height are increased more than 7% from the discharges by the gully without SGV.
After an initial short period of stable low L/L1 levels during which the entry vortex is under development, the rapid L/L1 increase followed by the exponential-like moderate L/L1 increase reflects the characteristic self-depuration property for this type of gullies with entry vortex. The consistent reduction of self-depuration period by increasing the discharge capacity is consistently observed for present test gullies without and with SGV. Two sets of empirical correlations that permit the estimation for self-depuration periods at single and twin entry flow conditions for present test gullies without and with SGV are devised to assist the relevant industrial applications.

Author Contributions

Der-Chang Lo performed the Computational Fluid Dynamics (CFD) simulation to reveal the fundamental air-water flow phenomena in the multi-entry gully. Jin-Shuen Liou carried out the experimental tests and data analysis. Shyy Woei Chang wrote the paper, proposed the SGV and formulated the experimental method to investigate the effects of SGV on the hydrodynamic performances for the multi-entry gully.

Nomenclature Nomenclature

English Symbols

c
water wave propagation velocity (ms−1)
d
entry tube diameter (m)
Fr
Froude number = u/c
L
lumen
Q
volume flow rate (L min−1)
ReL
Reynolds number of liquid flow for mixed entry water = ρLVLd/μL
T
self depuration time for test gully (s)
u
fluid velocity (ms−1)
X,Y,Z
coordinate (m)

Greek Symbols

α
void fraction of entry flow
ρL
density of liquid flow for mixed entry water (kg·m−3)
μL
dynamic viscosity of liquid flow for mixed entry water (kg·s−1·m−1)

Subscripts 

A
flow entry A
B
flow entry B

Conflicts of Interest

The author declares no conflict of interest.

References

  1. Swaffield, J.A.; Campbell, D.P. Air pressure transient propagation in building drainage vent systems, an application of unsteady flow analysis. Build. Environ. 1992, 27, 357–365. [Google Scholar] [CrossRef]
  2. Swaffield, J.A.; Campbell, D.P. The simulation of air pressure propagation in building drainage and vent system. Build. Environ. 1995, 30, 115–127. [Google Scholar] [CrossRef]
  3. Chang, S.W.; Hsieh, C.-M.; Lin, C.Y.; Liou, H.-F. Air-water drainage flow through finned bend. J. Asian Archit. Build. Eng. 2012, 11, 177–184. [Google Scholar] [CrossRef]
  4. Swaffield, J.A.; Jack, L.B.; Campbell, D.P. Control and suppression of air pressure transients in building drainage and vent systems. Build. Environ. 2004, 39, 783–794. [Google Scholar] [CrossRef]
  5. Cheng, C.L.; Mui, K.W.; Wong, L.T.; Yen, C.J.; He, K.C. Characteristics of air pressure fluctuations in high-rise drainage stacks. Build. Environ. 2010, 45, 684–690. [Google Scholar] [CrossRef]
  6. Swaffield, J.A.; Campbell, D.P. Numerical modeling of air-pressure transient propagation in building drainages, including the influence of mechanical boundary conditions. Build. Environ. 1992, 27, 455–467. [Google Scholar] [CrossRef]
  7. Ma, J.; Oberai, A.; Lahey, R., Jr.; Drew, D. Modeling air entrainment and transport in a hydraulic jump using two-fluid RANS and DES turbulence models. Heat Mass Transf. 2011, 47, 911–919. [Google Scholar] [CrossRef]
  8. Ma, J.; Oberai, A.; Drew, D.; Lahey, R., Jr.; Hyman, M. A comprehensive sub-grid air entrainment model for RaNS modeling of bubbly flows near the free surface. J. Comput. Multiph. Flows 2011, 3, 41–56. [Google Scholar] [CrossRef]
  9. Wright, G.B.; Swaffield, J.A.; Arthur, S. The performance characteristics of multi-outlet siphonic rainwater systems. Build. Serv. Eng. Res. Technol. 2002, 23, 127–141. [Google Scholar] [CrossRef]
  10. Wright, G.B.; Arthur, S.; Swaffield, J.A. Numerical simulation of the dynamic operation of multi-outlet siphonic roof drainage systems. Build. Environ. 2006, 41, 1279–1290. [Google Scholar] [CrossRef]
  11. Chang, S.W.; Lo, D.C. Chapter 6 Air-Water Two-Phase Flows with Applications to Drainage System. In Advances in Multiphase Flow and Heat Transfer, 2nd ed.; Bentham Science Publishers Ltd.: Sharjah, UAE, 2009; pp. 176–215. [Google Scholar]
  12. Chang, S.W.; Lo, D.-C.; Liou, H.-F.; Liou, J.S. Hydrodynamic performances of gully with air-water flows in drainage system. J. Water Resour. Supply Drain. Build. 2014, 1, 1–19. [Google Scholar]

