Article

Quantitative Impacts of Climate Change and Human Activities on Water-Surface Area Variations from the 1990s to 2013 in Honghu Lake, China

1
Key Laboratory of Monitoring and Estimate for Environment and Disaster of Hubei Province, Institute of Geodesy and Geophysics, Chinese Academy of Sciences, Wuhan 430077, China
2
University of Chinese Academy of Sciences, Beijing 100049, China
3
State Key Laboratory of Geodesy and Earth's Dynamics, Institute of Geodesy and Geophysics, Chinese Academy of Sciences, Wuhan 430077, China
4
Regional Climate Center of Wuhan, Wuhan 430074, China
*
Author to whom correspondence should be addressed.
These authors contributed equally to this work.
Water 2015, 7(6), 2881-2899; https://doi.org/10.3390/w7062881
Submission received: 15 May 2015 / Accepted: 9 June 2015 / Published: 15 June 2015

Abstract

:
The water-surface areas of the lakes in the mid-lower reaches of the Yangtze River, China, have undergone significant changes under the combined impacts of global climate change and local anthropogenic stress. As a typical lake in this region, the Honghu Lake features water-surface area variations that are documented in this study based on high–resolution remote sensing images from the 1990s to 2013. The impact of human activities is analyzed by a novel method based on land use data. The relative impacts of each driving force are further distinguished by the statistical analysis method. Results show that the water-surface area has significant inter-annual and seasonal variabilities, and the minimum of which generally occurs in spring. The degree to which climate factors and land use structure affect the water-surface area varies between different stages. In the April-May period, the sum of the water demands of paddies and aquaculture has a negative effect that is greater than the positive effect of the difference between the monthly precipitation and monthly evaporation. In the June–October period, the precipitation features a positive impact that is greater than the negative effect of the water demand of agriculture. Meanwhile, climate factors and human activities have no influence on the lake area in the November–March period. With the land use being altered when annual precipitations are close in value, paddy field areas decrease, ponds areas increase, and the water demand of agriculture rises in both flood and drought years. These findings provide scientific foundation for understanding the causes of water-surface area variations and for effectively maintaining the stability of the Honghu Lake area through adjustments in land use structure.

1. Introduction

Lakes are essential fresh water bodies, which are not only vital resource for human life and productive activities, but also play an important role in the biogeochemical and hydrological cycles. The water-surface area variations of lakes are regulated by water inputs (i.e., precipitation, surface inflow, groundwater inputs) and water outputs (i.e., evaporation, surface outflow, groundwater outputs). Moreover, the water inputs and outputs are affected by anthropogenic activities. Agriculture, industry and other human activities mainly affect the water-surface areas of lakes via land use change [1,2]. Due to climate change and anthropogenic activities, many inland lakes in China have undergone dramatic changes in both number and area during the past 30 years. Two-hundred forty-three lakes have disappeared and 60 lakes newly formed in this time period, respectively [3]. For example, the rapidly rising temperature has accelerated glacier melt throughout almost the entire Tibetan Plateau, which causes the rapid lake expansion in this region [4,5,6,7,8]. Moreover, the number of vanished lakes in the middle and lower reaches of the Yangtze River accounts for 40% of total loss of lakes in China, which is mainly attributed to human activities such as exploitation of fisheries, reclamation of land and construction of water conservancy [9]. In particular, the construction and operation of the Three Gorges Dam (TGD) exert large influence on downstream lakes, making it a hot issue in the middle and lower reaches of the Yangtze River.
Honghu Lake, located in the mid-lower reaches of the Yangtze River, is the seventh largest freshwater lake in China. As the largest lake among thousands of water bodies in the Jianghan Plain, Honghu Lake plays an irreplaceable role in regional irrigation for agriculture, fisheries, and upstream flood drainage [10]. The extreme climate events (i.e., flood and drought) are so frequent in the mid-lower reaches of the Yangtze River that the water-surface area of Honghu Lake can change greatly on both short and long time scales due to precipitation and temperature anomalies. Especially since the 1950s, Honghu Lake has been separated from the Yangtze River by several sluice gates, and hardly been modulated by upstream of Yangtze River [11]. From this point, Honghu Lake area has decreased dramatically, which is mainly caused by excessive human activities mainly including reclamation and aquaculture [12]. According to previous studies [13], the quantitative impacts of climate change and human activities on Honghu Lake area variations are controversial, which is also the focus of this paper.
Previous studies have investigated water-surface area variations of Honghu Lake based on remote sensing images, but they are subjected to low measurement frequency and resolution [13,14]. Besides, there are many challenges to quantitatively estimate impacts of each driving force on lake area variations, especially for human activities due to lack of comprehensive and reliable data. For example, Liang et al. [13] only use fishery production data to analyze the influence of human activities on the water-surface area variations of Honghu Lake. In this paper, the longer times series of high resolution (30 m) Landsat and HJ-1 A/B images from 1990s to 2013 is used, which is more suitable to extract the seasonal and inter-annual changes in water-surface area of Honghu Lake. In addition, the area of dryland agriculture, paddies and aquiculture ponds, accounting for a major portion of land use data in 1990, 2000 and 2010, are used to analyze the impacts of human activities. The quantitative impacts of climate change and human activities on Honghu Lake obtained in this study will provide helpful reference for local water resource management, ecologic environment protection, and a better understanding of climate change.

2. Study Region and Data Source
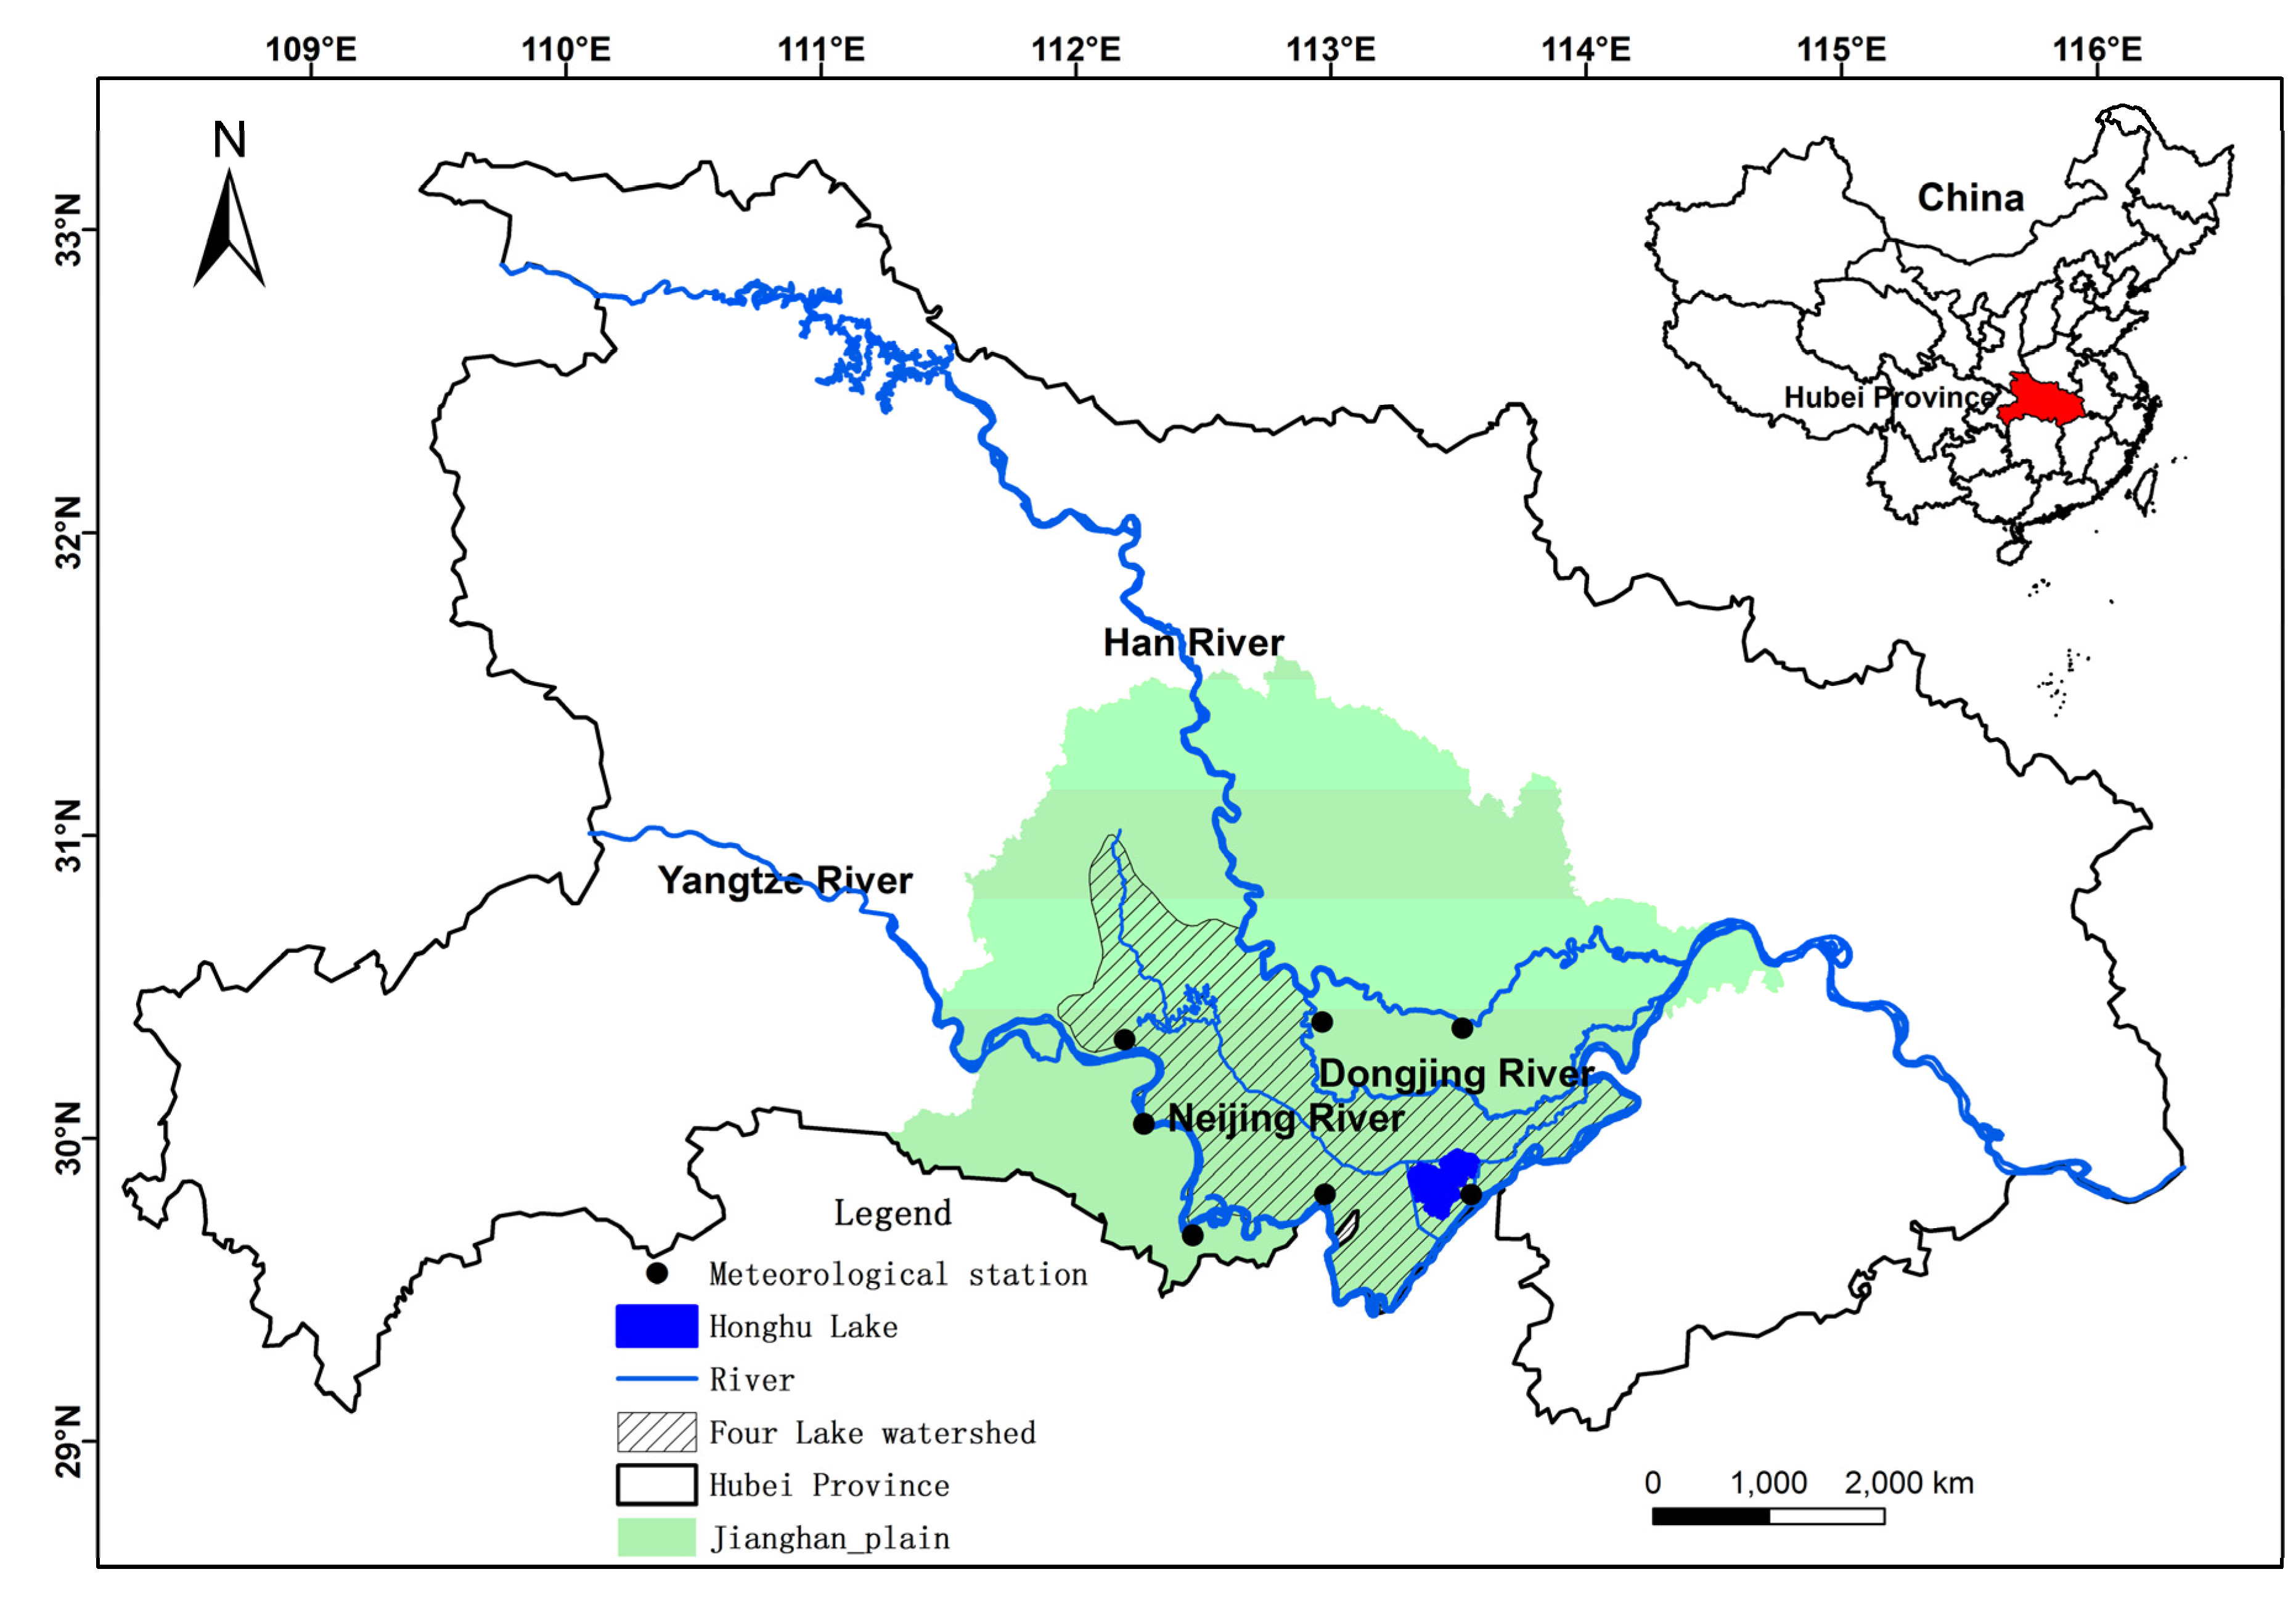
2.1. Study Region

Honghu Lake (Figure 1), located at the end of the Four Lake watershed of Jianghan Plain in the middle reach of the Yangtze River (29°48′ N, 113°17′ E as its geographic center), is the seventh largest freshwater lake in China across Honghu City and Jianli County of Hubei Province, with an average depth of 2 m. The area is situated at the northern fringe of a temperate subtropical zone, with an annual average precipitation and temperature in a range of 1000–1300 mm and 15.9–16.6 °C respectively. Honghu Lake is also the largest natural wetland on the Jianghan plain, which is surrounded by the mainstream of the Yangtze River and the Dongjing River, a tributary of the Hanjiang River. Due to the increasing human activities, the lake and wetland suffer a series of eco-environmental problems in recent years, such as water-surface shrinking, wetland deterioration and water quality deteriorated [11,15]. In order to prevent this degeneration, with the support of the State Forestry Administration (SFA), China, World Wide Fund for Nature (WWF) and local government and sectors, the Honghu Lake wetland protection and restoration demonstration project has been implemented since 2004.

2.2. Data Source

Landsat TM/ETM/OLI and HJ-1 A/B images were selected to extract water-surface area and land use changes for their high spatial resolution (30 m). Landsat data collected from 1990s to 2013 and HJ-1 A/B data collected from 2008 to 2013 were freely acquired from United States Geological Survey (USGS) [16] and China Center for Resources Satellite Data and Application [17], respectively. HJ-1A/B satellites are two small environment satellites equipped with the same CCD camera, which were launched on 6 September 2008 by China [18]. The low revisiting cycles every 48 h provided by the two satellites’ constellation has great advantages in monitoring water area and land use changes. HJ-1 A/B have similar spectral range in the first four bands of Landsat TM/ETM+ image, but have much wider images reaching 700 km. The NIR-R-G “false-color” images were examined visually to choose cloud-free data in this study. In addition, 135 cloud free scenes (including 97 Landsat and 38 HJ-1A/B scenes) were selected. To obtain the real reflectivity data from land surface, Landsat data were processed by radiometric calibration and atmospheric correction processing, and HJ-1 A/B data needed geometric correction based on Landsat5 TM, radiometric calibration and atmospheric correction.
Figure 1. Location of Honghu Lake, Hubei Province, China.
Water 07 02881 g001
The daily precipitation, average temperature, daylight hours, and wind speed data sets measured at seven meteorological stations located around the Honghu Lake were provided by the Meteorological Bureau in Hubei Province. In addition, the relative humidity data were downloaded from the China Meteorological Data Sharing Service System [19].

3. Methods

3.1. Extraction of Water-Surface Area

Many studies show that the object-oriented classification is preferred over traditional pixel-based classification method [20,21,22,23,24]. The object-oriented method fully utilizes the spectrum, spatial information, texture and other characteristics provided by remote sensing images to carry out classification. Therefore, object-oriented method is selected to extract water-surface area in this study. In the process of extracting water-surface area, the steps followed are image multi-scale segmentation, application of remote sensing indexes, setting of the indexes’ threshold and establishment of classification rule sets based on eCognition8.64 software. The remote sensing indexes are used to delineate the water-surface area based on the difference of the absorption and reflection of light between water and other features on different frequency bands. In this study, the normalized difference water index (NDWI) [25], modification of normalized difference water index (MNDWI) [26], normalized difference of RVI and NDWI (NDRW) [27] and NDVI-NDWI [28] are compared with each other to determine the optimal water extraction index. The results indicate that the best index for Landsat and HJ1A/B data is MNDWI and NDRW, respectively, which can be used to distinguish water body and artificial construction land more accurately. It should be noted that water-surface area of Honghu Lake in this study does not include the area of enclosures aquiculture. The MNDWI and NDRW are calculated with the following equations:
M N D W I = ( ρ G r e e n ρ M I R ) ( ρ G r e e n ρ M I R )
N D R W = R V I N D W I R V I + N D W I , R V I = ρ N I R ρ Re d , N D W I = ( ρ G r e e n ρ N I R ) ( ρ G r e e n ρ N I R )
where ρ G r e e n , ρ N I R , ρ Re d and ρ M I R are green band, near-infrared band, red band and middle-infrared band reflectance, respectively.

3.2. Influence Factors of Water-Surface Area Variations

As a semi-closed lake, the water balance of Honghu Lake can be simply expressed as the difference of water inputs and outputs [29]:
Δ W l a k e = S ( h l a k e ) ( P l a k e E l a k e ) + Q in Q out
where Δ W l a k e is the lake water storage variations; S ( h l a k e ) refers to water-surface area, which is the function of lake water level ( h l a k e ); P l a k e and E l a k e represents the direct precipitation and evaporation over the lake, respectively. Q in and Q out , respectively, means the water inputs and outputs of Honghu Lake.

3.2.1. Precipitation and Evaporation Estimate

For Honghu Lake, Q in in Equation (3) is mainly determined by runoff, which is closely related to surface precipitation within the catchment. Due to lack of hydrological stations, Q in in this study is simply evaluated by calculating the precipitation from the meteorological stations within the catchment. Figure 1 illustrates the Honghu Lake catchment that is extracted using hydrological analysis of ArcGIS software. In addition to three meteorological stations within the catchment, four others adjacent to the catchment are also selected. Then the gridded precipitation data ( 0.05 0 × 0.05 0 ) within the catchment is interpolated by Inverse Distance Weighting (IDW) method [30]:
P ( s 0 ) = i = 1 N λ i P ( s i )
λ i = 1 d i 0 2 i = 1 N 1 d i 0 2
where N is the number of measured sample points; P ( s i ) are the observed values at sampled locations s i . P ( s 0 ) are the unknown values in location s 0 . λ i are the weights assigned to each measured point, and d i 0 is the distance between s 0 and s i . According to Equation (4), the measured values closest to the prediction location have more influence on the predicted value than those farther away.
Evaporation is an important component of lake water balance, but estimation of this flux over Honghu Lake is challenging due to lack of direct measurements over the lake surface. In this study, meteorological elements (including temperature, sun hour, relative humidity and wind speed) measured at Honghu meteorological station are used to calculate evaporation of Honghu Lake base on simplified version for the Penman equation [31]:
E o p e n 0.051 ( 1 α ) R s T + 9.5 0.188 ( T + 13 ) ( R S R A 0.194 ) [ 1 0.00014 ( 0.7 T M a x + 0.3 T M i n + 46 ) 2 R H 100 ] + 0.049 ( T M a x + 16.3 ) ( 1 R H 100 ) ( 0.54 U )
where α is solar radiation reflection coefficient of water-surface, which equals 0.08 for open water surface; R s is solar radiation and extraterrestrial radiation, respectively, which are expressed in MJ / m 2 / d ; T is average temperature, T M a x and T M i n is the maximum temperature and the minimum temperature, respectively; R H is relative humidity; U is wind speed at 2 m height.

3.2.2. Land Use Change

The field survey data shows that Q out in Equation (3) is mainly affected by human activities (agriculture, industry, and domestic), of which agricultural water demand account for 80% [32]. Hence, the water consumption for agriculture calculated from land use data is selected as the key driving force factor to analyze the impacts of human activities on Honghu Lake. Combined with the object-oriented classification method and field investigation, the land use data covering Honghu city and Jianli County is obtained by interpreting remote sensing images (HJ-1A/B) in spring (17 March), summer (3 August) and winter (2 January) of 2010. In the process of interpretation, a series of steps including the image segmentation, remote sensing indexes selection for different land use, threshold setting and classification tree and rule sets establishment are implemented based on eCognition8.64. Based on the land use data of 2010, the land use dynamic changes between 2000 and 2010 are extracted combined with object-oriented classification method and change vector analysis (CVA) [33,34]:
C V A = ( b t 1 1 b t 2 1 ) 2 + ( b t 1 2 b t 2 2 ) 2 + ... + ( b t 1 i b t 2 i ) 2
where b t 1 i and b t 2 i is i band reflectance at time t 1 and t 2 . After these land use dynamic changes are interpreted and assigned the attributes visually, the land use classification data of 2000 is obtained. Similarly, land use classification data of 1990 is obtained with above method.

4. Results and Discussion

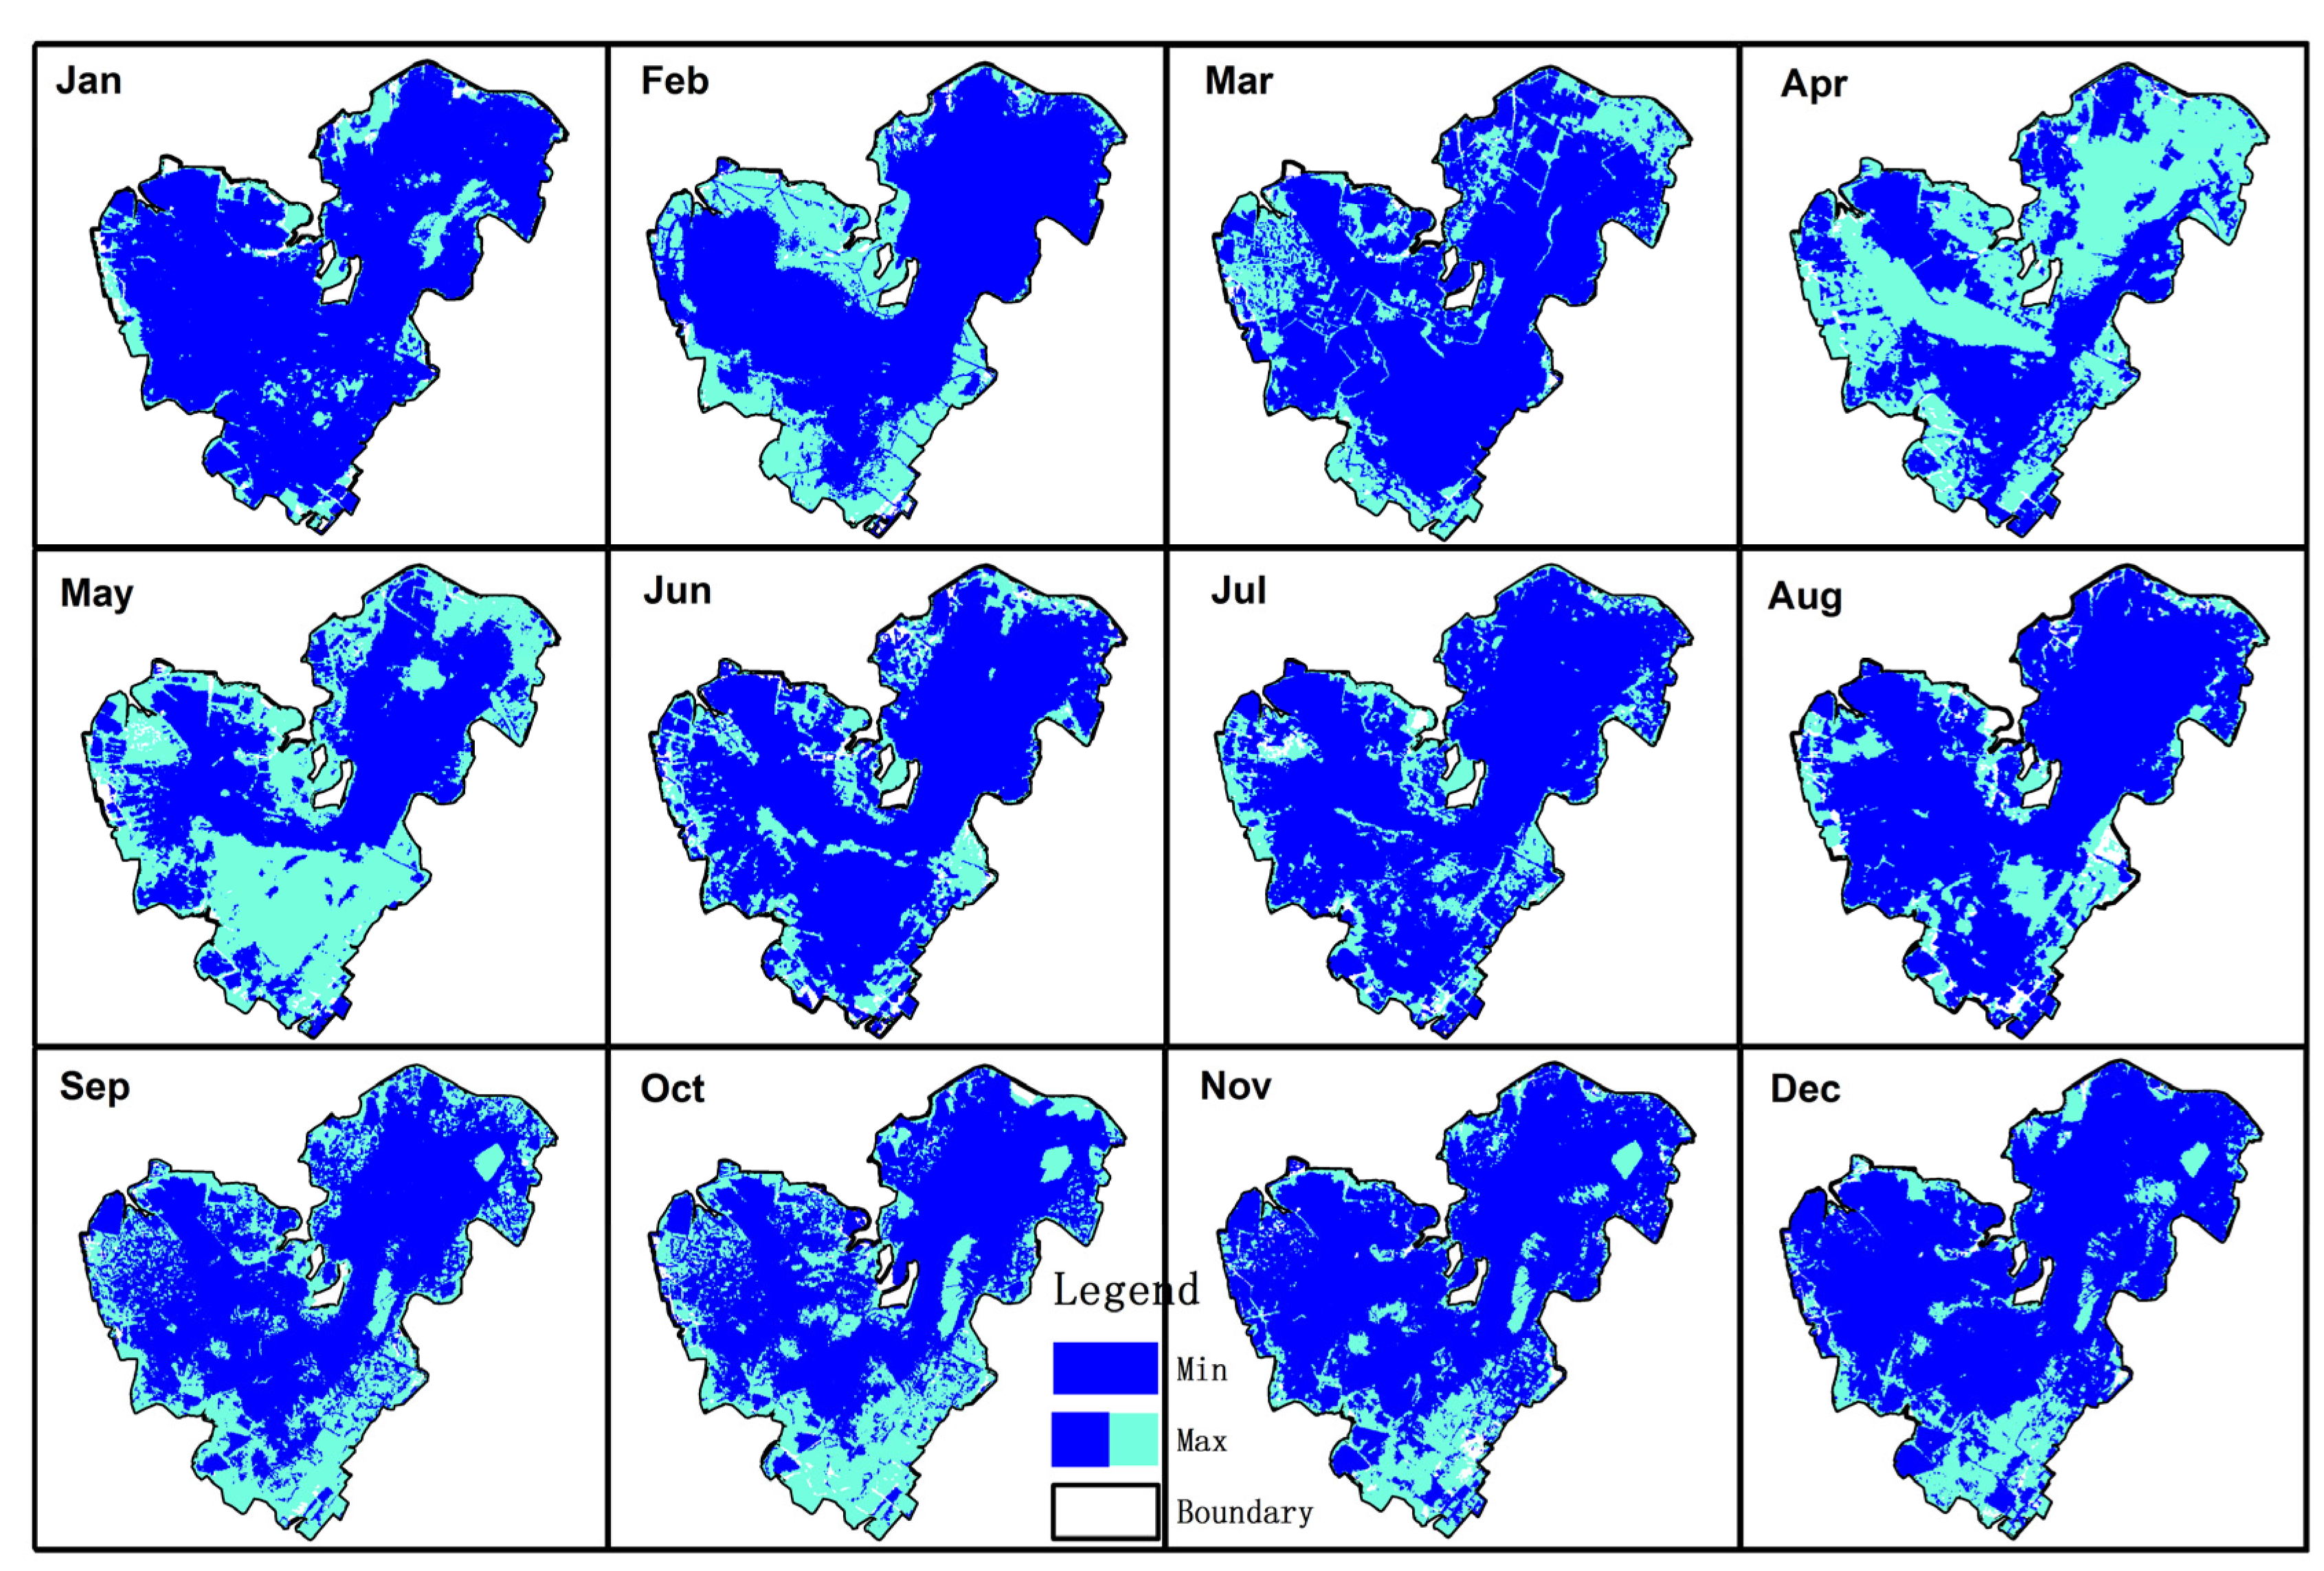
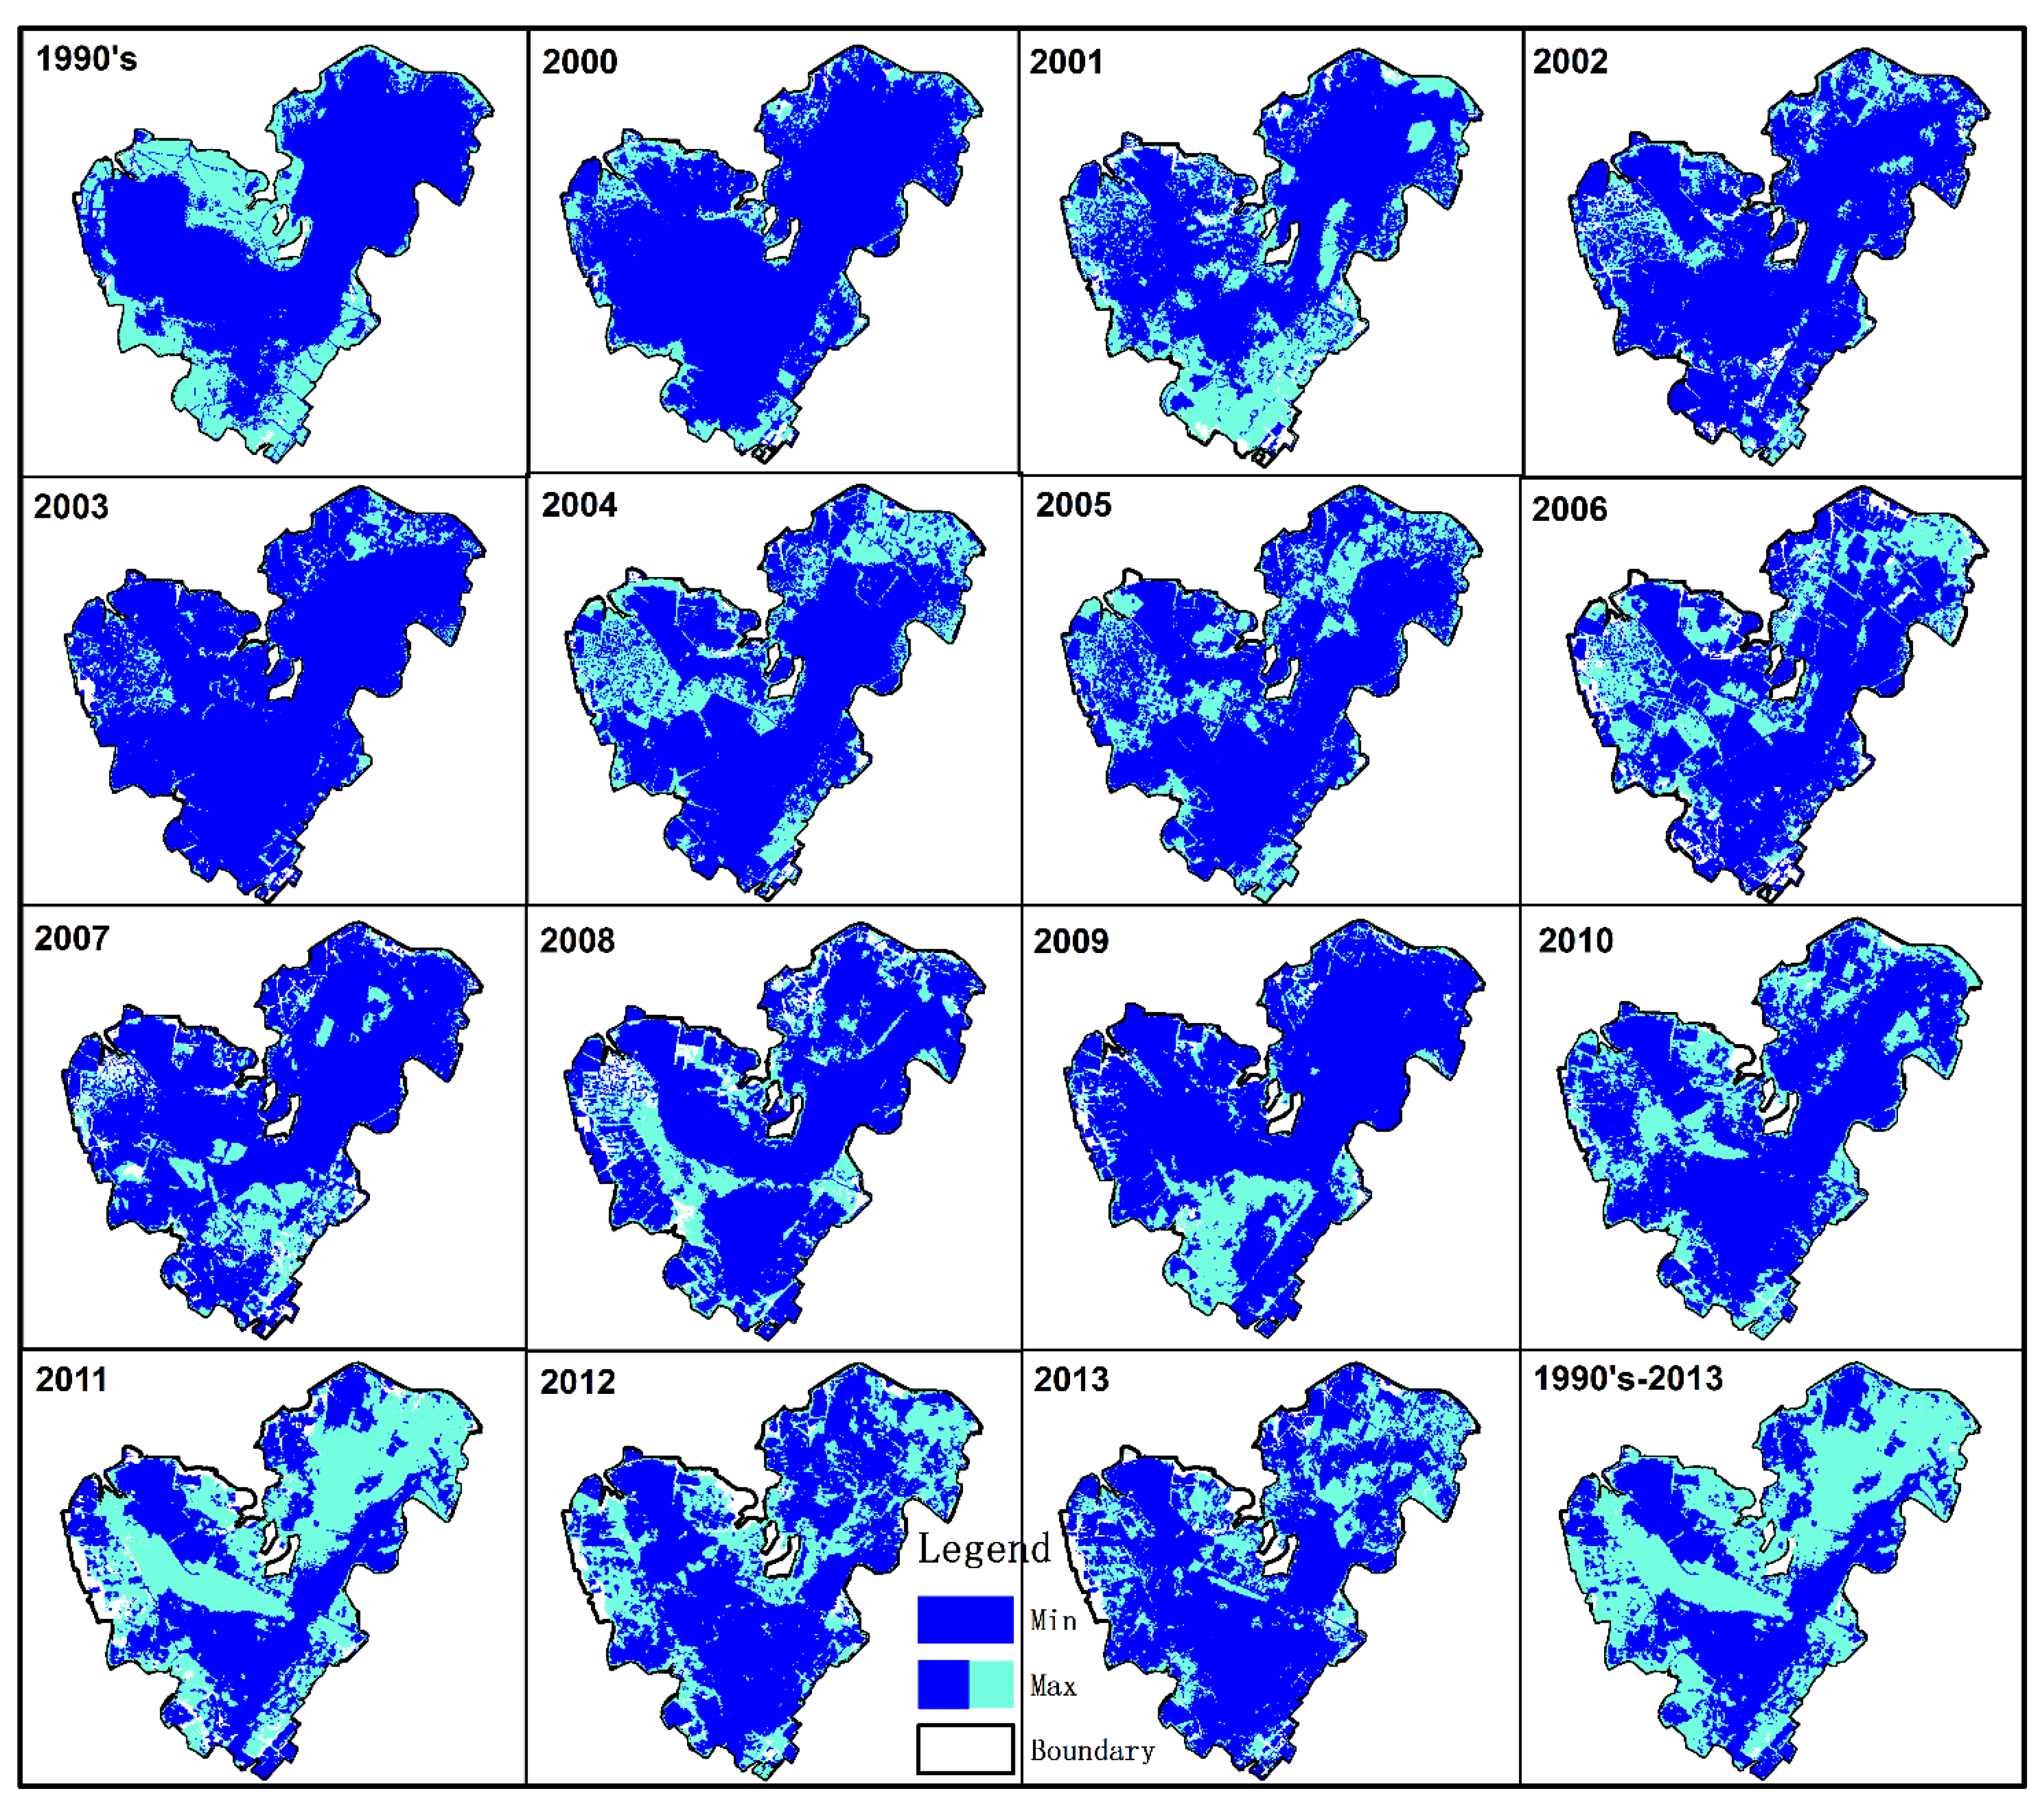
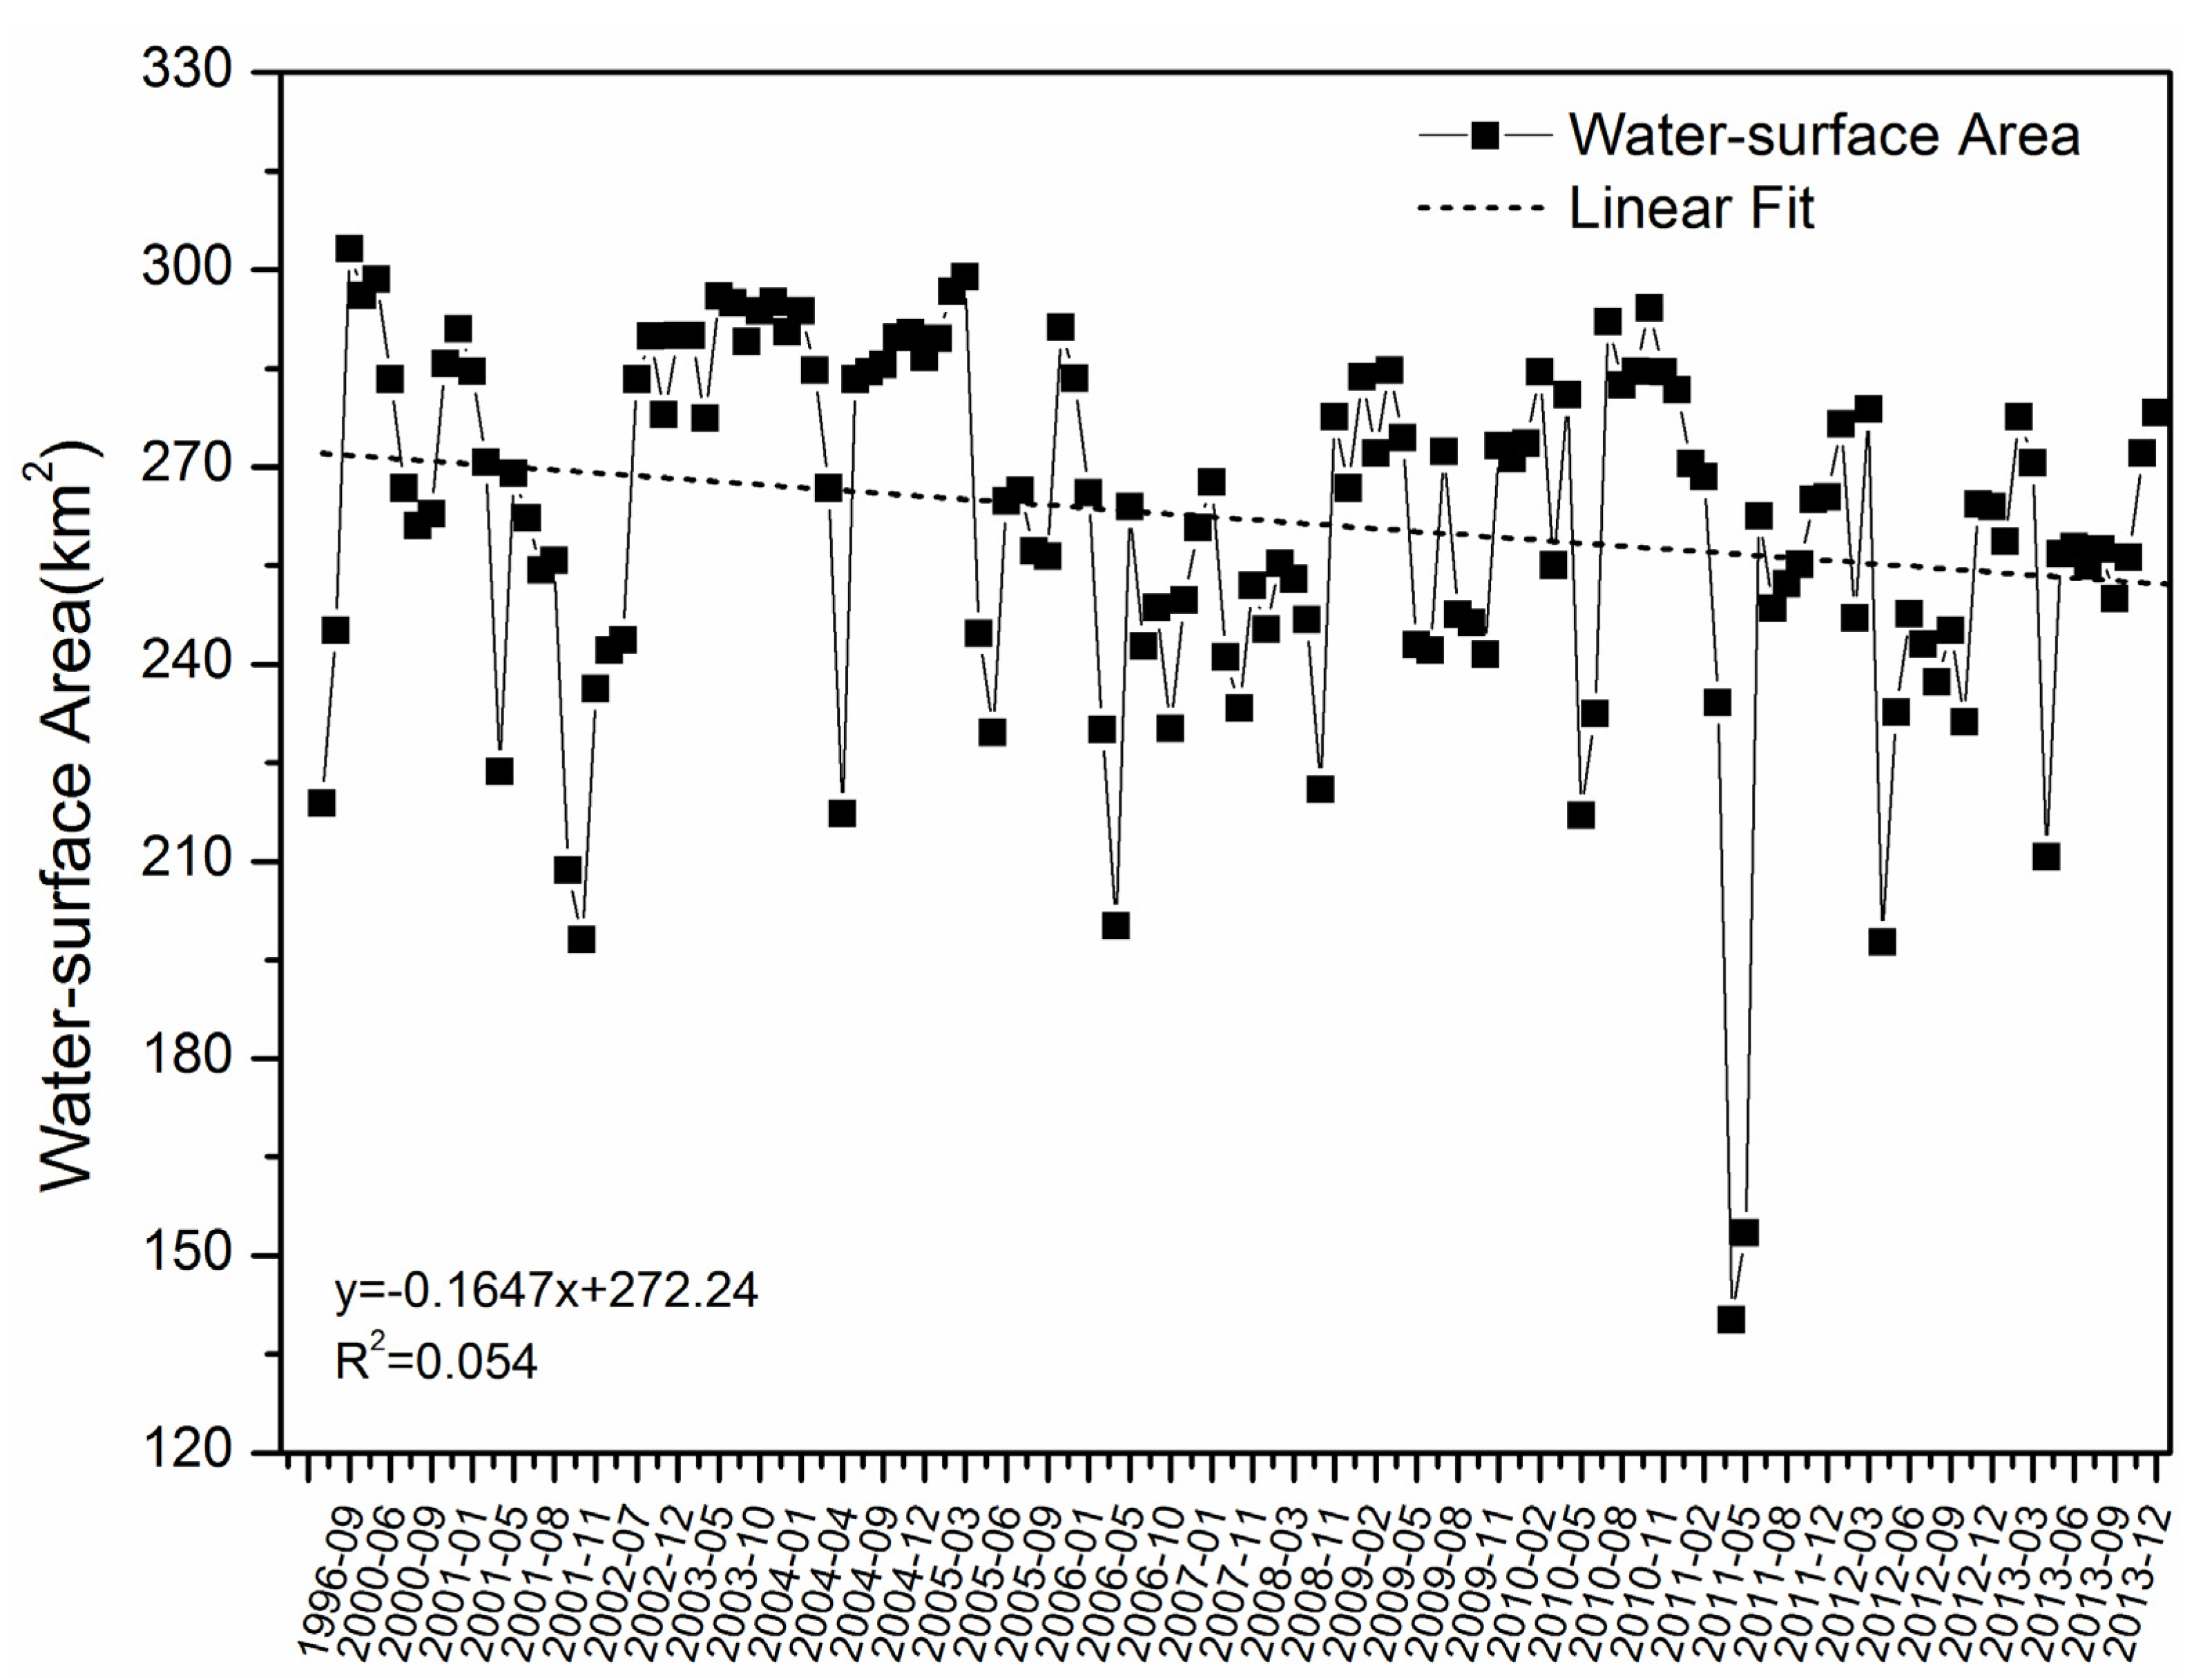
4.1. Variation Characteristics of Honghu Lake

The monthly maximum (blue plus cyan) and minimum (blue) water-surface areas and their distributions from the 1990s to 2013 are shown in Figure 2, while the occurrence years and maximum/minimum ratios are given in Table 1. Both the monthly maximum and minimum water-surface areas indicate seasonal variations. The monthly maximum areas range from 293.75 km2 to 303.26 km2, with small fluctuations occurring between November and March, and exceed 280 km2 in other months. Compared with the maximum areas, the minimum areas in all months have a larger fluctuation range between 140.20 and 258.65 km2. Hence, the maximum/minimum ratios mainly depend on the minimum areas. The monthly minimum area in April–May is approximately 100 km2 less than that in November–March, thus indicating the possible occurrence of spring drought in this area. The monthly maximum and minimum areas appear in different years, and the maximum/minimum ratios range from 1.14 (January) to 2.00 (April), thus suggesting significant inter-annual variability across all calendar months. Moreover, two-thirds (8/12) of the months observed with the maximum areas mainly occurred in 1996, 2003 and 2010. According to hydrological records, widespread flooding events occurred in the Yangtze River basin during these years [35]. In particular, the most serious flooding in the last 60 years occurred in the summer of 2010 and caused significant losses for thousands of local residents [36]. Meanwhile, the majority of the months observed with minimum areas occurred in 2001 and 2011, during which some degree of drought might have occurred. From the late spring to the early summer of 2011, regions of the middle and lower reaches of the Yangtze River in China suffered the most serious drought [37]. The total precipitation from January to May 2011 was 51.6% lower than the average rainfall between 1951 and 2011 over the same period [38].
Figure 2. Monthly minimum and maximum area distributions of the Honghu Lake from the 1990s to 2013.
Water 07 02881 g002
Table 1. Inter-Annual variability of area of the Honghu Lake (km2) by month from the 1990s to 2013.
MonthArea/YearJanuaryFebruaryMarchAprilMayJuneJulyAugustSeptemberOctoberNovemberDecember
MaximumArea293.75298.53298.90280.99295.97283.37294.89282.47303.26294.23295.12296.06
Year200420002005201020032000200320101996201020031996
MinimumArea258.65218.89230.04140.20153.49232.43243.04237.27208.69198.02236.25242.07
Year201319892006201120112010201220122001200120012001
Max/Min ratio1.141.361.302.001.931.221.211.191.451.491.251.22
Table 2 and Figure 3 present the annual maximum (blue plus cyan) and minimum (blue) water-surface areas from the 1990s to 2013. Intra-annual variations are presented in each panel, along with the inter-annual variability among the panels. For all years, the majority of the water areas were connected when the annual maximum area was observed. In contrast, when the annual minimum occurred, the lake was divided irregularly, even exposing the lakebed. In addition, the spatial distributions of the annual maximum area generally changed around the edges of the lakes beginning in the 1990s, but the distributions of the annual minimum area changed irregularly after 2000. The results of the annual analysis are similar to those of the monthly analysis, i.e., pronounced seasonality and inter-annual variability occurred. The annual maximum and minimum area varied widely between different years and occurred in different months. The annual maximum areas were greater than 290 km2 from the 1990s to 2006, except in 2001, and were less than 285 km2 from 2006 to 2013, except in 2010. These values suggest a decrease in the maximum area. The annual minimum areas fluctuated in a wider range compared with the maximum areas, i.e., between 140.2 and 277.4 km2 from the 1990s to 2013. Therefore, the annual maximum/minimum ratios mainly depend on annual minimum areas. In the present work, the annual maximum/minimum ratios range from 1.07 to 1.93. Evidently, the smallest minimum area among those recorded occurred in 2011, during which the corresponding annual maximum/minimum ratio reached 1.93. Additionally, more than half (12/15) of the annual maximum area occurred in the winter months (November to March). In contrast, the majority of the minimum areas (9/15) occurred in the spring season (between April and May), proving yet again that spring drought is frequent in the Honghu watershed.
Table 2. Intra-Annual variability of area of the Honghu Lake (km2) from the 1990s to 2013.
YearArea/Year1990’s2000200120022003200420052006
MaximumArea303.3298.5284.6290.0296.0293.8298.9266.1
MonthSeptemberFebruaryJanuaryDecemberMayJanuaryMarchJanuary
MinimumArea218.9261.1198.0243.7277.4217.3229.6200.1
MonthFebruaryAugustOctoberMarchAprilAprilMayApril
Max/Min ratio1.391.141.441.191.071.351.301.33
YearArea/Year20072008200920102011201220131990s-2013
MaximumArea267.7277.6284.7294.2270.4278.8278.2303.3
MonthJanuaryNovemberMarchOctoberJanuaryMarchDecember
MinimumArea233.3220.9241.4217.0140.2197.7210.7140.2
MonthMayOctoberOctoberMayAprilAprilApril
Max/Min ratio1.151.261.181.361.931.411.322.16
Figure 3. Minimum and maximum area distributions of Honghu Lake each year from 1990s to 2013
Water 07 02881 g003
The time series of the water-surface area of the lake between the 1990s and 2013 is presented in Figure 4. To study the change trend of the lake’s water-surface area, we perform a linear least- square regression fit between the areas and time. A decreasing trend with significance level of >95% is detected. The water-surface area fluctuated widely from 140.2 km2 to 303.26 km2 in the observed period, making a decrease rate of 0.1647 km2·year−1. The annual mean areas between the 1990s and 2013 are further calculated. The results indicate decrease rates of 1.5632 km2·year−1 beginning in the 1990s and 1.813 km2·year−1 beginning in 2000. We can deduce from these results that the water-surface area in the Honghu Lake is decreasing, especially after 2000.
Figure 4. Curve of water-surface area variations of the Honghu Lake from the 1990s to 2013.
Water 07 02881 g004

4.2. Influence Factors

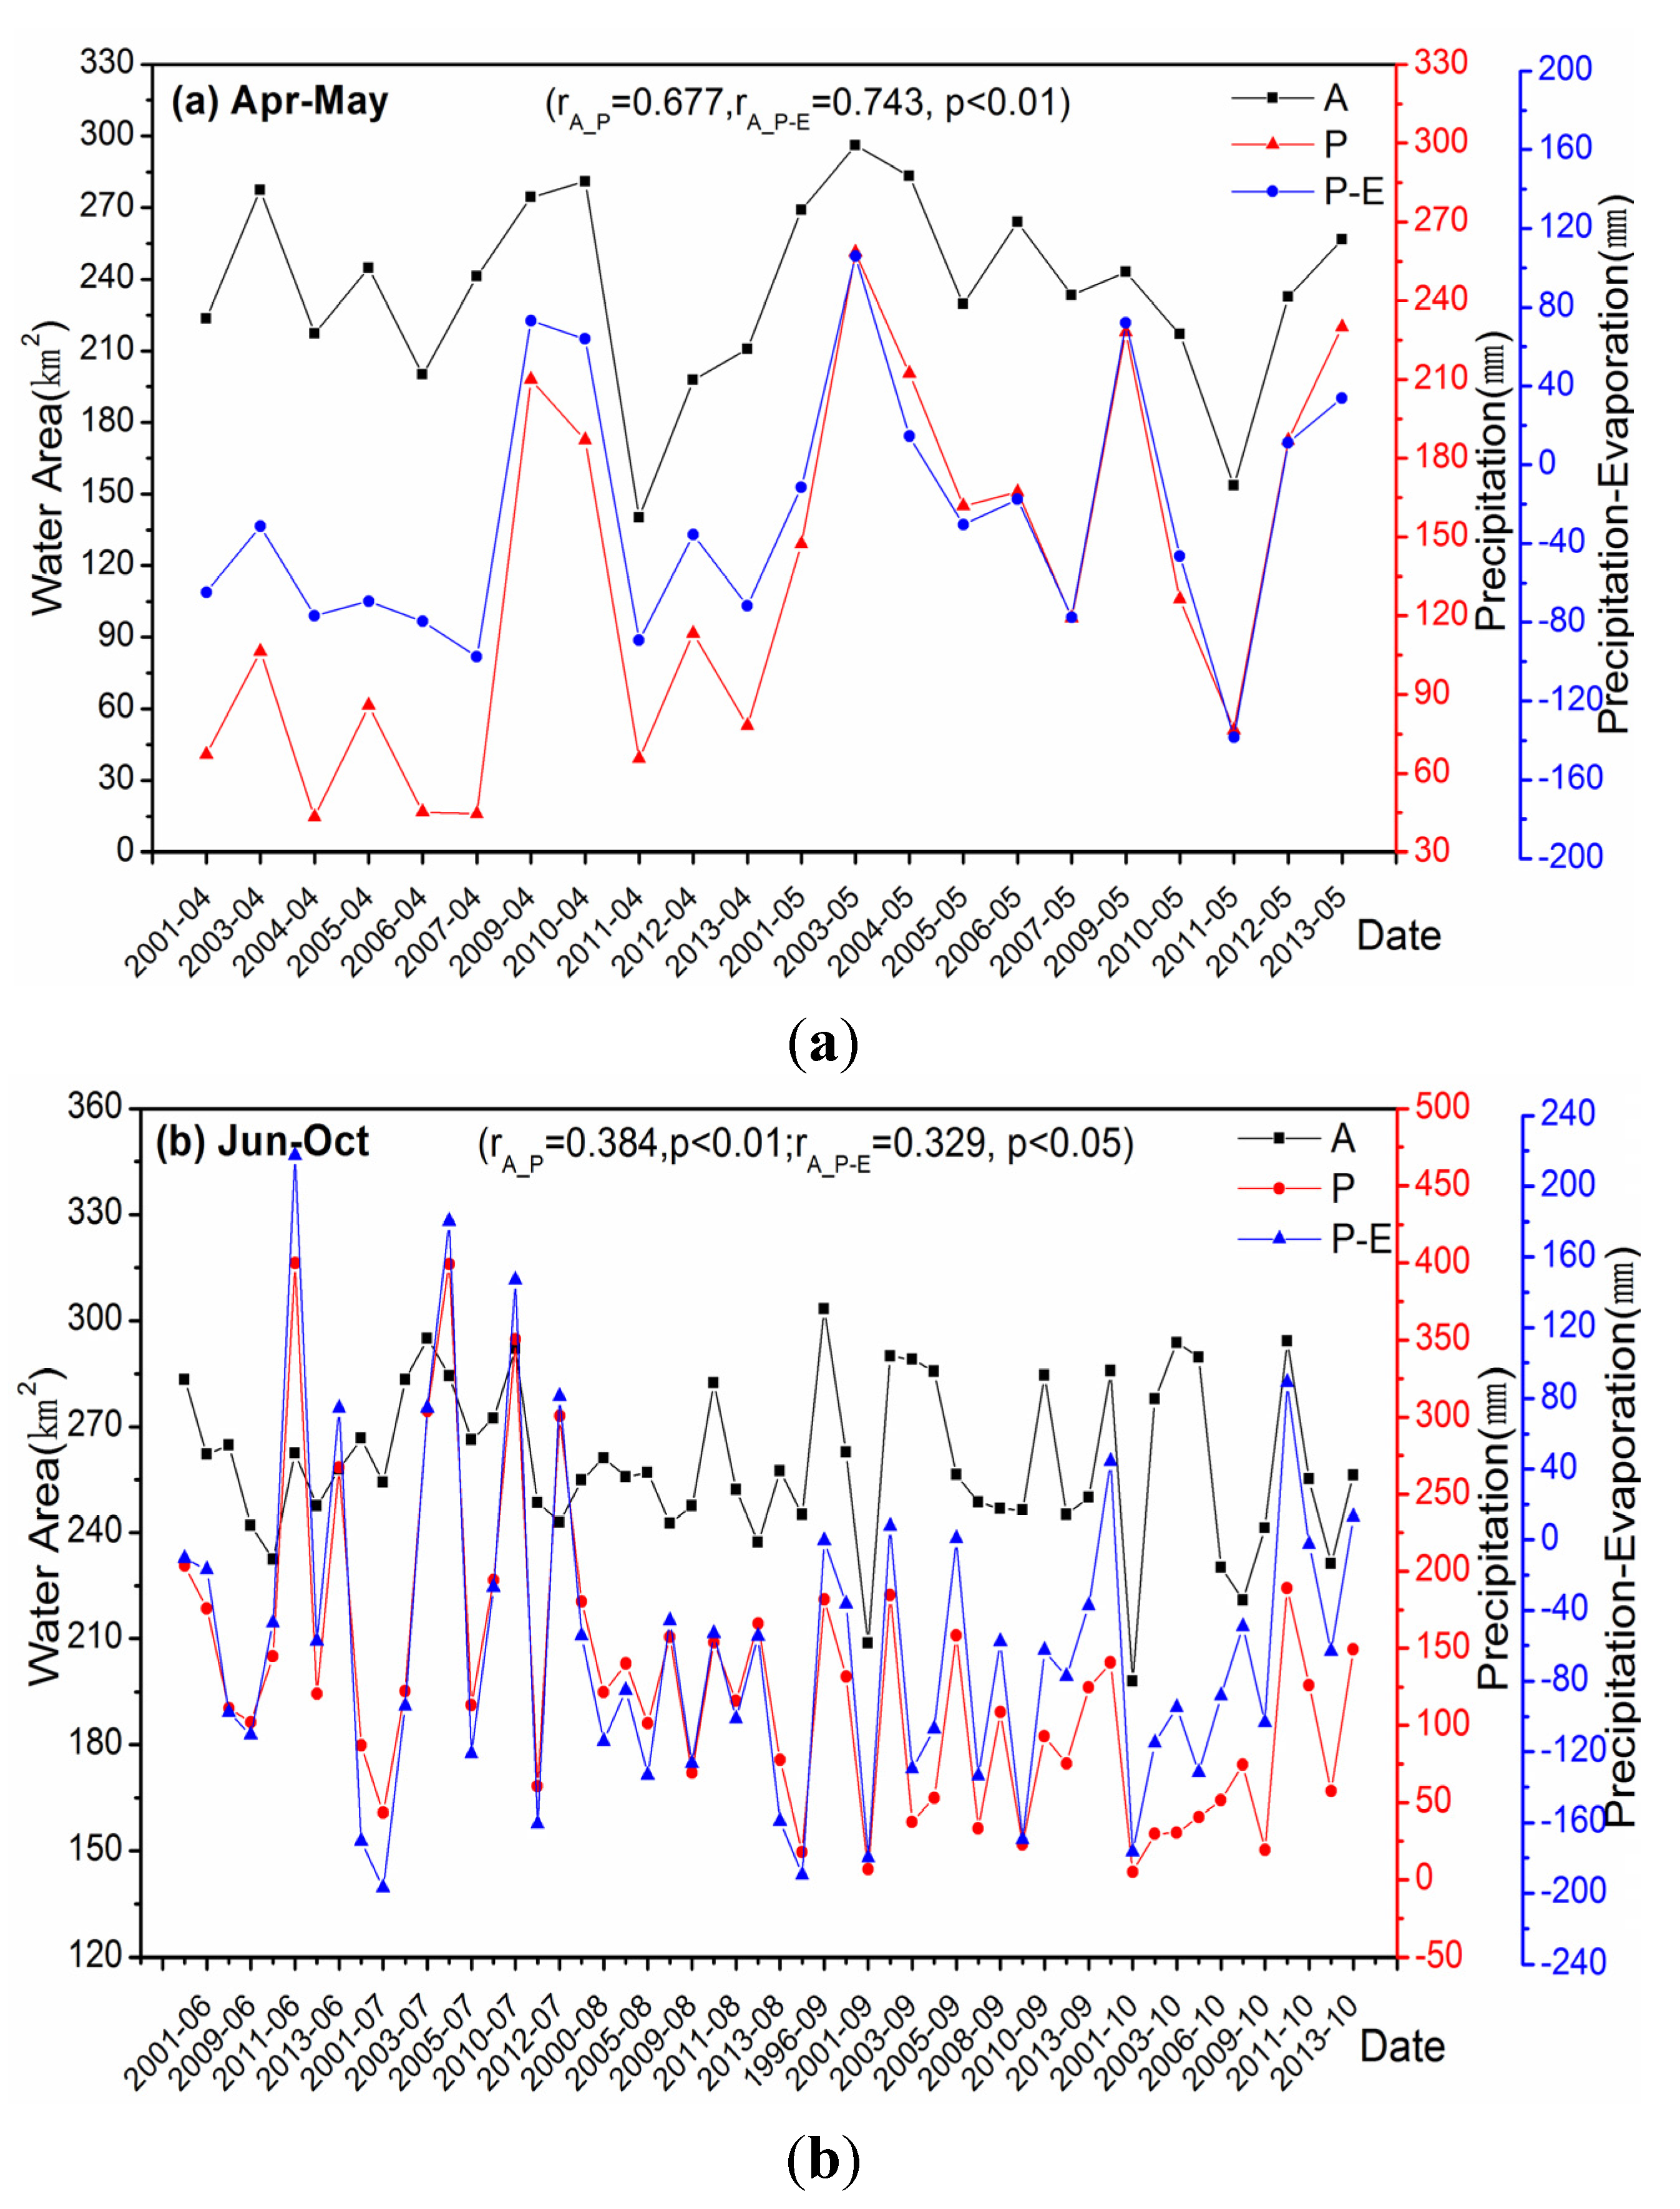
4.2.1. Climate Factors

According to water balance equations, the water-surface area variations of the Honghu Lake are closely related to climate factors, including precipitation within its basin and evaporation over its surface. To investigate the process by which these climate factors influence the lake’s water-surface area, we examine the relationship between the water-surface area and the monthly precipitation (P) and monthly evaporation (E), as well as the difference in the monthly precipitation and monthly evaporation (P–E), in the period between the 1990s and 2013. Considering the months in which the annual maximum and minimum areas occurred, we divided a whole year into three periods: April–May, June–October and November–March. To obtain improved analytical results, we calculate the monthly precipitation by summing up the daily precipitations for a month before the dates of the remote sensing images.
As shown in Figure 5a, the water-surface areas and their corresponding monthly precipitations present have similar fluctuation patterns in the April–May period, thus indicating their statistically significant, correlation with a correlation coefficient (R) of 0.677 (p < 0.01). This correlation suggests that the water-surface area variations are partly driven by the local precipitation during this period. Meanwhile, not all water-surface area variations are related to monthly evaporation (curve abbreviated). The difference between the monthly precipitation and evaporation and the water-surface area also shows similar fluctuation patterns in this period and statistically significant correlations (p < 0.01). With the correlation coefficient (R) of 0.743, the two factors show strong relativity that suggests the significant contribution of the comprehensive effect of precipitation and evaporation to the water-surface area variations in the April–May period.
Figure 5. Relationship between water area and climate factors in the (a) April–May and (b) June–October periods.
Water 07 02881 g005
Similar to the foregoing analysis, a correlation analysis is performed for the June–October period, in which the water-surface areas and their corresponding monthly precipitations indicate somewhat similar fluctuation patterns, especially given their relatively poor correlation (Figure 5b) with a correlation coefficient (R) of 0.384 (p < 0.05). This correlation suggests that local precipitation has minimal influence on the water-surface area variations during this period. Meanwhile, not all of the water-surface area variations are related to monthly evaporation (curve abbreviated). The water-surface area and the difference between monthly precipitation and evaporation in this period present similar fluctuation patterns with a statistically significant correlation (p < 0.05). With the coefficient of 0.329, the two factors demonstrate a weak correlation that suggests the significant contribution of monthly precipitation to the water-surface area variations during this period.
The curve shows that the water-surface areas in specific months, such as in April 2009 and April 2013, do not perfectly coincide with the corresponding monthly precipitations and the differences in the monthly precipitation and evaporation. The water-surface area has an accumulated effect; thus, a lag may exist between the two climate factors in the April–May period. The same effect can be observed in the June–October period. When the climate factors demonstrate a slight change, the water-surface area is almost unaffected. In the April–May period, the minimum area occurred in April 2011, but the monthly precipitation and difference in the monthly precipitation and evaporation in that month were not at the minimum, thus demonstrating that the water-surface area during this period was simultaneously affected by other factors. In the June–October period, the minimum area occurred in October 2001, and the monthly precipitation and the difference in the monthly precipitation and evaporation in that month were at the lowest as well, thus suggesting that other factors had little influence on the water-surface area during this period.
For the November–March period, the water-surface area and the aforementioned climate factors (curve abbreviated) indicate no significant correlation. Although this phase has little precipitation, the precipitation accumulated from the June–October period may maintain the stability of the water-surface area. Meanwhile, it is known that the water demand for agriculture in this area is non-existent during this period. In contrast, the aquaculture, consuming most water in this area, improves the bottom substrate and the elimination of toxic materials through several means, such as draining water, freezing and desiccating the bottom of fishponds in the winter and early spring [39]. It is very important to the success of aquaculture production.

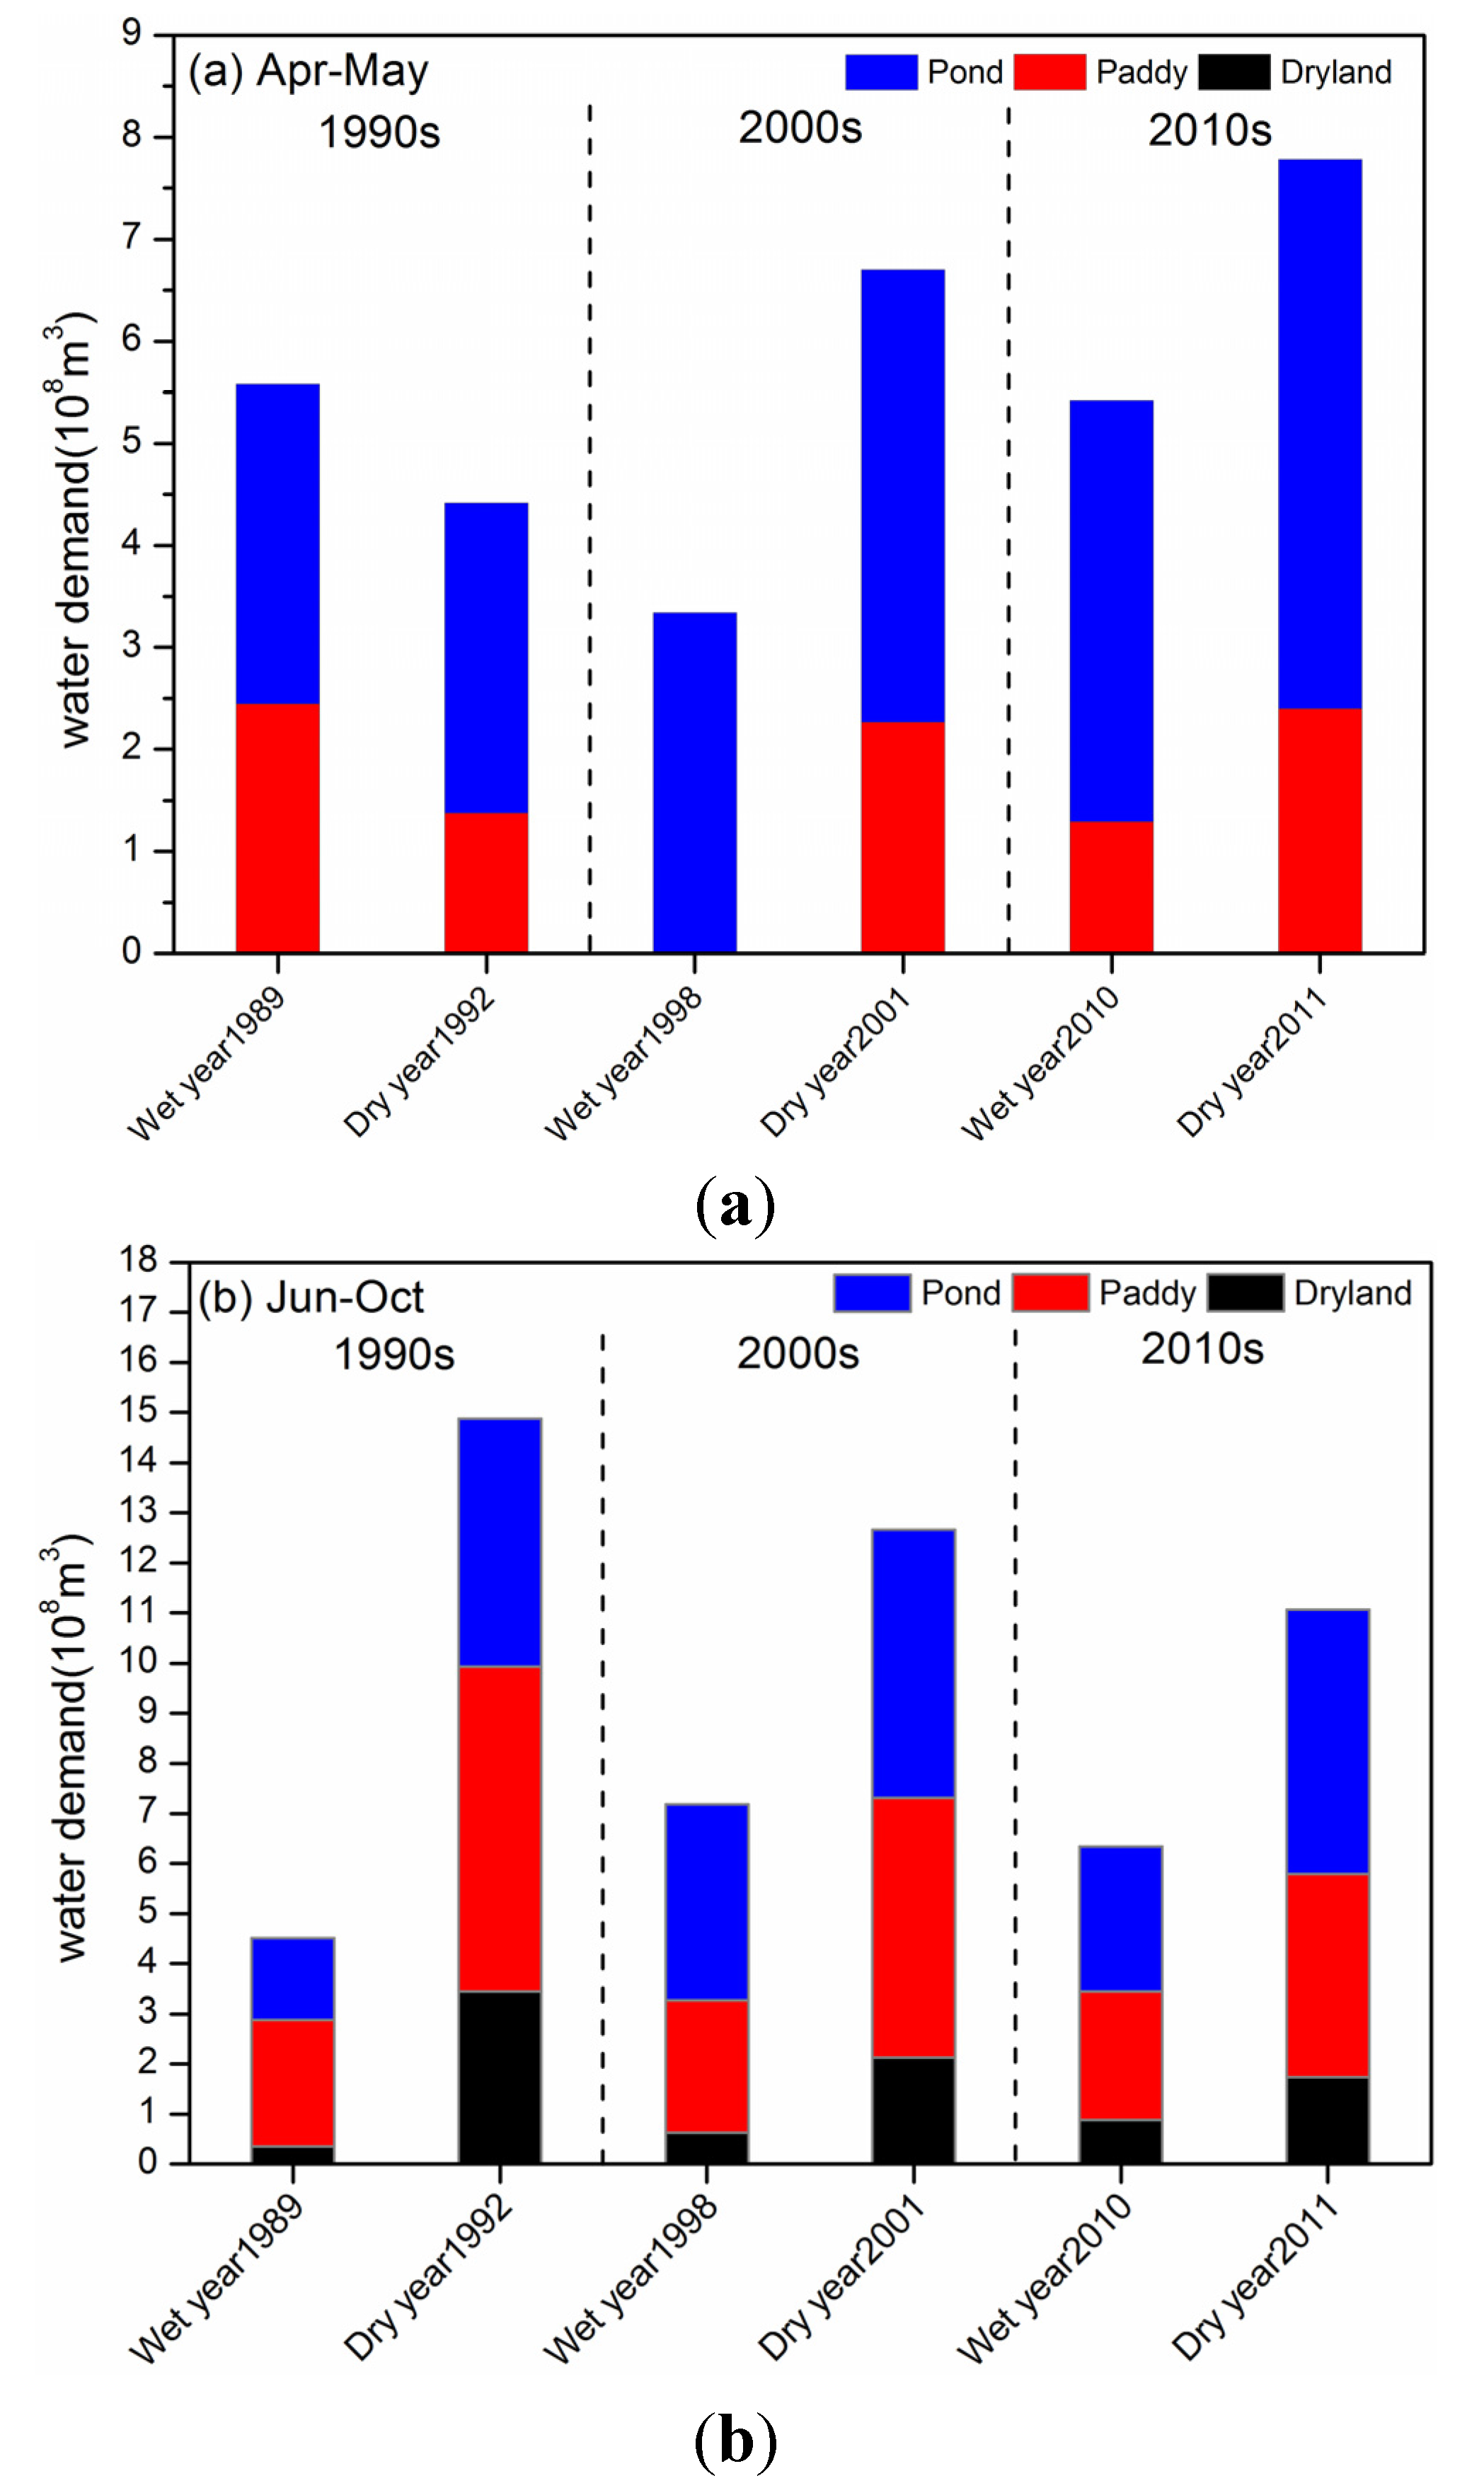
4.2.2. Human Activities

In the present study, human activities are characterized by land use change. Land use data show that the main types of agricultural land in the area under study are dryland, paddy and pond, by 2010, which accounted for 30.31%, 28.95% and 22.39% of the total land area, respectively. Therefore, the outflow of the Honghu Lake is calculated by using the following simplified formula.
Q o u t A 1 ( w 1 P ) + A 2 ( w 2 P ) + A 3 ( w 3 P )
where W 1 , W 2 and W 3 are the water consumption for drought crops, paddy rice and aquaculture, respectively; and A 1 , A 2 and A 3 are the areas of drought crops, paddy rice, and aquaculture, respectively. Field investigation carried out by the task team indicates that two kinds of drought crops, namely, corn and cotton, are mainly grown in this area. The water consumption of corn is 401.2 mm throughout the growing season, and its daily water consumptions are 2.61, 6.29, 5.36 and 4.66 mm at the seedling, jointing, heading and filling stages, respectively [40]. The water consumption of cotton is 473.4 mm throughout the growing season, and its daily water consumptions are 1.54, 3.79, 4.55 and 1.18 mm at the seedling, bud, flowering and boll-opening stages, respectively [41]. Double-cropping rice is normally transplanted into the fields from the end of April to early May. The water consumption for soaking this crop is 129 mm before transplanting. After transplanting, the total water consumption is approximately 652.6 mm, 150 mm of which is for growth in the first 30 days. After the growing stage, the daily water consumptions are 4.1, 4.2, 6.5, 5.8, 5.1 and 2.9 mm at the greenup, tillering, booting, heading, milk-ripe and maturity stages, respectively [42]. Ponds are injected with 500 mm of water to raise water levels before stocking with fish for aquaculture. The daily water consumption for evaporation and infiltration in aquaculture ranges from 5 to 7 mm [43]. Thus, aquaculture consumes greater amounts of water than rice, and the water requirements of rice are much larger than those of drought crops. In the calculation process, we assume that all drought crops in the area are cotton.
From 1990 to 2010, the paddy areas in Honghu city and Jianli county significantly decreased by 339.29 km2 accounting for 6.02% of the two counties’ area, whereas the pond area significantly increased by 369.76 km2 accounting for 6.56%. Considering the period covered by the land use data over three phases, we select the representative wet and dry years, as shown Figure 6. Using Equation (8), we then calculate the water requirement for agricultural irrigation and aquaculture in Honghu City and Jianli County during these years. The annual precipitations in the wet and dry years range from 1335.9 to 1523.5 and 940.6 to 1096.1 mm, respectively. Figure 6 illustrates the water demand for the three types of land use in the April–May and June–October periods. Significant characteristics of water demand for agriculture can be observed; under similar agricultural structures, the water demand for agriculture in the dry years is much higher than that in the wet years. In the case of close annual precipitations, the land use structure is altered, including a decrease in paddy areas and an increase in pond areas, as the water demands for aquaculture and agricultural irrigation increase and that for rice decreases. This tendency is especially apparent in the dry years.
Figure 6. Water demands for three types of land use in the (a) April-May and (b) June-October periods of representative wet and dry years.
Water 07 02881 g006
Figure 6a shows the water demands in spring (April–May period) for the three different land use types; here, the water demand for dryland is indicated as non-existent. The paddy area in 2010 was smaller than that in 1998 for the wet years, but the water demand for paddy during the former period was high. This result can be explained by the water consumptions for paddy rice soaking before transplanting and for growth in the stage after transplanting being approximately 129 and 105 mm, respectively. The precipitation during these phases in 2010 was 48.5 mm, which is not enough to meet the water consumption for rice growth. Meanwhile, in 1998, the precipitation during the aforementioned phases reached 135.4 mm, which was enough to meet the consumption for rice growth. In dry years, the water demand of paddy tends to increase with the decrease in paddy areas. Similarly, this condition is due the precipitation in 2001, which was only 44.3 mm during the phase after rice transplanting. Given that this region has been suffering from serious drought since 1951, the precipitation was only 21.32 and 63.59 mm from the late spring to the early summer of 2011 [37], thus causing the water demand for paddy to amount to 2.4 × 10⁸ m³. In April–May period, ponds have the greatest water consumption among all the land use types; thus, the water demands of aquaculture increase significantly with the increment of pond proportions in the wet and dry years.
As shown in Figure 6b, the water demands of drought crops are close in the June–October period of the wet years. However, the water demand of paddy during the same period increases slightly with the decrease in the paddy area proportions. This increase is mainly caused by the minimal precipitation during the greenup stage. In the greenup stage in 1998, the water consumption for rice growth was 63.7 mm, but the precipitation was only 18.55 mm; hence, the water demand for the paddy was 2.64 × 10⁸ m³. It is the same on the reason of the greater water demand for paddy in 2010. In 1998, the water demand for aquaculture reached 3.9 × 10⁸ m³ because the minimal precipitation of 24.54 mm in September could not meet the required daily water consumptions for evaporation and infiltration. In dry years, the dryland area increased by 20.51 km2 from 1990 to 2010, but the water demand for drought crops displayed a tendency to decrease. This finding mainly results from the lack of precipitation during the boll period in 1992. Meanwhile, in the dry years, the water demand of paddy tends to decrease with the decrease in paddy areas, and the water demand for aquaculture increases with the increment of pond proportions.
In recent years, farmers have substituted cotton with corn because of the reduced economic benefits of the former. In addition, some measures, including paddy rotation to dry land and conduit hardening, have been performed to control the spread of snails [44,45]. Thus, the water demands for farmland have decreased. Further analysis of transfer matrix of land use showed that 80.86 percent of pond was converted from farmland and 18.67 percent of pond was converted from lake. If precipitation was enough to meet the consumption of agriculture at different stages, more water in Honghu Lake was diverted to farmland and pond through canals. Thus, water level would decrease and lake area shrinks. The pond area was 884.30 km2 in 1990 and increased sharply to 1254.06 km2 in 2010. Correspondingly, the water demand of aquaculture in 2011 was 2.29 times that in 1992 for dry years and in 2010 and 1.55 times that in 1989 for wet years. Evidently, the increase in pond area heightens the water demand of agriculture, which leads to quick reduction of the water-surface area.

4.2.3. Comparison of the Effects of Climate Factor and Human Activities on Water-Surface Area

In comparing the effects of climate factors and human activities on the water-surface area of the Honghu Lake, multiple linear regression models are developed, one for the April–May period and one for the June–October period. Before modeling, these effect factors are standardized using Z-score transforms based on the IBM SPSS Statistics 20. The results of the regression analysis are shown in Table 3.
Y = a P + b ( P E ) + c R 1 + d R 2 + e R 3
where Y is the water-surface area, P is the monthly precipitation, P E is the difference between the monthly precipitation and monthly evaporation, R 1 is the water demand of drought crops, R 2 is the water demand of paddy rice and R 3 is the water demand of aquaculture.
Table 3. Regression analysis results from April to October.
PeriodMultiple Linear Regression ModelR2
April–May Y = 0.219 ( P E ) 0.520 ( R 2 + R 3 ) 0.684
June Y = 0.716 P 1.174 R 1 + 0.564 R 2 + 1.431 R 3 0.643
July Y = 0.603 P + 0.386 R 1 0.491 R 2 0.01 R 3 0.606
August Y = 0.405 P + 0.525 R 1 0.587 R 2 0.130 R 3 0.518
September Y = 0.365 P 0.540 R 1 0.036 R 2 + 0.296 R 3 0.513
October Y = 0.638 P + 0.104 R 1 + 0.584 R 2 0.234
Accordingly, these regression models have statistical significance (p < 0.05) that suggests the capability of the models to indicate the degree of influence of each factor on the water-surface area in different periods. As expected, the fitness of the equations in the April–May periods is higher than that in the June–October periods. Comparing the influence coefficient of each factor, we can observe the impact of climate factors and human activities on the water-surface area variations. In the April–May period, the sum of the water demand of paddy rice and that of aquaculture has a negative effect on the water-surface area; the effect of the sum of these factors is greater than the positive effect of the difference between the monthly precipitation and monthly evaporation. However, the precipitation from June to October has positive impacts on the water-surface area of the lake; such impacts exceed the negative effects of the water demand of agriculture, except in August and September. In August, the negative effects of the water demand of paddy areas outweigh the positive influence of precipitation. Meanwhile, in September, the negative influence of the water demand of dryland outweighs the positive influence of precipitation. Moreover, the water demand of the same land use type has different degrees of impact in each month depending on the water consumption during the different growth stages. Therefore, the water-surface area during June–October period is larger than that in the April–May period but does not indicate a pronounced tendency to increase with the increase in precipitation.

5. Conclusions

In this study, using time-series and high-resolution remote sensing images, we extracted the water-surface area in the Honghu Lake of China from the 1990s to 2013, documented its intra-and inter annual change characteristics, and analyzed quantitatively the influence of climate factors and human activities induced by land use change based on water balance and statistical analysis method. The relative effects of climate factors and human activities were also compared. Results show the water-surface area of the Honghu Lake presents significant inter-annual and seasonal variability and tends to decrease generally since the 1990s. Meanwhile, spring drought may occur in this area. The degree to which climate factors and land use structure affect the water-surface area varies between different stages. In the April–May period, the comprehensive effect of precipitation and evaporation has positive contribution to the water-surface area. The sum of the water demands of paddies and aquaculture has a negative effect, and such effect is greater than the former. In the June–October period, the precipitation features a positive impact that is greater than the negative influence of the water demand of agriculture, except in August and September. Meanwhile, climate factors and human activities have no influence on the lake area in the November–March period. Evidently, the increase in pond area heightens the water demand of agriculture, which leads to quick reduction of the water-surface area.
The long–term and high-resolution data record of monthly water-surface area can serve as base data to explore other studies such as quantifying and reflecting the flood/drought condition in Honghu Lake in future. The outcomes may provide scientific foundation for understanding the causes of water-surface area variations and keeping effectively Honghu area stable by changing regional land use practices. Certainly, deficiencies exist in the present study. For instance, lag effects observed between climate factors and water-surface area changes in individual years should be further analyzed via mathematical methods in ongoing research. However, the results of a quantitative analysis are more persuasive than the aforementioned qualitative studies.

Acknowledgments

The authors would like to acknowledge the support of Climate change special fund from China Meteorological Administration (No. CCSF201409) and the project “Strategic Priority Research Program–Climate Change: Carbon Budget and Related Issues” of the Chinese Academy of Sciences (No. XDA0505107) for this study.

Author Contributions

Bianrong Chang and Rendong Li conceived the study; Kequn Liu collected part of meteorological data; Bianrong Chang performed other data collection; Chuandong Zhu processed data using the Matlab programming environment; Bianrong Chang conducted data analysis and wrote the paper. All authors read and approved the final version of the manuscript.

Conflicts of Interest

The authors declare no conflict of interest.

References

  1. Verschuren, D.; Johnson, T.C.; Kling, H.J.; Edgington, D.N.; Leavitt, P.R.; Brown, E.T.; Talbot, M.R.; Hecky, R.E. History and timing of human impact on Lake Victoria, East Africa. Proc. R. Soc. B-Biol. Sci. 2002, 269, 289–294. [Google Scholar] [CrossRef] [PubMed]
  2. DeFries, R.; Eshleman, N.K. Land-Use change and hydrologic processes: A major focus for the future. Hydrol. Process. 2004, 18, 2183–2186. [Google Scholar] [CrossRef]
  3. Ma, R.H.; Yang, G.S.; Duan, H.T.; Jiang, J.H.; Wang, S.M.; Feng, X.Z.; Li, A.N.; Kong, F.X.; Xue, B.; Wu, J.L.; et al. China’s lakes at present: Number, area and spatial distribution. Sci. China-Earth Sci. 2011, 54, 283–289. [Google Scholar] [CrossRef]
  4. Zhu, L.P.; Xie, M.P.; Wu, Y.H. Quantitative analysis of lake area variations and the influence factors from 1971 to 2004 in the Nam Co basin of the Tibetan Plateau. Chin. Sci. Bull. 2010, 55, 1294–1303. [Google Scholar] [CrossRef]
  5. Zhang, G.Q.; Xie, H.J.; Kang, S.C.; Yi, D.H.; Ackley, S.F. Monitoring lake level changes on the Tibetan Plateau using icesat altimetry data (2003–2009). Remote Sens. Environ. 2011, 115, 1733–1742. [Google Scholar] [CrossRef]
  6. Zhang, G.Q.; Xie, H.J.; Yao, T.D.; Kang, S.C. Water balance estimates of ten greatest lakes in China using icesat and landsat data. Chin. Sci. Bull. 2013, 58, 3815–3829. [Google Scholar] [CrossRef]
  7. Li, L.; Wang, W. The response of lake change to climate fluctuation in north Qinghai-Tibet Plateau in last 30 years. J. Geogr. Sci. 2009, 19, 131–142. [Google Scholar]
  8. Wu, Y.H.; Zhu, L.P. The response of lake-glacier variations to climate change in Nam Co catchment, central Tibetan Plateau, during 1970–2000. J. Geogr. Sci. 2008, 18, 177–189. [Google Scholar] [CrossRef]
  9. Ma, R.H.; Duan, H.T.; Hu, C.M.; Feng, X.Z.; Li, A.N.; Ju, W.M.; Jiang, J.H.; Yang, G.S. A half-century of changes in China’s lakes: Global warming or human influence? Geophys. Res. Lett. 2010, 37. [Google Scholar] [CrossRef]
  10. Chen, H.Y.; Teng, Y.G.; Wang, J.S. A framework of characteristics identification and source apportionment of water pollution in a river: A case study in the Jinjiang River, China. Water Sci. Technol. 2012, 65, 2071–2078. [Google Scholar] [CrossRef] [PubMed]
  11. Ban, X.; Wu, Q.Z.; Pan, B.Z.; Du, Y.; Feng, Q. Application of composite water quality identification index on the water quality evaluation in spatial and temporal variations: A case study in Honghu Lake, China. Environ. Monit. Assess. 2014, 186, 4237–4247. [Google Scholar] [CrossRef] [PubMed]
  12. Du, Y.; Xue, H.P.; Wu, S.J.; Ling, F.; Xiao, F.; Wei, X.H. Lake area changes in the middle Yangtze region of China over the 20th century. J. Environ. Manag. 2011, 92, 1248–1255. [Google Scholar] [CrossRef] [PubMed]
  13. Liang, Y.T.; Wen, X.F.; Liu, K.Q.; Tan, D.B.; Cao, B. Dynamics change of water surface area and its driving force analysis for Honghu Lake in recent 40 years based on remote sensing technique. In Proceedings of the 2013 Fifth International Conference on Measuring Technology and Mechatronics Automation, Hongkong, China, 16–17 January 2013; IEEE: New York, NY, USA; pp. 500–506.
  14. Wen, X.; Hu, D.; Cao, B.; Shen, S.; Tang, X. Dynamics change of Honghu Lake’s water surface area and its driving force analysis based on remote sensing technique and topmodel model. IOP Conf. Ser. Earth Environ. Sci. 2014, 17. [Google Scholar] [CrossRef]
  15. Mo, M.H.; Wang, X.L.; Wu, H.J.; Cai, S.M.; Zhang, X.Y.; Wang, H.L. Ecosystem health assessment of Honghu Lake wetland of China using artificial neural network approach. Chin. Geogr. Sci. 2009, 19, 349–356. [Google Scholar] [CrossRef]
  16. USGS. http://glovis.usgs.gov// (accessed on 10 June 2015).
  17. China Centre for Resources Satellite Data and Application. http://www.cresda.com/n16/index.html (accessed on 10 June 2015).
  18. Wang, Q.A.; Wu, C.Q.; Li, Q.; Li, J.S. Chinese HJ-1A/B satellites and data characteristics. Sci. China-Earth Sci. 2010, 53, 51–57. [Google Scholar] [CrossRef]
  19. China Meteorological Data Sharing Service System. http://cdc.cma.gov.cn/home.do (accessed on 10 June 2015).
  20. Gao, Y.; Mas, J.F.; Maathuis, B.H.P.; Zhang, X.M.; van Dijk, P.M. Comparison of pixel-based and object-oriented image classification approaches––A case study in a coal fire area, Wuda, Inner Mongolia, China. Int. J. Remote Sens. 2006, 27, 4039–4055. [Google Scholar]
  21. Frohn, R.C.; Autrey, B.C.; Lane, C.R.; Reif, M. Segmentation and object-oriented classification of wetlands in a karst Florida landscape using multi-season Landsat-7 ETM+ imagery. Int. J. Remote Sens. 2011, 32, 1471–1489. [Google Scholar] [CrossRef]
  22. Li, X.J.; Meng, Q.Y.; Gu, X.F.; Jancso, T.; Yu, T.; Wang, K.; Mavromatis, S. A hybrid method combining pixel-based and object-oriented methods and its application in Hungary using Chinese HJ-1 satellite images. Int. J. Remote Sens. 2013, 34, 4655–4668. [Google Scholar] [CrossRef]
  23. Mullerova, J.; Pergl, J.; Pysek, P. Remote sensing as a tool for monitoring plant invasions: Testing the effects of data resolution and image classification approach on the detection of a model plant species Heracleum mantegazzianum (giant hogweed). Int. J. Appl. Earth Obs. Geoinf. 2013, 25, 55–65. [Google Scholar] [CrossRef]
  24. Blaschke, T.; Lang, S.; Lorup, E.; Strobl, J.; Zeil, P. Object-Oriented image processing in an integrated GIS/remote sensing environment and perspectives for environmental applications. Environ. Inf. Plan. Polit. Public 2000, 2, 555–570. [Google Scholar]
  25. McFeeters, S.K. The use of the normalized difference water index (NDWI) in the delineation of open water features. Int. J. Remote Sens. 1996, 17, 1425–1432. [Google Scholar] [CrossRef]
  26. Xu, H.Q. Modification of normalised difference water index (NDWI) to enhance open water features in remotely sensed imagery. Int. J. Remote Sens. 2006, 27, 3025–3033. [Google Scholar] [CrossRef]
  27. Liu, R.; Wang, S.X.; Zhou, Y.; Han, X.D.; Yao, Y. The study of the index models used in extraction of water body based on HJ-1 CCD imagery. In Proceedings of the 2011 International Conference on Multimedia Technology (ICMT), Hangzhou, China, 26–28 July 2011; IEEE: New York, NY, USA; pp. 904–907.
  28. Lu, S.L.; Wu, B.F.; Yan, N.N.; Wang, H. Water body mapping method with HJ-1A/B satellite imagery. Int. J. Appl. Earth Obs. Geoinf. 2011, 13, 428–434. [Google Scholar] [CrossRef]
  29. Troin, M.; Vallet-Coulomb, C.; Sylvestre, F.; Piovano, E. Hydrological modelling of a closed lake (Laguna Mar Chiquita, Argentina) in the context of 20th century climatic changes. J. Hydrol. 2010, 393, 233–244. [Google Scholar] [CrossRef]
  30. Goovaerts, P. Geostatistical approaches for incorporating elevation into the spatial interpolation of rainfall. J. Hydrol. 2000, 228, 113–129. [Google Scholar] [CrossRef]
  31. Valiantzas, J.D. Simplified versions for the penman evaporation equation using routine weather data. J. Hydrol. 2006, 331, 690–702. [Google Scholar] [CrossRef]
  32. Chen, S.J. Environmental problems and ecological countermeasures for the Honghu Lake in Hubei province. J. Cent. China Norm. Univ. (Nat. Sci.) 2001, 35, 107–110. [Google Scholar]
  33. Lambin, E.F.; Strahler, A.H. Change-Vector analysis in multitemporal space––A tool to detect and categorize land-cover change processes using high temporal-resolution satellite data. Remote Sens. Environ. 1994, 48, 231–244. [Google Scholar] [CrossRef]
  34. Johnson, R.D.; Kasischke, E.S. Change vector analysis: A technique for the multispectral monitoring of land cover and condition. Int. J. Remote Sens. 1998, 19, 411–426. [Google Scholar] [CrossRef]
  35. Gong, G.C.; Liu, K.K.; Chiang, K.P.; Hsiung, T.M.; Chang, J.; Chen, C.C.; Hung, C.C.; Chou, W.C.; Chung, C.C.; Chen, H.Y. Yangtze River floods enhance coastal ocean phytoplankton biomass and potential fish production. Geophys. Res. Lett. 2011, 38. [Google Scholar] [CrossRef]
  36. Feng, L.; Hu, C.M.; Chen, X.L.; Cai, X.B.; Tian, L.Q.; Gan, W.X. Assessment of inundation changes of Poyang Lake using modis observations between 2000 and 2010. Remote Sens. Environ. 2012, 121, 80–92. [Google Scholar] [CrossRef]
  37. Shen, B.Z.; Zhang, S.X.; Yang, H.W.; Wang, K.; Feng, G.L. Analysis of characteristics of a sharp turn from drought to flood in the middle and lower reaches of the Yangtze River in spring and summer in 2011. Acta Phys. Sin. 2012, 61, 1–11. [Google Scholar]
  38. Tian, R.; Cao, C.; Peng, L.; Ma, G.; Bao, D.; Guo, J.; Yomwan, P. The use of HJ-1A/B satellite data to detect changes in the size of wetlands in response in to a sudden turn from drought to flood in the middle and lower reaches of the Yangtze River system in China. Geomat. Nat. Hazards Risk 2014, 2014. [Google Scholar] [CrossRef]
  39. Avnimelech, Y.; Ritvo, G. Shrimp and fish pond soils: Processes and management. Aquaculture 2003, 220, 549–567. [Google Scholar] [CrossRef]
  40. Xiao, J.F.; Liu, Z.D.; Chen, Y.M. Study on the water requirement and water requirement regulation of maize in China. J. Maize Sci. 2008, 4, 21–25. [Google Scholar]
  41. Liu, K.W.; Su, R.R.; Geng, Y.F.; Zhu, J.Q.; An, K.Z.; Cai, W. Drought and flood grades classification considering water demand at each growth stage of cotton in Jingzhou. Chin. J. Agrometeorol. 2014, 3, 317–322. [Google Scholar]
  42. Yu, J.H.; Yu, W.Y.; Wang, F. Analysis of rice water requirement test on Chuzhou. J. Anhui Agric. Sci. 2008, 36, 10810–10812. [Google Scholar]
  43. Liu, K.Q.; Liang, Y.T.; Zhou, J.L.; Liu, M. Impact analysis of human activities and climate change on Honghu Lake’s spring drought. Acta Ecol. Sin. 2014, 34, 1302–1310. [Google Scholar]
  44. Liu, J.B.H.; Huang, S.S.; Fan, H.P.; Dai, Y.H. Analysis of the economic benefits on the snail control project through environmental modification supported by world bank loan project for schistosomiasis control in Hubei province. J. Trop. Med. 2006, 6, 696–699. [Google Scholar]
  45. Qiu, J.; Li, R.D.; Xu, X.J.; Yu, C.H.; Xia, X.; Hong, X.C.; Chang, B.R.; Yi, F.J.; Shi, Y.Y. Identifying determinants of oncomelania hupensis habitats and assessing the effects of environmental control strategies in the plain regions with the waterway network of China at the microscale. Int. J. Environ. Res. Public Health 2014, 11, 6571–6585. [Google Scholar] [CrossRef] [PubMed]

