
Rainfall Variability in the Huangfuchuang Watershed and Its Relationship with ENSO

Abstract
:1. Introduction
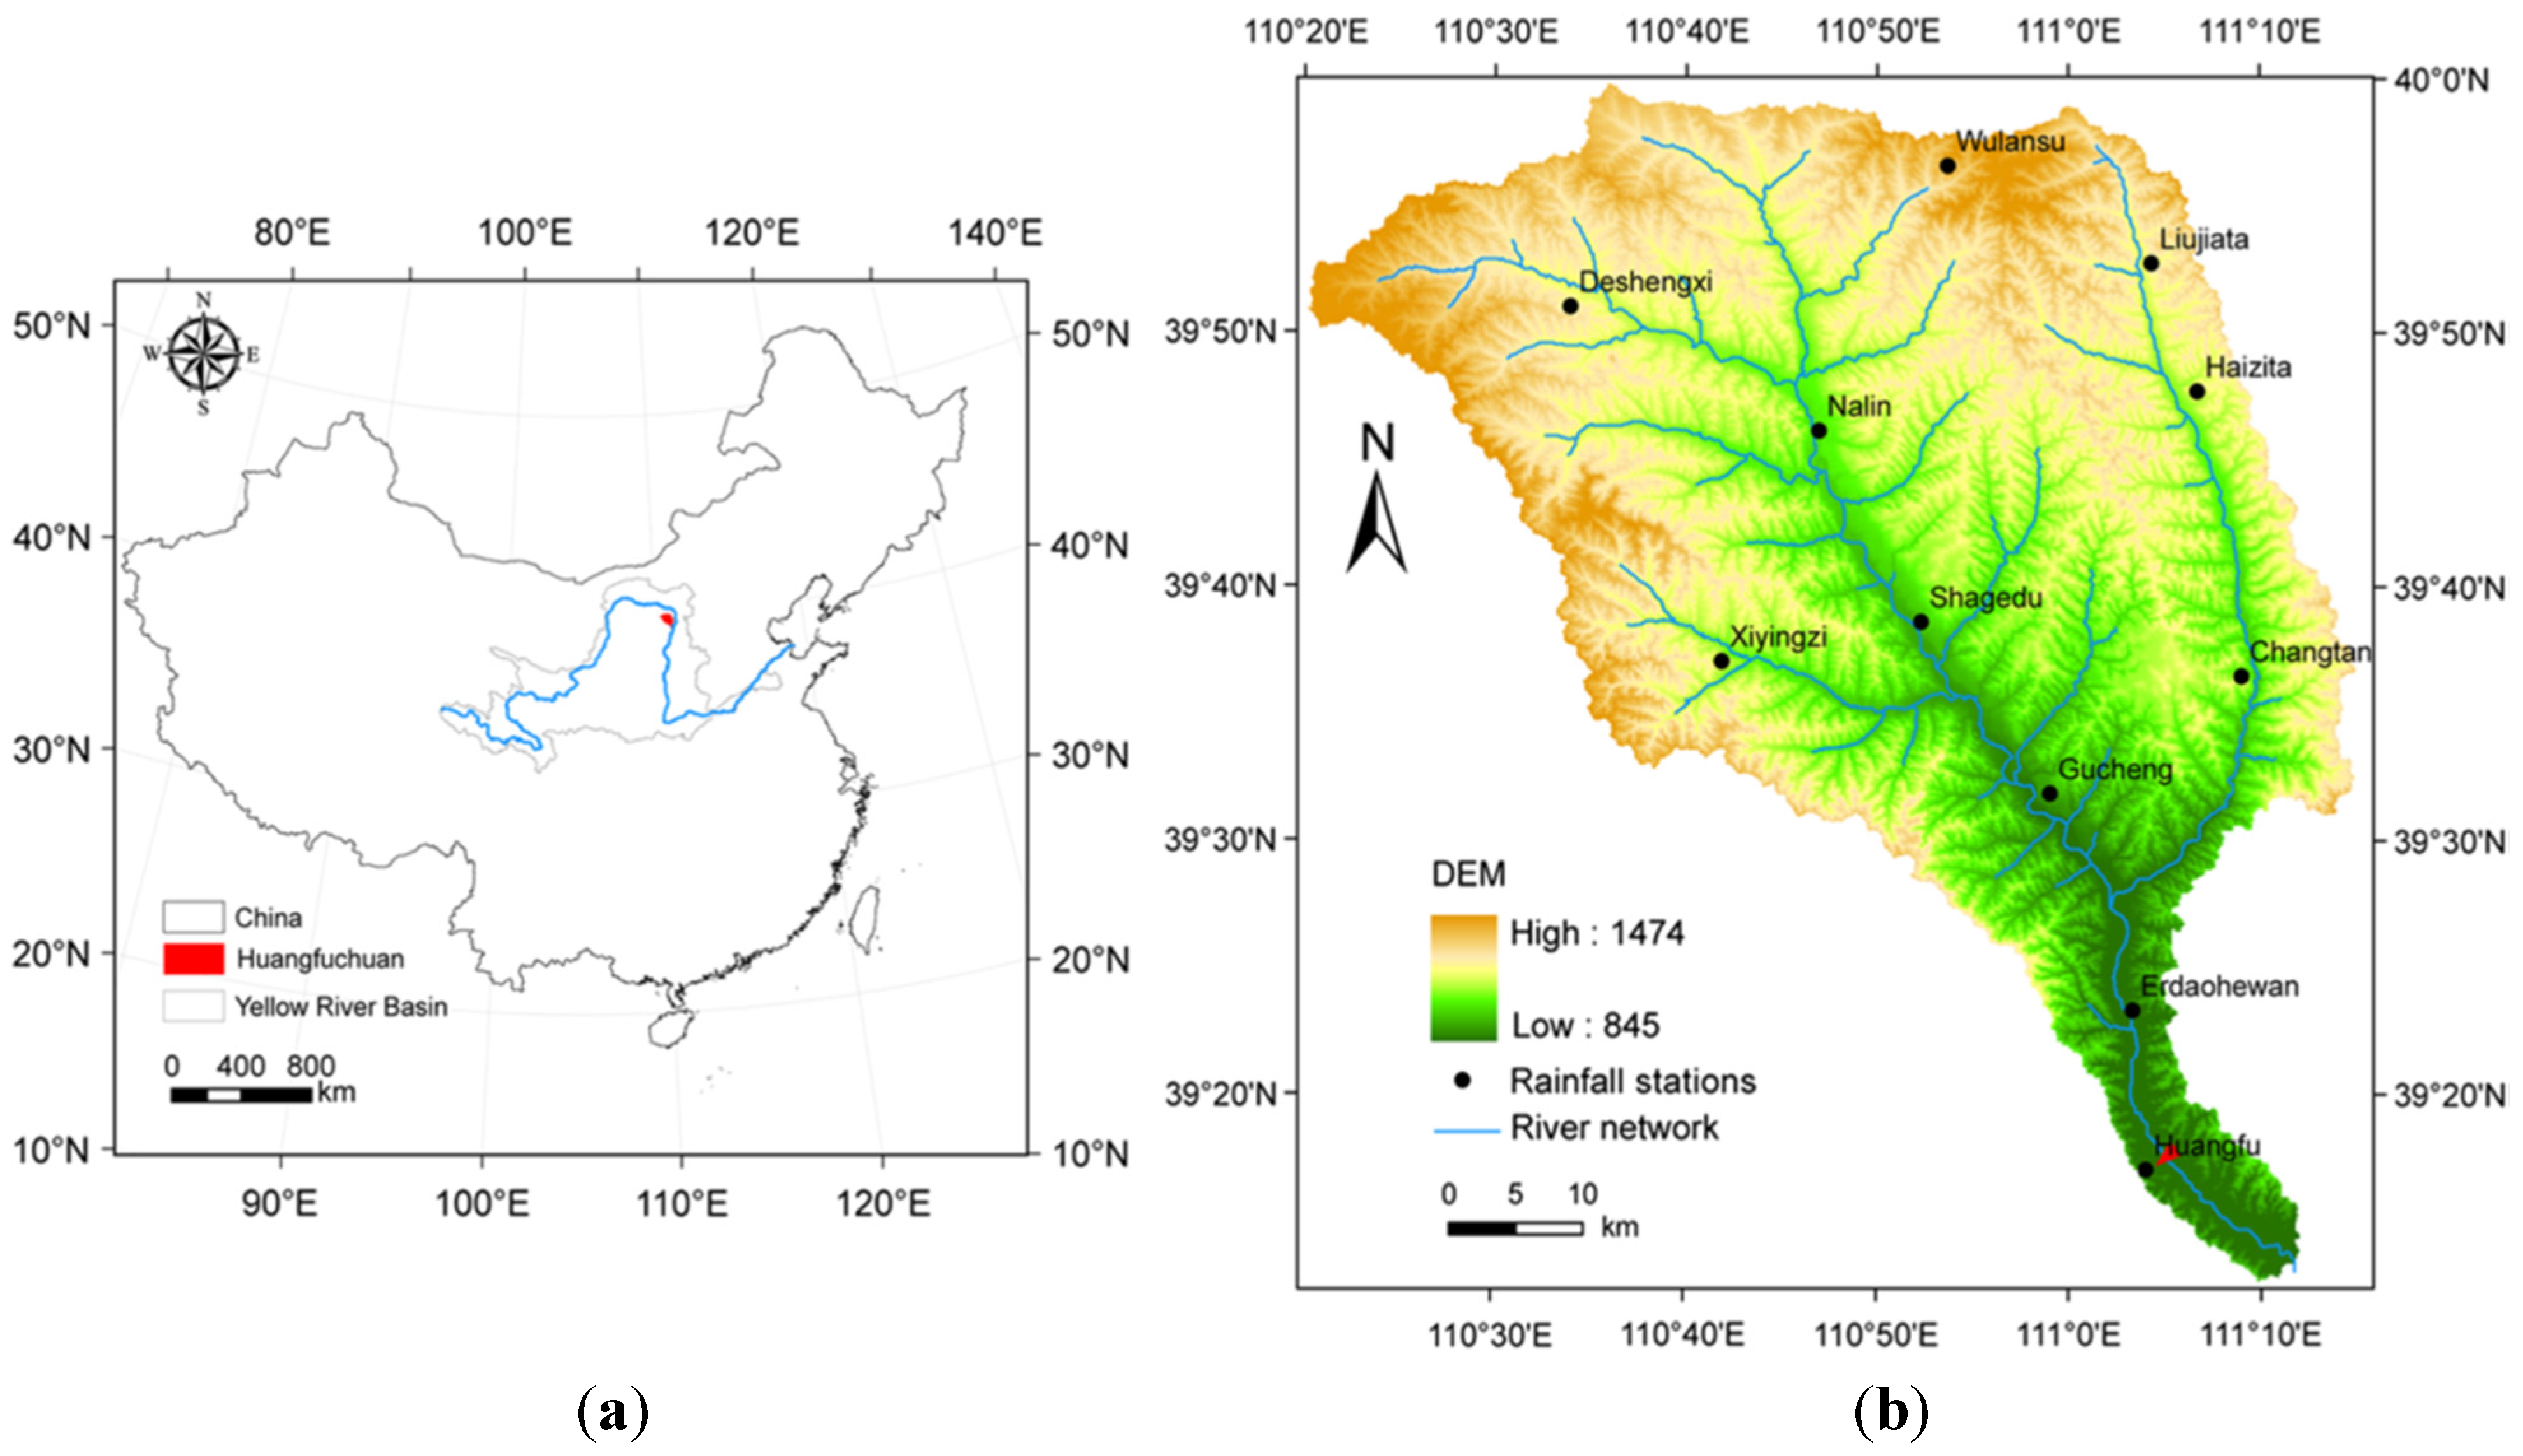
2. Study Area

3. Materials and Methods
3.1. Materials
3.1.1. Rainfall data
3.1.2. Multivariate ENSO Index (MEI)
3.2. Methods

3.2.1. Mann-Kendall Trend Analysis
3.2.2. Distribution Free Cumulative Sum (CUSUM) Test
3.2.3. Wavelet Analysis
3.2.4. Cross Wavelet Spectrum
3.2.5. Wavelet Coherence
4. Results and Discussion
4.1. Exploratory Data Analysis (EDA)


| Test Variables | SNHT | BR Test | Pettitt Test | VNR |
|---|---|---|---|---|
| Value | 4.843 | 5.619 | 158.000 | 2.447 |
| t (time of change) | 1954 | 1964 | 1979 | Does not determine time of change |
| p-value (two-tailed) | 0.314 | 0.533 | 0.715 | 0.959 |
| alpha (significance level) | 0.05 | 0.05 | 0.05 | 0.05 |
| Result | Accept the null hypothesis that the data is homogeneous | Accept the null hypothesis that the data is homogeneous | Accept the null hypothesis that the data is homogeneous | Accept the null hypothesis that the data is homogeneous |
4.2. Statistical Analysis
| S Statistic | Z | Critical Values | Interpretation | ||
|---|---|---|---|---|---|
| α = 0.1 | α = 0.05 | α = 0.01 | |||
| −130 | −0.888 | 1.645 | 1.96 | 2.576 | NS |
| Test Statistic (Vk) | Change Point (year) | Critical Values | Interpretation | ||
|---|---|---|---|---|---|
| α = 0.1 | α = 0.05 | α = 0.01 | |||
| 8 | 1979 | 9.211 | 10.268 | 12.306 | NS |
4.3. Wavelet Analysis


| Data | Pearson Correlation | Spearman Rank Correlation |
|---|---|---|
| Monthly rainfall and MEI data (original) | −0.05 | 0.028 |
| Extracted annual rainfall and 2–7 year MEI | −0.363 | −0.363 |
| Extracted Annual Rainfall and 2–7 Year MEI | Spearman Rank Correlation |
|---|---|
| Before 1968 | −0.113 |
| From 1968 | −0.351 |
5. Conclusions
- (1)
- Results from the wavelet power spectrum presented an annual trend in Huangfuchuan rainfall. The Mann-Kendall trend test and the average annual variance of the wavelet analysis showed a downward trend in the annual rainfall amounts, although this trend was found to be statistically insignificant.
- (2)
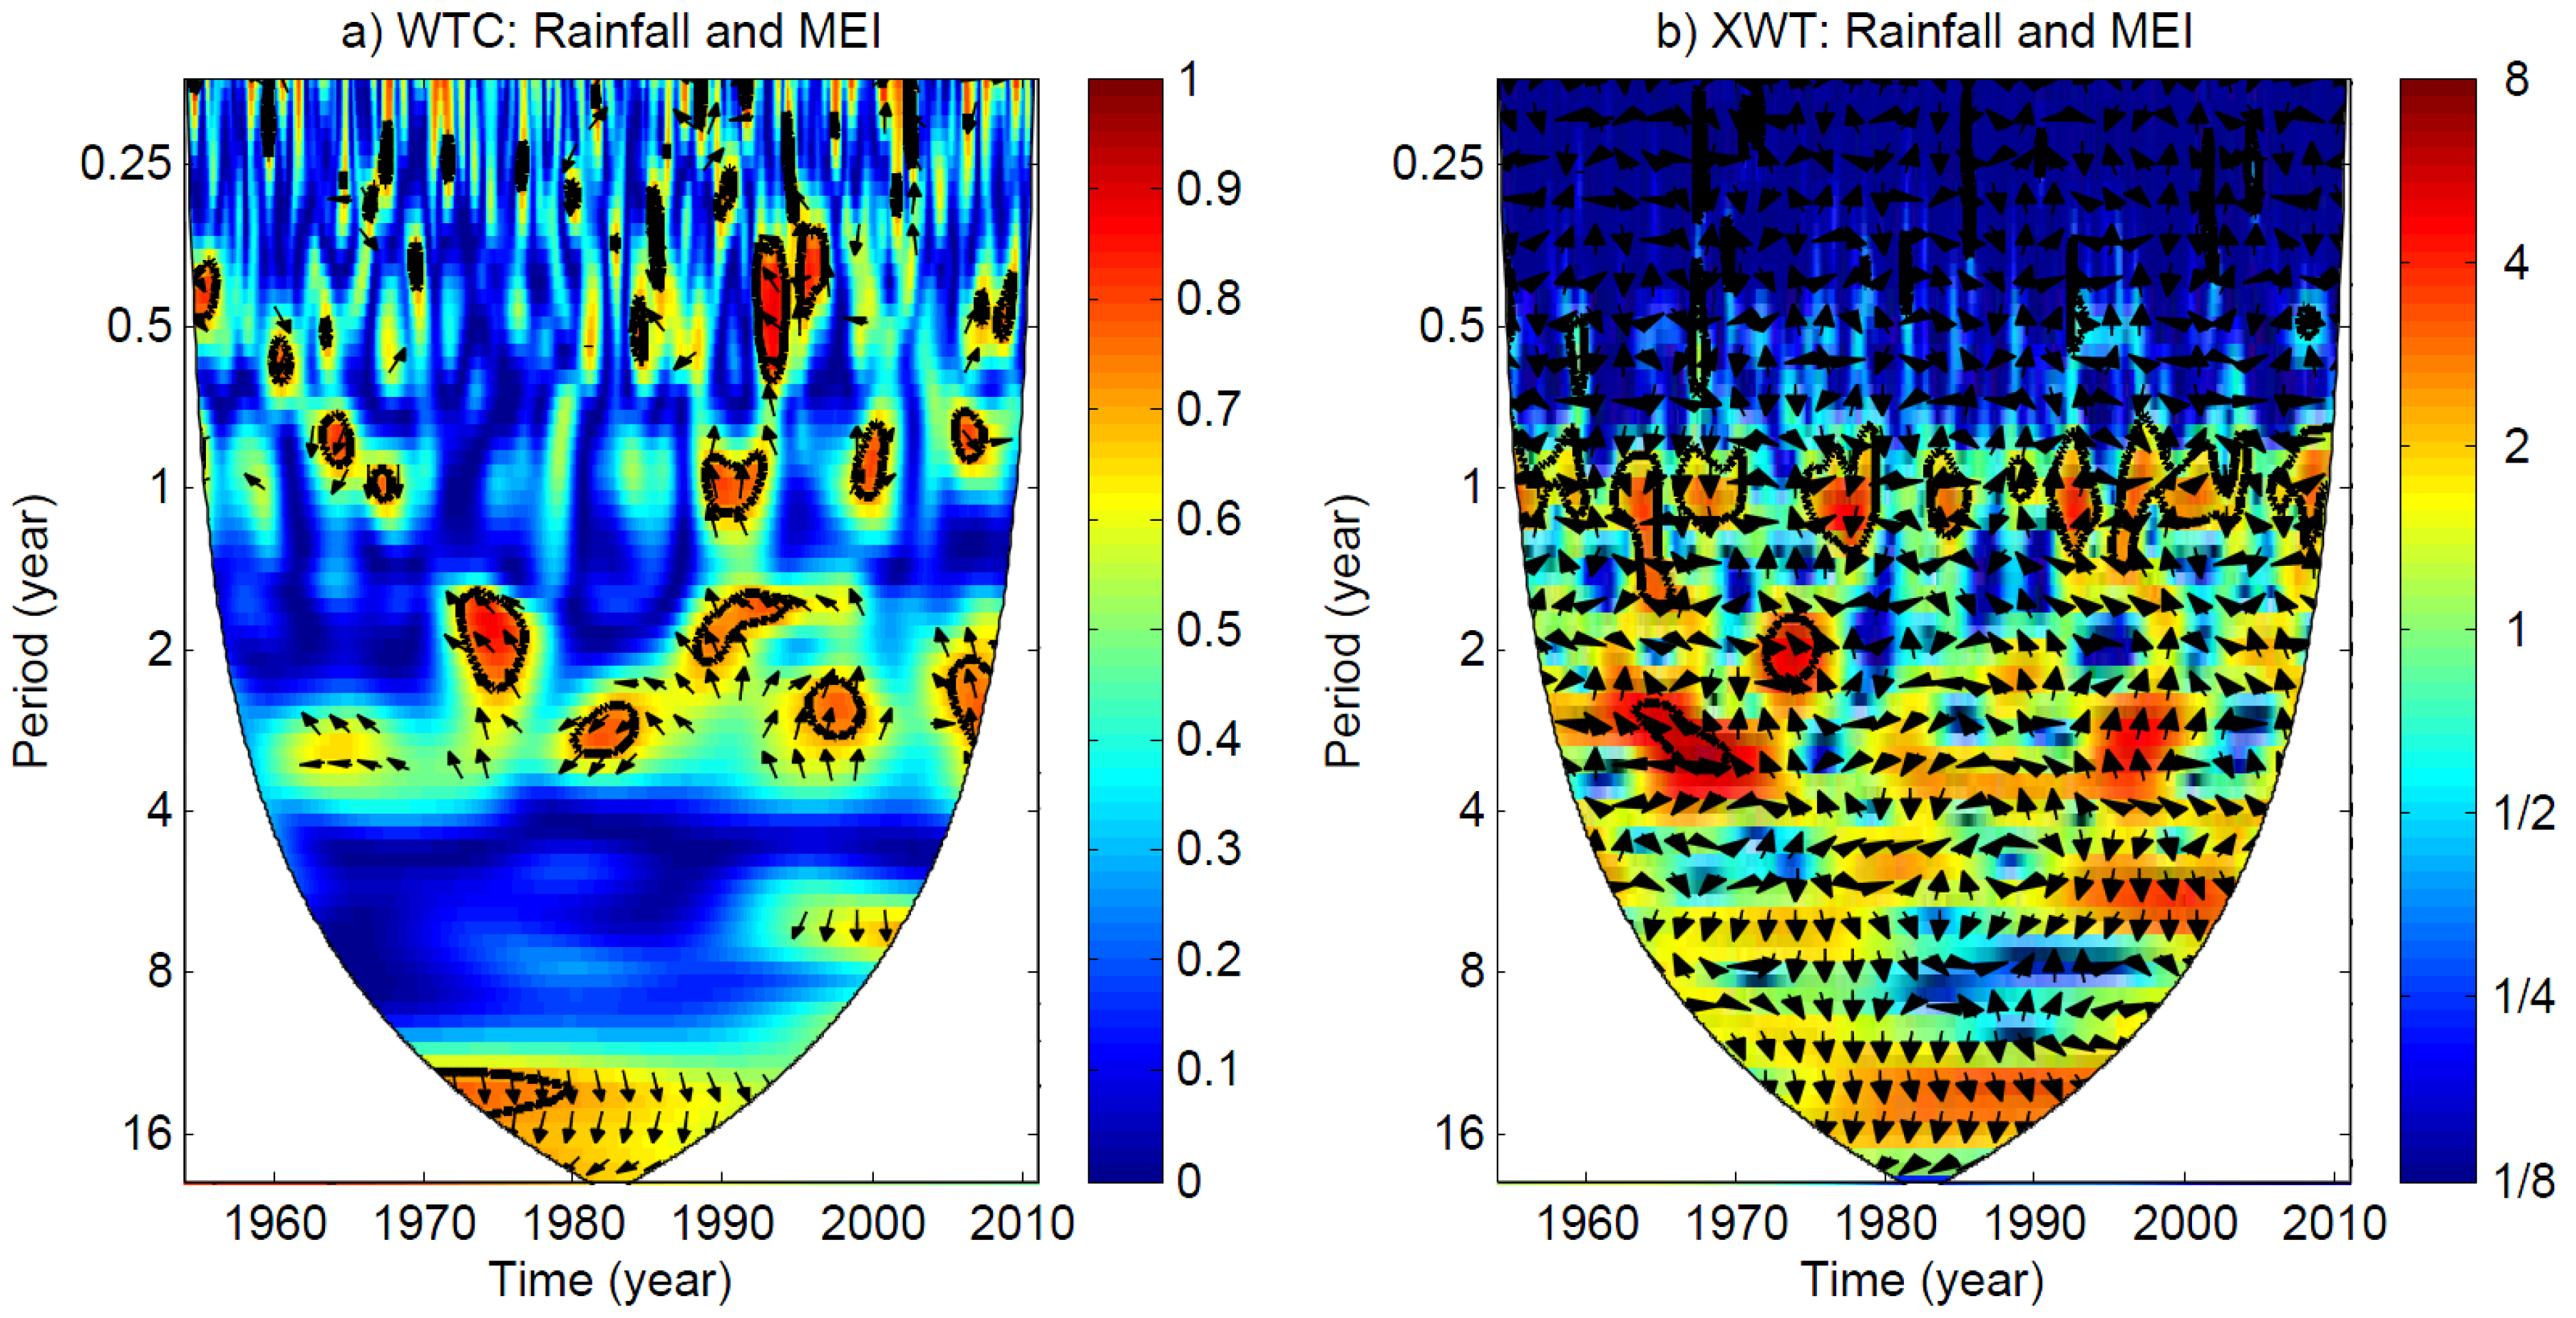
- Cross-wavelet transform analysis indicated that, Huangfuchuan rainfall is dominated by the 1–1.5 year band which has common powers corresponding to peaks and troughs in the rainfall time series. The phase difference arrows of the watershed rainfall and MEI in the 1–1.5 year bands for the cross-wavelet transform are randomly distributed and, therefore, do not provide adequate results to conclude the phase difference of the two time periods. However, significant common power in the 2–4 year band demonstrates that the common power of the two time periods varies by 10 to 11 months.
- (3)
- Wavelet coherency results establish a six-month to one year phase difference between MEI and rainfall in the Huangfuchuan watershed. This means that ENSO events lead rainfall in the watershed by that period.
- (4)
- The wavelet spectral analysis revealed that the dominant patterns in rainfall series are located at the annual scale, while that of the Multivariate ENSO Index (MEI) is found at the 2–7 year frequency band. The extracted signals at the dominant scales indicated that no significant relationship was identified between the two series (i.e., rainfall and MEI) before 1968 while subsequent years demonstrated that ENSO events have a modulating effect on rainfall, especially during the El Niño activity, which induces dry conditions. The wavelet coherence analysis showed that rainfall lags ENSO by six to twelve months. A Pearson correlation and Spearman rank correlation analysis of the extracted signals of rainfall in the Huangfuchuan watershed and MEI further demonstrated that El Niño events correspond to recurring drought periods and La Niña events are succeeded by increases in rainfall.
Acknowledgments
Author Contributions
Conflicts of Interest
References
- McVicar, T.R.; Van Niel, T.G.; Li, L.; Hutchinson, M.F.; Mu, X.; Liu, Z. Spatially distributing monthly reference evapotranspiration and pan evaporation considering topographic influences. J. Hydrol. 2007, 338, 196–220. [Google Scholar] [CrossRef]
- She, D.; Xia, J. The spatial and temporal analysis of dry spells in the Yellow River basin, China. Stoch. Environ. Res. Risk Assess. 2012, 27, 29–42. [Google Scholar] [CrossRef]
- Wang, H.; Yang, Z.; Saito, Y.; Liu, J.P.; Sun, X. Interannual and seasonal variation of the Huanghe (Yellow River) water discharge over the past 50 years: Connections to impacts from ENSO events and dams. Glob. Planet. Chang. 2006, 50, 212–225. [Google Scholar] [CrossRef]
- Fu, G.; Charles, S.P.; Viney, N.R.; Chen, S.; Wu, J.Q. Impacts of climate variability on stream-flow in the Yellow River. Hydrol. Process. 2007, 21, 3431–3439. [Google Scholar] [CrossRef]
- Wang, R.; Ren, H.; Ouyang, Z. China water vision. In Foreign Language Book; China Meteorological Press: Beijing, China, 2000. [Google Scholar]
- Zhang, Q.; Peng, J.; Singh, V.P.; Li, J.; Chen, Y.D. Spatio-Temporal variations of precipitation in arid and semiarid regions of China: The Yellow River basin as a case study. Glob. Planet. Chang. 2014, 114, 38–49. [Google Scholar] [CrossRef]
- Liu, Q.; Yang, Z.; Cui, B. Spatial and temporal variability of annual precipitation during 1961–2006 in Yellow River Basin, China. J. Hydrol. 2008, 361, 330–338. [Google Scholar] [CrossRef]
- Yellow River Conservancy Commission. Assessment Report of Climate Change Impact and Water Resources of the Yellow River Basin; UNESCO Office Beijing: Beijing, China, 2009. [Google Scholar]
- Zhao, G.; Tian, P.; Mu, X.; Jiao, J.; Wang, F.; Gao, P. Quantifying the impact of climate variability and human activities on streamflow in the middle reaches of the Yellow River basin, China. J. Hydrol. 2014, 519, 387–398. [Google Scholar] [CrossRef]
- Zhou, Y.; Yang, Z.; Zhang, D.; Jin, X.; Zhang, J. Inter-Catchment comparison of flow regime between the Hailiutu and Huangfuchuan rivers in the semi-arid Erdos Plateau, NW China. Hydrol. Sci. J. 2015, 60, 688–705. [Google Scholar] [CrossRef]
- Sui, J.; He, Y.; Karney, B.W. Flow and high sediment yield from the Huangfuchuan watershed. Int. J. Environ. Sci. Technol. 2008, 5, 149–160. [Google Scholar] [CrossRef]
- Zhou, Y.; Shi, C.; Fan, X.; Shao, W. The influence of climate change and anthropogenic activities on annual runoff of Huangfuchuan basin in northwest China. Theor. Appl. Climatol. 2015, 120, 137–146. [Google Scholar] [CrossRef]
- Abdul Aziz, O.I.; Burn, D.H. Trends and variability in the hydrological regime of the Mackenzie River Basin. J. Hydrol. 2006, 319, 282–294. [Google Scholar] [CrossRef]
- Liang, L.; Li, L.; Liu, Q. Precipitation variability in Northeast China from 1961 to 2008. J. Hydrol. 2011, 404, 67–76. [Google Scholar] [CrossRef]
- Westmacott, J.R.; Burn, D.H. Climate change effects on the hydrologic regime within the Churchill-Nelson River Basin. J. Hydrol. 1997, 202, 263–279. [Google Scholar] [CrossRef]
- Li, E.; Mu, X.; Zhao, G.; Gao, P.; Shao, H. Variation of runoff and precipitation in the hekou-longmen region of the yellow river based on elasticity analysis. Sci. World J. 2014, 2014. [Google Scholar] [CrossRef] [PubMed]
- Ward, P.J.; Jongman, B.; Kummu, M.; Dettinger, M.D.; Sperna Weiland, F.C.; Winsemius, H.C. Strong influence of El Nino Southern Oscillation on flood risk around the world. Proc. Natl. Acad. Sci. USA 2014, 111, 15659–15664. [Google Scholar] [CrossRef] [PubMed]
- Zebiak, S.E.; Orlove, B.; Muñoz, Á.G.; Vaughan, C.; Hansen, J.; Troy, T.; Thomson, M.C.; Lustig, A.; Garvin, S. Investigating El Niño-Southern Oscillation and society relationships. Wiley Interdiscip. Rev. Clim. Chang. 2015, 6, 17–34. [Google Scholar] [CrossRef]
- Bellenger, H.; Guilyardi, E.; Leloup, J.; Lengaigne, M.; Vialard, J. ENSO representation in climate models: From CMIP3 to CMIP5. Clim. Dyn. 2014, 42, 1999–2018. [Google Scholar] [CrossRef]
- Dai, A. The influence of the inter-decadal Pacific oscillation on US precipitation during 1923–2010. Clim. Dyn. 2013, 41, 633–646. [Google Scholar] [CrossRef]
- Donders, T.H.; Punyasena, S.W.; de Boer, H.J.; Wagner-Cremer, F. ENSO signature in botanical proxy time series extends terrestrial El Niño record into the (sub)tropics. Geophys. Res. Lett. 2013, 40, 5776–5781. [Google Scholar] [CrossRef]
- Zebiak, S.E. Air-Sea interaction in the equatorial Atlantic region. J. Clim. 1993, 6, 1567–1586. [Google Scholar] [CrossRef]
- Philander, S.G.H. El Niño and La Niña. J. Atmos. Sci. 1985, 42, 2652–2662. [Google Scholar] [CrossRef]
- Feng, S.; Hu, Q. Variations in the teleconnection of ENSO and summer rainfall in Northern China: A role of the Indian Summer Monsoon. J. Clim. 2004, 17, 4871–4881. [Google Scholar] [CrossRef]
- Lau, K.M.; Weng, H. Coherent modes of global SST and summer rainfall over China: An assessment of the regional impacts of the 1997–98 El Niño. J. Clim. 2001, 14, 1294–1308. [Google Scholar] [CrossRef]
- Wang, W.-C.; Li, K. Precipitation fluctuation over semiarid region in northern China and the relationship with El Nino/Southern Oscillation. J. Clim. 1990, 3, 769–783. [Google Scholar] [CrossRef]
- Ropelewski, C.F.; Halpert, M.S. Global and regional scale precipitation patterns associated with the El Niño/Southern Oscillation. Mon. Weather Rev. 1987, 115, 1606–1626. [Google Scholar] [CrossRef]
- Hui, G.; Yongguang, W.; Jinhai, H. Weakening significance of ENSO as a predictor of summer precipitation in China. Geophys. Res. Lett. 2006, 33, L09807. [Google Scholar] [CrossRef]
- Tong, J.; Qiang, Z.; Deming, Z.; Yijin, W. Yangtze floods and droughts (China) and teleconnections with ENSO activities (1470–2003). Quat. Int. 2006, 144, 29–37. [Google Scholar] [CrossRef]
- Ronghui, H.; Yifang, W. The influence of ENSO on the summer climate change in China and its mechanism. Adv. Atmos. Sci. 1989, 6, 21–32. [Google Scholar] [CrossRef]
- Ding, Y. Monsoons over China; Springer Science & Business Media: Dordrecht, The Netherlands, 1994; Volume 16. [Google Scholar]
- Zhang, R.; Sumi, A.; Kimoto, M. A diagnostic study of the impact of El Niño on the precipitation in China. Adv. Atmos. Sci. 1999, 16, 229–241. [Google Scholar] [CrossRef]
- Kiem, A.S.; Geogievsky, M.V.; Hapuarachchi, H.P.; Ishidaira, H.; Takeuchi, K. Relationship between ENSO and snow covered area in the Mekong and Yellow River basins. In Proceedings of the International Symposium on Regional Hydrological Impacts of Climatic Variability and Change with an Emphasis on Less Developed Countries, Held during the 7th Scientific Assembly of the International Association of Hydrological Sciences, Foz de Iguaço, Brazil, 3–9 April 2005; Volume 2, pp. 255–264.
- Wang, G.X.; Shen, Y.P.; Liu, S.Y. On the characteristics of response of precipitation and runoff to the ENSO events in the source regions of the Yellow River. J. Glaciol. Geocryol. 2001, 23, 16–21. [Google Scholar]
- Sang, Y.-F. A review on the applications of wavelet transform in hydrology time series analysis. Atmos. Res. 2013, 122, 8–15. [Google Scholar] [CrossRef]
- Maheswaran, R.; Khosa, R. Comparative study of different wavelets for hydrologic forecasting. Comput. Geosci. 2012, 46, 284–295. [Google Scholar] [CrossRef]
- Sang, Y.-F. Improved Wavelet Modeling Framework for Hydrologic Time Series Forecasting. Water Resour. Manag. 2013, 27, 2807–2821. [Google Scholar] [CrossRef]
- Hao, Y.; Liu, G.; Li, H.; Li, Z.; Zhao, J.; Jim Yeh, T.-C. Investigation of karstic hydrological processes of Niangziguan Springs (North China) using wavelet analysis. Hydrol. Process. 2012, 26, 3062–3069. [Google Scholar] [CrossRef]
- Grinsted, A.; Moore, J.C.; Jevrejeva, S. Application of the cross wavelet transform and wavelet coherence to geophysical time series. Nonlinear Process. Geophys. 2004, 11, 561–566. [Google Scholar] [CrossRef]
- Jevrejeva, S.; Moore, J.C.; Grinsted, A. Influence of the Arctic Oscillation and El Niño-Southern Oscillation (ENSO) on ice conditions in the Baltic Sea: The wavelet approach. J. Geophys. Res. 2003, 108. [Google Scholar] [CrossRef]
- Lin, Y.-C.; Yu, H.-L. The cross wavelet and wavelet coherence analysis of spatio-temporal rainfall-groundwater system in Pingtung plain, Taiwan. In Proceedings of the EGU General Assembly 2013, Vienna, Austria, 7–12 April 2013; Volume 15.
- Shanahan, T.M.; Overpeck, J.T.; Anchukaitis, K.J.; Beck, J.W.; Cole, J.E.; Dettman, D.L.; Peck, J.A.; Scholz, C.A.; King, J.W. Atlantic forcing of persistent drought in West Africa. Science 2009, 324, 377–380. [Google Scholar] [CrossRef] [PubMed]
- Yin, Y.; Xu, Y.; Chen, Y. Relationship between flood/drought disasters and ENSO from 1857 to 2003 in the Taihu Lake basin, China. Quat. Int. 2009, 208, 93–101. [Google Scholar] [CrossRef]
- Xu, H.; Taylor, R.; Kingston, D.; Thompson, J.; Todd, M. Impact of climate scenarios on water resources in River Xiangxi and Huangfuchuan basin. In Proceedings of the Quest-GSI Water Resources Workshop, Reading, UK, 30 March–3 April 2009.
- Xu, H.; Taylor, R.G.; Xu, Y. Quantifying uncertainty in the impacts of climate change on river discharge in sub-catchments of the Yangtze and Yellow River Basins, China. Hydrol. Earth Syst. Sci. 2011, 15, 333–344. [Google Scholar] [CrossRef]
- Li, T.; Wang, G.; Huang, Y.; Fu, X. Response of soil erosion and sediment yield to the temporal variation of precipitation in the Loess Plateau. In Proceedings of the 15th International Congress of the International Soil Conservation Organization (ISCO), Budapest, Hungary, 18–23 May 2008.
- Tian, P.; Zhao, G.; Mu, X.; Wang, F.; Gao, P.; Mi, Z. Check dam identification using multisource data and their effects on streamflow and sediment load in a Chinese Loess Plateau catchment. J. Appl. Remote Sens. 2013, 7. [Google Scholar] [CrossRef]
- NOAA/OAR/ESRL PSD. Multivariate ENSO Index (MEI). Available online: http://www.esrl.noaa.gov/psd/enso/mei/ (accessed on 15 October 2014).
- Wolter, K.; Timlin, M.S. El Niño/Southern Oscillation behaviour since 1871 as diagnosed in an extended multivariate ENSO index (MEI.ext). Int. J. Climatol. 2011, 31, 1074–1087. [Google Scholar] [CrossRef]
- Alexandersson, H. A homogeneity test applied to precipitation data. J. Climatol. 1986, 6, 661–675. [Google Scholar] [CrossRef]
- Buishand, T.A. Some methods for testing the homogeneity of rainfall records. J. Hydrol. 1982, 58, 11–27. [Google Scholar] [CrossRef]
- Pettitt, A.N. A non-parametric approach to the change-point problem. Appl. Stat. 1979, 126, 126–135. [Google Scholar] [CrossRef]
- Von Neumann, J. Distribution of the ratio of the mean square successive difference to the variance. Ann. Math. Stat. 1941, 12, 367–395. [Google Scholar] [CrossRef]
- Wijngaard, J.B.; Klein Tank, A.M.G.; Können, G.P. Homogeneity of 20th century European daily temperature and precipitation series. Int. J. Climatol. 2003, 23, 679–692. [Google Scholar] [CrossRef]
- Kang, H.; Yusof, F. Homogeneity tests on daily rainfall series in Peninsular Malaysia. Int. J. Contemp. Math. Sci. 2012, 7, 9–22. [Google Scholar]
- Chiew, F.; Siriwardena, L. Trend User Guide 2005; CRC for Catchment Hydrology: Canberra, Australia, 2005. [Google Scholar]
- NOC/NERC. Crosswavelet and Wavelet Coherence. Available online: http://noc.ac.uk/using-science/crosswavelet-wavelet-coherence (accessed on 3 September 2014).
- Mann, H.B. Nonparametric tests against trend. Econom. J. Econom. Soc. 1945, 245–259. [Google Scholar] [CrossRef]
- Kendall, M.G. Rank Correlation Measures; Charles Griffin: London, UK, 1975; Volume 202. [Google Scholar]
- Mondal, A.; Kundu, S.; Mukhopadhyay, A. Rainfall trend analysis by Mann-Kendall test: A case study of north-eastern part of Cuttack District, Orissa. Int. J. Geol. Earth Environ. Sci. 2012, 2, 70–78. [Google Scholar]
- Onoz, B.; Bayazit, M. The power of statistical tests for trend detection. Turkish J. Eng. Environ. Sci. 2003, 27, 247–251. [Google Scholar]
- Chiew, F.H.S.; McMahon, T.A. Detection of trend or change in annual flow of Australian rivers. Int. J. Climatol. 1993, 13, 643–653. [Google Scholar] [CrossRef]
- Kundzewicz, Z.W.; Robson, A. (Eds.) Detecting Trend and Other Changes in Hydrological Data; WCDMP-46, WMO/TD-No.1025; World Meteorological Organization (WMO): Geneva, Switzerland, 2000.
- McGilchrist, C.A.; Woodyer, K.D. Note on a distribution-free CUSUM technique. Technometrics 1975, 17, 321–325. [Google Scholar] [CrossRef]
- Karpouzos, D.K.; Kavalieratou, S.; Babajimopoulos, C. Trend analysis of precipitation data in Pieria Region (Greece). Eur. Water 2010, 30, 31–40. [Google Scholar]
- Kim, S. Wavelet analysis of precipitation variability in northern California, U.S.A. KSCE J. Civ. Eng. 2004, 8, 471–477. [Google Scholar] [CrossRef]
- Labat, D. Recent advances in wavelet analyses: Part 1. A review of concepts. J. Hydrol. 2005, 314, 275–288. [Google Scholar] [CrossRef]
- Morlet, J.; Arens, G.; Fourgeau, E.; Glard, D. Wave propagation and sampling theory-Part I: Complex signal and scattering in multilayered media. Geophysics 1982, 47, 203–221. [Google Scholar] [CrossRef]
- Farge, M. Wavelet transforms and their applications to turbulence. Annu. Rev. Fluid Mech. 1992, 24, 395–457. [Google Scholar] [CrossRef]
- Gaucherel, C. Use of wavelet transform for temporal characterisation of remote watersheds. J. Hydrol. 2002, 269, 101–121. [Google Scholar] [CrossRef]
- Kang, S.; Lin, H. Wavelet analysis of hydrological and water quality signals in an agricultural watershed. J. Hydrol. 2007, 338, 1–14. [Google Scholar] [CrossRef]
- Nakken, M. Wavelet analysis of rainfall-runoff variability isolating climatic from anthropogenic patterns. Environ. Model. Softw. 1999, 14, 283–295. [Google Scholar] [CrossRef]
- Torrence, C.; Compo, G.P. A practical guide to wavelet analysis. Bull. Am. Meteorol. Soc. 1998, 79, 61–78. [Google Scholar] [CrossRef]
- Zhang, Q.; Xu, C.; Jiang, T.; Wu, Y. Possible influence of ENSO on annual maximum streamflow of the Yangtze River, China. J. Hydrol. 2007, 333, 265–274. [Google Scholar] [CrossRef]
- Jevrejeva, S.; Moore, J.C.; Grinsted, A. ENSO signal propagation detected by wavelet coherence and mean phase coherence methods. In Nonlinear Dynamics in Geosciences; Tsonis, A.A., Elsner, J.B., Eds.; Springer New York: New York, NY, USA, 2007; pp. 167–175. [Google Scholar]
- Torrence, C.; Webster, P.J. Interdecadal Changes in the ENSO–Monsoon System. J. Clim. 1999, 12, 2679–2690. [Google Scholar] [CrossRef]
- Torrence, C.; Webster, P.J. The annual cycle of persistence in the El Nño/Southern Oscillation. Q. J. R. Meteorol. Soc. 1998, 124, 1985–2004. [Google Scholar] [CrossRef]
- Rasmusson, E.M.; Carpenter, T.H. Variations in tropical sea surface temperature and surface wind fields associated with the Southern Oscillation/El Niño. Mon. Weather Rev. 1982, 110, 354–384. [Google Scholar] [CrossRef]
- Wu, R.; Hu, Z.-Z.; Kirtman, B.P. Evolution of ENSO-related rainfall anomalies in East Asia. J. Clim. 2003, 16, 3742–3758. [Google Scholar] [CrossRef]
© 2015 by the authors; licensee MDPI, Basel, Switzerland. This article is an open access article distributed under the terms and conditions of the Creative Commons Attribution license (http://creativecommons.org/licenses/by/4.0/).
Share and Cite
Baddoo, T.D.; Guan, Y.; Zhang, D.; Andam-Akorful, S.A. Rainfall Variability in the Huangfuchuang Watershed and Its Relationship with ENSO. Water 2015, 7, 3243-3262. https://doi.org/10.3390/w7073243
Baddoo TD, Guan Y, Zhang D, Andam-Akorful SA. Rainfall Variability in the Huangfuchuang Watershed and Its Relationship with ENSO. Water. 2015; 7(7):3243-3262. https://doi.org/10.3390/w7073243
Chicago/Turabian StyleBaddoo, Thelma Dede, Yiqing Guan, Danrong Zhang, and Samuel A. Andam-Akorful. 2015. "Rainfall Variability in the Huangfuchuang Watershed and Its Relationship with ENSO" Water 7, no. 7: 3243-3262. https://doi.org/10.3390/w7073243