Article

Optimal Spatial Design of Capacity and Quantity of Rainwater Harvesting Systems for Urban Flood Mitigation

1
Department of Civil Engineering, National Taiwan University, No. 1, Sec. 4, Roosevelt Road, Taipei 10617, Taiwan
2
Department of Marine Environmental Informatics, National Taiwan Ocean University, No. 2, Beining Road, Jhongjheng District, Keelung City 20224, Taiwan
*
Author to whom correspondence should be addressed.
Water 2015, 7(9), 5173-5202; https://doi.org/10.3390/w7095173
Submission received: 8 July 2015 / Accepted: 15 September 2015 / Published: 23 September 2015

Abstract

:
This study adopts rainwater harvesting systems (RWHS) into a stormwater runoff management model (SWMM) for the spatial design of capacities and quantities of rain barrel for urban flood mitigation. A simulation-optimization model is proposed for effectively identifying the optimal design. First of all, we particularly classified the characteristic zonal subregions for spatial design by using fuzzy C-means clustering with the investigated data of urban roof, land use and drainage system. In the simulation method, a series of regular spatial arrangements specification are designed by using statistical quartiles analysis for rooftop area and rainfall frequency analysis; accordingly, the corresponding reduced flooding circumstances can be simulated by SWMM. Moreover, the most effective solution for the simulation method is identified from the calculated net benefit, which is equivalent to the subtraction of the facility cost from the decreased inundation loss. It serves as the initially identified solution for the optimization model. In the optimization method, backpropagation neural network (BPNN) are first applied for developing a water level simulation model of urban drainage systems to substitute for SWMM to conform to newly considered interdisciplinary multi-objective optimization model, and a tabu search-based algorithm is used with the embedded BPNN-based SWMM to optimize the planning solution. The developed method is applied to the Zhong-He District, Taiwan. Results demonstrate that the application of tabu search and the BPNN-based simulation model into the optimization model can effectively, accurately and fast search optimal design considering economic net benefit. Furthermore, the optimized spatial rain barrel design could reduce 72% of inundation losses according to the simulated flood events.

1. Introduction

In recent years, on account of global climate change and the increasing occurrence of extreme hydrological events, coupled with the fact that Taiwan is densely populated and overdeveloped in catchment areas, the amount of flooding caused by heavy rain often exceeds the scale of the originally designed standard. Additionally, the drainage system in Taiwan is insufficient, which causes the water level to rise extremely quickly during typhoons and heavy rainfall. The pumping station of the urban drainage system cannot handle such large amount of flood in recent years, this leads to flooding and the subsequent loss of life and property. In response to this challenging situation, new modes, measures and solutions should be developed to achieve the goal and evaluate the feasibility for flood mitigation.
Low-impact development (LID) provides techniques for innovative urban environmental planning, management, and environmental protection. The frequently used techniques include rain barrels, green roofs, permeable paving, roadside ecological spaces, rainwater harvesting systems (RWHS), and others. The LID facilities have relatively lower costs in reducing peak and total runoff compared to traditional flood control measures for building underground pipeline culverts. Moreover, LID facilities can provide additional benefits, such as water conservation, urban beautification, and improvement of the ecological environment. Among these facilities, RWHS can be implemented on in-place water harvesting, which differs from the traditional drainage concept of the end-trace centralization process. RWHS are containers that collect roof runoff during storm events and can either release or re-use the rainwater during dry periods. RWHS collect runoff from rooftops and convey it to a cistern tank. Furthermore, RWHS are easy to obtain, cause less pollution and costs at a lower risk, and involve no water right disputes. In short, these systems can serve as flood detention means and alternative water sources that are worthy of broad use.
Previous studies regarding RWHS can be divided into two categories. The first one is the capacity design of RWHS under the consideration of domestic water supply those primarily employ a simulation method for planning. The related studies are described as follows: Liaw and Tsai (2004) [1] developed a simulation model including production to estimate the most cost effective combination of the roof area and the storage capacity that best supplies a specific volume of water. Liaw and Chiang (2014) [2] developed a regional-level and dimensionless analysis for designing a domestic RWHS. Moreover, regarding design using economic and dimensionless analysis-based optimization approach, Chiu et al. (2009) [3] optimized the most cost-effective rainwater tank volumes for different dwelling types using marginal analysis. Campisano and Modica (2012) [4] developed a dimensionless methodology for the optimal design of domestic RWHS. From these studies, we can find out that previous studies have scarcely designed the capacity of RWHS considering flood reduction benefits using an interdisciplinary integrated systematic analysis approach. In addition, the capacity design of RWHS is primarily limited to small communities and lacks full consideration of all metropolitan catchment with variations in spatial capacity and quantity design of RWHS.
The second category regarding RWHS is simulation and evaluation of the effectiveness and reliability of domestic RWHS with a variety of patterns on the water supply objects. The research subjects include: (1) evaluating the potential for potable water savings by using rainwater in residential sectors [5,6]; (2) estimating nonpotable household potential, sustainability and performance of storage type of RWHS [7,8,9] and investigating the potential benefits from sharing RWHS with nearby neighbors with a storage-reliability-yield analysis (Seo et al., 2015 [10]) using rainfall data; and (3) establishing the probabilistic relationships between storage capacities and deficit rates of RWHS [11] and that of between the efficiency of rural domestic rainwater management and tank size, tank operation and maintenance, respectively [12]. However, these studies seldom consider the surface and sewer physical flowing phenomenon after rainwater partially intercepted by RWHS and partially flowing to ground and urban drainage system. To address these problems, there are numerous studies evaluating and assessing the performance and reliability of RWHS using numerical or hydrological model. The related studies are, for example, Jones and Hunt (2010) [13] evaluated the performance of RWHS by a monitoring study with a computer model (Rainwater Harvester 3.0), Basinger et al. (2010) [14] assessed the reliability of RWHS using a novel model based on a nonparametric rainfall generation procedure utilizing a bootstrapped Markov chain, and Palla et al. (2011) [15] proposed nondimensional parameters with a suitable behavioral model according to a daily mass balance equation to investigate optimum performance of RWHS. However, these studies almost only estimated the efficiency of RWHS for nonpotable household water saving that did not assess the feasibility for flood mitigation. In addition, the performance of RWHS for stormwater retention has been studied, such as [16,17,18]. However, these studies seldom simulated, evaluated and account for the inundated loss of each actual flood event in terms of the space design patterns of RWHS.
The purpose of this study is to develop a set of novel simulation-optimization models to identify the most effective spatial design for a quantity and capacity arrangement of RWHS in urban drainage areas considering fast and effective optimization of flooding loss reduction and facility cost minimization. The effective characteristic zonal subregions for spatial design are particularly classified by using fuzzy C-means (FCM) clustering with the investigated data of urban roof, land use and rainfall characteristic among drainage area, and a series of representative regular spatial arrangements specification are designed by using statistical quartiles analysis for rooftop area and rainfall frequency analysis. A backpropagation neural network-based [19,20] water level simulation model is embedded in the optimization model, and used to substitute for the hydrologic/hydraulic-based storm water management model [21,22] to conform to newly considered interdisciplinary multiobjective optimization model, and combine it with tabu search (Glover, 1986; Glover and Laguna, 1997 [23,24]) to achieve the optimization process.

2. Development of Methodology

2.1. Procedures

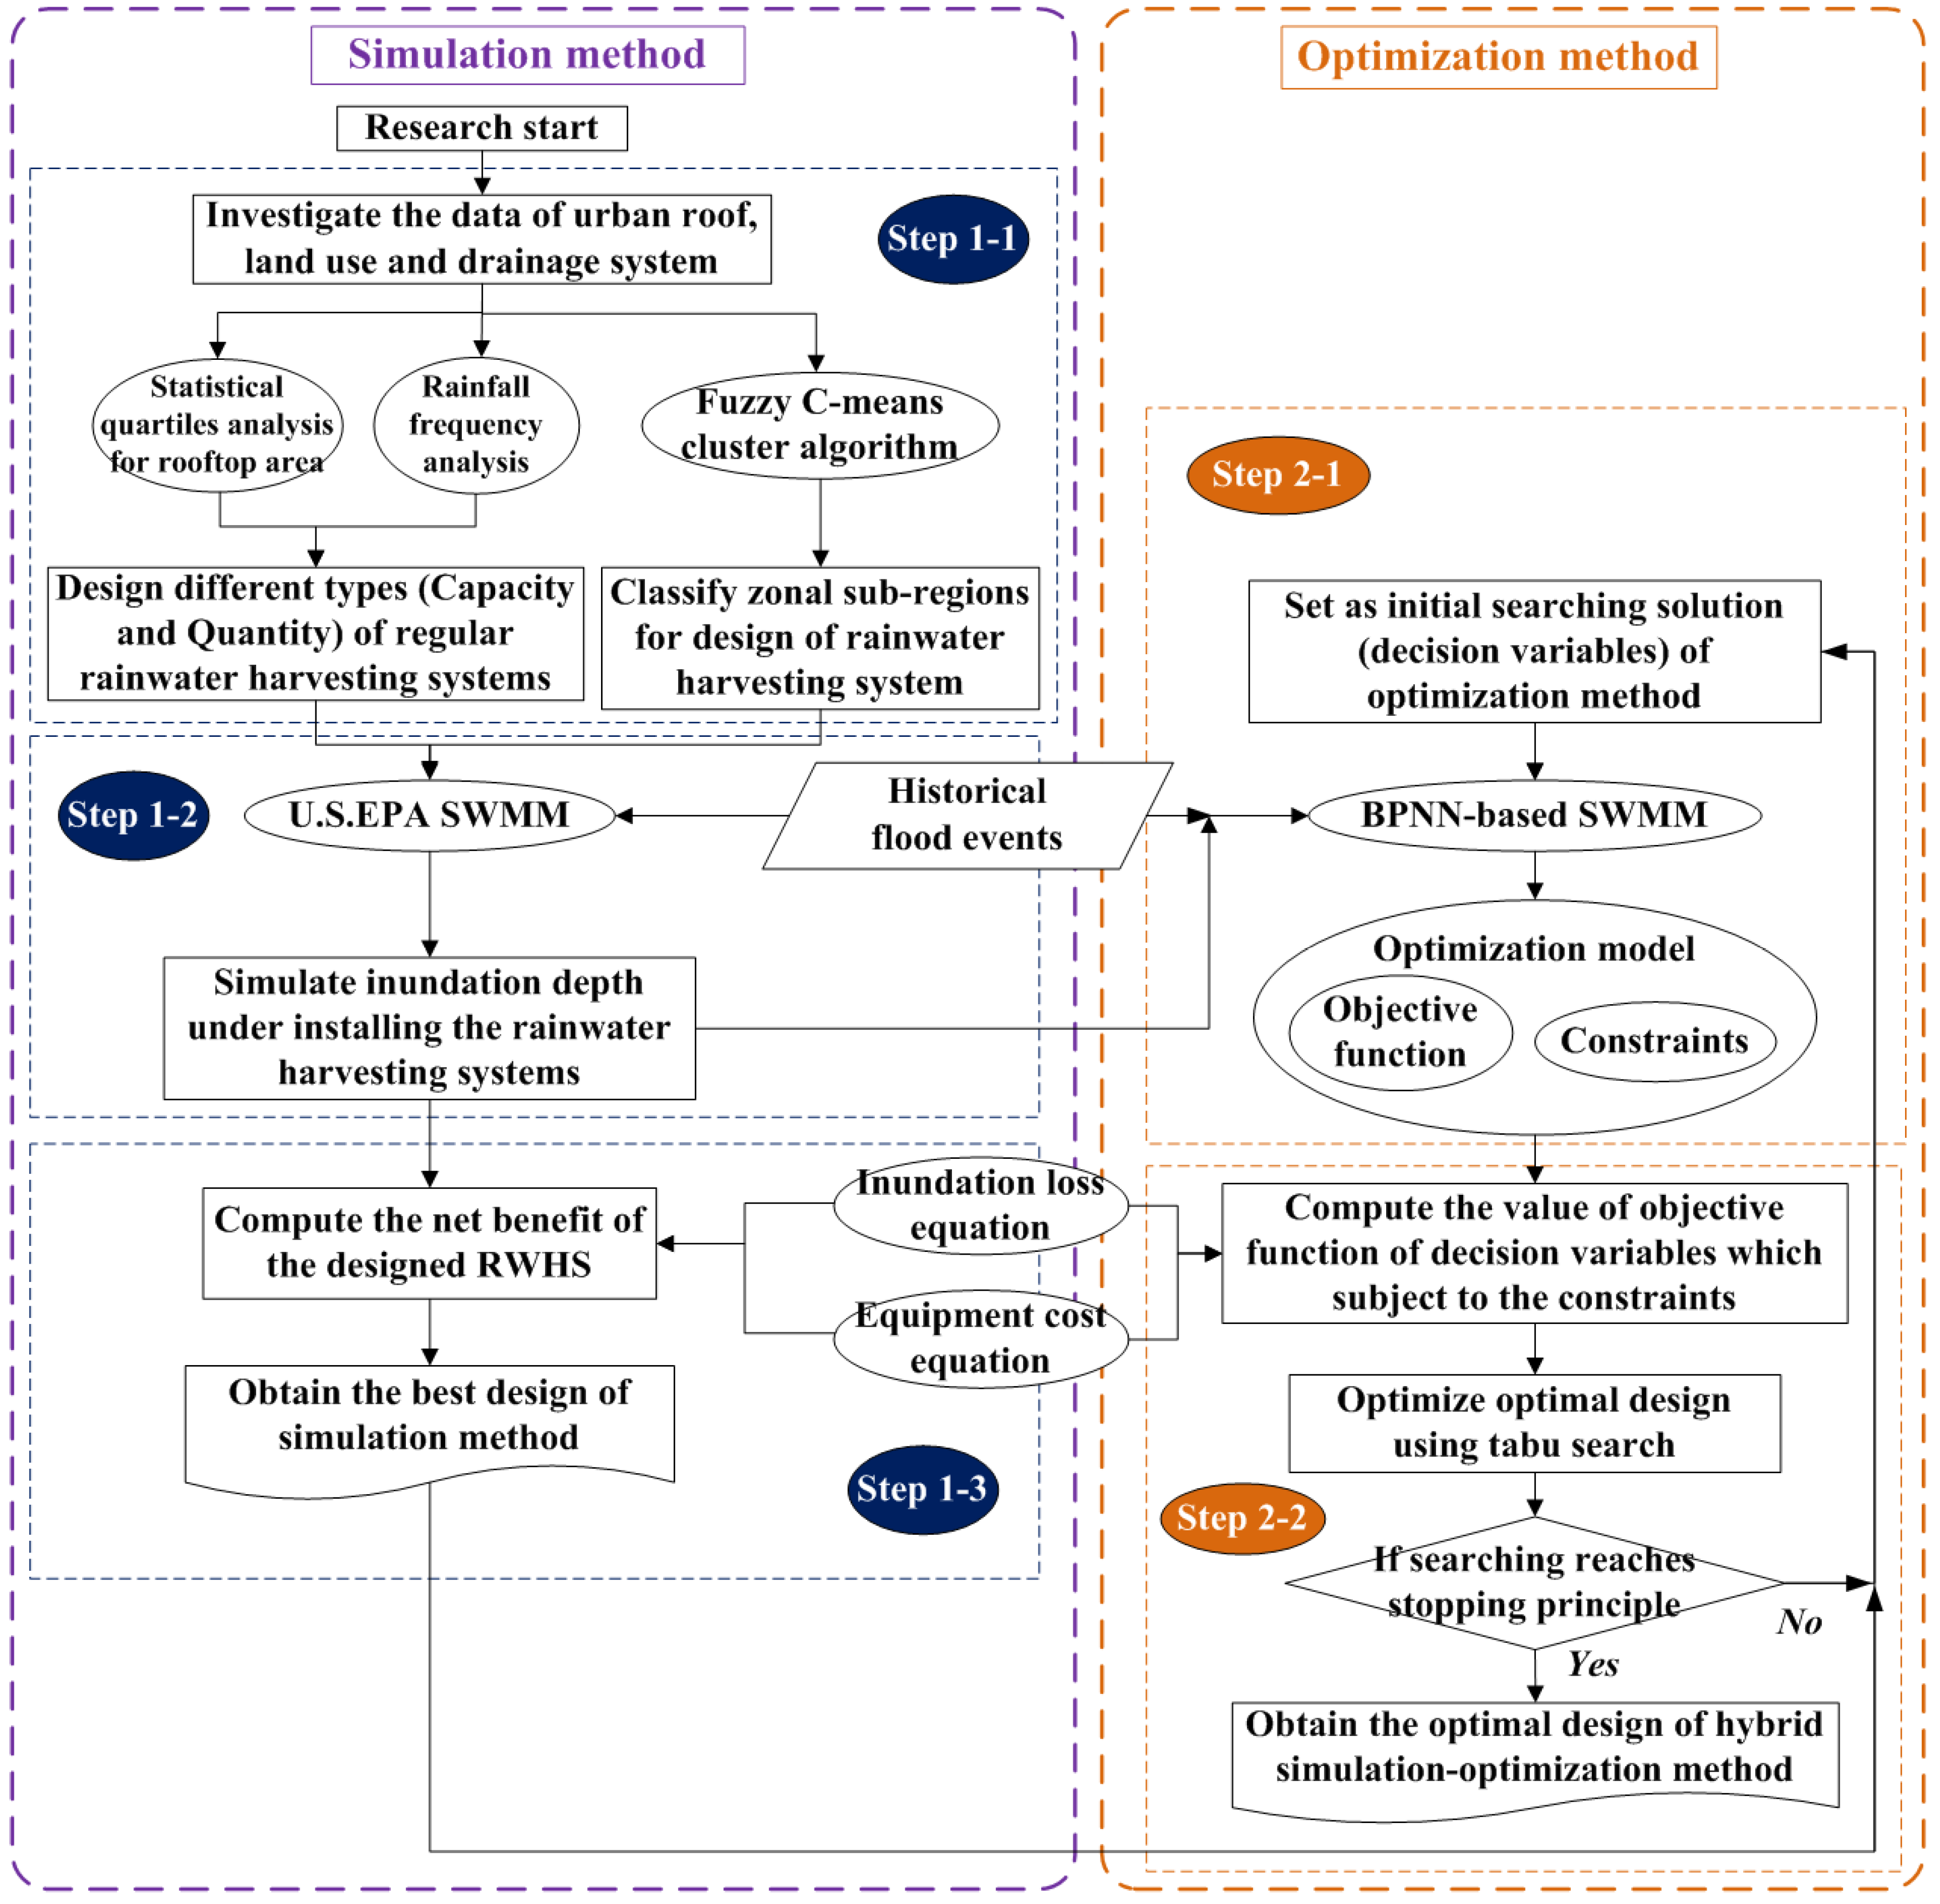
The methodology of this study is divided into two parts: a simulation method and a hybrid simulation-optimization method. Information obtained from the simulation method is entered into the optimization model to produce the optimal solution. The flowchart of the methodology can be shown in Figure 1, and the steps are described as follows.
Figure 1. Flowchart of the methodology.
Water 07 05173 g001
Step 1-1: Investigate the data of urban roof, land use and drainage system. Then design the regular spatial quantity and capacity arrangement of different types of RWHS in SWMM by using statistical quartiles analysis for rooftop area and rainfall frequency analysis, and classify zonal subregions for design of RWHS by using FCM cluster algorithm.
Step 1-2: Input the actual storm events to the constructed SWMM model to simulate the flooding and water level of the control points for different spatial RWHS designs and rain types.
Step 1-3: Convert the flooding amount into inundation loss and subtract the equipment cost to simulate the net benefit with various types of designs, and then obtain the best RWHS design of simulation method.
Step 2-1: Devise a suitable solution obtained from the simulation method as initial searching solution of the optimization method. Establish a water level simulation model for the urban drainage system that can substitute for U.S. EPA SWMM using time sequence data obtained from the simulation method with the BPNN. Then, the BPNN-based water level simulation model is embed into the defined optimization model which is composed of an objective function and constraints.
Step 2-2: Employ a tabu search algorithm to obtain the optimal solution of the optimization method, and then obtain the excellent spatial design of RWHS considering the urban flood reduction benefits.

2.2. Development of Simulation Model for Spatial Arrangement of Quantity and Capacity

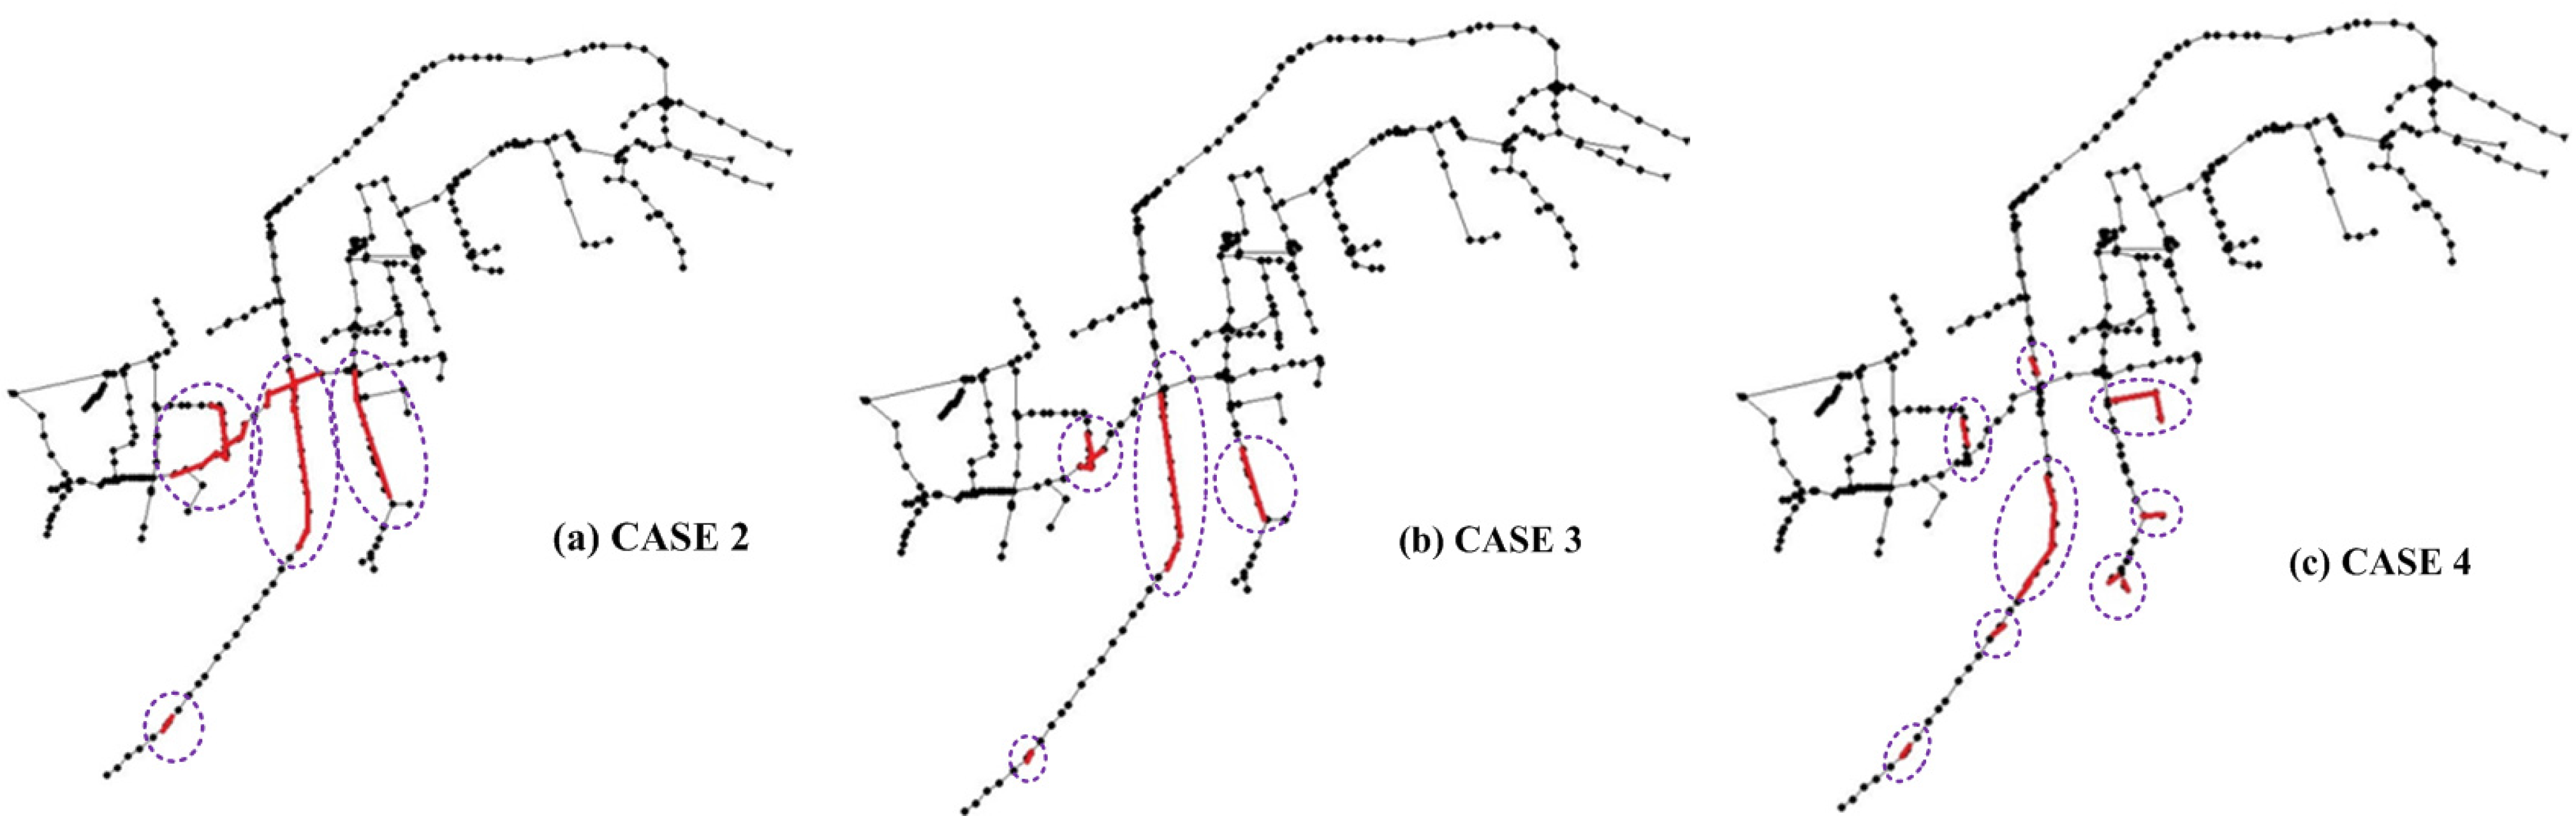
This study outlines various specifications for the rain barrel spatial distribution and quantity design approach and applies SWMM to simulate the burst pipes and flooding situation for each case in numerous rainstorm events. The regular spatial quantity and capacity arrangement of different types of RWHS are designed by using statistical quartiles analysis for rooftop area and rainfall frequency analysis, and the zonal subregions for design of RWHS are classified by using FCM cluster algorithm.Moreover, it estimates the economic net benefit. The design patterns for various cases involve (1) rain barrels distributed throughout the entire region; (2) concentration on the downstream of the flooding region; and (3) concentration on the upstream of the flooding region. The detailed developed methodology is described in the following.

2.2.1. Classified Methodology of Zonal Subregions for Design of Rainwater Harvesting System

In an urban drainage area, the spatial distribution of building rooftop area and terrain is highly divergent and complex. The available rooftop material for installing RWHS is the surface which directly receives the rainfall and provides water to the system. It can be a paved area like a terrace or courtyard of a building, or an unpaved area like a lawn or open ground. A roof made of reinforced cement concrete (RCC), galvanized iron or corrugated sheets can also be used for water harvesting. Besides, the efficiencies of actual water storage in an identical rainfall cluster can approximately reflect a specific range with fewer variations because of the similarity of rainfall intensity and duration [25], so the average precipitation is also devised as designed basis. In order to reduce unnecessary searching solution space and be convenient for effective urban planning, this study applies FCM cluster algorithm to classify the study area to characteristic zonal subregions. The building region with similar geophysical characteristic of rooftop area, terrain height and rainfall will be clustered into same subregions. The FCM algorithm [26] is one of the most widely used fuzzy clustering algorithms. The FCM algorithm attempts to partition a finite collection of n elements X = { x 1 , x 2 , ... , x n } ( x i is set as a vector of rooftop area, terrain height and average precipitation in this study) into a collection of fuzzy clusters with respect to some given criterion. Given a finite set of data, the algorithm returns a list of c cluster centers C = { c 1 , c 2 , ... , c c } and a partition weighting matrix W = w i j [ 0 , 1 ] ,   i = 1 , 2 , ... , n , j = 1 , 2 , ... , c , where each element w i , j tells the degree to which element x i belongs to cluster c j . The FCM aims to minimize an objective function ( J ) which is expressed as follows:
M i n J = i = 1 n j = 1 c w i j m x i c j 2 m R m 1
where partition weighting matrix ( w i j ) and cluster centers ( c j ) can be calculated using the following Equations:
w i j = 1 k = 1 c ( x i c j x i c k ) 2 m 1
c j = i = 1 n w i j m x i i = 1 n w i j m | 0 w i j 1 j = 1 c w i j = 1

2.2.2. Design Methodology of Capacity and Quantity of Regular Rainwater Harvesting Systems

In an urban drainage area, the design principle of RWHS for flood mitigation is to store storm rainwater as much as possible to maximize economic urban flood reduction benefits while the designed specification must be subject to the limitation of available building rooftop area. The designed parameters for RWHS include capacity (volume) and quantity (arranged density). This study invents an approach to generate a series of representative regular spatial capacity and quantity arrangements of RWHS. The volume of rain barrel ( S r ) is specialized as available design area ( A l ) multiplying to rainfall intensity of target desired stored precipitation of the specific return periods ( P T R P ^ ) (Equation (4)), in order to mitigate the heavy rains induced flood. The variable P T R P ^ can be evaluated by rainfall frequency analysis using the probability distribution of normal, log–normal, extreme-value type I, Pearson type III or log-Pearson type III (adopted by this study; Lee and Ho, 2008 [
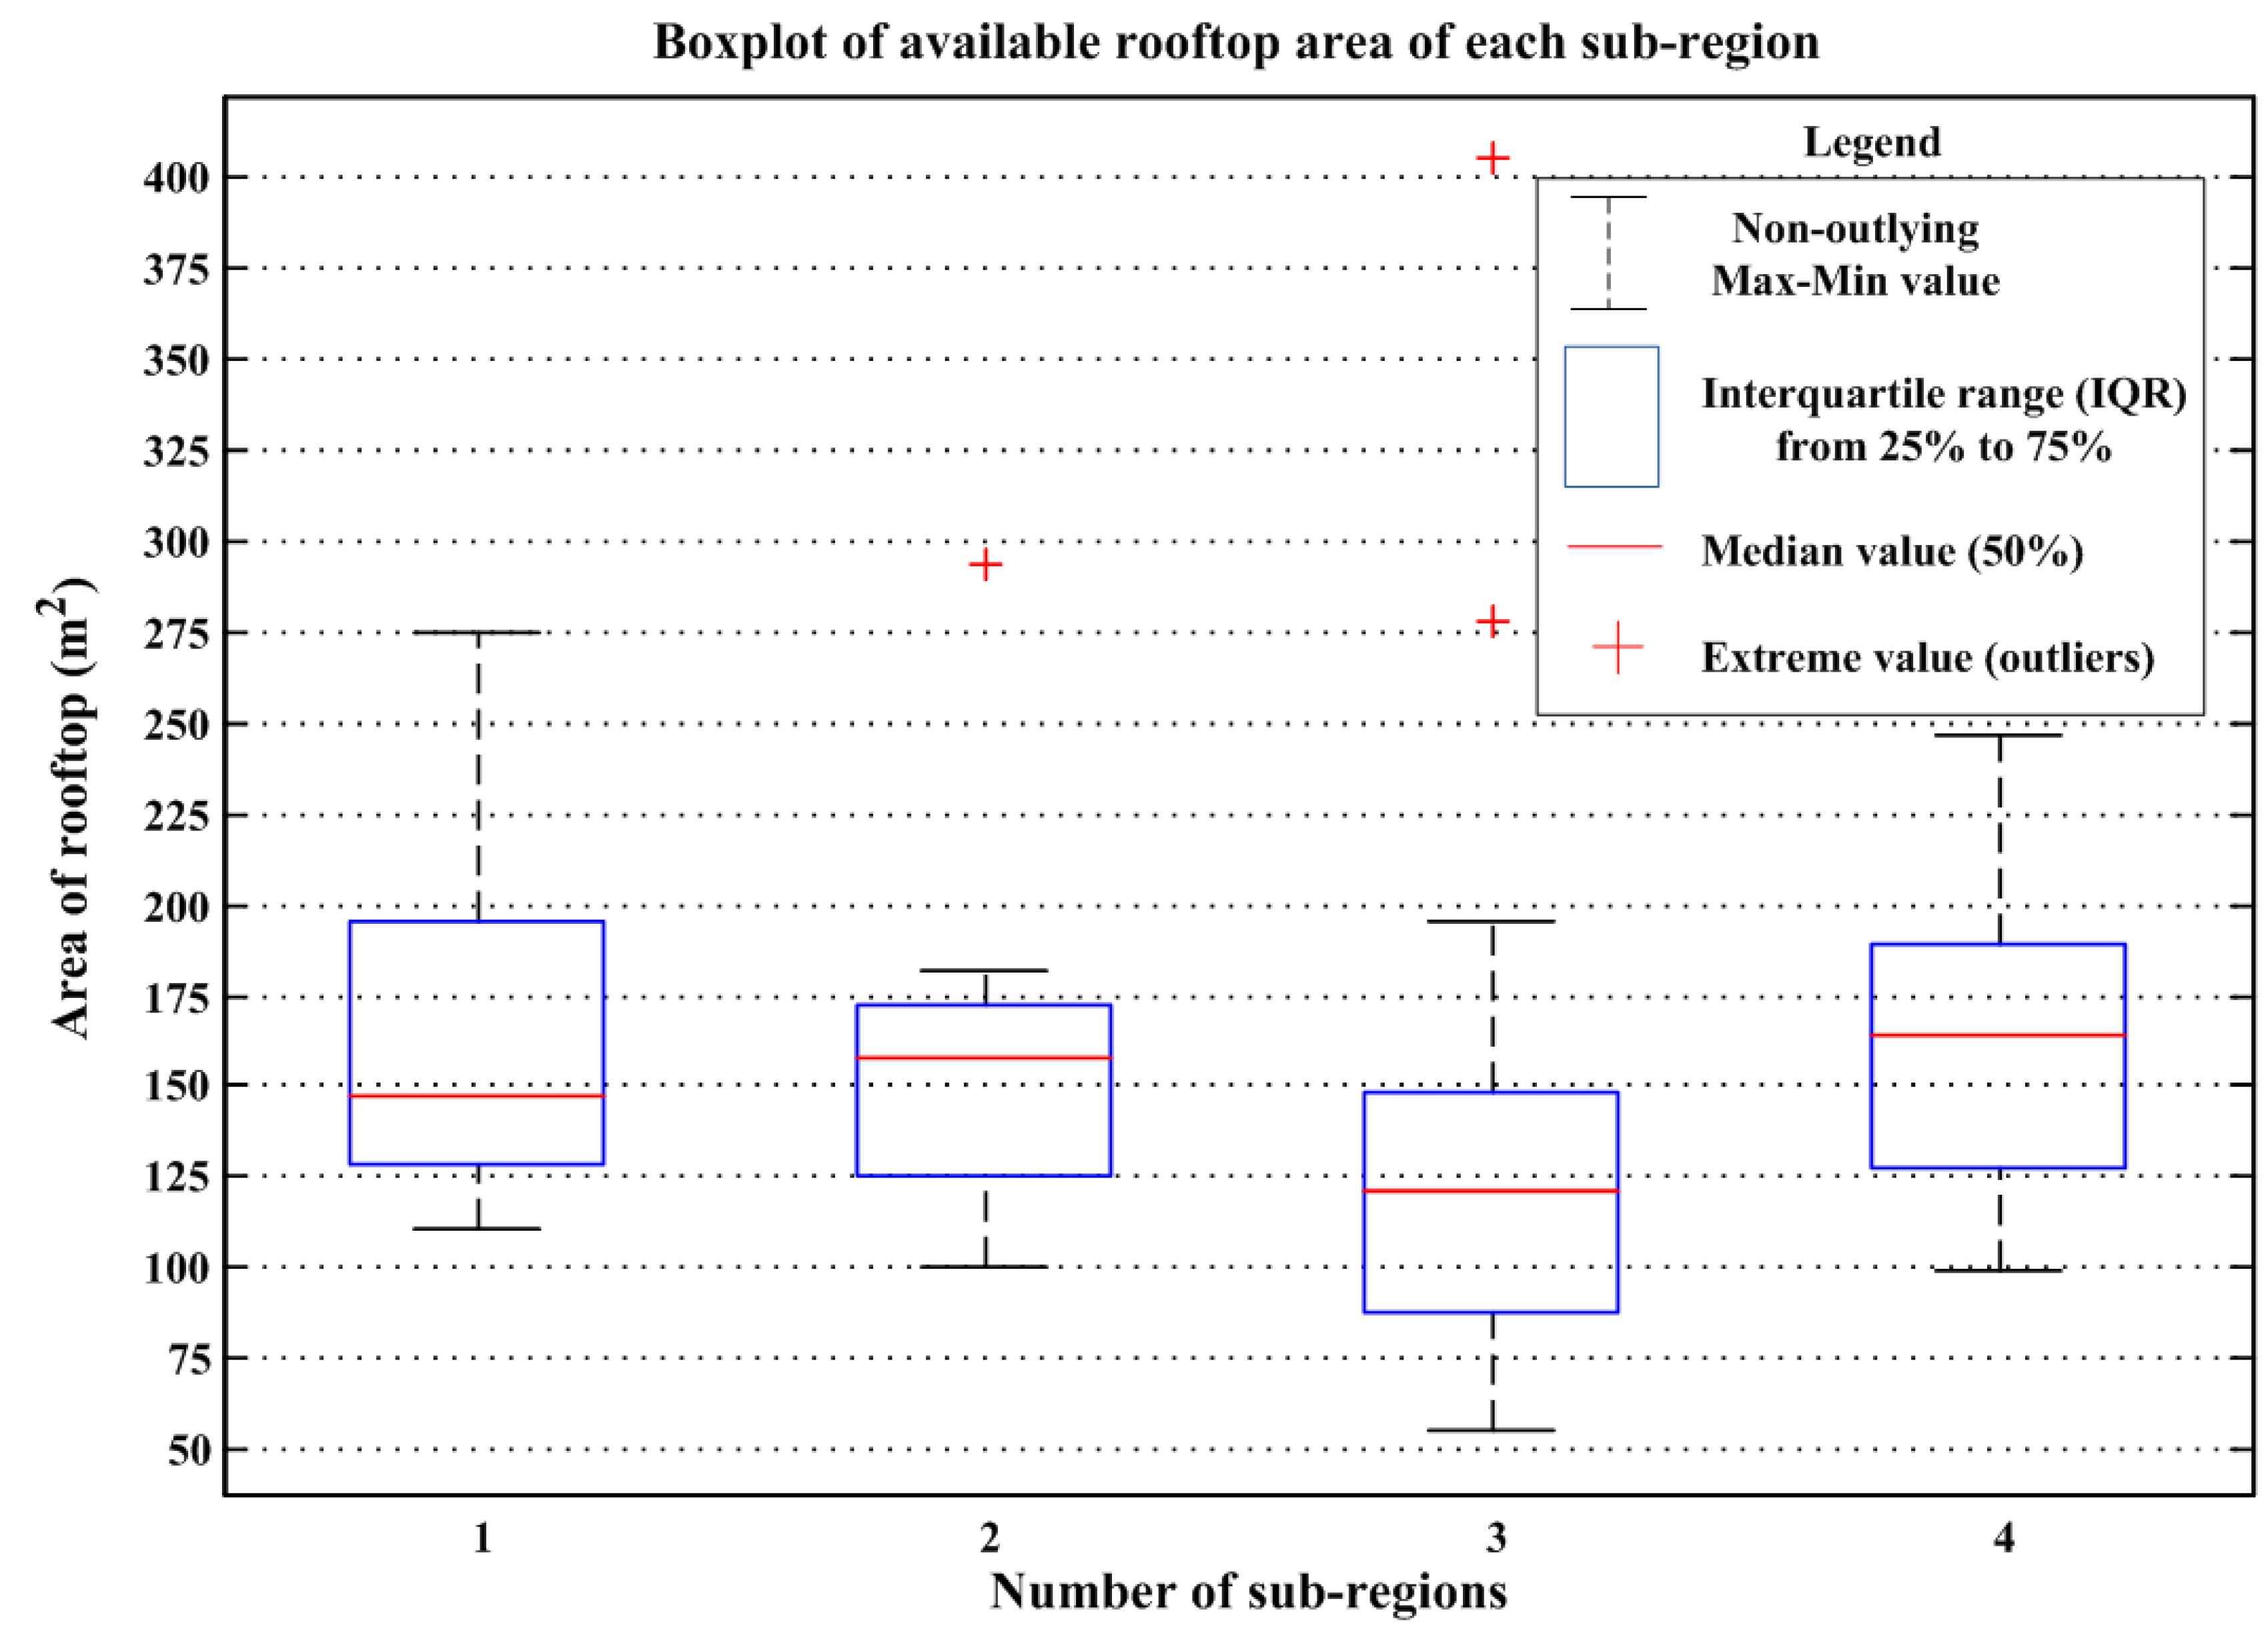
27]). In addition, the arranged density is set as how many areas arrange one rain barrel in SWMM. Hence, it is a key factor to determine the representational arranged area which can be subject to the lowest and highest limitation in practical urban buildings. This study applies statistical quartiles analysis with investigated spatial rooftop area to determine the representational arranged area (Equation (5)).
S r = [ A l P T R P ^ | T [ 1 , 2 , ... , D ] l [ 1 , 2 , ... , L ] ]
A l = [ M i n ( a r min ) , W A ( a r min ) , W A ( a r med ) , M i n ( a r q % ) , W A ( a r q % ) ]
where a r min , a r med , and a r q % are minimum, medium and q percentage of quartiles rooftop area on subregion r, respectively; and WA means weighted average.

2.2.3. Assessment Index of Designed Goodness

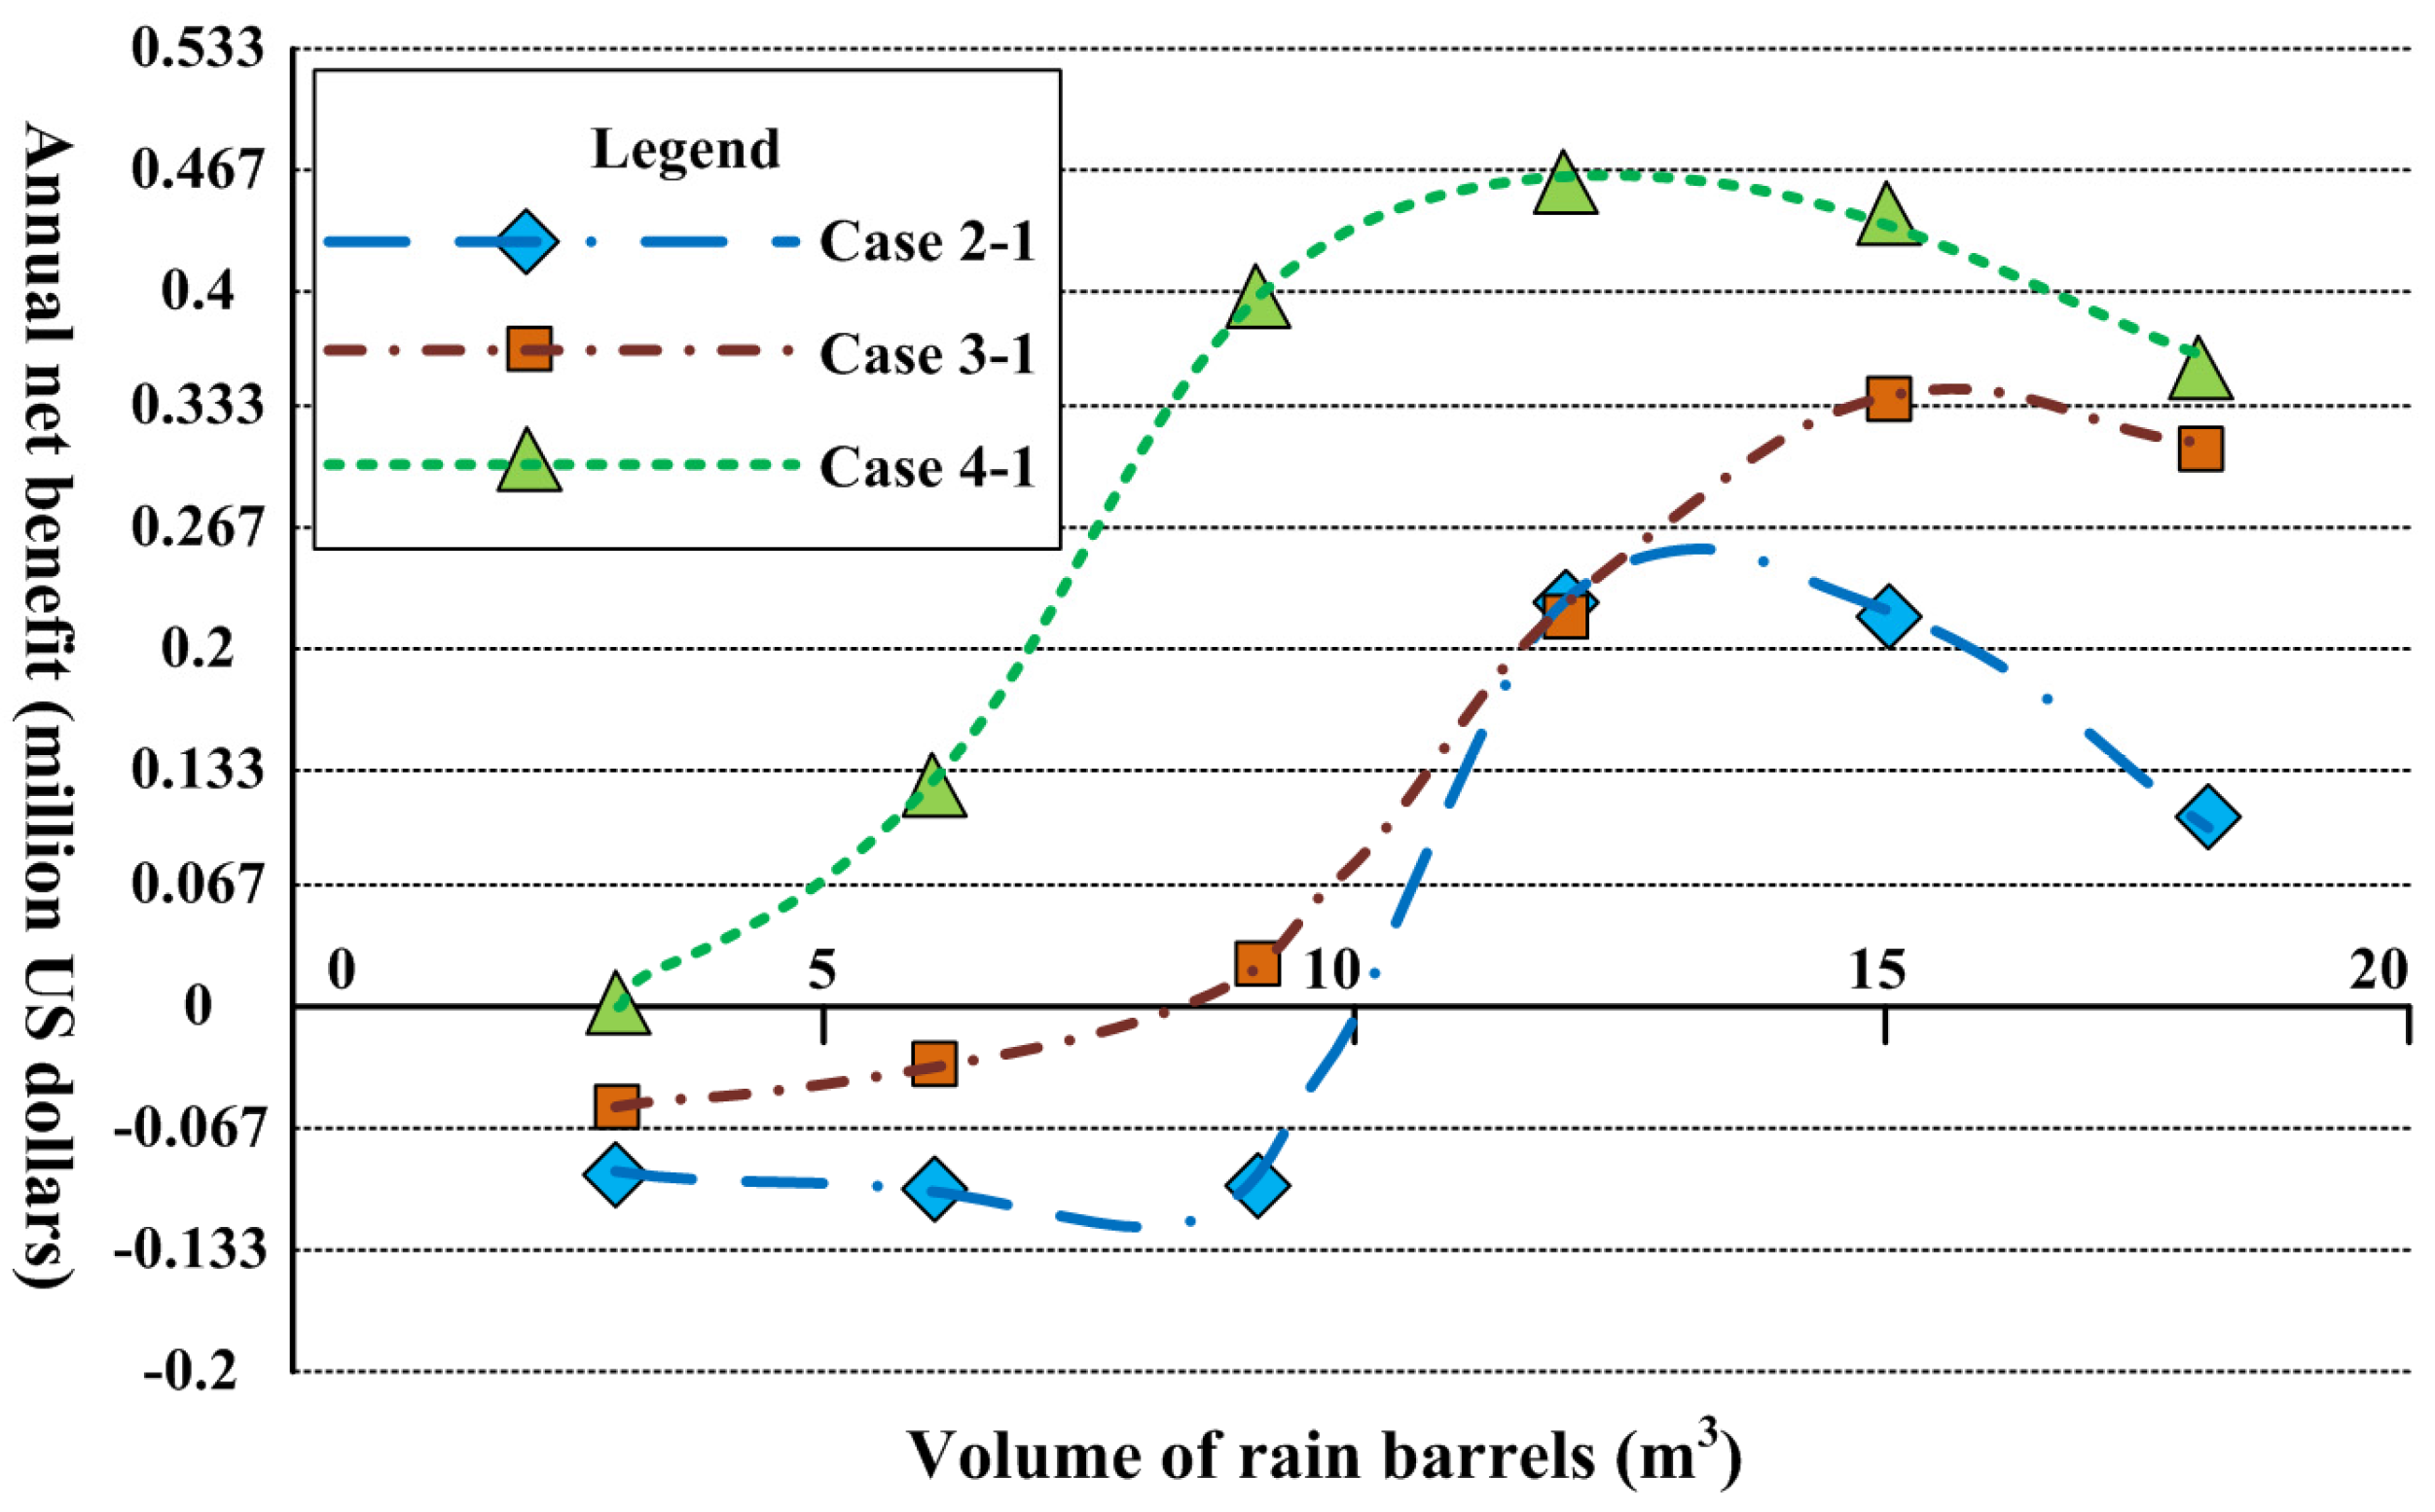
This study identifies the annual net benefit after establishing the RWHS as an indicator to evaluate the flooding reduction effect of different design approaches. The annual net benefit is the average annual flooding loss reduction minus the annual cost. This reduction is derived from the flooding loss without employing the RWHS design approach minus the flooding loss with employing it. The annual cost is the average annual setup cost of the RWHS.

2.2.4. Computation of Inundation Loss

In practice, the flooding loss is directly proportional to inundated depth which is directly proportional to total volume of burst pipes. SWMM can calculate the burst pipe amount (i.e., volume) in the manhole at each point in time through the simulation. Moreover, the spatial-temporal flooding scope and depth can also be calculated by the temporal-spatial burst pipe volume with the volume-depth-width relationship in the inundation region. The calculation of flooding loss can be divided into residential and commercial districts. Accordingly, we can calculate the flooding loss using the characteristic curve equation constructed by investigated data that the evaluated factor is total volume of burst pipes (use 2 term polynomial function as example):
[ L p non , L p RWHS ] = b 0 + b 1 [ F p total-non , F p total-RWHS ] + b 2 [ F p total-non , F p total-RWHS ] 2
[ F p total-non , F p total-RWHS ] = [ t = 1 T F p non ( t ) , t = 1 T F p RWHS ( t ) ]
where F p total-non and F p total-RWHS is the total volume of burst pipes in the flooded areas at control point p with no RWHS design and with RWHS design, respectively; and F p non ( t ) and F p RWHS ( t ) is the volume of burst pipes at moment t and control point p with no RWHS design and with RWHS design, respectively.

2.3. Introduction of SWMM

The United States Environmental Protection Agency (US EPA) SWMM model is a dynamic rainfall–runoff simulation model used for single-event to long-term (continuous) simulation of the surface/subsurface hydrology quantity and quality from primarily urban/suburban areas [21,22]. The hydrology component of SWMM operates on a collection of subcatchment areas with and without depression storage to predict runoff from precipitation, evaporation and infiltration losses from each of the subcatchment. In addition, the LID areas on the subcatchment can be modeled to reduce the impervious and pervious runoff. SWMM tracks the flow rate, flow depth, and water quality in each pipe and channel during a simulation period composed of multiple fixed or variable time steps. In the simulations, the runoff component of SWMM (RUNOFF) operates on a collection of subcatchment areas that receive precipitation and generate runoff. The routing portion of SWMM transports this runoff through a system of pipes, channels, storage/treatment devices, pumps, and regulators.

2.3.1. Model Parameters and Routing

The adopted model parameters for simulation in subcatchments are surface roughness, depression storage, slope, flow path length; for Infiltration, is Horton-based max/min rates and decay constant; and for Conduits, is Manning’s roughness. A study area can be divided into any number of individual subcatchments, each of which drains to a single point. The subcatchment width parameter is normally estimated by first estimating a representative length of overland flow, then dividing the subcatchment area by this length. Ideally this should be the length of sheet flow (<100 m), which is typically significantly slower than channelized flow.
The routing options of SWMM include steady flow routing, kinematic wave routing and dynamic wave routing. Dynamic wave routing solves the complete one-dimensional Saint-Venant flow equations and therefore produces the most theoretically accurate results. These equations consist of the continuity and momentum equations for conduits and a volume continuity equation at nodes. With this form of routing it is possible to represent pressurized flow when a closed conduit becomes full, such that flows can exceed the full normal flow value. The excess flow is either lost from the system or can pond atop the node and re-enter the drainage system. Dynamic wave routing can account for channel storage, backwater, entrance/exit losses, flow reversal, and pressurized flow, because it couples together the solution for both water levels at nodes and flow in conduits. Due to the capability and demand of this study, dynamic wave routing is applied for routing.

2.3.2. The Rainwater Harvesting Function within Low-impact Development Components

The LID function is integrated within the subcatchment component of SWMM and allows further refinement of the overflows, infiltration flow and evaporation in rain barrel, swales, permeable paving, green roof, rain garden, bioretention and infiltration trench. LID takes many forms but can generally be thought of as an effort to minimize or prevent concentrated flows of storm water leaving a site [28]. The RWHS is one of the LID techniques in SWMM, and the RWHS is assumed to consist of a given number of fixed-sized cisterns per 1000 ft2 (or 90 m2) of rooftop area captured.

2.4. Development of Optimization Model

In the developed optimization model of this study for the optimal spatial arrangement and capacity design of RWHS, the objective function is devised as the optimized annual net benefit. The constraints include the upper and lower limits of the rain barrel capacity and quantity, estimate equation of the rain barrel annual cost, equation converting the burst pipe volume into flooding loss, and BPNN drainage system simulation equation, among others.
This study generates data from the fully constructed SWMM combined with the simulation method. Furthermore, we utilize the BPNN model to substitute for US EPA SWMM to conform to newly considered interdisciplinary multi-objective optimization model and embed it into the optimization model. The purpose is to quickly and effectively produce optimal solutions with no limit of multi-embedded interdisciplinary simulation model. The formulaic descriptions of the optimization model are described below.

2.4.1. Objective Function

The objective function of RWHS optimization model is annual net benefit that is equal to the flooding loss deduction minus the facility cost of RWHS. The greater the value, the better it is; nevertheless, because the objective function aims to obtain the minimum value, we use the objective function to maximize the annual net benefit and obtain the minimum negative net benefit:
M i n Z = { [ L p non p = 1 P L p RWHS ( N r , S r ) | r [ 1 , 2 , ... , R ] ] r = 1 R [ T c ( S r ) × N r ] }
where T c is the cost of the RWHS, Nr is the number of rain barrels in subregion r, L non represents the flooding loss with no rain barrels established, and Lp is the flooding loss at control point p. In addition, Sr denotes the capacity of the rain barrel in subregion r, R is the quantity of the total subregion, and P represents the quantity at the flooding control point, wherein decision-making variables are the quantity of rain barrels in each Nr and Sr.

2.4.2. Constraints

(1) Quantity Constraints of Rain Barrels
To ensure that the quantity of rain barrels does not exceed the possible maximum quantity of each design subcatchment in each household that the quantity arrangement must meanwhile be subject to physical constraints, it is necessary to define the upper and lower limits of the quantity of rain barrels. The constraints can be expressed as:
0 N r N r max
where N r max is the maximum quantity of rain barrels in subregion r.
(2) Capacity Constraints of Rain Barrels
To ensure that the capacity of rain barrels aligns with the physical size limitations without exceeding the upper and lower limits of the rain barrel design, we set the constraints as:
0 S r S r max
where S r max represents the maximum capacity of rain barrels in subregion r that can be estimated by investigated available rooftop design area multiplying to rainfall intensity of target desired stored precipitation of the set maximum possible return periods (Section 2.2.2).
(3) Annual cost function of rainwater harvesting systems
In this study, the RWHS cost calculation employs the cost equation proposed by Liaw and Tsai (2004) [1], which was obtained through market research and analysis. This annual cost equation can be described as:
T c ( C a A r ) = a + b C a 2 + c A r
where T c ( C a A r ) is the cost of RWHS, and function of the capacity C a (m3) and the roof area A r (m2).
(4) Equation for Transferring Flooding to Inundation Loss
In this study, flooding loss is converted from the total volume of burst pipes with a relationship characteristic curve equation (Equations (6) and (7)).
(5) Routing Equation of Drainage System
The water level calculation of the drainage system uses BPNN to construct an alternative simulation model. The routing equation at each control point can be described as:
H p ( t ) = f ( n e t j i ( t ) )
where H p ( t ) is the water level of the drainage system at control point p at time t; and f is the activation function. The accumulated weight value of the n 1-th layer output value n e t j i ( t ) is calculated by:
n e t j i ( t ) = i w i j n y i n 1 ( t ) b j n
where w i j n represents the connection weights of the n-th layer j-th neuron and n − 1-th layer i-th neuron. In addition, b j n denotes the bias weights of the n-th layer j-th neuron. y i n 1 ( t ) is the input variable of the model, which includes the precipitation, water level, and capacity and quantity of rain barrels in each subregion.

2.4.3. Solution of Optimization Model

We employ tabu search to select the optimal solution for the spatial arrangement and capacity design of RWHS under consideration of the benefits of urban flood reduction. Tabu search is widely applied to management and planning issues; it can efficiently identify nonlinear or optimal solutions. Furthermore, it can be easily combined with the optimization model, and it quickly and automatically selects the best solution for the decision-making variables. Besides, the decision variables of this study include zonal capacity and quantity of RWHS, and the quantity must be a natural number. A most important advantage of tabu search is that the searching moving distance can be set as integer, so this study selects tabu search as an optimization algorithm.
(1) Tabu Search
Proposed by Glover (1986) [23] and Glover and Laguna (1997) [24], tabu search guides the search direction and region using different types of memory. During the search, a search direction or region can be favored or prohibited according to the memory and rules. Additionally, the search can exit a local optimum region and avoid repeated searches through the definition of a tabu list, which includes the type and length of the search variables and associated objective function values. In each iteration, it only searches to find the best candidate solution. Hence, this search mechanism can significantly improve the search efficiency and accuracy and obtain the best global solution.
(2) Optimizing the Spatial Design of Quantity and Capacity by Tabu Search
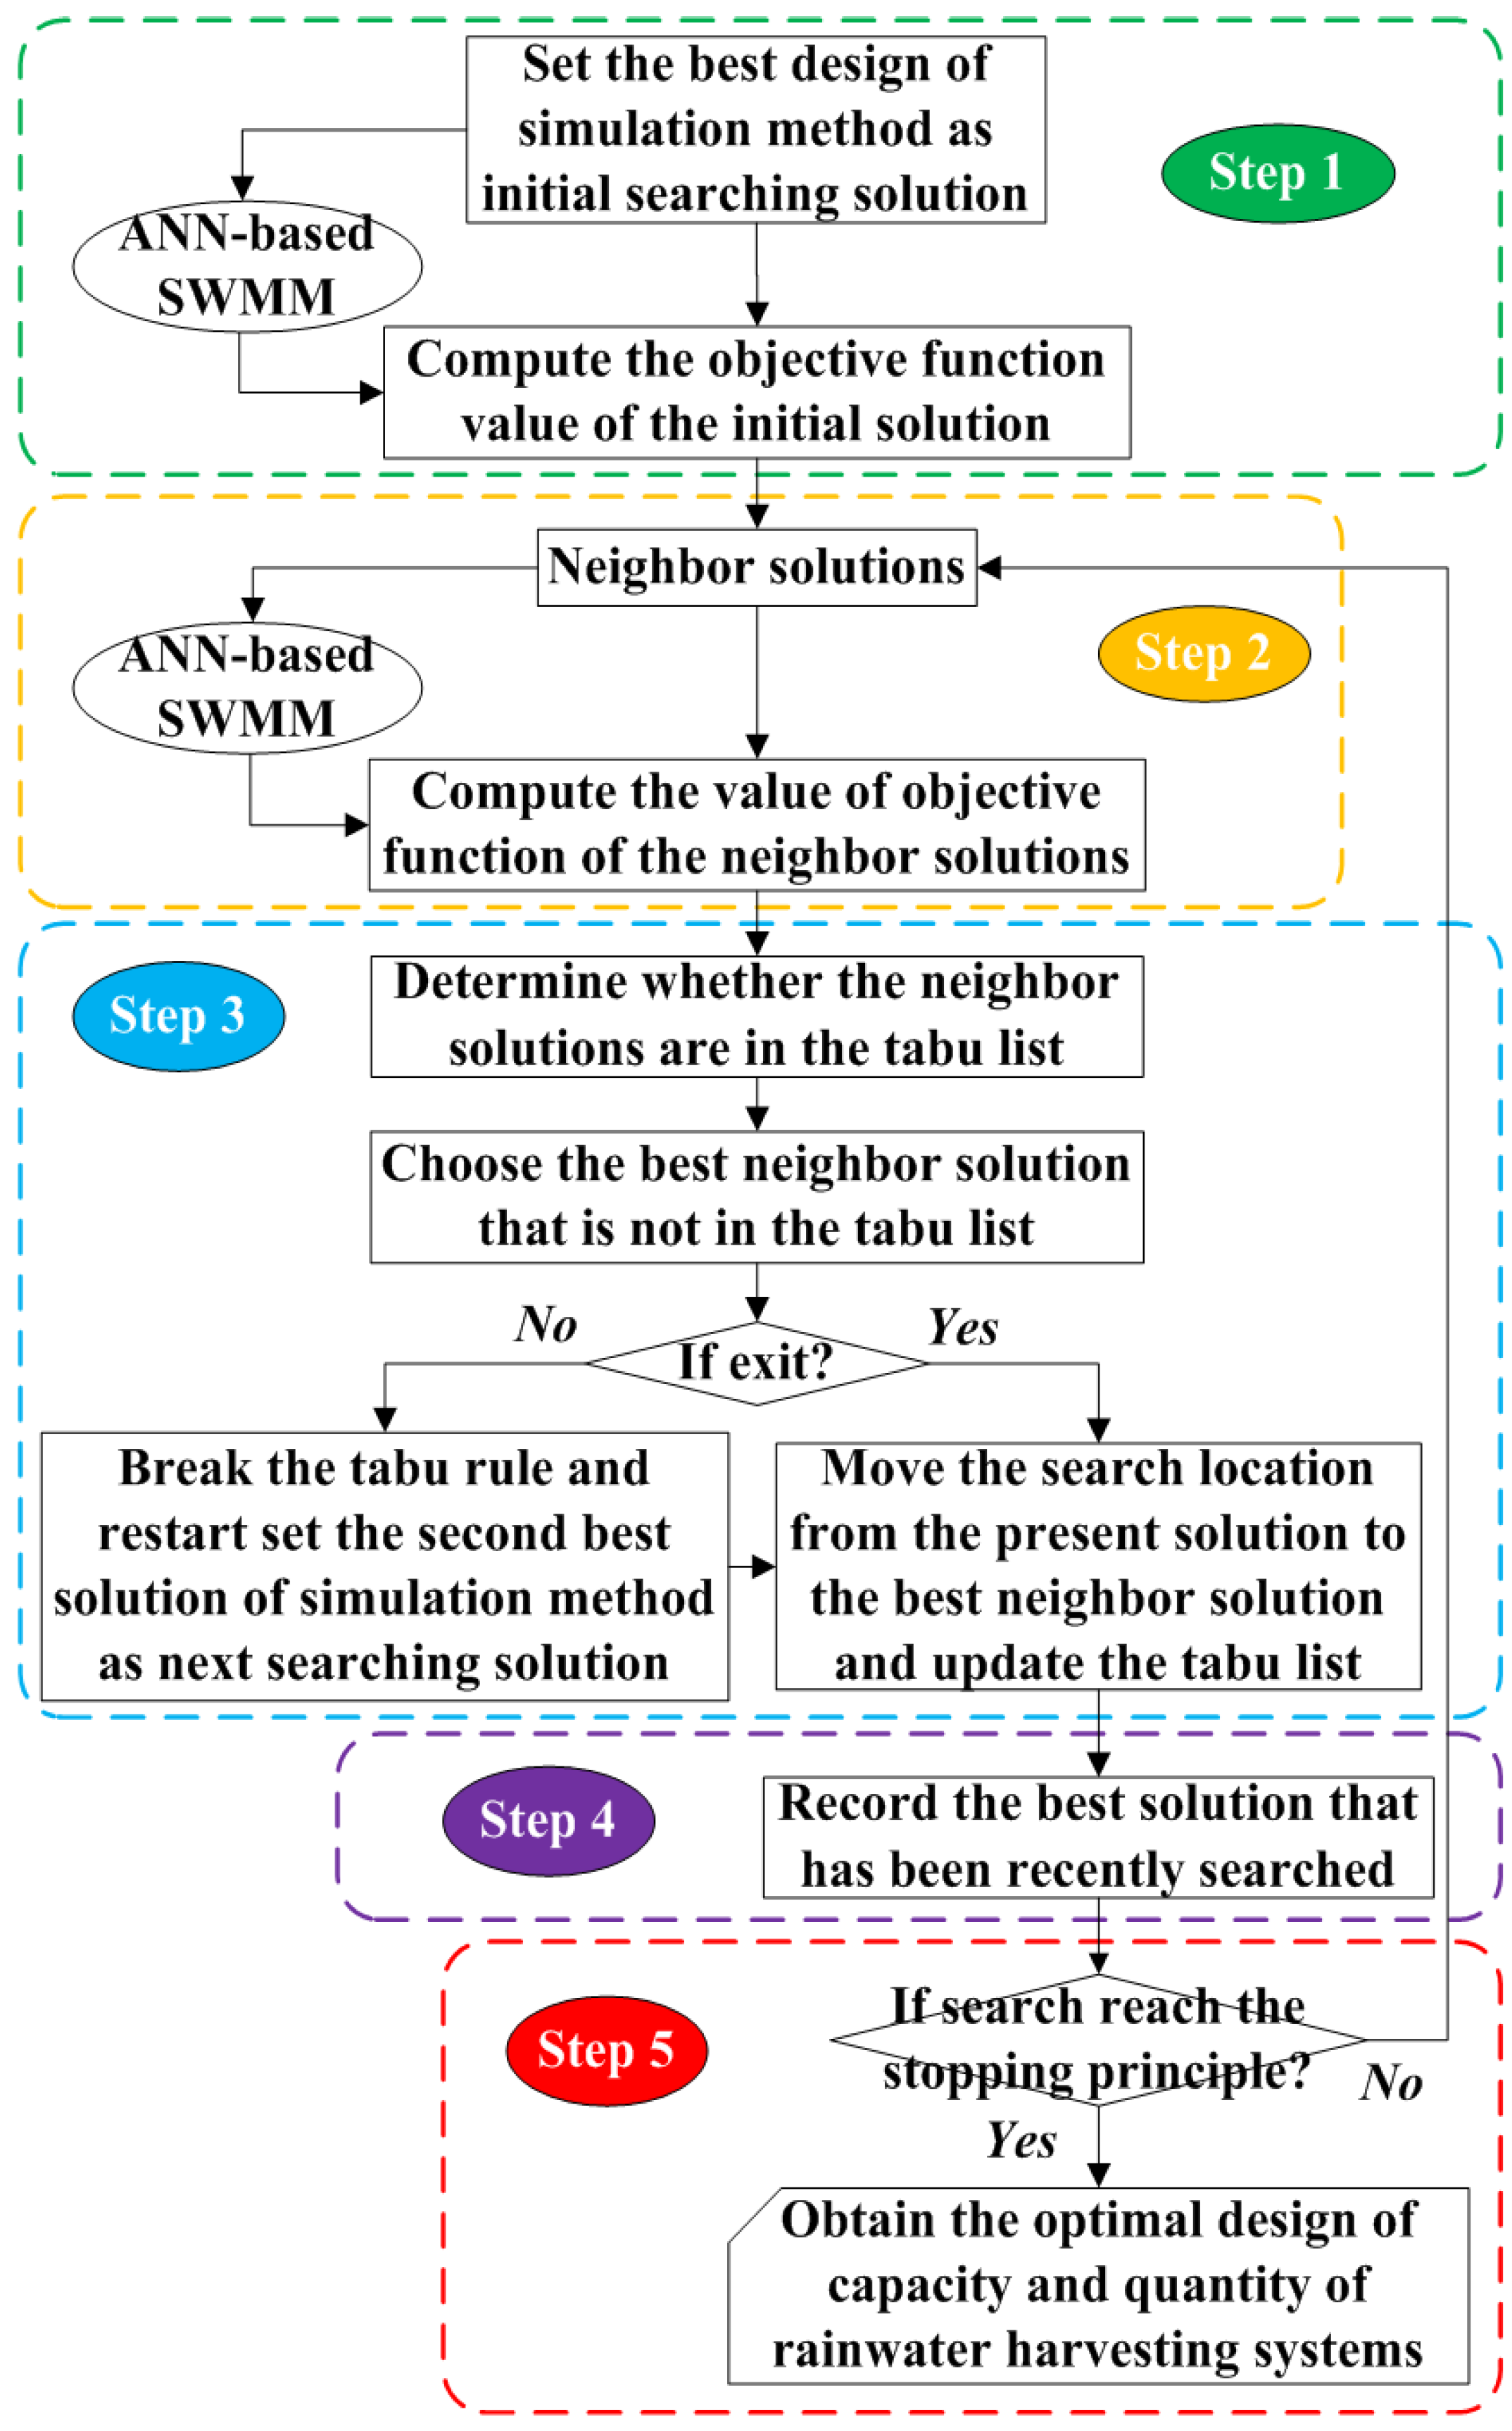
We use tabu search to select the optimal rain barrel spatial arrangement and capacity design in each flood event; its flowchart is shown in Figure 2. The selection method sets the decision-making variables in the optimization model—i.e., the quantity and capacity of the rain barrels in each region—as the tabu search solution. The steps are described below.
Figure 2. Flowchart of optimizing the spatial design of capacity and quantity of rainwater harvesting systems using tabu search
Water 07 05173 g002
Step 1: Set the initial searching solution of tabu search (the best solution in the simulation method), input the alternative BPNN model, and calculate the objective function value of the optimization model; i.e., the annual net benefit of the design pattern.
Step 2: Calculate the objective function value of the neighboring solution and choose the best neighboring solution.
Step 3: Check if the best neighboring solution is in the tabu list. If a best solution has already been searched, select the second best neighboring solution; if a best solution has not yet been searched, move the search location from the present solution to the best neighbor solution. After moving, update the tabu list.
Step 4: To record the optimal solutions identified thus far, apply the elite strategy to compare the best searching solution in this iteration with the optimal solution prior to the search.
Step 5: After the search principles stop working, the optimal spatial arrangement and capacity design approach for rain barrels can be obtained for the whole event.

2.5. Development of BPNN-Based SWMM

2.5.1. Model Structure of BPNN-based SWMM

This study develops a novel alternative BPNN-based simulation model to substitute for US EPA SWMM and embed it into the optimization model for the fast, accurate and automated optimizing process. Any newly considered interdisciplinary multi-objective optimization model, embedded simulation model and optimizing algorithm can be involved and integrated. Chang et al. (2010) [29] developed a two-stage procedure underlying the clustering-based hybrid inundation model, which is composed of linear regression models and ANNs (artificial neural networks) to build a 1-h-ahead regional flood inundation forecasting model. However, regarding to the study of modeling long lead-time continuous unsteady inundation level of an urban drainage system using ANNs still have not been researched. The inputs of BPNN-based alternative model include the boundary condition, initial condition and simulated target that must be entered in SWMM (e.g., precipitation, the LID design approach and water level of drainage system). Because the aim of this study is to determine flooding loss, the flooding and water pipe level are included in the input item. In addition, to obtain the best design approach for rain barrel spatial arrangement and capacity, we include the quantity and capacity of the rain barrels in the input item and set the water level/flooding at t + 1 moment as the output item. Besides, the success of BPNN-based simulation approach is mostly dependent on construction data (including training and validation part), which means data should be representative well enough in order to construct the input-output relation. In order to achieve this goal, this study develops a retrieving method of representative construction data using statistical quartiles analysis for rooftop area and rainfall frequency analysis (Section 2.2.2).
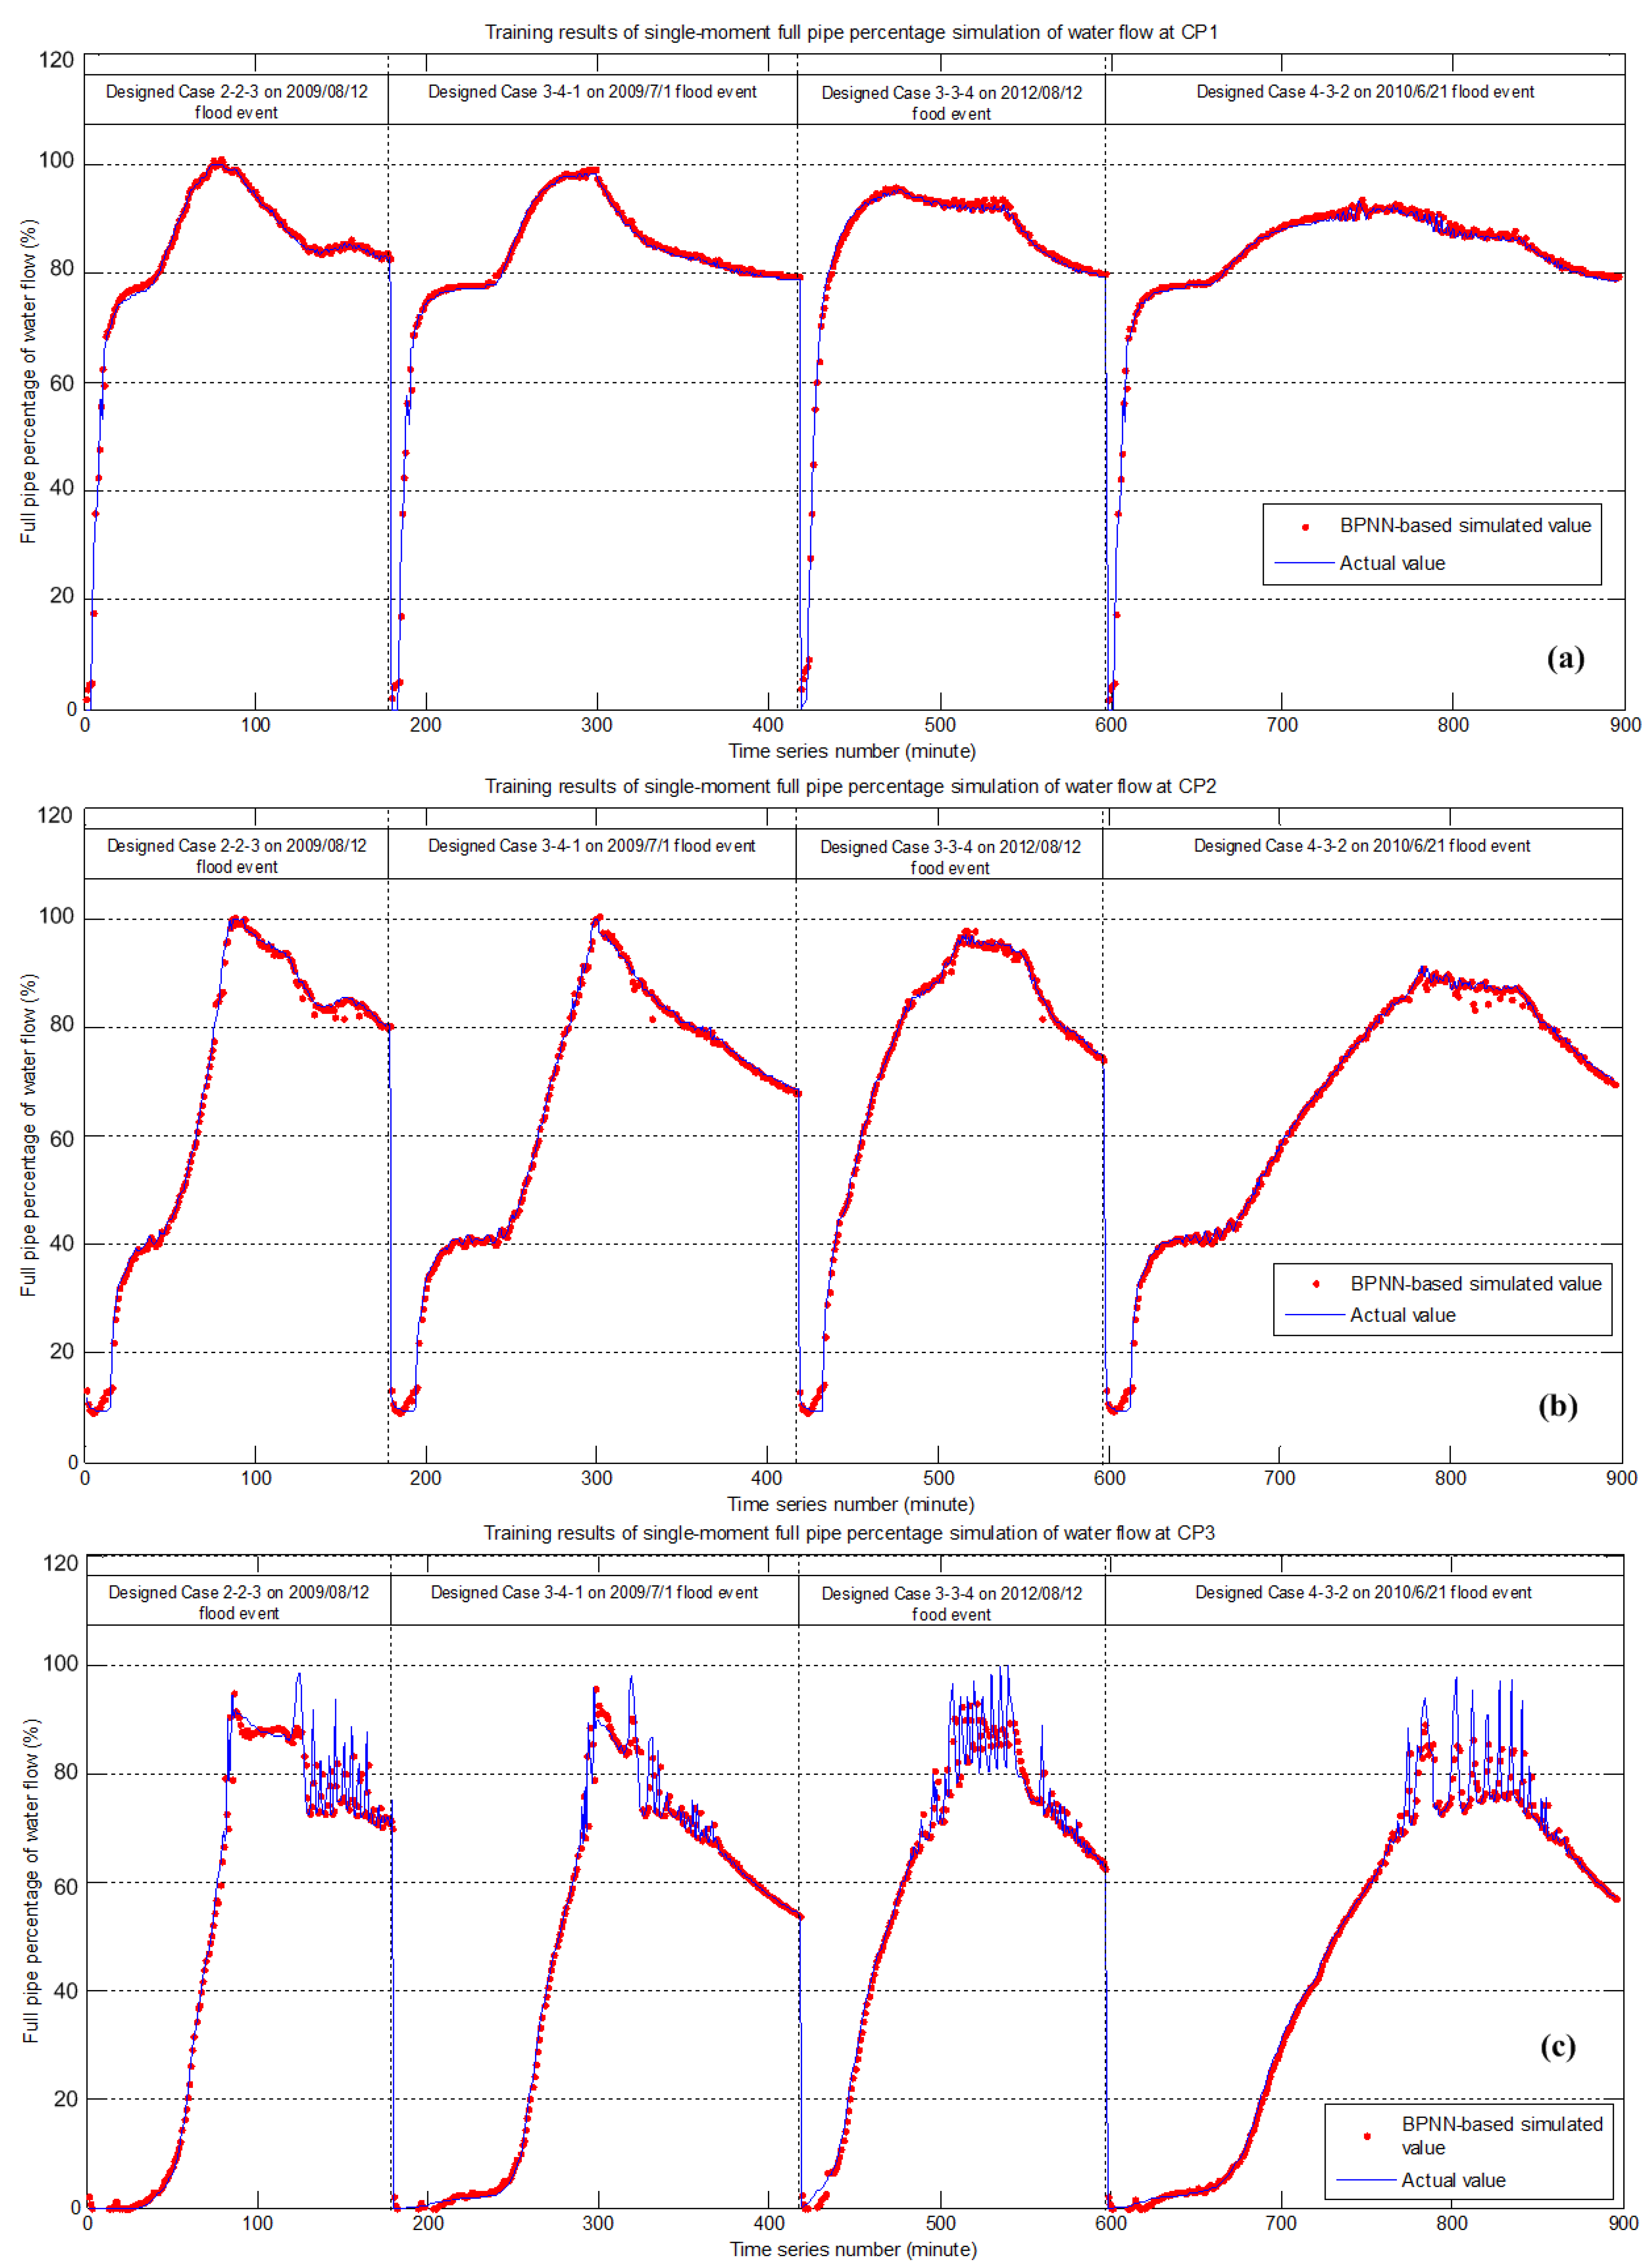
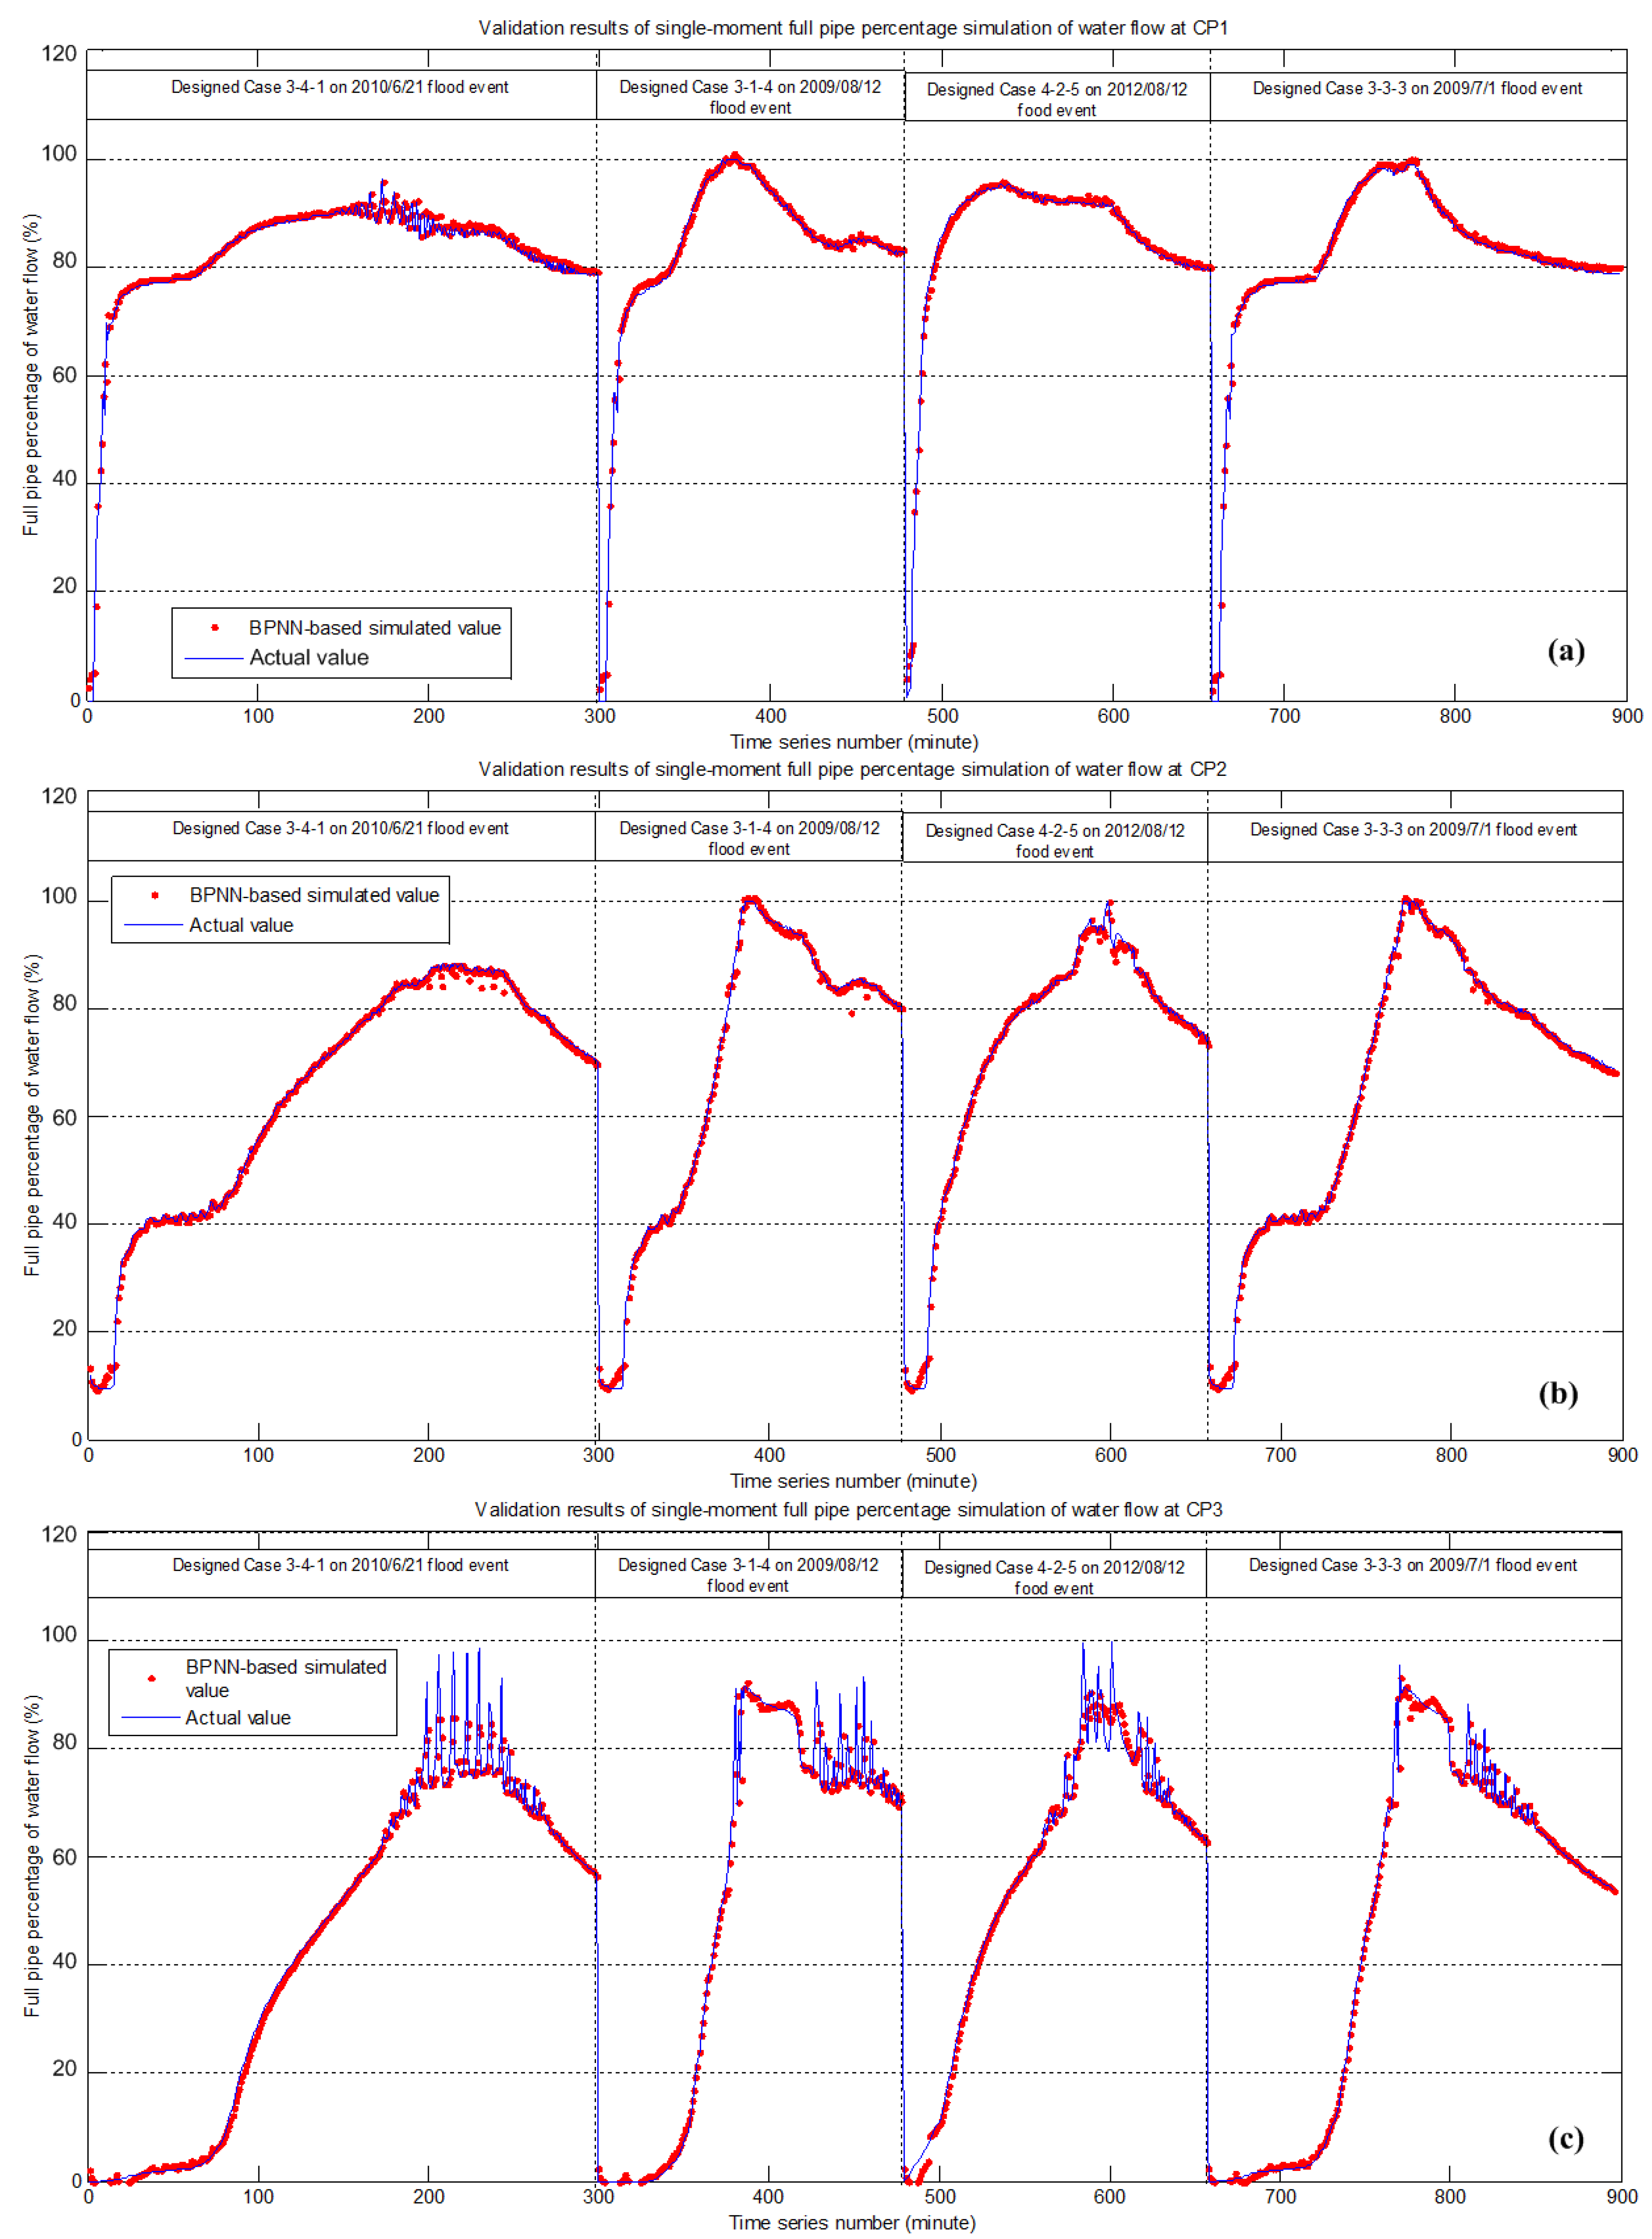
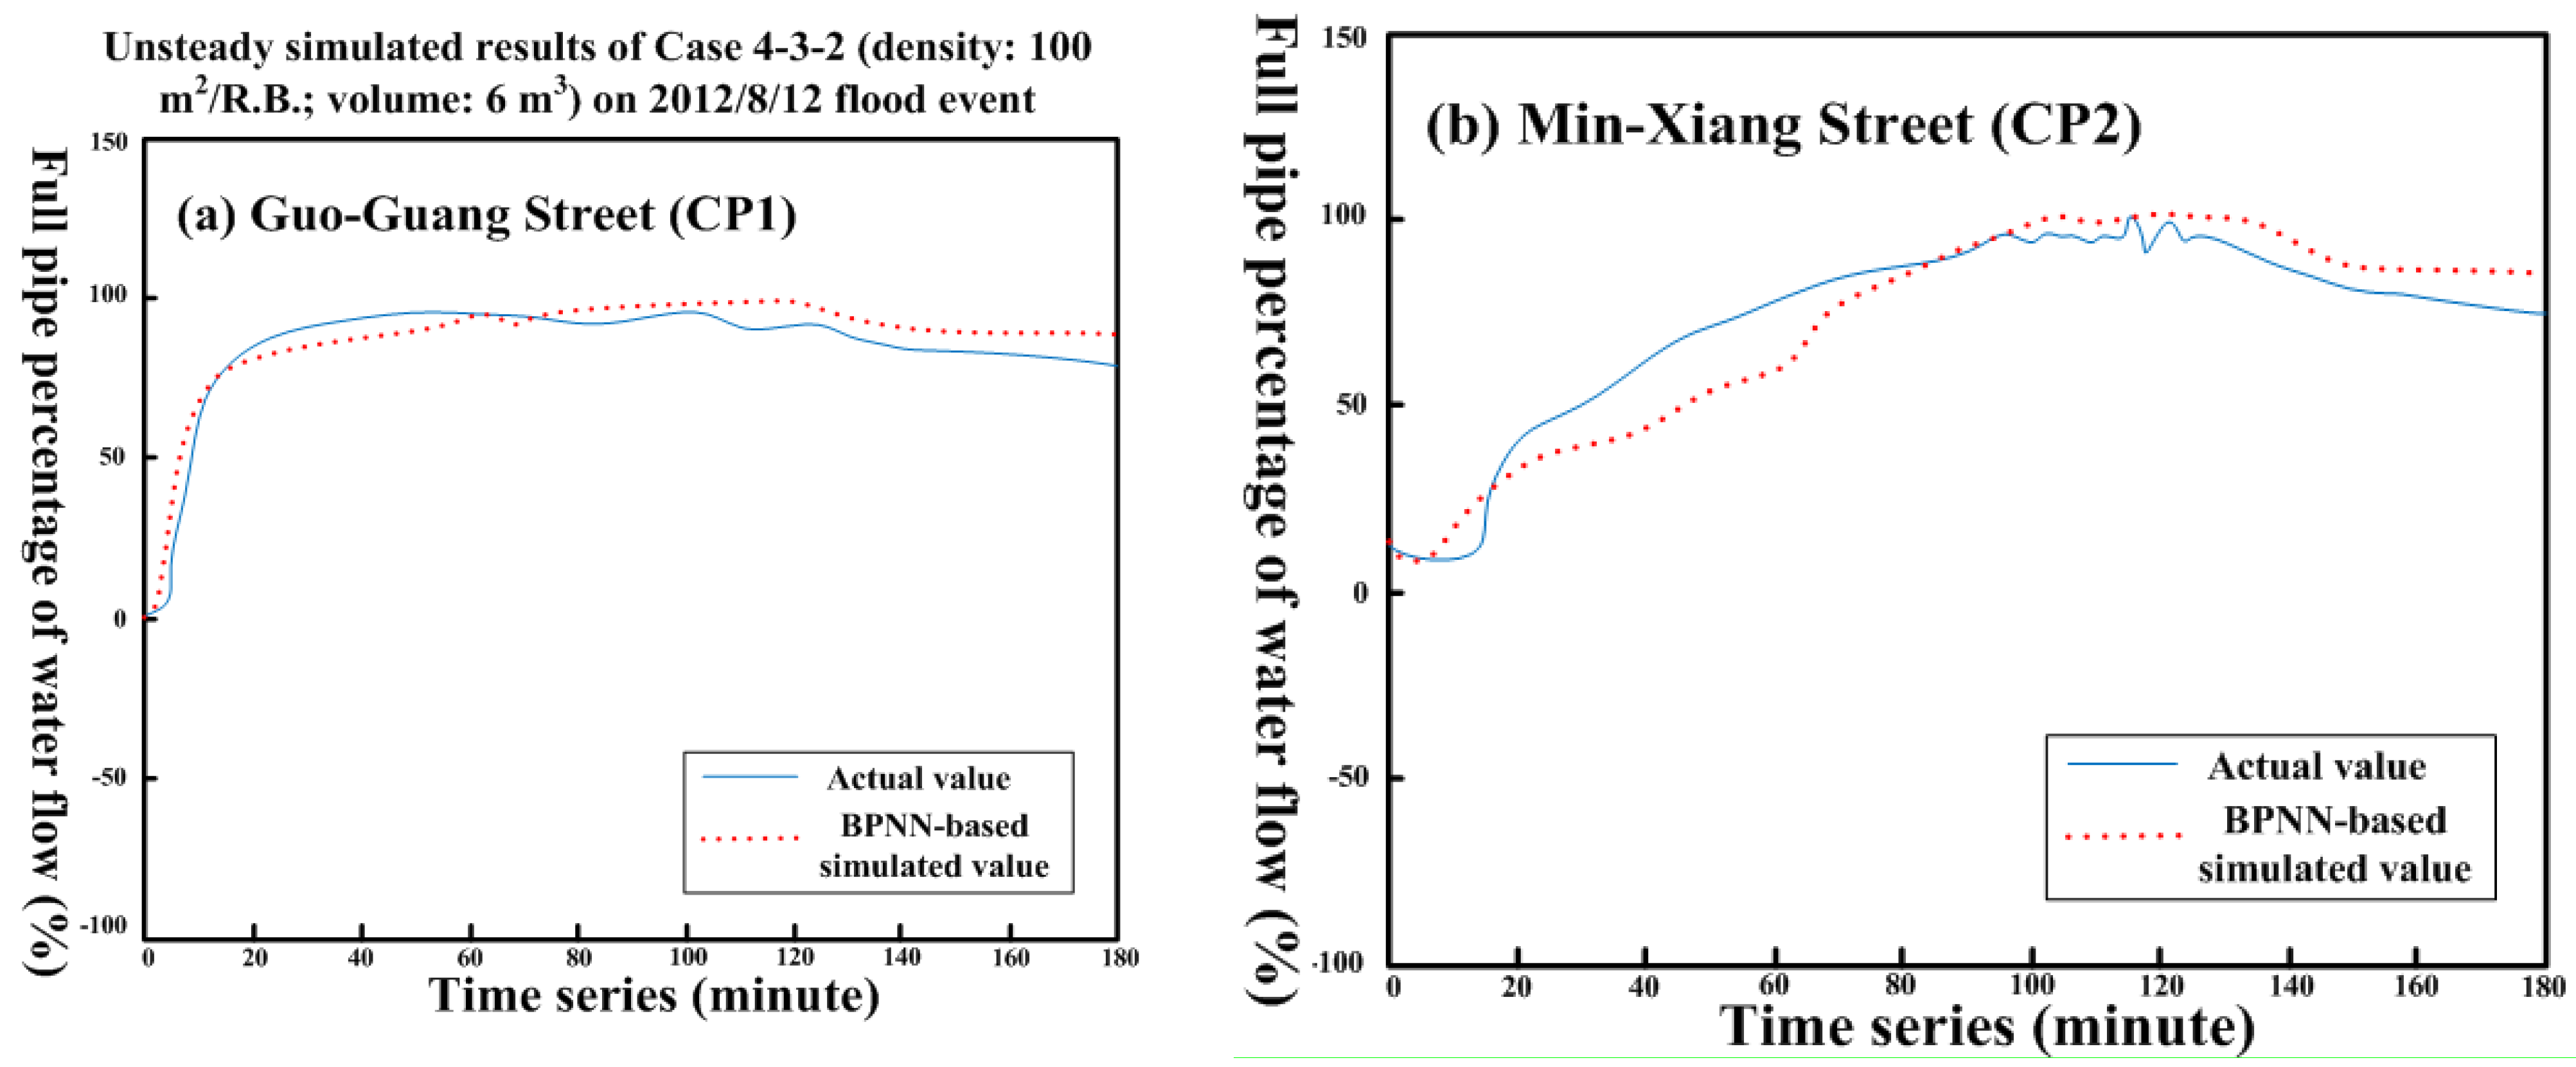
The BPNN-based drainage system water level simulation model is constructed in three parts: a single-moment training, single-moment validation, and complete-event simulation and verification. The single-moment simulation training and verification is primarily the calculation mechanism of the SWMM steady simulation. The complete-event simulation and verification adds the single-moment calculation units and provides feasibility verification for the unsteady simulation. In the complete-event simulation, we require a boundary condition at the start time (t0), the meteorological-hydrological condition, and the spatial design pattern of the RWHS. We enter the trained BPNN single-moment calculation units and then obtain the simulation value at t + 1 from the output item. Accordingly, the cycle of continuous iterative calculations is repeated until the end of the moments, when the complete-event flooding and water levels of the drainage system can be simulated.
The BPNN was developed by Rosenblatt (1958) [19] and Rumelhart and McClelland (1986) [20]. Constructed by the multilayer perceptron, it belongs to a multilayer feedforward network and handles the nonlinear relationship between the input and output by a supervisual learning approach. The commonly used BPNN is a three-tier structure neural network, which includes an input layer, a hidden layer, and an output layer. The input value of the neurons connected by associated weights between different layers in the network is directly transferred into the hidden layer. Then, after the weighted accumulation ( f ), we obtain an output value and pass it onto the output layer following the same rule. The output value ( y j n ) of number j of the n-th layer is the conversion function value of the n – 1 layer neuron output value, which is shown as follows:
y j n = f ( n e t j n )
The weight-accumulated value of the output value of the n − 1 layer n e t j n is shown as follows:
n e t j n = i w j i n y i n 1 b j n
In this study, the hidden layer adopts the tan-sigmoid (Equation (16)) as the transfer function, while the output layer is linear. BPNN utilizes the gradient steepest descent method to calculate and adjust the network weight and bias values. This is accomplished to minimize the error of the output value and actual target value for obtaining a calculation mode of precise learning.
y j = e n e t j e n e t j e n e t j + e n e t j

2.5.2. Alternative Applicability Assessing Index of BPNN-based SWMM

To assess if the developed BPNN-based SWMM is capable to be the alternative model of operating interface-restricted SWMM, this study adopts the mean absolute error (MAE) and coefficient of correlation (CC) as alternative applicability index, which are described below.
(1) MAE
M A E = i = 1 n | Y sim BPNN ( t ) Y target SWMM ( t ) | n
where Y sim BPNN ( t ) is the simulation value of BPNN-based SWMM at time t, Y target SWMM ( t ) is the target value to substitute US EPA SWMM, and n is the number of data. A smaller MAE indicates that the alternative applicability of the BPNN-based SWMM is better than the other BPNN-based models.
(2) CC
C C = n Y sim BPNN ( t ) Y target SWMM ( t ) Y sim BPNN ( t ) Y target SWMM ( t ) ( Y sim BPNN ( t ) ) 2 ( Y sim BPNN ( t ) ) 2 n ( Y target SWMM ( t ) ) 2 ( Y target SWMM ( t ) ) 2 n
A larger CC indicates that the variation trend between the simulation value of BPNN-based SWMM and US EPA SWMM is closer that represents the developed BPNN-based SWMM is more suitable to be the alternative model of US EPA SWMM than the other BPNN-based models.

3. Application

3.1. Study Area

The Zhong-He District is an area of 20.29 km2 located in the southwest corner of the Taipei Basin. Its southern end has a high altitude and gradually lowers northward. In some areas, the Zhong-He District has extreme slope changes, which can lead to floods because of the locations of these changes at the intersections of mountainous terrain and the ground. Other areas are also vulnerable to flooding on account of their more gentle terrains or insufficient drainage capacities. Examples include the area near Jyu-Guang Road and Min-Siang Street, shown in Figure 3a; control point 1 (CP1), Guo-Guang Street; control point 2 (CP2), Min-Siang Street; and control point 3 (CP3), Jyu-Guang Road. These latter three locations are low lying such that the terrain height diagram can be shown in Figure 3b. It is, therefore, relatively difficult for the water to drain from these areas, causing flooding and life and property loss from rainstorms. Thus, these locations are set as control points for the flood damage assessment.
Figure 3. Study area: (a) spatial distribution of drainage system, zonal subregions for design of rainwater harvesting system using the fuzzy C-means cluster algorithm and the low-lying control points; (b) terrain height above sea level.
Water 07 05173 g003

3.2. Analyzed Results of the Simulation Model for Spatial Design of Quantity and Capacity

3.2.1. Classified Results of Zonal Subregions for Design of RWHS

This study applies FCM cluster algorithm with practical investigated rooftop area data to classify the study area to characteristic zonal subregions. In order to choose a most economic mode of zonal subregions, this study precedes sensitivity analysis to different number of clusters for the distance of central locations. The distance of each two central locations for clustering central number 3 ranges from 547 m2 to 722 m2; distance for clustering number 4, ranges from 547 m2 to 1075 m2; distance for clustering number 5, ranges from 391 m2 to 1117 m2; and distance for clustering number 6, ranges from 375 m2 to 1134 m2. The average distance between each combination of two central locations for clustering number 3 to 6 are 656 m2, 714 m2, 673 m2 and 685 m2, respectively. Hence, clustering number 4 can cover wider designed area than the other clustering numbers with most efficient zonal mode.
After setting the clustering center number as 4 and calculating using FCM cluster algorithm, the catchment range of zonal subregions (Figure 3a). The four center coordinates (TM2 X, TM2 Y) are Region 1 (296565, 2765681), Region 2 (297360, 2764958), Region 3 (296860, 2765182) and Region 4 (297247, 2765702), respectively. The number of available building roof for arranging rain barrel of Region 1 is 440 which is mostly composed of schools and residences; number of available roof of Region 2 is 385, composed of parks and commercial buildings; number of Region 3 is 943, composed of community high buildings and housing; and number of Region 4 is 728, composed of industrial buildings and residences.

3.2.2. Spatial Designed Results of Specific Representative Regular RWHS

(1) Capacity and Quantity
The designed parameters for RWHS include capacity (volume) and quantity (arranged density: how many areas ( A l ) arrange one rain barrel). This study designs representative regular specification of RWHS by using statistical quartiles analysis (to estimate representative A l ) and rainfall frequency analysis (to estimate representative P T R P ^ ). The statistical quartiles analysis results of available rooftop area of each subregion on Zhong-He drainage area is shown in Figure 4. This study adopts M i n ( a r min ) , W A ( a r min ) , W A ( a r 25 % ) and W A ( a r med ) among four subregions (r = 1–4) that the values are 55.0 m2 (A1), 82.4 m2 (A2), 108.5 m2 (A3) and 152.0 m2 (A4), respectively, to ensure all designs of volume and arranged density can actually be applied to the building of Zhong-He drainage area. The adopted return period (T) of P T R P ^ are 2, 5, 25, 50 and 100 years, and the designed rainfall duration is 6 hours. Finally, the designed regular volume of rain barrel are A 1 P 2 year R P ^ , A 2 P 5 year R P ^ , A 2 P 50year R P ^ , A 3 P 50year R P ^ , A 4 P 25year R P ^ and A 4 P 100 year R P ^ that the values are 3.03 m3 (S1), 6.14 m3 (S2), 9.12 m3 (S3), 12.01 m3 (S4), 15.05 m3 (S5) and 18.05 m3 (S6), respectively, to ensure that the designed volume can handle all kinds magnitude of storm rainwater of return periods.
Figure 4. Boxplot of available rooftop area of each subregion in the study area.
Water 07 05173 g004
(2) Spatial Arrangement of Designed Cases
There were 284 sub-catchments in the study area. Areas with rain barrels included business, mixed residential, industrial, office, and school districts. We conducted designs of the space, density, and capacity to set the locations of the rain barrels. According to the spatial design style, we established four types of arrangements (Cases 1–4) for the simulation method. The rain barrels of Case 1 were arranged at whole sub-catchments; those for Case 2 were set mainly at inundated sub-catchments; those for Case 3 were arranged at easily inundated sub-catchments but without outer space; and those for Case 4 were set upstream from the inundated sub-catchments. Figure 5 shows the urban drainage system setup for the three Zhong-He District cases.
Figure 5. Spatial arrangement of regular design of rainwater harvesting systems.
Water 07 05173 g005
In terms of the setup of the rain barrel quantity, we employed density to establish it in SWMM. To compare its flood detention effects, we set the density as: (1) one for every 55.0 m2 under the rain barrel per household (Case X-1); one for every 82.4 m2 (Case X-2); one for every 108.5 m2 (Case X-3); and one for every 152.0 m2 (Case X-4). The rain barrel quantity of each case with each spatial arrangement is shown in Table 1. In the capacity design, we divided the capacity of rain barrels into 3.03 m3 (Case X-Y-1), 6.14 m3 (Case X-Y-2), 9.12 m3 (Case X-Y-3), 12.01 m3 (Case X-Y-4), 15.05 m3 (Case X-Y-5), and 18.05 m3 (Case X-Y-6) to compare the simulated effect of flood detention.
Table 1. Quantity (number) of rain barrel of each designed regular case.
Case No.Case X-1Case X-2Case X-3Case X-4
Case 13194X
Case 2472317236167
Case 3306204153108
Case 4395262198136

3.2.3. Calibration and Validation of US EPA SWMM

The distribution of sewer system construction and flood control point are shown in Figure 3a. Because the New Taipei sewer water level and flow monitoring system had not yet been built, the model calibration and validation could only be executed within the range of flooding depth. We therefore employed the flooding areas, water logging time, receding time, and flooding depth from “12 August 2009 Rainstorm Survey Data” for the model calibration. In addition, we used the “16 June 2012 Rainstorm Event” for the model validation to examine its feasibility.
The simulated output of SWMM was the volume of burst pipes (flooding) and water level; therefore, the flooding had to be converted into flooding depth for comparison. The actual records of the calibrated event’s three control points and SWMM simulation result both showed flooding; however, the validated event’s actual record and SWMM simulation result showed that only CP3 had flooding, whereas no flooding was found at the other control points. We checked the simulated calculation results of the calibration and validation event. The simulated depths of each flooding control point were all located within the actual flooding record range (Figure 6 and Figure 7). It was therefore confirmed that the model parameters were well calibrated and complete. The values of calibrated parameters are shown in Table 2.
Figure 6. Calibration results of stormwater runoff management model (SWMM).
Water 07 05173 g006aWater 07 05173 g006b
Figure 7. Validation results of SWMM (Jyu-Guang Road).
Water 07 05173 g007
Table 2. Values of the calibrated parameters in SWMM.
TitleSurface Roughness CoefficientHorton-Based Max/Min Infiltration Rates/Decay ConstantManning’s Roughness Coefficient for Conduits
Region 10.015~0.0333.5~4.6 (mm/h)/0.9~1.6 (mm/h)/1.8~2 (1/h)0.013~0.016
Region 20.013~0.0373.6~5.8 (mm/h)/1.1~1.9 (mm/h)/1.6~1.9 (1/h)0.015~0.017
Region 30.013~0.0253~3.5 (mm/h)/0.5~0.9 (mm/h)/2~2.2 (1/h)0.011~0.015
Region 40.012~0.0213.3~3.9 (mm/h)/0.7~1.2 (mm/h)/1.9~2 (1/h)0.012~0.014

3.2.4. Simulated Analytical Results of the Designed Spatial Arranged Regular Cases for RWHS

(1) Rainstorm Events Employed for Simulation-Optimization
As the foundation for selecting the optimal spatial design of RWHS, we gathered data from four rainstorm events that occurred from 2009 to 2012 in the Zhong-He District which the representative return period of total precipitation are 50, 100, 125 and 75 year, respectively (Table 3). The duration of heavy storm rains were about 6 hours which all caused large amount of inundation loss.
Table 3. Adopted precipitation hyetograph of rainstorm events for simulation-optimization (mm).
DateTime Series Number (HOUR)Representative Return Period of Total Precipitation
123456
1 July 20094.096.511.03.02.5050 year
12 August 20092.5101.520.03.51.50100 year
21 June 20104.004.544.548.028.5125 year
12 August 201270.549.51.500075 year
(2) Results and Discussion
We entered the spatial design approach of all cases into SWMM to simulate and calculate the average annual net benefit of setting the RWHS in the rainstorm events within the study years. We then compared the result to a scenario without RWHS. The curve equations of inundation loss of CP1−CP3 are expressed in Equations (19)−(21), respectively, and the annual cost function of RWHS is expressed in Equation (22). The unit of L C P 1 , L C P 2 , L C P 3 and T C is US dollars, and the unit of F C P 1 total , F C P 2 total and F C P 3 total is m3. The unit inundation loss of CP2 is obviously larger than the other two control points.
L C P 1 =3361.60 ( F C P 1 total ) + 25845.03    R 2  = 0.9565
L C P 2 8.89 ( F C P 2 total ) 2  + 8564.43 ( F C P 2 total )    9.67 10 4     R 2  = 0.9719
L C P 1  = 1.42 × 10 5 ( F C P 1 total ) 0.3681     R 2  = 0.9709
T C  = 118.21 + 4.34 C a 2  + 3.32 A r
The results of Case 1 can be regarded as the most significant flood reduction effect for the RWHS. However, because the cost of RWHS was very large, all net benefits resulted in a negative value. The design approach for the largest net benefit in the Cases 2, 3 and 4 considered individually are Cases 2-1, 3-1, and 4-1, respectively, and the comparison varying along with volumes is shown in Figure 8. The simulation analysis results demonstrate: (1) The function of flooding damage and reserving the facilities cost for each spatial layout appeared as convex and concave curves, thereby changing with the capacity of the rain barrels. We subtracted the convex curve from the concave curve to obtain the best solution with the largest net benefit; (2) The best solution was when the RWHS were set upstream of the flooding area, which was Case 4-1; the capacity of the rain barrel was 12 m3, and the net benefit for each year was 4.61 × 10⁵ US dollars; (3) In each case, the rain barrel’s best capacity was between 12 and 15 m3; greater benefits were produced when the rain barrel was set in the easily flooded area.
Figure 8. Comparative diagram of annual net benefit of each regularly designed case.
Water 07 05173 g008

3.3. Construction Results of BPNN-based SWMM

There were 12 input items of BPNN-based SWMM, which included: catchment precipitation, CP1−CP3 full pipe percentage of water flow, the quantity of Regions 1−4 rain barrels, and the capacity of Regions 1−4 rain barrels. The training and validating results are described as follows:

3.3.1. Training and Validating Results of Single-moment Simulation

We used the 2:1 principle to divide the rainfall-runoff data of the urban drainage system generated in each event using the simulation methods into two parts—training and validation. When classifying, we strove to disperse them in cases with different designs. The quantity of all events was 288; i.e., 3 (spatial arrangement quantity) × 4 (rain barrel intensity quantity) × 4 (storm event quantity) × 6 (rain barrel capacity). There were 198 training events and 90 validation events. Because the time interval for the data of each event was 1 min, the sum of training data was 44,442 and the sum of the validation data was 20,070.
After several repeated tests of neurons in the hidden layer, we compared the appraisal indicators and determined that there were seven final hidden layer neurons. The simulated results of training and validation for full pipe percentage of water flow are shown in Figure 9 and Figure 10, respectively. The MAE of CP1−CP3 in a single-moment level full-pipe simulation among validation events was 0.010%, 0.014% and 0.032%, respectively. The CC value was 0.990, 0.995, and 0.983, respectively. The results showed that the single-moment error of the full pipe percentage was small and demonstrated an accurate simulation trend. Therefore, the training and validation results of the single-moment simulation were good and could be continued in the entire-event simulation. However, the MAE of CP1−CP3 in a single-moment volume burst-pipes simulation among validation events was 0.020 cms, 0.039 cms, and 0.808 cms, respectively. The CC value was 0.947, 0.783, and 0.916, respectively. The results indicated that BPNN-based SWMM demonstrated better performance for water level simulation. Nevertheless, it was more difficult to be accurate in terms of the volume of burst pipes.
Figure 9. Training results of single-moment full pipe percentage simulation of water flow: (a) at CP1; (b) at CP2; and (c) at CP3.
Water 07 05173 g009
Figure 10. Validation results of single-moment full pipe percentage simulation of water flow: (a) at CP1; (b) at CP2; and (c) at CP3.
Water 07 05173 g010

3.3.2. Sensitivity Analysis Result

To understand the performance of the proposed BPNN-based water flow simulation model, this study deeply performed sensitivity analysis and the results are shown in Table 4. Results show that the output (full pipe percentage at time t + 1) sensitivity of CP3, CP2 and CP1 with regard to input: precipitation at time t (change in 0.2 mm/min) is 3.46%, 5.15% and 5.26%, respectively. According to historical experimental records, assuming about 67% of flood can be removed by free flow outlet and pumping facilities, the drainage system can suffer about 12.1 mm/h of heavy rains with no flooding that coincide with the rainfall design standard of 5-year return period (12.4 mm/h), so it represents the model performance and capability for the input of precipitation is available. Furthermore, the output sensitivity of CP1−CP3 with regard to input: full pipe percentage at t (change in 1%/min) is within the range from 0.51% to 1.12%. The change in the downstream water flow of CP1 is more sensitive to the other control points that coincide with the hydraulic theory, so the developed model is scientific enough to model water flow phenomenon. Besides, the output sensitivity of CP1−CP3 with regard to input: arranged quantity (change in 100 numbers) is within the range from 1.81% to 6.75%, and the output sensitivity of CP1−CP3 with regard to input: arranged capacity (change in 3 m3) is within the range from 0.44% to 2.15%. The change in upstream quantity and capacity of RWHS (Regions 3 and 4) make more sensitivity to the other low-lying subregions (Regions 1 and 2) that coincide with the analytical results of simulation method (Section 3.2.4), so the developed model is available for the embedded optimizing process.
Table 4. Sensitivity analysis of the backpropagation neural network (BPNN)-based water flow simulation model.
InputAverage Variance of Output (Full Pipe Percentage)
of CP3 at t + 1of CP2 at t + 1of CP1 at t + 1
Precipitation at time t (change in 0.2 mm/min)3.46%5.15%5.26%
Full pipe percentage of CP3 at t (change in 1%/min)1.12%0.51%0.72%
Full pipe percentage of CP2 at t (change in 1%/min)0.59%1.00%0.53%
Full pipe percentage of CP1 at t (change in 1%/min)0.96%0.98%1.00%
Arranged quantity of Region 1 (change in 100 number)3.22%2.68%2.74%
Arranged quantity of Region 2 (change in 100 number)2.38%3.54%1.81%
Arranged quantity of Region 3 (change in 100 number)2.40%5.02%3.42%
Arranged quantity of Region 4 (change in 100 number)4.40%3.30%6.75%
Arranged capacity of Region 1 (change in 3 m3)1.43%1.19%0.88%
Arranged capacity of Region 2 (change in 3 m3)0.49%0.86%0.44%
Arranged capacity of Region 3 (change in 3 m3)1.43%2.15%1.75%
Arranged capacity of Region 4 (change in 3 m3)1.16%1.29%1.62%

3.3.3. Validation Results of the Entire-event Iterative Simulation

The validation results of the entire-event iterative continuous simulation of the developed BPNN-based model are shown in Table 5. The MAE of the water level simulation was quite small (less than 15% for all cases), and the MAE for CP1−CP3 was 0.065%, 0.07%, and 0.106%, respectively. Moreover, all CC values reached 0.96; the CC values for CP1−CP3 were 0.968, 0.970, and 0.963, respectively. These results indicate that the BPNN-based SWMM developed by our research can accurately and quickly simulate the water level change of rainstorm events. Therefore, its alternative model can be reliable embedded in the optimization model to quickly and automatically provide an optimal design approach while the window-based man-made operating interface of hydraulic model cannot be linked with optimization model and algorithm. Figure 11 depicts the validation result of Case 4-3-6 during the “12 August 2012 Rainstorm Event”, which represents the fourth spatial distribution, the third rain barrel arrangement intensity (one for every 150 m2), and the second design capacity (6 m3).
Table 5. Unsteady continuous simulated results for validation of BPNN-based SWMM.
Unsteady Simulated EventsGuo-Guang Street (CP1)Min-Xiang Street (CP2)Ju-Guang Road (CP3)
MAE (%)CCMAE (%)CCMAE (%)CC
Designed Case 3-1-3 on 1 July 20095.70.9747.00.9759.20.974
Designed Case 4-4-1 on 1 July 20095.20.9847.50.9819.60.975
Designed Case 2-1-2 on 12 August 20093.80.9953.00.99410.10.963
Designed Case 3-2-4 on 12 August 20094.10.9953.60.9949.40.973
Designed Case 3-3-1 on 21 June 201012.40.97410.10.99117.10.936
Designed Case 4-3-6 on 21 June 201011.10.9707.00.99115.80.956
Designed Case 2-2-5 on 12 August 20125.10.9516.90.9517.20.967
Designed Case 4-1-6 on 12 August 20125.90.9249.50.9149.80.954
Designed Case 4-3-2 on 12 August 20125.50.9417.90.9407.00.964
Average6.50.9687.00.97010.60.963
Figure 11. Unsteady continuous simulated results of Case 4 during the “12 August 2012 Flood Event” using BPNN-based SWMM.
Water 07 05173 g011aWater 07 05173 g011b

3.4. Optimization Results

In this applied case, the tabu list can be shown as [ Z N 1 N 2 N 3 N 4 S 1 S 2 S 3 S 4 ] . Moreover, the tabu list length was set to 300, and the searching iterative number was 1,000. In the searching solution, the moving distance of Sr and Nr was 1 and 10, respectively. The initial solution was the best design approach of the simulation method of Case 4-1-4 (one rain barrel for every 50 m2; capacity of 12 m3).
After optimizing by tabu search, the optimal searching results are shown in Figure 12, and comparison on full pipe percentage of water flow and flooding volume between optimal rain barrel design, best design of simulation method and original no design of the three control points is shown in Figure 13. Results show that because of arrangement of rain barrels, the optimized design and best design of simulation method can eliminate total flood in the drainage system as much as possible comparing to original circumstances of no rain barrel. However, because the best design of simulation method mostly arrange rain barrels on the upstream of the study area, the initial stored effect for flood mitigation is obvious. However, after the rain barrels are full, the overflow from upstream would impact the low-lying stored water sharply with large amount of momentum because of highly hydraulic gradient. These circumstances cause the low-lying control points would instead undertake flooding transitorily. Moreover, the optimized design can eliminate the peak flow as much as possible and adapt the flow velocity as less as possible to minimize the flooding at the control points, because of more elastic spatial arrangement considering the distribution of drainage system and terrain. In the optimal spatial design approach for rain barrels, spatial quantity was mainly located upstream, and rain barrels with greater volume in easily flooded areas had a better flood reduction effect.
The BPNN-based SWMM developed by our institute may have some errors in the calculation results; therefore, our institute returned the optimal solution to the US EPA SWMM to simulate the water level and volume of the burst pipes, and to calculate the actual flooding loss. Results indicate that the evaluated error of inundation loss by using BPNN-based SWMM comparing to US EPA SWMM is about 7.99%; and regarding the evaluated error of net benefit, is about 4.15%; that is within acceptable range. The stepwise calculated results for net benefit are shown in Table 6. The average inundated loss while no installing rain barrels was 1.04 × 10⁶ US dollars; and of optimized design, was 0.27 × 10⁶ US dollars. The optimized spatial design of RWHS could reduce 72% of inundation losses according to the four simulated flood events. Besides, the annual net benefit of the best solution in the simulation method was 4.61 × 10⁵ US dollars (Figure 13), and the annual net benefit of hybrid simulation-optimization method was 5.20 × 10⁵ US dollars (12.75% better than using the single simulation method), which is quite good. It indicates that the optimization model developed by our institute can search for the optimal solutions for spatial quantity and capacity arrangement of RWHS with consideration of flood retention benefits.
Figure 12. Optimized design results of capacity and quantity of rainwater harvesting systems for Zhong-He drainage system.
Water 07 05173 g012
Figure 13. Comparison on full pipe percentage of water flow and flooding volume between optimal rainwater harvesting systems (RWHS) design, best design of simulation method and original no design: (a) CP1; (b) CP2; and (c) CP3.
Water 07 05173 g013aWater 07 05173 g013b
Table 6. Net benefit of optimized design of rainwater harvesting systems.
Flood Event1 July 200912 August 200921 June 201012 August 2012Average
Inundated loss while no installing rain barrels (US dollars)1.03 × 1061.63 × 1060.58 × 1060.91 × 1061.04 × 106
Inundated loss of optimized design (US dollars)0.25 × 1060.33 × 1060.22 × 1060.27 × 1060.27 × 106
Decreased inundated loss (US dollars)0.79 × 1061.30 × 1060.36 × 1060.64 × 1060.77 × 106
Benefit percentage of flood mitigation (%)76.2%79.8%62.1%70.0%72.0%
Cost (US dollars)0.25 × 10⁶
Annual net benefit (US dollars)0.52 × 10⁶

4. Conclusions

This study established a set of simulation-optimization models to select optimal solutions for spatial quantity and capacity arrangements of rain barrels in urban drainage areas. These models consider the optimal net benefit and flooding loss/cost reduction. First, we classified the characteristic zonal subregions for design of rainwater harvesting system (RWHS) by using FCM cluster algorithm with the investigated data of urban roof, land use and rainfall characteristics of drainage area, and the representative regular specification of spatial quantity and capacity arrangement of different types of RWHS are designed by using statistical quartiles analysis for rooftop area and rainfall frequency analysis. In the simulation method, we used SWMM built with actual rainfall data to simulate the water level and volume of burst pipes for a drainage system, and to obtain various flood reduction situations from different designs of regular RWHS for spatial quantity and capacity arrangements. We then calculated the net benefit after deducting the cost. In the optimization method, we first established a water level simulation model that can substitute for US EPA SWMM based on the simulated analysis results combined with BPNN, and then embedded it into the optimization model. Finally, considering the flood reduction benefit, we combined the optimization model and tabu search to optimize the spatial design approach for the quantity and capacity arrangement of RWHS.
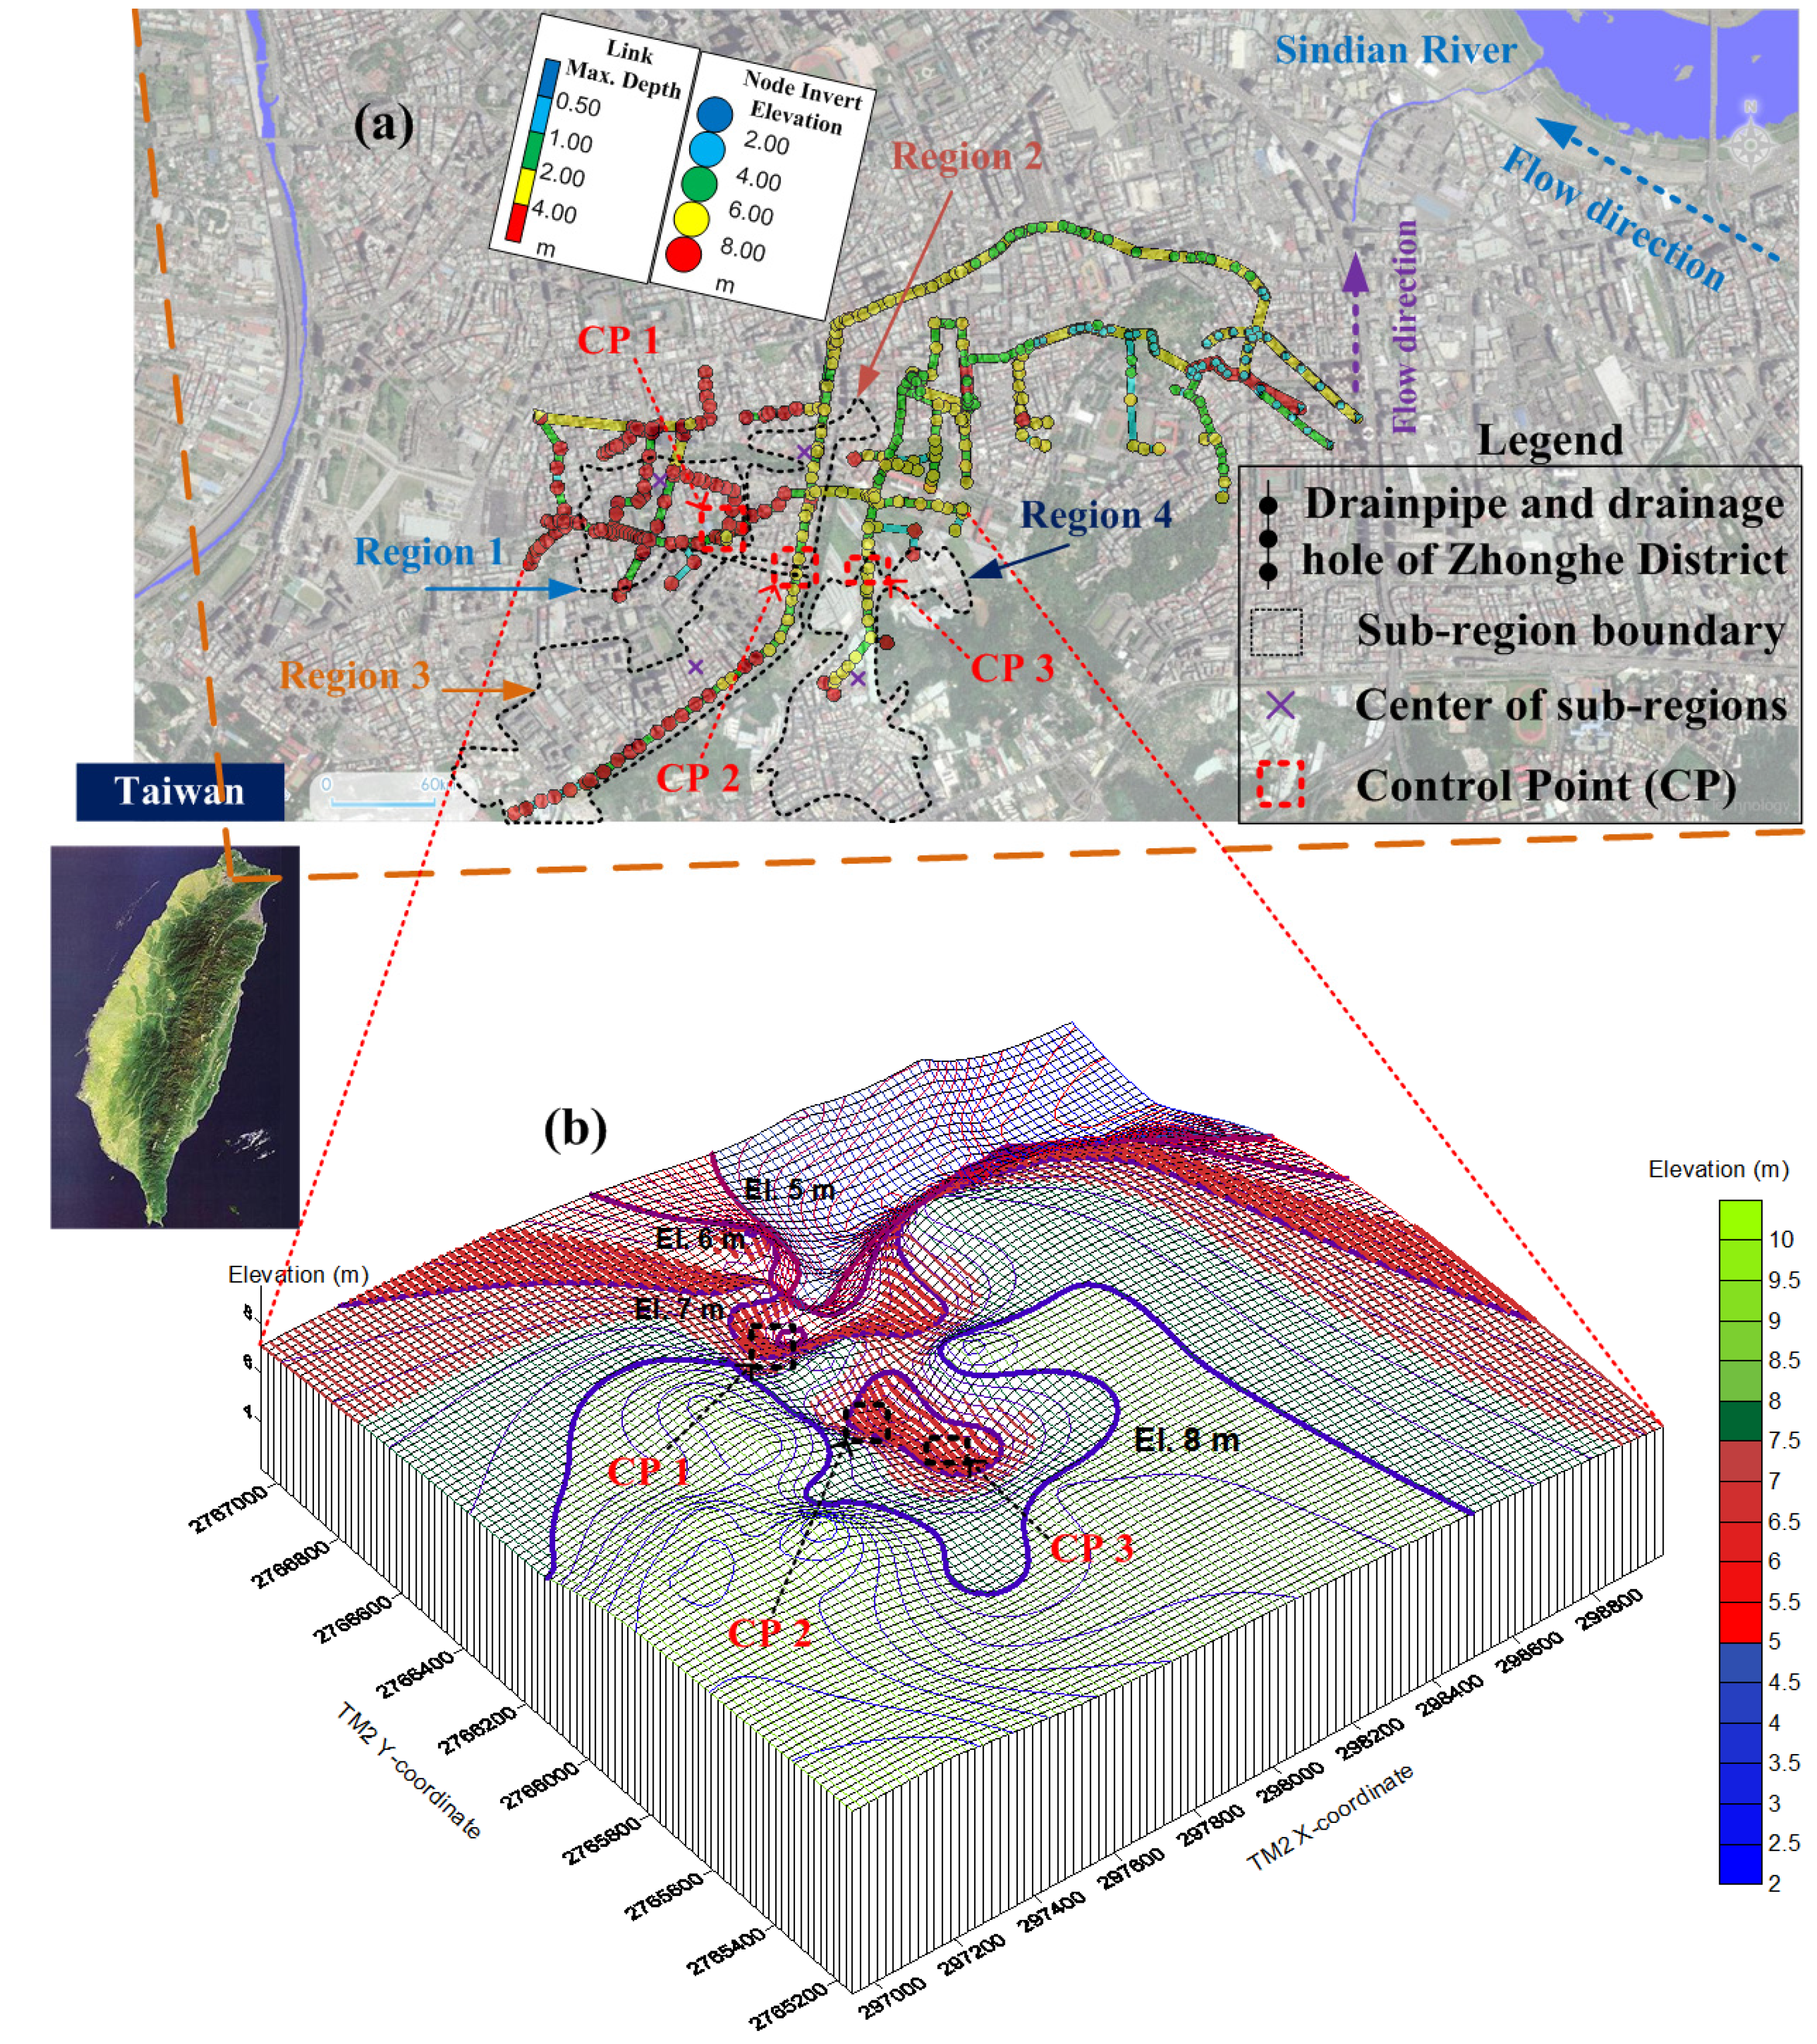
This study applied the established approach to Zhong-He District in New Taipei City, Taiwan. The research method is innovative and combines various forms of artificial intelligence as well as methods and techniques of systems analysis to effectively and fast optimize design approach of RWHS. Results showed that the developed hybrid simulation-optimization approach which embedded an intelligent BPNN-based water flow simulation model and used tabu search to obtain the optimal solution of the optimization model was 12.75% better than using the single simulation method comparing to economic net benefit for flood mitigation. The optimized spatial design of RWHS could reduce 72% of inundation losses according to the four simulated flood events. Furthermore, the optimal spatial design approach for rain barrels indicate that spatial quantity was mainly located at upstream and meanwhile RWHS with greater volume in easily flooded areas had a better flood reduction effect. Besides, the developed embedded BPNN-based SWMM for unsteady continuous water level simulation of drainage system can achieve average 92% of accuracy in the three control points. This capability promotes the developed simulation-optimization procedure can: (1) quickly and effectively search for the optimal solution; (2) conform to newly considered interdisciplinary multi-objective/constraints; and (3) involve more related embedded models. Moreover, the simulation-optimization process developed in this study can select a flexible and practical spatial arrangement and capacity design approach for RWHS to be an alternative measure for urban flood mitigation.

Acknowledgments

This research was partially supported by the Ministry of Science and Technology, Taiwan (Grant Nos. MOST103-2221-E-002-246 and MOST104-2111-M-019-001). In addition, the authors are indebted to the reviewers for their valuable comments and suggestions.

Author Contributions

Chien-Lin Huang performed the model construction and experiments, analyzed the data and wrote the paper; Nien-Sheng Hsu and Chih-Chiang Wei conceived and designed the models and experiments. Wei-Jiun Luo performed the model construction and experiments.

Conflicts of Interest

The authors declare no conflict of interest.

References

  1. Liaw, C.H.; Tsai, Y.L. Optimum storage volume of rooftop rain water harvesting systems for domestic use. J. Am. Water Resour. Assoc. 2004, 40, 901–912. [Google Scholar] [CrossRef]
  2. Liaw, C.-H.; Chiang, Y.-C. Framework for assessing the rainwater harvesting potential of residential buildings at a national level as an alternative water resource for domestic water supply in Taiwan. Water 2014, 6, 3224–3246. [Google Scholar] [CrossRef]
  3. Chiu, Y.R.; Liaw, C.H.; Chen, L.C. Optimizing rainwater harvesting systems as an innovative approach to saving energy in hilly communities. Renew. Energy 2009, 34, 492–498. [Google Scholar] [CrossRef]
  4. Campisano, A.; Modica, C. Optimal sizing of storage tanks for domestic rainwater harvesting in Sicily. Resour. Conserv. Recycl. 2012, 63, 9–16. [Google Scholar] [CrossRef]
  5. Abdulla, F.A.; Al-Shareef, A.W. Roof rainwater harvesting systems for household water supply in Jordan. Desalination 2009, 243, 195–207. [Google Scholar] [CrossRef]
  6. Belmeziti, A.; Coutard, O.; de Gouvello, B. A new methodology for evaluating potential for potable water savings (PPWS) by using rainwater harvesting at the urban level: The case of the municipality of Colombes (Paris Region). Water 2013, 5, 312–326. [Google Scholar] [CrossRef]
  7. Aladenola, O.O.; Adeboye, O.B. Assessing the potential for rainwater harvesting. Water Resour. Manag. 2010, 24, 2129–2137. [Google Scholar] [CrossRef]
  8. Hajani, E.; Rahman, A. Reliability and cost analysis of a rainwater harvesting system in peri-urban regions of greater Sydney, Australia. Water 2014, 6, 945–960. [Google Scholar] [CrossRef]
  9. Pachpute, J.; Tumbo, S.; Sally, H.; Mul, M. Sustainability of rainwater harvesting systems in rural catchment of Sub-Saharan Africa. Water Resour. Manag. 2009, 23, 2815–2839. [Google Scholar] [CrossRef]
  10. Seo, Y.; Park, S.Y.; Kim, Y.-O. Potential benefits from sharing rainwater storages depending on characteristics in demand. Water 2015, 7, 1013–1029. [Google Scholar] [CrossRef]
  11. Su, M.D.; Lin, C.H.; Chang, L.F.; Kang, J.L.; Lin, M.C. A probabilistic approach to rainwater harvesting systems design and evaluation. Resour. Conser. Recycl. 2009, 53, 393–399. [Google Scholar] [CrossRef]
  12. Baguma, D.; Loiskandl, W.; Jung, H. Water management, rainwater harvesting and predictive variables in rural households. Water Resour. Manag. 2010, 24, 3333–3348. [Google Scholar] [CrossRef]
  13. Jones, M.P.; Hunt, W.F. Performance of rainwater harvesting systems in the southeastern United States. Resour. Conserv. Recycl. 2010, 54, 623–629. [Google Scholar] [CrossRef]
  14. Basinger, M.; Montalto, F.; Lall, U. A rainwater harvesting system reliability model based on nonparametric stochastic rainfall generator. J. Hydrol. 2010, 392, 105–118. [Google Scholar] [CrossRef]
  15. Palla, A.; Gnecco, I.; Lanza, L.G. Non-dimensional design parameters and performance assessment of rainwater harvesting systems. J. Hydrol. 2011, 401, 65–76. [Google Scholar] [CrossRef]
  16. Burns, M.J.; Fletcher, T.D.; Duncan, H.P.; Hatt, B.E.; Ladson, A.R.; Walsh, C.J. The performance of rainwater tanks for stormwater retention and water supply at the household scale: An empirical study. Hydrol. Process. 2015, 29, 152–160. [Google Scholar] [CrossRef]
  17. Campisano, A.; Modica, C. Appropriate resolution timescale to evaluate water saving and retention potential of rainwater harvesting for toilet flushing in single houses. J. Hydroinform. 2015, 17, 331–346. [Google Scholar] [CrossRef]
  18. Petrucci, G.; Deroubaix, J.F.; de Gouvello, B.; Deutsch, J.C.; Bompard, P.; Tassin, B. Rainwater harvesting to control stormwater runoff in suburban areas, an experimental case study. Urban Water J. 2012, 9, 45–55. [Google Scholar] [CrossRef]
  19. Rosenblatt, F. The perceptron: A probabilistic model for information storage and organization in the brain. Psychol. Rev. 1958, 65, 386–408. [Google Scholar] [CrossRef] [PubMed]
  20. Rumelhart, D.E.; McClelland, J.L. Parallel Distributed Processing: Explorations in the Microstructure of Cognition; MIT Press: Cambridge, MA, USA, 1986. [Google Scholar]
  21. Roesner, L.A.; Dickinson, R.E.; Aldrich, J.A. Storm Water Management Model Version 4: User’s Manual; United States Environmental Protection Agency: Washington, DC, USA, 1988. [Google Scholar]
  22. Rossman, L.A. Storm-Water Management Model Version 5.0; United States Environmental Protection Agency: Washington, DC, USA, 2005. [Google Scholar]
  23. Glover, F. Future paths for integer programming and links to artificial intelligence. Comput. Oper. Res. 1986, 13, 533–549. [Google Scholar] [CrossRef]
  24. Glover, F.; Laguna, M. Tabu Search; Kluwer Academic: Boston, TX, USA, 1997. [Google Scholar]
  25. Cheng, C.L.; Liao, M.C. Regional rainfall level zoning for rainwater harvesting systems in northern Taiwan. Resour. Conserv. Recycl. 2009, 53, 421–428. [Google Scholar] [CrossRef]
  26. Bezdek, J.C. Pattern Recognition with Fuzzy Objective Function Algorithms; Plenum Press: New York, NY, USA, 1981. [Google Scholar]
  27. Lee, K.; Ho, J. Design hyetograph for typhoon rainstorms in Taiwan. J. Hydrol. Eng. 2008, 13, 647–651. [Google Scholar] [CrossRef]
  28. Guo, J.; Blackler, G.; Earles, T.; MacKenzie, K. Incentive index developed to evaluate storm-water low-impact designs. J. Environ. Eng. 2010, 136, 1341–1346. [Google Scholar] [CrossRef]
  29. Chang, L.C.; Shen, H.Y.; Wang, Y.F.; Huang, J.Y.; Lin, Y.T. Clustering-based hybrid inundation model for forecasting flood inundation depths. J. Hydrol. 2010, 385, 257–268. [Google Scholar] [CrossRef]

