Article

The Acoustic Properties of Suspended Sediment in Large Rivers: Consequences on ADCP Methods Applicability

1
Hydraulic Engineering Laboratory-DICAM, University of Bologna, via Terracini 28, 40131 Bologna, Italy
2
Department of Hydraulic and Environmental Engineering, Norwegian University of Science and Technology; S. P. Andersens vei 5, 7491 Trondheim, Norway
3
Faculty of Engineering and Water Sciences, International Centre for Large River Research (CIEGRI), Littoral National University, Santa Fe City, Santa Fe, CP 3000, CC 217, Argentina
4
Institute for Modelling Hydraulic and Environmental Systems, University of Stuttgart, Pfaffenwaldring 61, 70550 Stuttgart, Germany
5
Department of Hydraulic and Water Resources Engineering, Budapest University of Technology and Economics, Műegyetem rakpart 3, H-1111 Budapest, Hungary
*
Author to whom correspondence should be addressed.
Water 2016, 8(1), 13; https://doi.org/10.3390/w8010013
Submission received: 16 November 2015 / Revised: 22 December 2015 / Accepted: 23 December 2015 / Published: 2 January 2016
(This article belongs to the Special Issue Watershed Sediment Process)

Abstract

:
The use of echo-levels from Acoustic Doppler Current Profiler (ADCP) recordings has become more and more common for estimating suspended bed-material and wash loads in rivers over the last decade. Empirical, semi-empirical and physical-based acoustic methods have been applied in different case studies, which provided relationships between scattering particles features derived from samples (i.e., concentration and grain size) and corresponding backscattering strength and sound attenuation. These methods entail different assumptions regarding sediment heterogeneity in the ensonified volume (e.g., particle size distribution (PSD) and spatial concentration gradient). Our work was to compare acoustic backscatter and attenuation properties of suspended sediments, sampled in the rivers Parana and Danube that represented rather different hydro-sedimentological conditions during the surveys. The Parana represents a large sandy river, characterized through a huge watershed and the typical bimodal PSD of sediment in suspension, while the Danube represents in the investigated reach an exposed sand-gravel bed and clay-silt particles transported in the water column in suspension. Sand and clay-silt concentrations clearly dominate the analyzed backscattering strength in the rivers Parana and Danube, respectively, with an effect of PSD level of sorting in the latter case. This comparison clarifies the extent of assumptions made, eventually advising on the actual possibility of applying certain ADCP methods, depending on the expected concentration gradients and PSD of suspended sediment to be investigated.

1. Introduction

A variety of environmental and engineering practices, including inland navigation [1,2], sea shoreline protection [3,4], erosion hazard mitigation during flood [5], irrigation water supply [6], habitat preservation [7] and environmental sustainable hydropower development [8], require reliable data regarding sediment transport.
The transport of sediment by river streamflow is commonly classified in: suspended- and bed-load transport, based on the dominant mechanism, to form the total-load. The suspended-load is transported in suspension by turbulence in flowing water without contact with the riverbed, whereas the bed-load is the part of the total sediment-load that is transported by sliding, rolling or saltating in a ballistic trajectory just above the riverbed. The suspended-load may be further subdivided into suspended bed-material load, which is the coarse portion of the suspended-load for which the transport rate is governed by the transport capacity of the flow, and that is generally transported close to the riverbed, and wash-load: the fine portion of the suspended-load for which transport rate is governed by upstream supply. The wash-load is homogenously distributed through the water column because it does not exchange with the riverbed in contrast to suspended bed-material load. The wash-load, usually containing silt and clay, often represents the majority of sediment volume that serves to build the alluvial plain, the delta, and the shoreline. These fractions originate from the erosion process of soil forming river margins, riparian zones, wetlands and watershed slopes. Sand, forming the riverbed, is usually transported fully suspended or close to the bottom. The suspended-load is generally referred to the transport mode of fine to fine-middle sand that occurs in full suspension, whereas coarser particles (i.e., middle-coarse sand and gravel), form the heavily laden flux that is transported close to the riverbed (i.e., the bed-load transport). In large rivers, flowing in flat wetlands, the suspended-load usually represents the highest amount of volume of transported sand, forming the riverbed. Aiming to predict river channel morphodynamics [9,10], field investigation and measurement technologies using indirect techniques have primarily focused on the flux of sand, suspended from the riverbed [11,12,13,14,15], although the bed-load and wash-load were also investigated by means of the Acoustic Doppler Current Profiler (ADCP) [16,17,18].
Direct sampling of the mixture of water and sediment in a river is a challenging task especially during high discharge and rough water-level conditions. Hence, in the last decades, indirect methods for the quantification of suspended sediment have been noticeably improved. These techniques have advantages compared to direct sampling especially in terms of spatiotemporal coverage.
Acoustic backscatter techniques allow indirect quantification of the suspended sediment using non-intrusive measurements with high temporal and spatial resolution by deploying ADCPs from (i) a moving boat, with a profiling range of several meters (down-looking instrument) [13,15], and (ii) a river side, horizontally profiling a longer alignment across the streamflow at a fixed level (side-looking instrument) [18]. Despite the advances of these methods, their use may be restricted by the inherent assumptions mostly regarding the sediment homogeneity in the ensonified volume.
These methods rely on an assumed correlation between suspended sediment concentration and the acoustic backscattering strength that may be corrected by considering sound attenuation effects. Indeed the acoustic backscatter depends in addition on particle size distribution (PSD) [19,20]. This occurrence may undermine the mentioned correlation. Using a multi-frequency approach, the indetermination related to the actual PSD may be solved [21] to some degree, although this may not be feasible for poorly sorted sediment (i.e., wide PSD) and when using typical frequencies of standard ADCPs. Another option consists of obtaining a steady calibration between backscattering strength and the concentration of a limited range of fractions forming the actual PSD. This method relies on the limited sensitivity of ADCP’s frequency to the actual spectra of suspended particles size [13,15].
The backscatter and sound attenuation dependency on the actual PSD appears particularly relevant for rivers characterized with a typical bimodal distribution that shows a clay-silt and a sand peak corresponding to transported wash-load and suspended-load of riverbed material, respectively. In this condition, the sound attenuation due to fine fractions may dominate backscatter from sand and a steady calibration between the viscous attenuation coefficient and fine fractions concentration may exist [18,22]. This calibration relies on the opportunity of measuring appreciable spatial gradients of sound reverberation affected by viscous attenuation that is feasible for long profiles (i.e., side-looking instrument). In addition, the measured reverberation should not be affected by concentration gradients along the profiled range, which is reasonable for homogeneously distributed fine sediment, but reduces the method applicability especially in large rivers where horizontal gradients are relevant.
An ADCP user may be confused by a variety of backscatter methods developed for sediment investigations in rivers in a way that a specific method may appear feasible for a river under specific conditions, without the possibility of applying these methods in different environments. Aiming to guide ADCP users in classifying an actual case study by the acoustic method to be applied for the indirect measurement of sediment transport, our objective was to investigate the dependence of acoustic properties (i.e., backscatter and sound attenuation) on the variation of suspended particles concentration and PSD sampled in the water column at two large rivers. Although excellent studies already exist [19,20,21,22,23,24,25], which aim to clarify these relationships, practical applications are mainly focused on a specific investigated case study that bore out an ADCP specific method [13,15,18,22].
Therefore, our aim was to give an answer on the practical need of evaluating the applicability of different acoustic methods. To this end, in the presented study, we compare assessed backscattering strength and attenuation values from a variety of sediment samples collected in the water column in different reaches at the Parana River (Argentina) and in a river section of the Danube River (Hungary). These two large rivers represented very different conditions, both in terms of sediment forming the riverbed and sediments transported in the water column. This heterogeneity resulted in a dominant spatial gradient of sand and clay-silt backscattering strength for the Parana reaches and the Danube section, respectively, while the sound attenuations due to suspended sediments were found with similar magnitude in the two rivers. Assessed variation and magnitudes were compared to observed features of sediments (i.e., concentration, PSD first and second order moments) and the ADCP methods applicability discussed.

2. Materials and Methods

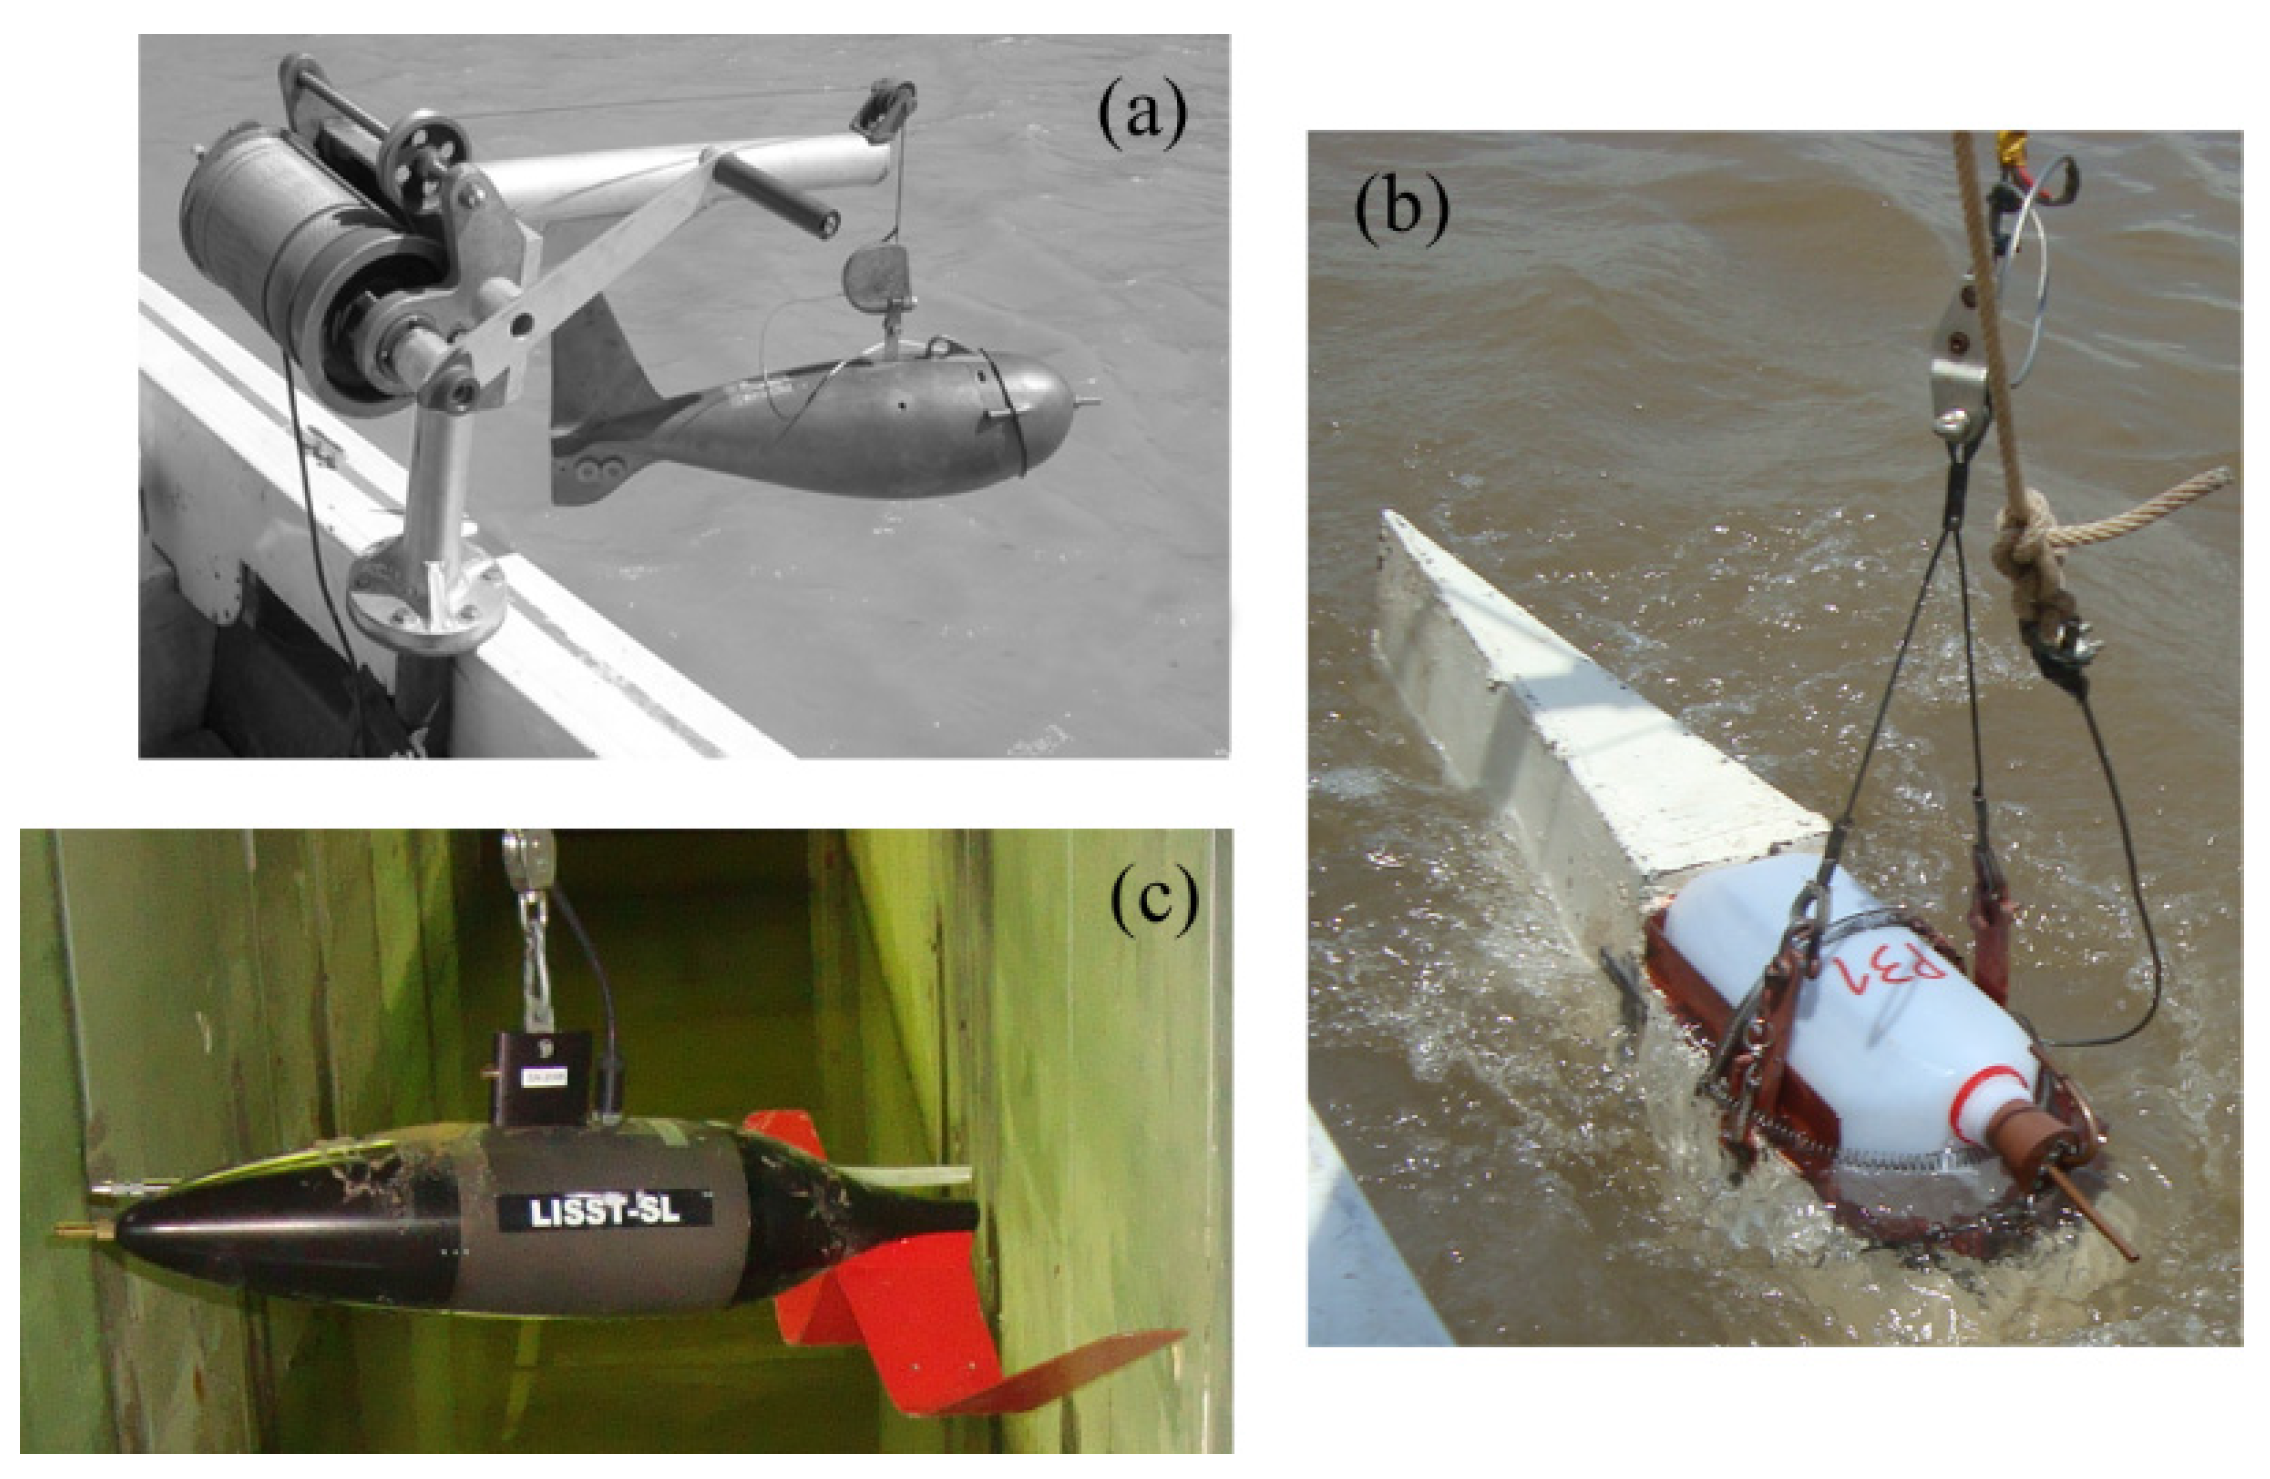
2.1. Study Areas and Sampling Campaigns of Water-Sediment Mixture

The Parana River is one of the largest rivers in the world [26], with a drainage basin of 2.3 × 10⁶ km2 crossing the borders of Brazil, Bolivia, Paraguay and Argentina. Downstream of the confluence of the Parana River and the Paraguay River (Figure 1a), the mean annual discharge is 19,500 m3·s−1, and the water surface slope is in the order of 10−5. The channel bed is composed mostly of fine- and medium-sized sand [27]. The channel planform pattern is classified as an anabranch with a meandering thalweg [26]. A succession of wider and narrower sections is typical, with mean channel widths and thalweg depths ranging from 600 to 2500 m and from 5 to 16 m, respectively. In the middle and lower reaches, the bed material is composed almost completely of sand (>90%), with small amounts of silt and clay (<4%) according to Drago and Amsler [27].
The water-sediment mixture samplings in Argentina were conducted in the middle and lower parts of the Parana (Figure 1b): (i) in the Colastiné River that is a Parana secondary channel close to city Santa Fe (31°39′17.04′′ S, 60°35′33.87′′ W); and (ii) in the large expansion-bifurcation unit of the Parana main channel near the city Rosario (32°56′39.27′′ S, 60°39′01.94′′ W), respectively. Some field work was conducted on 17 March 2014 and 20 September 2014 in the Colastiné River with a discharge of 1485 m3·s−1 and 1983 m3·s−1, respectively, and in the main channel on 16–17 November 2010 when the Parana total discharge was 14,320 m3·s−1. Those discharge values in the Colastiné River may correspond to about one tenth of the total discharge in the main channel.
In more detail, in 2010, suspended sediment samples were obtained at four positions equally spaced across the river section upstream of the main channel bifurcation (Figure 1b). This cross-section was characterized with water depths varying from 5 to 11 m. In this case, two to three samples were collected for each position by using a depth-integrating isokinetic sampler (Figure 2b). This sampler is characterized with three different intake nozzles, diameters of 5, 7, and 9 mm, which were previously calibrated according to the hydraulic conditions. A maximum error of 15% was observed between common flow condition in the Parana River and the intake velocity [28]. The influence of this error on the sediment concentration values depends mainly on the suspended grain size [29]. In this case, the sand suspended from the Parana riverbed was investigated, only, for which the common flow velocity range entailed a recommended nozzle diameter of 7 mm. Each sampling (two-way depth integration) was taken between 2 and 4 min, depending on the depth and the current velocity; see Figure 1 in Gray and Gartner [30]. A maximum error of 10% was expected in measured suspended sand concentrations.
Figure 1. (a) The Parana-Paraguay watershed and (b) sampling sections in the Parana River and the Colastiné River (a Parana River secondary reach) close to Santa Fe and Rosario (Argentina); (c) The Danube River watershed and (d) its section in Hungary at Esztergom investigated by using the LISST-SL device by Sequoia Inc (Bellevue, WA, USA).
Water 08 00013 g001
Figure 2. (a) US P-61 point sampler; (b) depth integrated sampler and (c) the LISST-SL used in the Parana secondary channel Colastiné, Parana main channel (Argentina) and the Danube (Hungary), respectively.
Water 08 00013 g002
In March 2014, seven water columns were investigated across the Colastiné River. Three additional columns were sampled on 20 September 2014 for spanning different hydraulic conditions. Five positions per water columns were investigated using the point sampler US P-61 (Figure 2a) that resulted in samples at following levels: 0.2, 0.4, 0.6, 0.8 and 0.9 of water depth (changing in the range of 3–7 m) from the water surface to river bottom.
Laboratory analyses were performed, consisted of wet sieving, dry weighing and microscope or laser scanning, eventually assessing clay-silt and sand concentrations and corresponding PSD. According to the weight of sediment in an individual sample, two methodologies were applied for PSD analyses. The Malvern Mastersizer 2000 was used to analyze clay-silt material, that device is a laser diffraction particle size analyzer. Resulting PSDs consisted in the average of three consecutive analyses. Suspended sand distribution was inferred by using a well tested methodology [31] that applies a scanning electron microscope.
Additional measurements were conducted in the middle section of the Danube (Figure 1c,d) close to the city of Esztergom (47°47′18.22′′ N, 18°44′36.40′′ E) in Hungary, on 7–8 May 2013. This is a free-flowing section with a mean flow of 2000 m3·s−1 and a mean slope of about 10−4 [32]. The average width and depth of this section is in the range of about 500 m and 6 m, respectively. Gravel and sand-gravel material forms the riverbed [33]. A single field campaign was conducted at a flow discharge of about 3290 m3·s−1, in the falling limb of an approximately 1-year flood event. Two 500 m wide cross-sections were chosen for the investigation, with water depths in the range of 3–9 m, upstream and downstream of the inflowing section of a tributary called River Hron (Figure 1d). Twelve verticals were investigated by using the LISST-SL device by Sequoia Inc (Bellevue, WA, USA) (Figure 2c), which combines a stream lined (SL) isokinetic sampler with an on-board laser diffraction particle size analyzer [34,35,36]. These measurements were conducted in each vertical for levels regularly spaced from 0.5 to 1.0 m, depending on the actual water depth (i.e., a finer resolution for lower depths was chosen), starting from 0.5 m beneath the water surface until about 0.5 m above the riverbed. A total number of 102 points were sampled in the two cross-sections. For each point, a two-minute long measurement was carried out, resulting in 60 acquisitions (considering the sampling frequency of 0.5 Hz), providing the same number of PSDs spanning 32 classes (diameter size from 2.07 to 350 μm). The two-minute long sampling time was determined based on a preliminary sensitivity analysis, where subsequently time averaged characteristics of the suspended sediment were used [37].
Summarizing on the entire dataset, a total of 102, 17 and 11 samples were analyzed for the Danube, the Colastiné and the Parana main channel, respectively. It is worth noting that a 0.5 Hz acquisition frequency of LISST-SL gave a larger dataset of two minutes averaged PSDs at each sampling point covering two cross-sections and 11 verticals. For the Parana system, a more limited amount of depth averaged and point samples were used to examine the secondary reach Colastiné in Santa Fe and the main channel close to Rosario for different conditions.

2.2. Acoustic Theory

For readers’ convenience, few aspects are reported here regarding the theory of sound scattering from a water-particles mixture. Exhaustive works may be found in technical-scientific books [38,39,40] and more recent review papers [24,25].
The received sound intensity, I, by an acoustic system depends on: (i) the reference level at unit distance and the acoustic system settings (i.e., amplifier gain, transmit power and pulse length) which may be represented with a constant value, Kt, for a given system setting; (ii) the ability of suspended particles to scatter sound back to a mono-static transducer (i.e., backscattering strength) at a distance R; (iii) the two-way round-trip attenuation; (iv) the geometrical spreading. This may be written as reported in Equation (1), which is derived under Thorne and Hanes [24] and is usually referred as the sonar equation:
I K t 2 = K s 2 M s R 2 ψ 2 e 4 ( α w + α s ) R
where (i) the backscattering coefficient Ks2 times the mass concentration Ms is the backscattering strength; (ii) α w and α s are the water viscosity and suspended sediment attenuation coefficients, respectively; (iii) R2ψ2 is the geometrical spreading that includes the near field correction coefficient ψ [41]. It is worth noting that much of the existing literature, regarding the use of ADCPs to assess the concentration of suspended sediment, reports a logarithmic form of the sonar equation, including the target strength or an equivalent decibel expression of the backscattering strength that is ten times the common logarithm of Ks2Ms. This is because the echo levels recorded by an ADCP are proportional to the received sound intensity in a dB scale [37,42].
In the general case of an acoustic beam ensonifying a heterogeneous concentration field of a multi-size mixture of sediments, the backscattering strength and the sediment attenuation coefficients are both range (i.e., R) dependent. In this case, the two-way attenuation should be integrated along the beam path from transducer up to the backscatter farthest distance (R maximum).
The backscattering strength, σs2, depends on mass concentration and PSD through the backscattering coefficient that is written in Equation (2):
σ s 2 = K s 2 M s = 3 f 2 M s 16 π ρ s a
where expected mean values are denoted between brackets that accounts for the actual PSD of scattering particles. In Equation (2), ρs is the sediment density (i.e., 2650 kg·m−3), a and f are the particles mean radius and the form factor [20], respectively. It is worth noting that for the Rayleigh scattering region (i.e., for the wave number, k, particles radius, a, product x much less than unit; x = ka << 1), f scales as the square of x, while in the geometric region (x >> 1), f asymptotes to be 1.1, with a transition for x close to unity. Equation (3) is the expression given by Thorne and Meral [20] that was applied in this work to assess the form factor for each class forming the analyzed PSDs:
f = x 2 ( 1 0.35 e ( x 1.5 0.7 ) 2 ) ( 1 + 0.5 e ( x 1.8 2.2 ) 2 ) 1 + 0.9 x 2
Among others, Thorne and Meral [20] derived the form factor function (Equation (3)) by fitting backscatter measurements from well sorted (herein referred to as mono-size) natural sand suspensions.
Our objective was to characterize heterogeneous suspensions with a given PSD (i.e., p(a)); therefore, the mean expected values to be used in Equation (2) were assessed as reported in Equations (4) and (5) [19,20].
a = a p ( a ) d a
f = ( a p ( a ) d a a 2 f 2 p ( a ) d a a 3 p ( a ) d a ) 0.5
A variety of authors discussed the contribution of suspended sediments to sound attenuation, where relevant works can be found starting from the forties of the last century [40]. More recently, the scatter attenuation that spread energy out of the incident beam was compared to viscous dissipation as a result of the shear produced by particles to fluid relative motions [18,23]. These two mechanisms are additive (i.e., αs = αss + αsv) and may produce a relevant dissipation, depending on mass concentration, the actual PSD and the ensonified range R. For fine particles such as clay-silt, the viscous attenuation coefficient, αsv, is dominant, while, for sand, it becomes negligible and the attenuation is a result of the scattering attenuation coefficient, αss, which is related to the total scattering cross-section, χ, of the ensonified particles.
In this work, the total scattering cross-section and the scattering attenuation coefficient were computed following Thorne and Meral [20] as reported in Equations (6) and (7).
χ = 0.29 x 4 0.95 + 1.28 x 2 + 0.25 x 4
α s s = ζ s s M s = 3 M s 4 ρ s a 2 χ p ( a ) d a a 3 p ( a ) d a
Equation (6) is a semi-empirical best fitting of the total scattering cross-section from measurements in mono-size tests. Equation (7) was applied to evaluate the mean expected αss for actual PSDs from samples in the Parana and the Danube, which included the Equation (6) evaluation for each class. ζ between brackets denotes the mean expected value of the attenuation coefficient, normalized over mass concentration. This normalized coefficient only depends on the actual PSD. Equation (7) reduces to Equation (8) for a mono-size suspension:
α s s = ζ s s M s = 3 χ M s 4 a ρ s
The viscous attenuation coefficient for a heterogeneous sample with a given PSD was evaluated as reported in Equation (13) [18] that includes formulations due to Urick [40] reported in Equations (9)–(12):
γ = π F ν
s = 9 2 γ d ( 1 + 2 γ d )
T = 1 2 + 9 2 γ d
ζ s v = α s v M s = k 2 ρ s ( σ 1 ) 2 ( s s 2 + ( σ + T ) 2 )
α s v = ζ s v M s = M s a 3 ζ s v p ( a ) d a a 3 p ( a ) d a
where F is the frequency of the emitted signal, ν is the fluid kinematic viscosity (i.e., 1.1 × 10⁻⁶ m2·s−1 for water at about 15 degree Celsius), d is the particle size diameter, and σ the sediment to fluid density ratio. For a mono-size suspension, Equation (13) simply reduces to the normalized viscous attenuation coefficient (ζsv given by Equation (12)) times the mass concentration.
Echo intensity levels recorded by an ADCP in a dB scale are proportional to the logarithmical received intensity I [37,42] in the sonar equation (left hand side in Equation (1)). Therefore, physical-based models of sediment backscatter and attenuation described in Equations (2)–(13), may be applied to assess the correlations between received intensities and scattering particles features that are mass concentration and PSD moments. Those correlations would enable the assessment of sediment features from ADCP recordings (i.e., the inverse problem solution). In this work, backscattering strength and attenuation coefficients (in the right hand side in Equation (1)) were assessed by means of Equations (2)–(13) and on the basis of sediment features from samples collected in the Parana and Danube rivers (i.e., the direct problem solution). A sketch reported in Figure 3 summarizes the most important parameters in Equations (2)–(13) for the direct and inverse solution of Equation (1).
Figure 3. Sketch summarizing the use of most important parameters in Equations (2)–(13) to be applied while solving Equation (1) with a direct and an inverse approach.
Water 08 00013 g003
Given our objective of evaluating the applicability of different ADCP methods for suspended sediment investigations, resulting values of backscattering strength and attenuation coefficients were converted from Neper to dB scale as reported in Equations (14)–(16):
S v = 10 log 10 ( K s 2 M s )
A s s = 20 log 10 ( e ) ζ s s M s
A s v = 20 log 10 ( e ) ζ s v M s
using the International System the backscattering strength is given in dB and the attenuation coefficients in dB/m. The attenuation coefficients times the acoustic range doubled give the two-way round-trip attenuations (in dB) due to suspended sediments.

3. Results

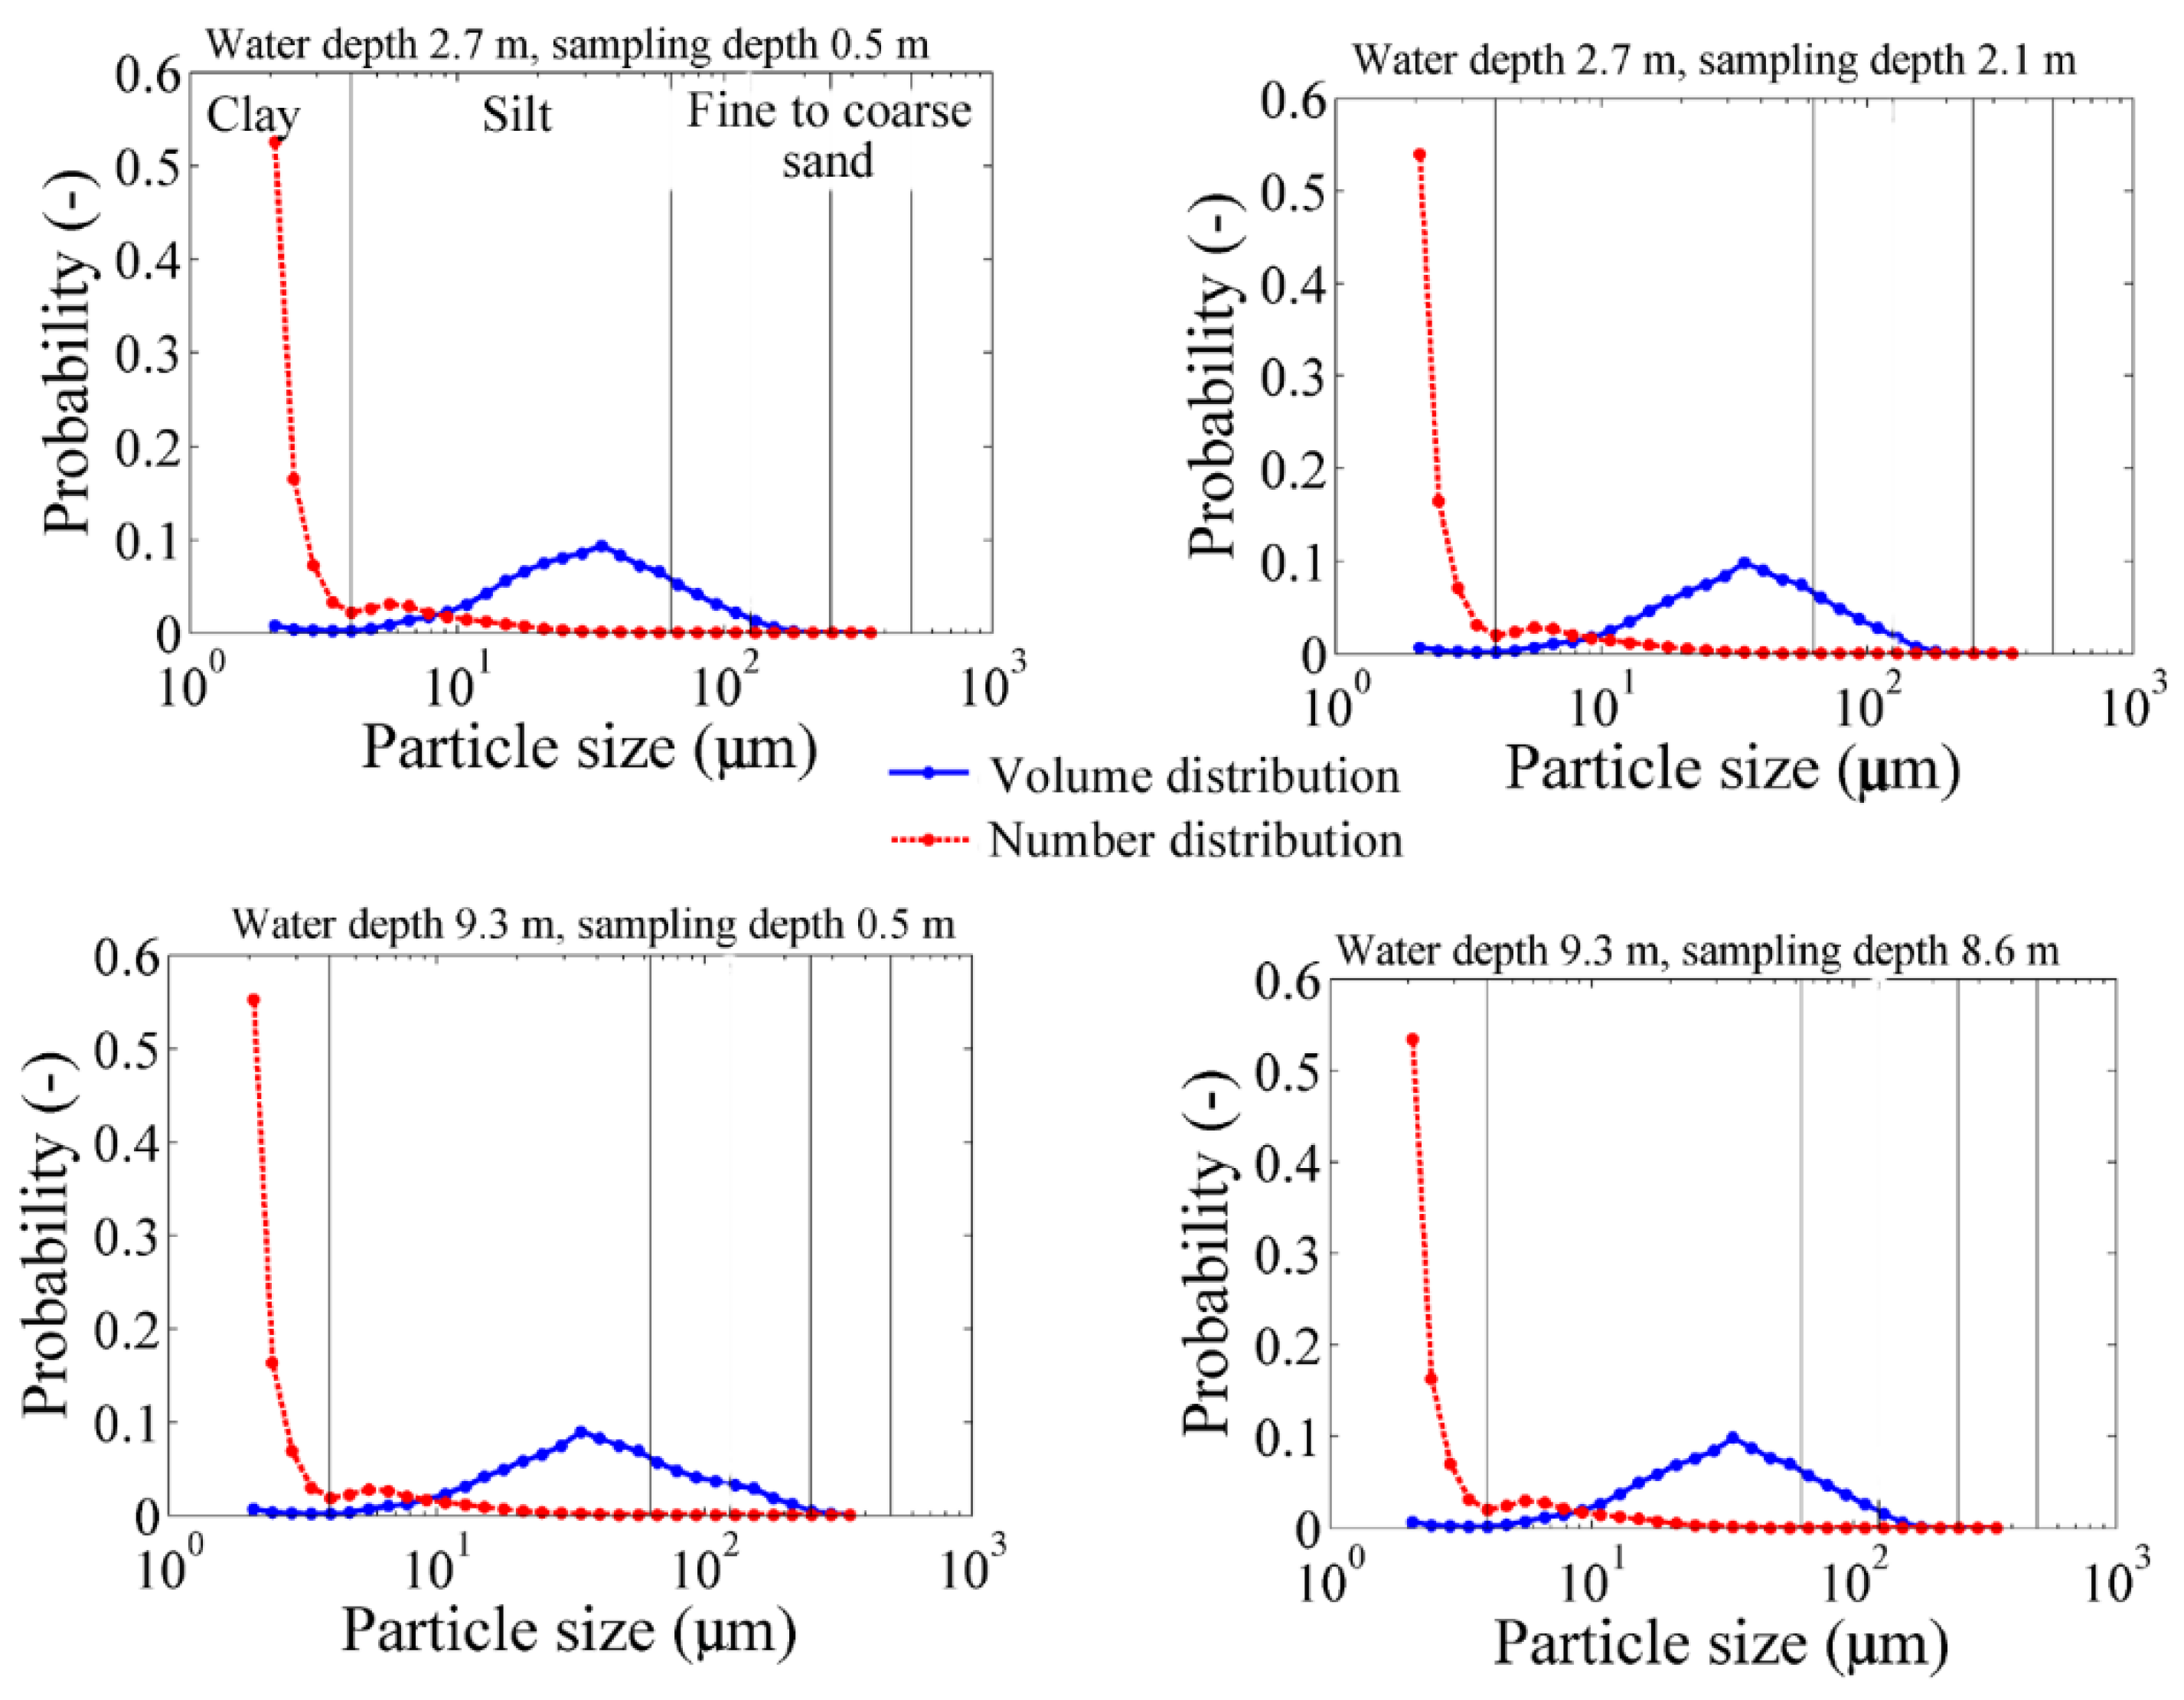
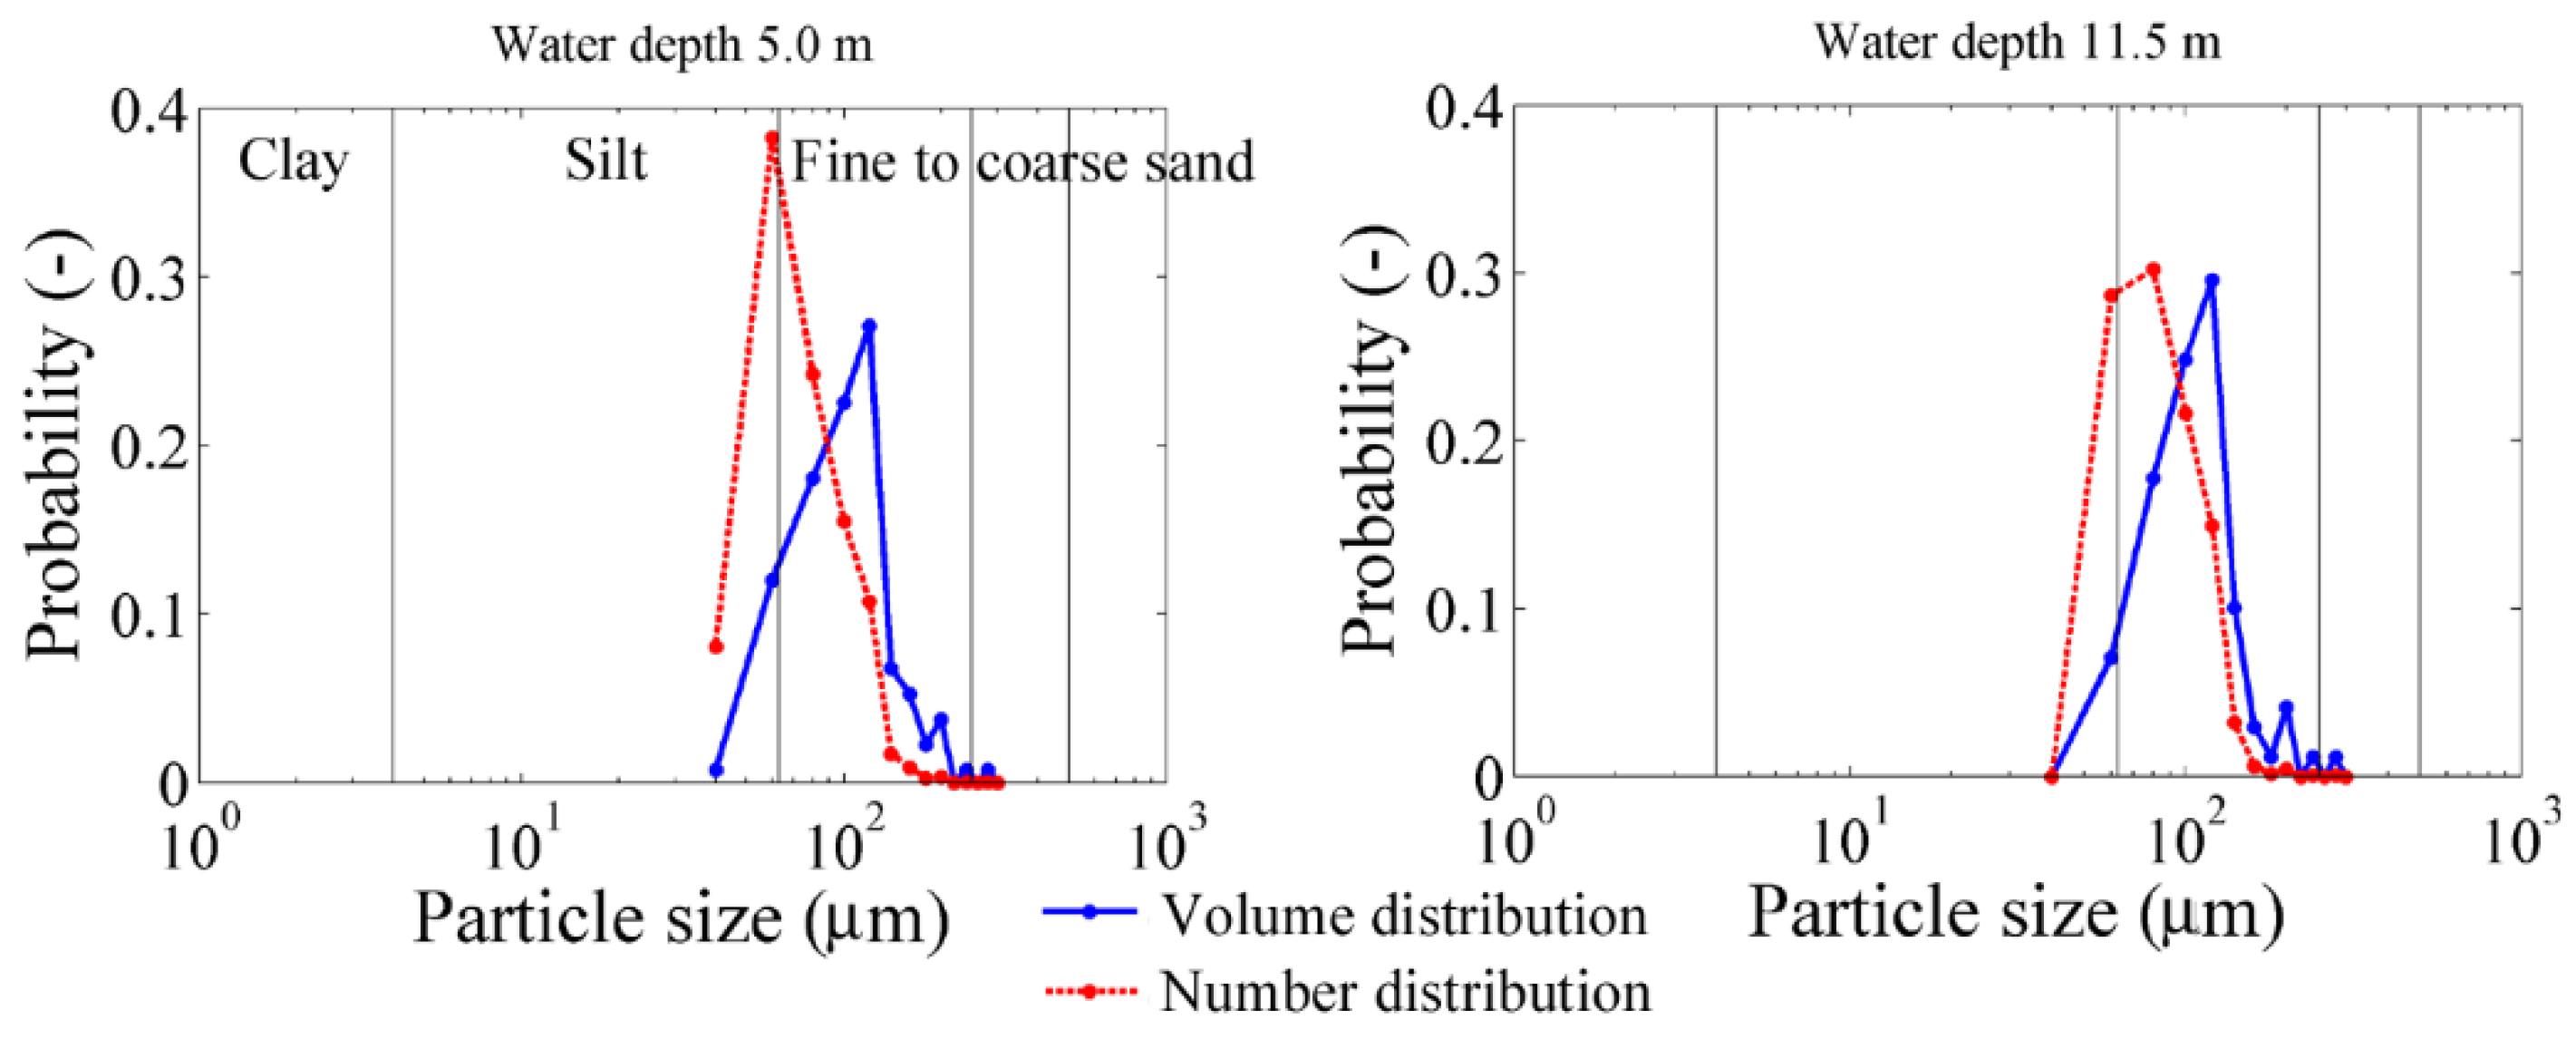
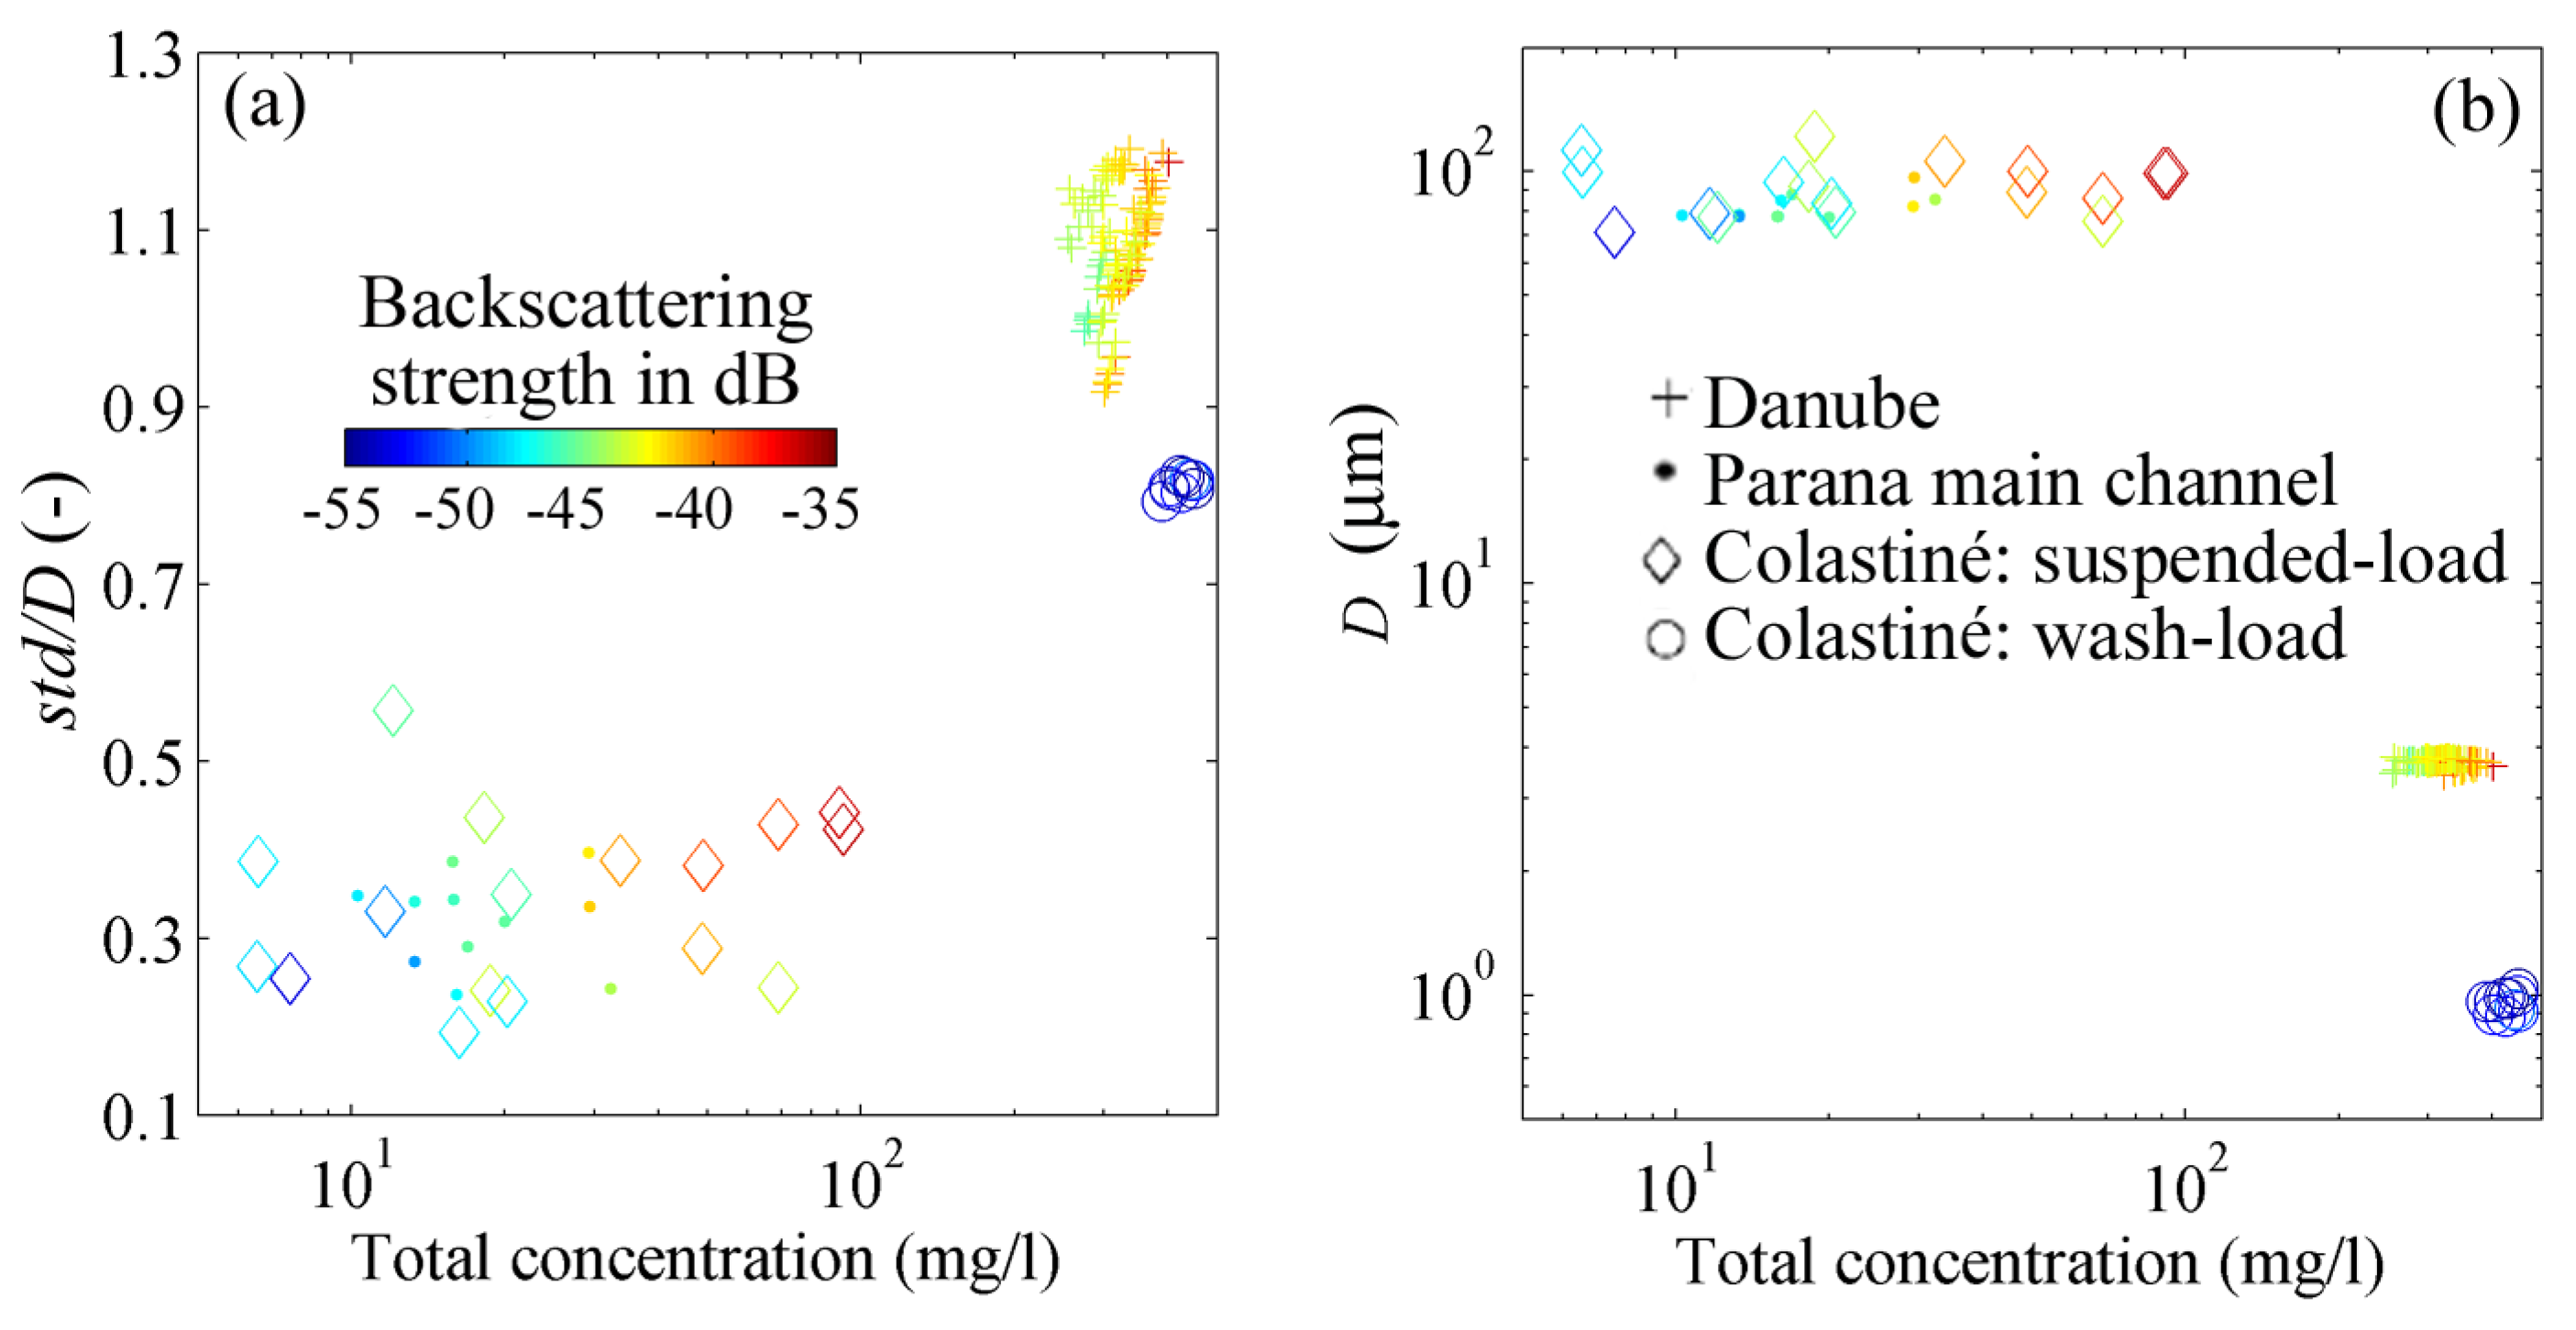
3.1. Results from Samples

The resulting PSDs from Danube samples spanned a clay-silt range with a negligible amount of fine sand particles, whereas the typical bimodal distribution including clay-silt and fine-medium sand was observed in the Parana system. In this case, the clay-silt contents from the Colastiné River were analyzed and presented apart from the sand suspended from riverbed that are here referred in short as wash-load and suspended-load, respectively, where the latter is, in fact, the suspended load of bed material.
It is worth noting that, in the acoustic theory, the PSD, p(a), as it is reported in Subsection 2.2, refers to the number size distribution rather than to the volume (or weight) size distribution which is used in sedimentological studies. Number and volume distributions may be rather different especially for prevailing amounts of clay-silt fractions over sand because a large amount of small particles results in the same volume as only a few coarse particles. This was evident for PSDs from the Danube and for wash-load content characterizing the Parana secondary reach Colastiné, as for the subset reported in Figure 4 and Figure 5, and as it can be seen for the entire dataset in Table 1.
Figure 4. Subset of four PSDs (two minutes averaged) from LISST-SL point measurements in two verticals with different water depths in the Danube River at Esztergom.
Water 08 00013 g004
Figure 5. Subset of four PSDs from analysis of wash-load contents: point samples in two verticals with different depths in the secondary reach Colastiné of the Parana system.
Water 08 00013 g005
Table 1. Particle size distributions (PSDs) first and second order moments averaged among entire datasets.
DatasetParticle Size Number Distribution, p(a)Particle Size Volume Distribution
Mean Size, D (μm)Standard dev., std (μm)std/D (-)Geometric Mean (μm)Geometric std (-)
Danube3.74.01.128.02.2
Colastiné (Parana): wash-load1.00.80.86.72.8
Colastiné (Parana): suspended-load92.131.50.3117.41.3
Parana main channel: suspended-load82.526.30.3105.71.4
The PSDs first and second order moments (i.e., particles mean size diameter, D, and standard deviation, std) averaged among the entire datasets (Table 1) gave evidence on the distributions observed in the Parana system and corresponding mechanisms of sediment transport. Clay-silt fractions were observed in almost homogenous concentrations (Table 2) with a change smaller than 15% of the averaged values among different positions across the channel and water depths. This spatial homogeneity reflects large temporal-spatial lag between sediment source and measurement positions. This is typical for the wash-load mechanism: fine sediment is eroded from watershed slopes and is then diffused in full suspension along the river channel up to the wetlands and the delta. In the Parana system, the lack of correlation between local conditions and wash-load rates is particularly evident.
Table 2. Significant values of total concentrations in mg·L−1 from field campaigns.
DatasetMinimumMeanMaximum
Danube256326401
Colastiné (Parana): wash-load389426449
Colastiné (Parana): suspended-load6.534.892.4
Parana main channel: suspended-load10.319.332.2
This spatial homogeneity was also observed in the Danube dataset, although to a lower degree. A 44% maximal variation among concentrations was resulted from LISST-SL punctual measurements (Table 2). It should be noted that this variation is only related to spatial gradients, since measurements were operated in a single campaign with almost steady flow conditions. Indeed, for the Danube case, the first order momentum of the number PSD averaged over the entire dataset and the geometric mean of corresponding volume distribution were 3.7 and 28 μm, respectively, while the same parameters resulted equal to 1.0 and 6.7 μm when considering the wash-load content (i.e., clay-silt classes) for samples from the Parana system (Table 1). Therefore, slightly coarser fractions were observed with spatial gradients in the concentration field that may corroborate the hypothesis of re-suspension events of fine sediment mixed in the gravel bed at the investigated section of the Danube River.
Sand suspended from the riverbed presented much more heterogeneous patterns both when looking to values from punctual samples in Parana secondary reach Colastiné (Figure 6) and from depth-averaged samples from the main channel of the Parana River (Figure 7). In both cases, concentration variations doubled the corresponding mean values (Table 2). For the Colastiné dataset, the sand concentration variation reached values more than two times the average value, that may reflect (i) relevant vertical gradients, such as those described by Einstein–Rouse profiles [43] for sediment concentration suspended from the riverbed; and (ii) different conditions investigated.
Sand fractions presented a well sorted PSD whereas clay-silt particles resulted in more broad distributions, both when considering number and volume distributions. The standard deviation to mean size ratio, as reported in Table 1, is a useful parameter to account for number distribution sorting in acoustical studies. A value of std/D close to 0.1 reflects almost mono-size distributions as such in the case of sand suspended from the Parana and Colastiné riverbeds, while values around unit mean poorly sorted PSDs, which was the case for the Danube measurements and the wash-load content from Colastiné samples.
Figure 6. Subset of four PSDs from analysis of sediment suspended from the riverbed: samples in two verticals with different depths in the secondary reach Colastiné of the Parana system.
Water 08 00013 g006
Figure 7. Subset of two PSDs from analysis of sediment suspended from the riverbed: depth-averaged samples of two verticals with different water depths in the main channel of the Parana River at Rosario bifurcation.
Water 08 00013 g007

3.2. Backscattering Coefficient and Viscous-Scattering Attenuation Normalized Coefficients

Given an acoustic frequency, the backscattering coefficient and viscous-scattering attenuation normalized coefficients (Ks2, ζsv and ζss, respectively) vary with the number PSD, which is in agreement with equations reported in the subtopic 2.2. As already mentioned, these variations deteriorate the backscattering strength to concentration correlation.
Aiming to analyze this effect for a typical ADCP frequency, Equations (2)–(13) were applied, with the direct problem approach, to assess the acoustic coefficients at 1200 kHz, for (i) two minutes average number PSDs from point measurements by LISST-SL in the Danube River; and (ii) number PSDs from physical samples in the Parana River main channel and the Colastiné River. In this latter case, acoustic coefficients were evaluated both for wash- and suspended-load contents.
The assessed values of backscattering coefficients and viscous-scattering attenuation normalized coefficients are reported in Figure 8 together with the coefficient functions characterizing mono-size suspension for 600, 1200 and 8000 kHz frequencies. In addition, the same coefficients were also assessed at 1200 kHz frequency for a variety of synthetic number distributions that simulate the effect of a broad variability in particles sizes. These synthetic number distributions were generated with lognormal distributions (Figure 9a,b), characterized with pretty different ratios of the standard deviation over the corresponding mean size (Figure 9c), although they were sorted in four families with fixed standard deviations of 2, 4, 18 and 28 μm.
Figure 8. (a) Backscattering coefficient; (b) scattering attenuation normalized coefficient and (c) viscous attenuation normalized coefficient: values at 1200 kHz among measured number PSDs, functions at three frequencies (600, 1200 and 8000 kHz) for mono-size suspension and values at 1200 kHz for synthetic number PSDs (Figure 9) characterized with fixed values of the std (2, 4, 18 and 28 μm).
Water 08 00013 g008
The samples from the Parana system resulted in very different coefficients depending on the considered portion of the typical bimodal distribution and regardless the sampling method (i.e., depth-integrated and point sampling), the actual river section and the occurring hydraulic conditions (Figure 8a). On average, the backscattering coefficient for sand suspended from the riverbed was resulted two orders of magnitude higher than the backscattering coefficient for the wash-load content spanning clay-silt fractions, as observed in the Colastiné River. In addition to that, the wash-load content, on average, presented a backscattering coefficient that was several orders of magnitude larger than the value for the corresponding mean size (i.e., the value for the 1200 kHz mono-size function). On the contrary, the actual contents of sand from Parana main channel and Colastiné River resulted in backscattering coefficients very close to corresponding values for mono-size distributions.
Figure 9. Generated lognormal number distributions (i.e., synthetic PSDs) for (a) clay-silt fraction and (b) sand fraction; (c) Particle mean sizes and corresponding standard deviation over mean size ratios for the synthetic PSDs.
Water 08 00013 g009
This difference in the changing rate of the backscattering coefficient when passing from mono-size to actual distributions was clearly related to the value of standard deviation over mean ratio, which changed from 0.2–0.4 to about 0.8 when passing from the suspended-load to wash-load contents (i.e., from sand to clay-silt PSDs). Indeed, the synthetic number distributions, characterized with fixed values of the standard deviation, clearly show an increasing deviation of the backscattering coefficients from the corresponding values characterizing the mono-size function, that is for mean size decreasing, entailing larger std over D ratio too.
The values from Danube samples presented a similar deviation for the mono-size function but with an almost fixed mean grain size and changing standard deviation among different measurement points. In a similar way as for the wash-load content from Colastiné samples, appreciable values of std over D ratio were related to much larger backscattering coefficients than those for the 1200 kHz mono-size function.
Both for Colastiné wash-load content and Danube measurements, the std/D ratios of 0.8–1.2 resulted in four orders of magnitude larger backscattering coefficients than the corresponding mono-size values. Those deviations were in the order of the mono-size function upward displacement when passing from 1200 to 8000 kHz frequency. Therefore, the backscattering coefficient values predicted by sloped mono-size functions in Figure 8a appeared unreliable in the case of samples characterized with significant std/D ratios that were typical for clay-silt content. On the contrary, mono-size functions remained accurate for the prediction of backscattering coefficients, corresponding to sand contents such as those for observed PSDs of suspended-load from the Parana and Colastiné riverbed.
Scattering and attenuation normalized coefficients resulted in different patterns. This difference reflects the two mechanisms of attenuations. The scatter attenuation is due to the acoustic cross-section of particles that scatter sound out from the projected beam, whereas the viscous attenuation is produced by an oscillation-friction process that is in relation with particles mass and oscillation frequency coupling rather than to scattering effectiveness of particles. Therefore, the resulting pattern for the scattering attenuation normalized coefficient (Figure 8b) reflected the same variations of the backscattering coefficient (Figure 8a), while the viscous attenuation is characterized with a different pattern (Figure 8c).
Viscous attenuation appeared to be less sensitive, both to frequency and PSD heterogeneity; e.g., the difference between scattering and viscous attenuation coefficients noticeably increase when passing from 600 to 8000 kHz frequency, for a given D, because of scatter attenuation boost rather than the change of viscous normalized coefficient.
Although the larger sensitivity to actual PSDs, the scattering attenuation normalized coefficient, on average, was one and three orders of magnitude lower than the corresponding viscous coefficient when considering the Danube measurements and the wash-load content in the Colastiné River, respectively.
In addition, in the case of attenuations, the std/D ratio could be correlated to coefficients deviations from corresponding values of 1200 kHz mono-size functions, although with a lower magnitude and an inverse proportionality for the viscous normalized coefficient. Actually, the deviations for sampled sand fractions appeared negligible (Colastiné suspended-load and Parana main channel in Figure 8b,c), while increasing std/D values for wash-load content from Colastiné and Danube rivers resulted in noticeable increase and slight drop for backscattering and viscous coefficients, respectively, with respect to corresponding mono-size values.
It is worth noting that the backscattering and attenuation normalized coefficient magnitudes will have a different weight in Equation (1), although they have the same unit such as reported in Figure 8a–c. This is because the backscattering coefficient fixes the received intensity that is a continuous function, whereas the normalized scattering and viscous attenuation coefficients define the exponential attenuation in Equation (1), which require a finite beam length to effectively reduce the received intensity. In other words, magnitudes in Figure 8a may not be compared to the corresponding magnitudes in Figure 8b,c. To eventually argue the importance of sound attenuation versus backscattering strength, that comparison should consider the actual spatial gradients, such as it is discussed in more detail in the following sections.

3.3. Backscattering Strength and Viscous-Scattering Attenuation Coefficients

The echo intensity levels (in the left hand side of Equation (1)) measured by an ADCP in a dB scale are usually related to the backscattering strength and sound attenuations due to suspended sediments (in the right hand side of Equation (1)). These are, in turn, related to sediment features as reported in Equations (2)–(16). These relations enable the assessment of sediment features from ADCP recordings, which is refereed to as the inverse problem solution.
Aiming to discuss the possibility of using different ADCP methods for the suspended sediment investigation, in this work, we solved the direct problem. That consisted in the assessment of backscattering strength and attenuation coefficients by means of Equations (2)–(16), on the basis of collected number PSDs in the Parana and Danube rivers and by fixing the typical ADCP frequency of 1200 kHz. The assessed values of backscattering strength and attenuation coefficients resulted in different patterns depending on the actual concentration, the particles mean size, D, and the corresponding std/D ratio as observed in the field (Figure 10 and Figure 11). These patterns clarify the actual possibility of using an ADCP method, eventually solving the inverse problem.
Regarding samples from the Parana system, the assessed backscattering strength appeared well correlated to measured suspended sand concentration (i.e., 0.86–0.87 in Table 3). In a similar way, statistically significant and high correlations arose between scatter-viscous attenuations and sand suspended from the riverbed; however, these attenuations resulted with moderate magnitude (Figure 11) when compared to the backscattering strength variation. Indeed, for the conditions during surveys and regardless the sampling method used (i.e., depth-averaged and point samplers), a 20 dB overall change of the backscattering strength (Figure 10a) corresponded to two orders of magnitude variation in suspended sand concentration (i.e., from 6 to 120 mg/L). The actual PSDs level of sorting of sand fractions did not appear as a relevant parameter in affecting the resulting backscattering strength. Indeed, the std/D ratio was low and almost uniform among samples with pretty different concentrations. This means, in other words, that the deviation for mono-size function is negligible (Figure 8a). In addition to that, for sand content in samples from the Parana system, weak correlations (0.36–0.64 in Table 3) may be argued between the assessed backscattering strength and PSD first moment, i.e., sand mean grain size, although this was statistically significant and with a larger value in the case of the Parana main channel (0.64 in Table 3).
Table 3. Correlations among acoustic variables (reported in the first line) and corresponding sediment features (i.e., concentration, D and std/D) for different datasets (from Danube and Parana rivers); note that the statistically significant correlations are reported with a bold font and underlined font is used for correlations corresponding to most relevant acoustic features, which are the assessed backscattering strength with appreciable variation (5–20 dB) and viscous attenuation with moderate-high magnitude (0.1–0.4 dB/m) as reported in Figure 10 and Figure 11.
DatasetBackscattering StrengthScattering Attenuation CoefficientViscous Attenuation Coefficient
Danube0.690.630.49Concentration
−0.20−0.21−0.11D
0.170.16−0.64std/D
Colastiné (Parana): wash-load0.100.190.80Concentration
−0.73−0.670.30D
0.100.170.08std/D
Colastiné (Parana): suspended-load0.860.910.96Concentration
0.360.27−0.11D
0.460.440.14std/D
Parana main channel: suspended-load0.870.860.97Concentration
0.640.700.48D
0.360.34−0.17std/D
In the case of wash-load contents from the Parana secondary reach Colastiné, the assessed backscattering strength and attenuations resulted in almost constant values (Figure 10 and Figure 11), which entails a scarce usefulness in correlating the sediment features with backscattering strength and attenuations, although significant correlations arose with mean size and concentration (Table 3), which was particularly relevant (equal to 0.80) for the viscous attenuation.
Figure 10. Assessed backscattering strength among samples (a) for changing concentration and standard deviation over corresponding mean size ratio, std/D, and (b) for changing concentration and mean size, D.
Water 08 00013 g010
Regarding the Danube case, the backscattering strength changed in the range from about −45 to −40 dB among suspended sediment point measurements (Figure 10), and appeared mainly correlated to clay-silt concentration variation (0.69 in Table 3). In addition, some significant correlations may be argued between attenuations and sediment features, although the scatter attenuation is not relevant when compared to the assessed backscattering strength variation. On the contrary, the viscous attenuation may rise to comparable values to backscattering strength.
It should also be noted that, in the case Danube dataset variations are related to spatial gradients only, since measurements were operated in a single campaign with almost steady flow conditions. In this case, a more heterogeneous spatial distribution of fine sediment was reflected in the noticeable (equal to 0.69) correlation between backscattering strength and fine sediment concentration, which was not the same for clay-silt content in the Colastiné river (0.10 in Table 3). Indeed, for the investigated section of the Danube River, slightly coarser fractions were observed with spatial gradients in the concentration field that may corroborate the hypothesis of re-suspension events of fine sediment mixed in the sand-gravel bed.
The magnitude of scattering attenuation coefficient (Figure 11a,b) appeared negligible (i.e., three-four orders of magnitude lower) when compared to corresponding backscattering strength variation, although well-defined correlations with suspended sediment features occurred (Table 3), similar to the corresponding backscattering strength values (compare Figure 10a,b to Figure 11a,b, respectively). This similarity reflects the same nature for backscatter and scatter attenuation processes (Figure 8a,b).
Figure 11. Assessed scattering attenuation coefficient among samples (a) for changing concentration and standard deviation over corresponding mean size ratio, std/D, and (b) for changing concentration and mean size, D; Assessed viscous attenuation coefficient among samples (c) for changing concentration and standard deviation over corresponding mean size ratio, std/D, and (d) for changing concentration and mean size, D.
Water 08 00013 g011
On the contrary, the viscous attenuation coefficient values in dB/m presented larger magnitudes (0.4 dB/m as a maximum for the wash-load content in the Coalstiné River, Figure 11c,d) and different patterns from scattering attenuation coefficient values, which is in agreement with the difference among attenuation functions (Figure 8b,c). In more detail, the assessed viscous attenuation coefficient appeared negligible (0.04 dB/m) for suspended sand from the riverbed in the Parana system. Differently, for fine sediment from the Danube and Colastiné rivers, maximum viscous attenuation coefficients in the order of 0.1 and 0.4 dB/m, respectively, may rise to a two-way round-trip attenuation with comparable values (in dB) to backscattering strength variations for “Danube” and “Colastiné: suspended-load” in Figure 10a,b, for the case of acoustic beams ranging in the order of 20–30 m.

4. Discussion

The use of ADCPs for suspended sediment assessment in river applications is attractive because acoustic beams are ranging from remote positions (i.e., from water surface and river side bank). This simplifies field procedures, prevents the measurement volume from disturbance, which is typical for standard sampling techniques, and enables the sediment transport monitoring during high level conditions when direct sampling is unsafe or not possible. Despite these clear advantages, the assumptions regarding the applied backscatter and sound attenuation models may restrict the applicability of acoustic methods. Indeed, the usually applied semi-empirical models (Equations (1)–(13)) were mostly derived for coastal applications, where suspended particles are well rounded and sorted within the sand spectrum. Differently, rivers present heterogeneous sediments, depending on the actual sedimentological, hydrological and hydraulic conditions. In addition to that, in riverine applications, the mean water depth usually fixes the acoustic beam range that depends again on the specific study site and may span from 0.1 to 10 m as an order of magnitude.
Since sound scatter and attenuation determine the measurement range of an ADCP, also the combining of river heterogeneities in terms of sediment features and water depth may give rise to not a trivial pursuit when trying to infer suspended sediment concentrations by using ADCP echo profiling. This encouraged a thriving of a variety of different methods, which are tailored on specific sedimentological, hydrological and hydraulic conditions with the shortcoming of being site specific. Although this may be still useful to solve specific problems, scientifically speaking, guidance should be given regarding the applicability of each method, which requires a clear explanation on features and limitations of the applied backscatter-attenuation method with respect to actual conditions and instrument frequency and deployment (i.e., down- or side-looking instruments).

4.1. Implications of the Acoustic Features Assessed from the Observed PSDs

The backscattering coefficient and sound attenuation normalized coefficients depend on the actual PSD that is particularly relevant for the bimodal distribution typical for river sediment, with clay-silt content usually forming the wash-load portion of suspended sediment and the remaining part being sand transported in full suspension. This was in our study the case for the Parana system, where sand concentration suspended from the riverbed clearly dominated the resulting backscattering strength (“Parana main channel” and “Colastiné: suspended-load” in Figure 10), while the clay-silt content resulted in appreciable viscous attenuation coefficient (“Colastiné: wash-load” in Figure 11c,d). In addition to that, the actual PSD differently affected the acoustic coefficients: the sand content may be investigated by assuming the backscattering coefficient, Ks2, of mono-size distributions entailing small changes in the representative mean size. On the contrary, the deviation for mono-size values of the acoustic coefficients (Ks2, ζsv and ζss) appeared relevant for the case of clay-silt content.
Despite this, the high concentration of fine fractions resulted in negligible variations of backscattering strength and moderate values of scattering attenuation coefficient. On the contrary, viscous attenuation coefficients of observed clay-silt concentrations may result in comparable dB values to sand backscattering strength variation (with a magnitude changing in the range of 35–55 dB), although this would require long acoustic beams (i.e., 20–30 m) such as it would be possible with horizontally aligned beams projected by a side-looking ADCP. However, side-looking deployment in the Parana River appears particularly challenging, while the use of down-looking ADCPs to measure river discharge is a standard practice.
It is worth noticing that using a down-looking ADCP in the Parana River would limit the acoustic beams on average to 5 and 8 m for secondary and main channels, respectively, which would also result in a moderate value for the two-way round-trip attenuation (in dB) due to viscous attenuation. This occurrence was exploited in previous studies by using a single frequency ADCP working at 1200 and 600 kHz, which produced reliable correlations between sand concentrations and measured echo levels [15], and between mean grain sizes of suspended sand and the ratios of echoes for those two frequencies [13].
Furthermore, in the case of the large Parana system, the correlation assessed between viscous attenuation coefficient and clay-silt concentration (Table 3) was limited by a small variation in fine sediment concentration, although field campaigns encompassed different hydraulic conditions. This occurrence may be related to the huge extension of the Parana system that somehow produces a homogenous base flow of very fine sediment (i.e., clay), relaxing the need of including clay-silt acoustic effects on the calibration of profiled echoes to investigate suspended sand, although this calls for further studies on the Parana system.
In the Danube case study, sand was not observed in full suspension by using the LISST-SL, and the backscattering strength appeared dominated by suspended clay-silt. A further research effort using a 1200 kHz ADCP to track suspended sediment concentration would require the assessment of the actual PSD backscattering coefficient, Ks2. In fact, in this case, the backscattering coefficient of a mono-size distribution characterized with the particles mean size of the measured PSD was three to four orders of magnitude lower. This occurrence would produce a not reliable correlation between concentrations and backscattering strengths. In this case, therefore, there is a need of a priori information about the actual PSD. In addition, the viscous attenuation coefficient appeared inverse correlated to std/a ratio characterizing the measured PSD (Table 3). In spite of that, the same arguments regarding beam range as the Parana case may be exhibited for viscous attenuation relevance with respect to corresponding backscattering strength variation in the Danube case. In this case, the beams projected by a down-looking ADCP would be limited even more, resulting into lower water depths (6 m on average) that would keep the two-way round-trip attenuation moderate.

4.2. Recommendations

Aiming to assist ADCP users on the basis of our findings, basic recommendations are discussed regarding instrument deployment (i.e., down- or side-looking ADCP) and frequency, the advantage of using multi-frequency, the need for a priori grain size information and the need for ADCP calibration. This discussion does not pretend to be exhaustive, indeed other sources of scatter and attenuation such as organic material, flocculated particles and sediment specific shapes (e.g., stick-shaped) are not encompassed in our study.
Furthermore, it is worth noting that the assessment of sediment features from ADCP recordings requires applying inverse method to solve Equation (1). These methods depend on the expected spatial gradients of sediment concentration as well as on the instrument frequency-deployment, although our work has not included the solution of the inverse problem. The inversion methods may be implicit or explicit [24], the attenuation due to suspended sediment may be neglected [13] or the concentration profile is assumed homogeneous [18].
Our discussion is conducted regarding the performed analysis of acoustic features of samples which were observed in the field (i.e., the direct problem solution).
When using typical ADCP frequencies with a down-looking deployment, the vertical profiling results in shorter ranges than the distance for a complete signal attenuation (i.e., the distance for which the signal is significantly attenuated up to the noise level) because actual water depth limits the beam ranging. In addition to that, vertical gradients of sediment suspended from the riverbed likely result in relevant backscattering strength variations along acoustic beams with a negligible-moderate effect of sound attenuation due to sediment. In this case, the echo level recording from an ADCP may be successfully correlated to the concentration of suspended sand from the riverbed, neglecting or not, the viscous attenuation due to clay-silt fractions, which depends on the actual concentration of fine fractions. This is the case of tracking sand contents across a river section for a given hydro-sedimentological condition lasting the time of survey. The concentration of fine fractions is not acoustically investigated, although its effect on the used correlation should be carefully evaluated especially when considering sand concentration values from field campaigns performed with different hydro-sedimentological conditions that are likely characterized with different contents of clay-silt fractions.
Side-looking deployment usually extends the acoustic beams to the ranging distance for a complete signal attenuation, at the same time horizontal alignments at a given level in a river cross section are likely characterized with a homogenous concentration of suspended sediment. In this condition, the range length depends on sound dissipation and the variation of echo level profile may be correlated to clay-silt concentration change among time.
The instrument frequency may be fixed to boost the backscattering strength from sand or the viscous attenuation coefficient due to clay-silt particles. ADCP typical frequencies span the range from 500 to 3000 kHz that means a particle diameter changing from about 900 to 150 μm for the wave number-particle radius product, x, equal to unity, which indicates the particle size of maximum scatterng effectiveness among an actual PSD at a given frequency. On the other hand, the viscous attenuation is not as much sensitive to a frequency change as the scatter processes (i.e., backscattering strength and scattering attenuation coefficient); the viscous attenuation coefficient presents a maximum in the clay-silt range with a moderate shift towards fine particles for the higher frequency (see functions for mono-size suspension in Figure 8).
Therefore, the using of a specific frequency may be driven by the expected contributes in Equation (1), eventually decoupling sand backscatter from clay-silt viscous attenuation. For example, this is the case of dominant backscattering strength from fine sand when using a 1200 kHz ADCP (D = 380 μm, for x = 1) in a large river with a relatively low contribution of viscous attenuation due to clay-silt concentration. On the contrary, using a low frequency may noticeably reduce the backscatter from sand, which would rise the weight of clay-silt viscous attenuation in Equation (1).
The dependence of Equation (1) on frequency is further elaborated in a multi-frequency approach [21], which is based on backscattering strength dependence on x in a transitional region between the Rayleigh and geometric scatter regions. In this region, characterized with x close to unit, and for moderate attenuation due to suspended sediment, Equation (1) may be inverted to assess the mean size of scattering particles. For ADCP frequencies, this region is represented by fine-medium sand; therefore, this multi-frequency approach was used to characterize the mean size of suspended sand from a riverbed [13]. It is worth noting that for sand fractions, the acoustic coefficients in Figure 8 are well predicted by mono-size functions. In other words, in conditions of dominant backscattering strength of a given concentration of sand particles, a variation in Equation (1) should only be related to sand particles mean size variation.
A priori information about the actual PSD which has to be investigated may be extremely useful to choose the most appropriate acoustic system and method; however, too detailed information may appear wasteful. This simplifies as consequence the inversion of Equation (1) as well.
Indeed, one relevant objective of using an ADCP for sediment transport assessment is to simplify operations in the field and laboratory, which are usually required to measure detailed and reliable PSDs, and, at the same time, measuring streamflow discharge. In this perspective, while isokinetic-physical sampling and laboratory analysis remain the most appropriate techniques, the ADCP may be applied to extrapolate among time and space.
On the other hand, aiming to solve the inverse problem for a variety of hydro-sedimentological conditions without information about the actual PSD, an acoustic system may be implemented to span a large set of frequencies and beam ranges. This would eventually enable the application of different inversion methods for the investigation of a wide range of particles spanning from clay to sand, although this appears beyond the ADCP capabilities.
Indeed, a reasonable objective for an ADCP application in rivers may be the quantification of sand and clay-silt contents, at the same time, with a decoupled backscattering strength-viscous attenuation approach, by using multiple frequencies, although this will require further research efforts. However, this will not produce a detailed PSD such as from laboratory analysis and from the LISST-SL, but an estimation of two wide classes that may reflect wash-load and suspended-load of bed material.
The LISST-SL already provides a detailed PSD within a limited time in the field/laboratory, although the sampling effort remains. Indeed, the measurement range is 2.07–350 μm with limitations on the actual concentrations: inaccuracies may rise from multiple light scatter and too low scatter, which fix low and high threshold concentrations, respectively [44]. These limitations rise doubts on the opportunity of having detailed PSDs carefully profiled with punctual sampling by a LISST-SL rather than an estimation of sand and clay-silt concentrations along beams by applying an acoustic method. Further speculating on that, the two technologies (i.e., laser and acoustics) may be usefully integrated.
A need of calibrating an ADCP is given, strictly speaking, regarding the assessment of the instrumental parameter Kt in Equation (1). Although this should be retrieved by means of laboratory tests, in the instrument setting and from the manufacturing, where it is a common practice to calibrate Kt by solving the direct problem by measuring the actual PSDs and echo intensity levels at the same time in the field. Besides that, another common practice is to include unpredicted and not directly investigated contributes to Equation (1) in that calibration. This may be the case of a moderate contribution of clay-silt concentration when tracking sand by investigating the corresponding backscattering strength.

5. Conclusions

The evidence produced by analyzing heterogeneous datasets of suspended sediments from the Parana River and the Danube River, resulted in dominant spatial gradients of sand and clay-silt backscattering strength for the Parana reaches and the Danube, respectively. An important difference consists in the actual PSD importance: the mono-size distributions function of the backscattering coefficient was a good approximation for suspended sand from Parana system riverbed, while the actual PSD had to be considered for clay-silt in the Danube case.
In addition, samples from the Parana system presented a typical bimodal distribution reflecting wash- and suspended bed-material load transport mechanisms, whereas sand was not observed in sediment data collected in the Danube. Fine fractions resulted in appreciable viscous attenuation due to clay and silt for the Parana and the Danube, while the sound attenuation due to suspended sand from Parana riverbed was some orders of magnitude lower.
In spite of that occurrence, a moderate magnitude resulted for viscous attenuation along vertically oriented acoustic beams, which was small when comparing to the assessed variation of backscattering strength. Hence, using 600–1200 kHz down-looking ADCPs, with the beams range limited to water depth, would keep a low overall attenuation due to suspended sediment, which enables the application of tracking backscattering strength of suspended sand from the riverbed. In addition to that, it is worth noting that small changes in suspended clay-silt concentration (i.e., the wash-load content) observed in the Parana system were independent of the location and the hydraulic condition. This eases the challenge of considering the wash-load concentration while investigating backscattering strength by means of a down-looking ADCP.
On the contrary, aiming to boost the effect of clay-silt concentrations on profiled echoes in large rivers, beams of 20–30 m may be horizontally projected by side-looking ADCPs. This would result in a two-way round-trip viscous attenuation in the same order of the observed backscattering strength variation for both the Parana River and the Danube River.

Acknowledgments

We acknowledge the funding of Sándor Baranya from the János Bolyai fellowship of the Hungarian Academy of Sciences. A further thanks goes to the technical staff of the Department of Hydraulic and Water Resources Engineering, Budapest University of Technology and Economics for the support during the field measurements.

Author Contributions

Massimo Guerrero conceived this scientific contribute and wrote the paper. All the other co-authors equally contributed to this work; in particular, Nils Rüther, Stefan Haun and Sandor Baranya focused on the Danube case while Ricardo Szupiany and Francisco Latosinski focused on the Parana.

Conflicts of Interest

The authors declare no conflict of interest.

References

  1. Guerrero, M.; Re, M.; Kazimierski, L.D.D.; Menéndez, A.N.; Ugarelli, R. Effect of climate change on navigation channel dredging of the Parana River. Int. J. River Basin Manag. 2013, 11, 439–448. [Google Scholar] [CrossRef]
  2. Paarlberg, A.J.; Guerrero, M.; Huthoff, F.; Re, M. Optimizing Dredge-and-Dump Activities for River Navigability Using a Hydro-Morphodynamic Model. Water 2015, 7, 3943–3962. [Google Scholar] [CrossRef]
  3. Archetti, R.; Romagnoli, C. Analysis of the effects of different storm events on shoreline dynamics of an artificially embayed beach. Earth Surf. Process. Landforms 2011, 36, 1449–1463. [Google Scholar] [CrossRef]
  4. Carniel, S.; Sclavo, M.; Archetti, R. Oceanological and Hydrobiological Studies Towards validating a last generation, integrated wave-current-sediment numerical model in coastal regions using video measurements. Oceanol. Hydrobiol. Stud. 2011, 40, 1897–3191. [Google Scholar] [CrossRef]
  5. Domeneghetti, A.; Gandolfi, S.; Castellarin, A.; Brandimarte, L.; Di Baldassarre, G.; Barbarella, M.; Brath, A. Flood risk mitigation in developing countries: Deriving accurate topographic data for remote areas under severe time and economic constraints. J. Flood Risk Manag. 2014, 8, 301–314. [Google Scholar] [CrossRef]
  6. Guerrero, M. The investigation of sediment processes in rivers by means of the Acoustic Doppler Profiler. In Proceedings of the Bologna IAHS 2014—6th IAHS-EGU International Symposium on Integrated Water Resources Management, Bologna, Italy, 4–6 June 2014.
  7. Ceola, S.; Hödl, I.; Adlboller, M.; Singer, G.; Bertuzzo, E.; Mari, L.; Botter, G.; Waringer, J.; Battin, T.J.; Rinaldo, A. Hydrologic Variability Affects Invertebrate Grazing on Phototrophic Biofilms in Stream Microcosms. PLoS ONE 2013, 8. [Google Scholar] [CrossRef] [Green Version]
  8. Wild, T.B.; Loucks, D.P. Managing flow, sediment, and hydropower regimes in the Sre Pok, Se San, and Se Kong Rivers of the Mekong basin. Water Resour. Res. 2014, 50, 5141–5157. [Google Scholar] [CrossRef]
  9. Guerrero, M.; Nones, M.; Saurral, R.; Montroull, N.; Szupiany, R.N. Parana river sediment dynamics in the context of climate change. Int. J. River Basin Manag. 2013, 11, 423–437. [Google Scholar] [CrossRef]
  10. Guerrero, M.; Latosinski, F.; Nones, M.; Szupiany, R.N.; Re, M.; Gaeta, M.G. Sediment fluxes investigation for 2-D modelling of large rivers morphodynamics. Adv. Water Resour. 2015, 81, 186–198. [Google Scholar] [CrossRef]
  11. Simmons, S.M.; Parsons, D.R.; Best, J.L.; Orfeo, O.; Lane, S.N.; Kostaschuk, R.; Hardy, R.J.; West, G.; Malzone, C.; Marcus, J.; Pocwiardowski, P. Monitoring suspended sediment dynamics using MBES. J. Hydraul. Eng. 2010, 136, 45–49. [Google Scholar] [CrossRef]
  12. Guerrero, M.; Szupiany, R.N.; Amsler, M.L. Comparison of acoustic backscattering techniques for suspended sediments investigations. Flow Meas. Instrum. 2011, 22, 392–401. [Google Scholar] [CrossRef]
  13. Guerrero, M.; Szupiany, R.N.; Latosinski, F. Multi-frequency acoustic for suspended sediment studies: An application in the Parana River. J. Hydraul. Res. 2013, 51, 696–707. [Google Scholar] [CrossRef]
  14. Sassi, M.G.; Hoitink, A.J.F.; Vermeulen, B. Impact of sound attenuation by suspended sediment on ADCP backscatter calibrations. Water Resour. Res. 2012, 48. [Google Scholar] [CrossRef]
  15. Latosinski, F.; Szupiany, R.N.; García, C.M.; Guerrero, M.; Amsler, M.L. Estimation of Concentration and Load of Suspended Sediment in a Large River by Means of Doppler Technology. J. Hydraul. Eng. 2014, 140. [Google Scholar] [CrossRef]
  16. Rennie, C.D.; Millar, R.G.; Church, M.A. Measurement of bedload velocity using an acoustic Doppler current profiler. J. Hydraul. Eng. 2002, 128, 473–483. [Google Scholar] [CrossRef]
  17. Rennie, C.D.; Villard, P.V. Site specificity of bedload measurement using an acoustic Doppler current profiler. J. Geophys. Res. Earth Surf. 2004, 109. [Google Scholar] [CrossRef]
  18. Moore, S.A.; Le Coz, J.; Hurther, D.; Paquier, A. On the application of horizontal ADCPs to suspended sediment transport surveys in rivers. Cont. Shelf Res. 2012, 46, 50–63. [Google Scholar] [CrossRef]
  19. Moate, B.D.; Thorne, P.D. Measurement and inversion of acoustic scattering from suspension having broad size distributions. J. Acoust. Soc. Am. 2009, 126, 2905–2917. [Google Scholar] [CrossRef] [PubMed]
  20. Thorne, P.D.; Meral, R. Formulations for the scattering properties of suspended sandy sediments for the use in the application of acoustics to sediment transport processes. Cont. Shelf Res. 2008, 28, 309–317. [Google Scholar] [CrossRef]
  21. Hay, A.E.; Sheng, J. Vertical profiles of suspended sand concentration and size from multifrequency acoustic backscatter. J. Geophys. Res. 1992, 97, 15661–15677. [Google Scholar] [CrossRef]
  22. Wright, S.A.; Topping, D.T.; Williams, C.A. Discriminating silt and clay from suspended sand in rivers using side-looking profilers. In Proceedings of the 2nd Joint Federal Interagency Sedimentation Conference, LasVegas, NV, USA, 27 June–1 July 2010.
  23. Hanes, D.M. On the possibility of single-frequency acoustic measurement of sand and clay concentrations in uniform suspensions. Cont. Shelf Res. 2012, 46, 64–66. [Google Scholar] [CrossRef]
  24. Thorne, P.D.; Hanes, D.M. A review of acoustic measurement of small scale sediment processes. Cont. Shelf Res. 2002, 22, 603–632. [Google Scholar] [CrossRef]
  25. Thorne, P.D.; Hurther, D. An overview on the use of backscattered sound for measuring suspended particle size and concentration profiles in non-cohesive inorganic sediment transport studies. Cont. Shelf Res. 2013, 73, 97–118. [Google Scholar] [CrossRef] [Green Version]
  26. Latrubese, E. Patterns of anabranching channels: The ultimate end-member adjustment of mega rivers. Geomorphology 2008, 101, 130–145. [Google Scholar] [CrossRef]
  27. Drago, E.C.; Amsler, M.L. Bed sediment characteristics in the Paraná and Paraguay Rivers. Water Int. 1998, 23, 174–183. [Google Scholar] [CrossRef]
  28. Montagnini, M.D.; Prendes, H.H.; Schreider, M.I.; Amsler, M.L.; Martinez, H.L. Desarrollo de un muestreador de sedimentos en suspension integrador en profundidad. In Proceedings of the XVII Congreso Nacional del Agua, Santa Fe, Argentina, 3–7 August 1998; Volume 3, pp. 535–537.
  29. Guy, H.P.; Norman, V.W. Fluvial Sediment Concepts. In Techniques for Water Resources Investigations of the U.S. Geological Survey; USGS: Arlington, VA, USA, 1970. [Google Scholar]
  30. Gray, J.R.; Gartner, J.W. Technological advances in suspended-sediment surrogate monitoring. Water Resour. Res. 2009, 45. [Google Scholar] [CrossRef]
  31. Kumar, R.; Strom, K.; Keyvani, A. Floc properties and settling velocity of San Jacinto estuary mud under variable shear and salinity conditions. Cont. Shelf Res. 2010, 30, 2067–2081. [Google Scholar] [CrossRef]
  32. Baranya, S.; Józsa, J.; Török, G.T.; Rüther, N. A comprehensive field analysis of a river confluence. In River Flow 2012, In Proceedings of the International Conference on Fluvial Hydraulics, San José, Costa Rica, 5–7 September 2012; Munoz, R.M., Ed.; Taylor & Francis Group: London, UK, 2012; pp. 565–571. [Google Scholar]
  33. Baranya, S.; Józsa, J. Estimation of suspended sediment concentrations with ADCP in Danube river. J. Hydrol. Hydromech. 2013, 61, 232–240. [Google Scholar] [CrossRef]
  34. Gray, J.R.; Agrawal, Y.C.; Pottsmith, H.C. The LISST-SL streamlined isokinetic suspended-sediment profiler. In Proceedings of the Ninth International Symposium on River Sedimentation, Yichang, China, 18–21 October 2004; pp. 2549–2555.
  35. Agrawal, Y.C.; Mikkelsen, O.A.; Pottsmith, H.C. Grain Size Distribution and Sediment Flux Structure in a River Profile, Measured with a LISST-SL Instrument. Sequoia Scientific, Inc. Report 2012. Available online: http://www.sequoiasci.com (accessed on 30 October 2015).
  36. Guerrero, M.; Rüther, N.; Archetti, R. Comparison under controlled conditions between multi-frequency ADCPs and LISST-SL for investigating suspended sand in rivers. Flow Meas. Instrum. 2014, 37, 73–82. [Google Scholar] [CrossRef]
  37. Haun, S.; Rüther, N.; Baranya, S.; Guerrero, M. Comparison of real time suspended sediment transport measurements in river environment by LISST instruments in stationary and moving operation mode. Flow Meas. Instrum. 2015, 41, 10–17. [Google Scholar] [CrossRef]
  38. Medwin, H.; Clay, C.S. Fundamentals of Acoustical Oceanography; Academic Press: London, UK, 1998. [Google Scholar]
  39. Urick, R.J. Principles of Underwater Sound; Peninsula Publishing: Los Altos, CA, USA, 1997. [Google Scholar]
  40. Urick, R.J. The absorption of sound in suspensions of irregular particles. J. Acoust. Soc. Am. 1948, 20, 283–289. [Google Scholar] [CrossRef]
  41. Downing, A.; Thorne, P.D.; Vincent, C.E. Backscattering from a suspension in the near-field of a piston transducer. J. Acoust. Soc. Am. 1995, 97, 1614–1620. [Google Scholar] [CrossRef]
  42. RD Instruments. Using the 305A4205 Hydrophone to Identify the RSSI Scale Factors for Calibrating the Echo Strength Output of an ADCP, Technical note, FST-004 (August 1999). San Diego, CA, USA, 1999. Available online: http://www.comm-tec.com/Library (accessed on 30 October 2015).
  43. Rouse, H. Fluid Mechanics for Hydraulic Engineers; Dover Publications: New York, NY, USA, 1961. [Google Scholar]
  44. Czuba, J.A.; Straub, T.D.; Curran, C.A.; Landers, M.N.; Domanski, M.M. Comparison of fluvial suspended-sediment concentrations and particle-size distributions measured with in-stream laser diffraction and in physical samples. Water Resour. Res. 2015, 51, 320–340. [Google Scholar] [CrossRef]

