1. Introduction
Increasing water demand has led to water scarcity in many urban areas in the Mediterranean region. Indeed, population growth and the expansion of urban and industrialized areas has put great pressure on water resources. Climate change will intensify this pressure in some parts of the world, including the Mediterranean basin, Western United States and Southern Africa, resulting in a predicted decrease in water resources in the coming decades [
1]. In this context, developing strategies and systems to identify alternative water resources will become critical, as will improving water resources management and planning. Water desalination and recycling processes, together with intermittent water supply, have long been the most common technologies used to cope with water scarcity in urban areas, while the benefits of collecting and using rainwater have largely been ignored [
2,
3]. Nevertheless, rainwater has historically been the primary source of water for potable and non-potable uses in locations where water supply systems have not yet been developed, and has traditionally been employed in a variety of ways in new settlements and isolated homes [
4]. Because of their many environmental and economic advantages, rainwater harvesting (RWH) systems are currently receiving increased attention as alternative sources of drinking water, especially in semi-arid areas [
5,
6,
7], but also in urban areas [
8].
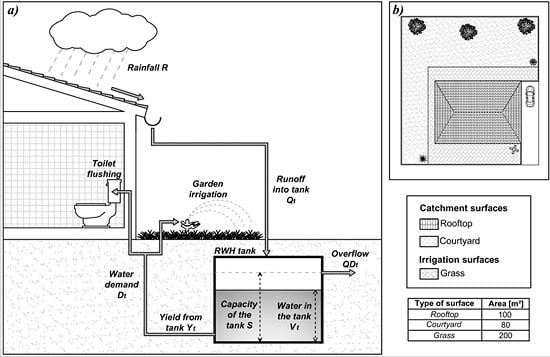
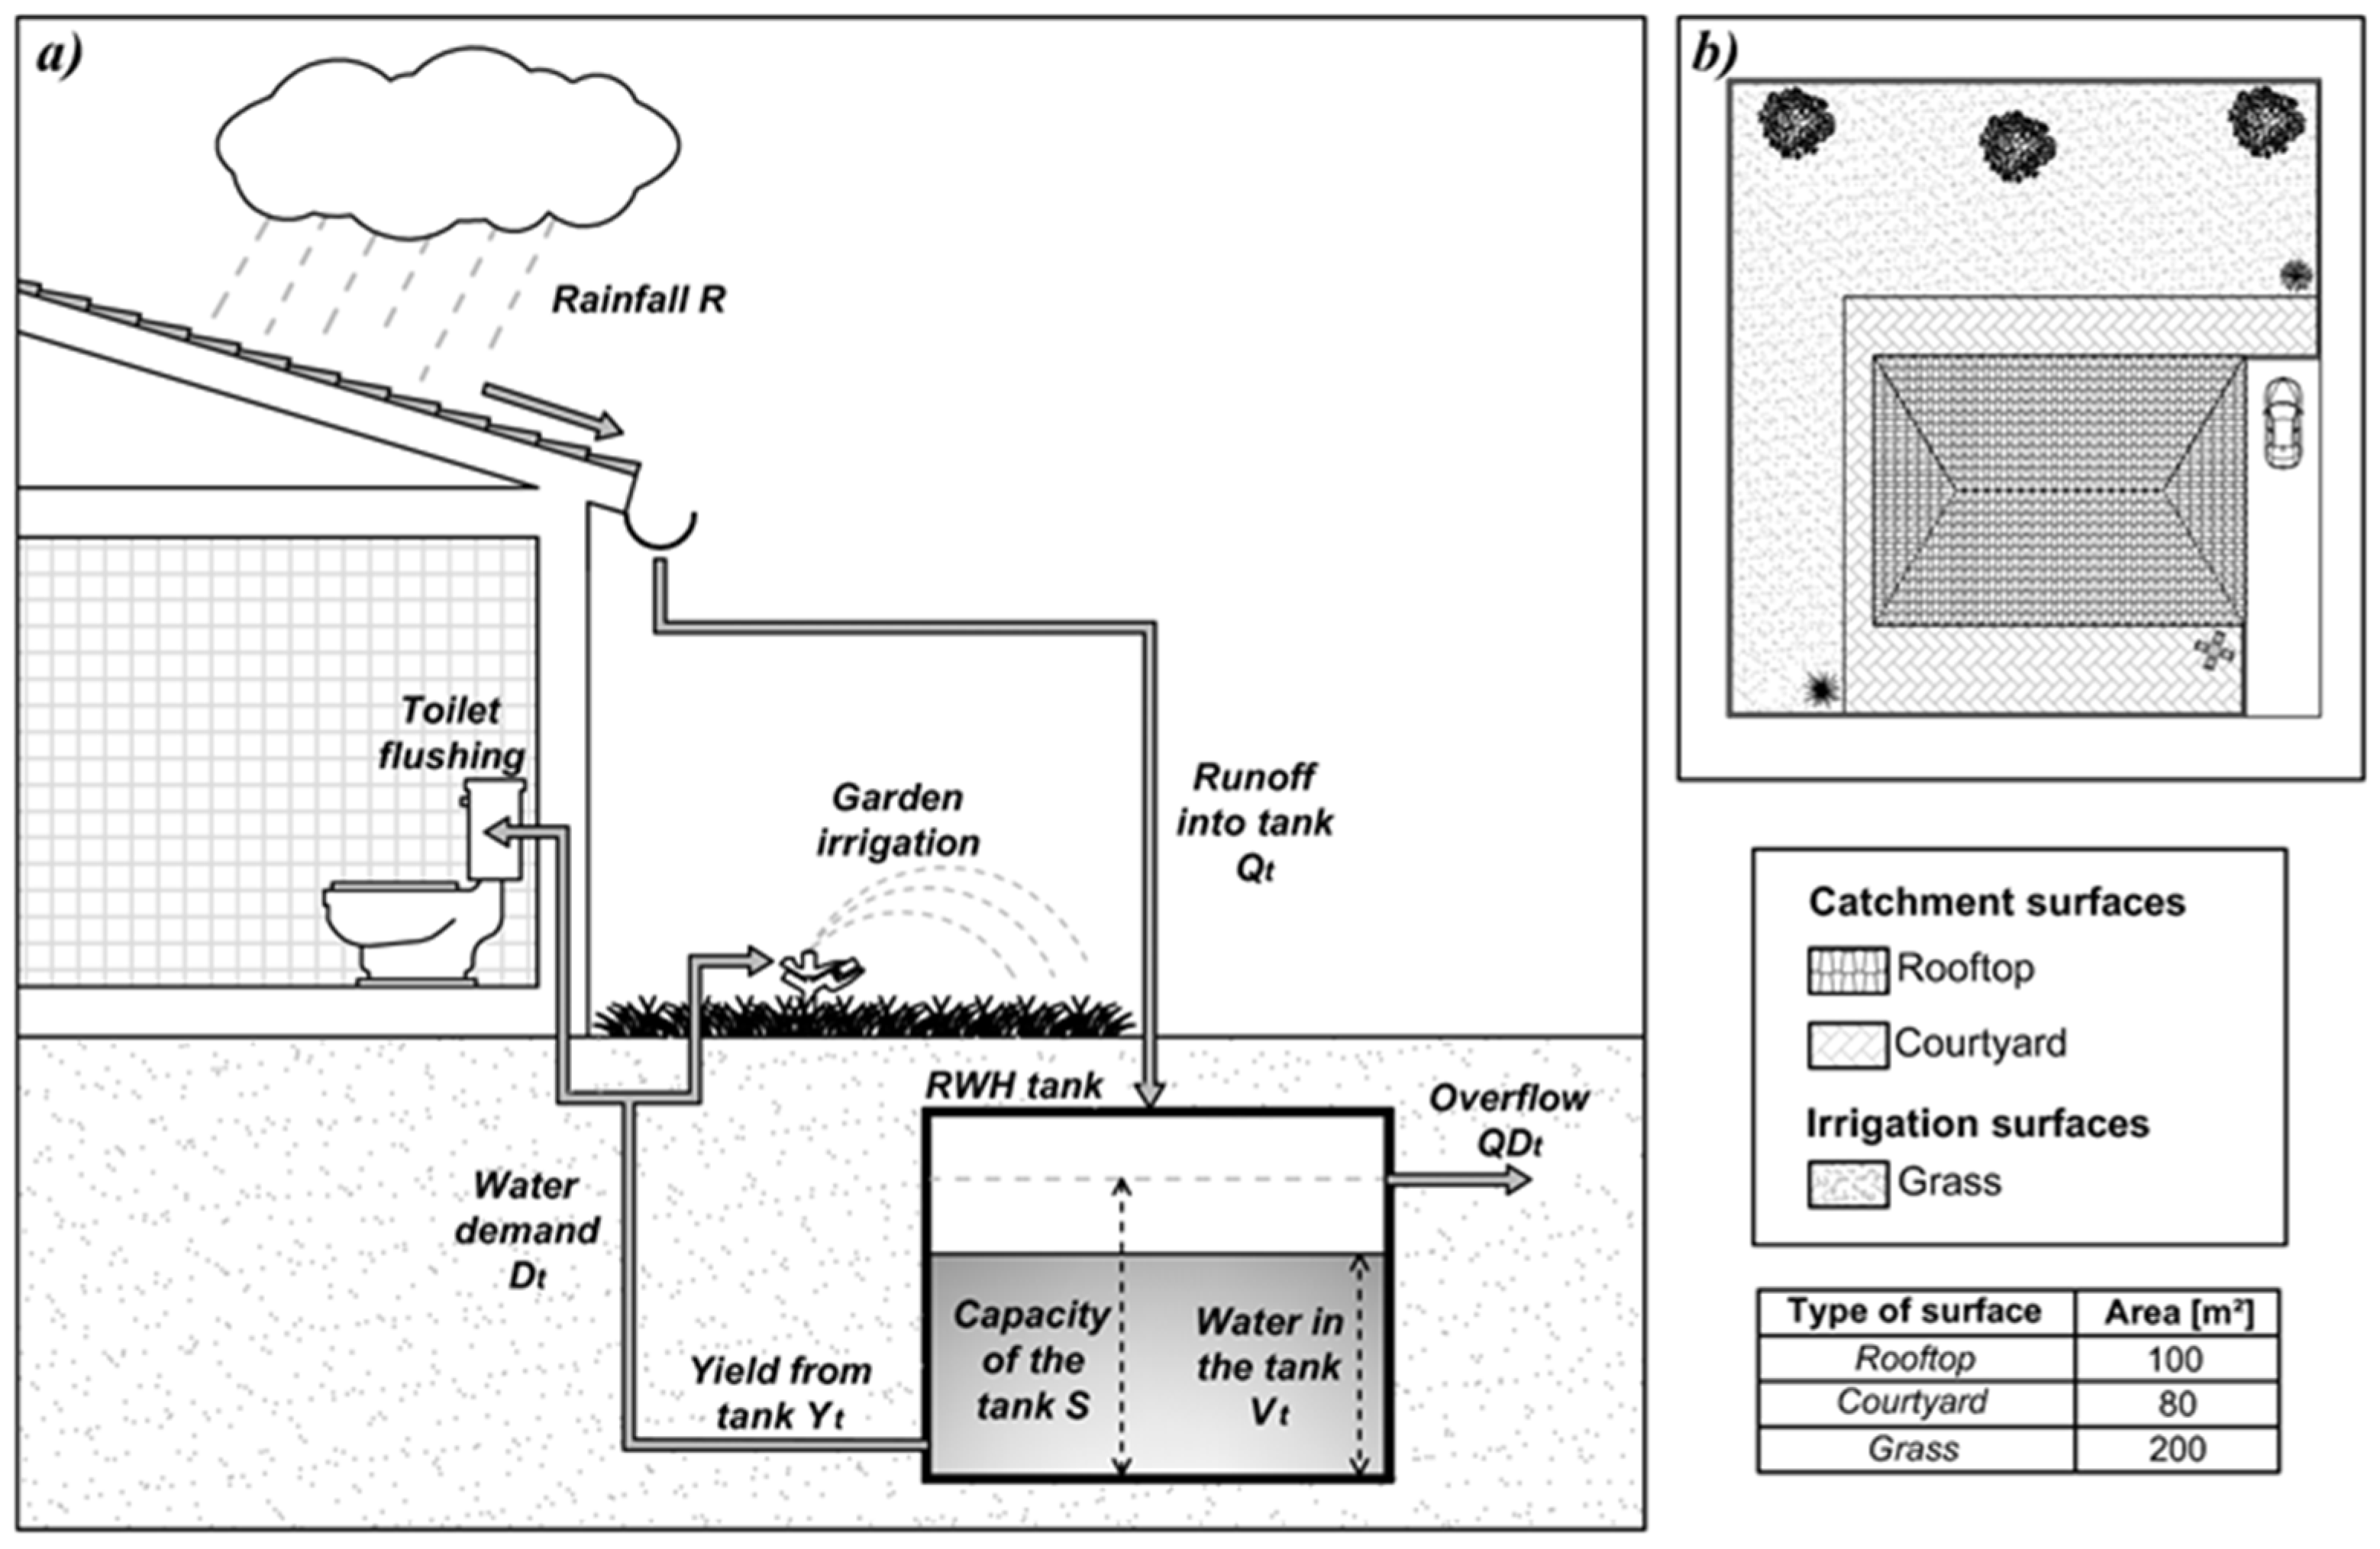
Generally, RWH systems involve three principal components: the catchment area, the collection device and the conveyance system. Rainwater is commonly collected from rooftops, courtyards or other compacted or treated surfaces before being filtered and collected in storage tanks to be used. RWH has many benefits. First, it requires simple and inexpensive technologies that are easy to install and maintain. Because of their simplicity, RWH systems can be expanded, reconfigured or relocated to meet each household’s needs. RWH also has important economic advantages for consumers because it reduces the amount of water purchased from public systems. Moreover, the possibility of having an alternative water supply reduces pressure on aquifers and surface water sources. For these reasons, the integration of RWH systems into buildings is an effective way to minimize the use of treated water for non-potable tasks and supply drinking water in places where water is scarce.
While RWH has numerous benefits, there are some disadvantages, particularly related to the limits of its supply and the reliability of rainfall (both in terms of spatial and temporal distribution). For these reasons, RWH systems cannot supply water for all domestic uses and are unlikely to make the households independent of the conventional water supply system. To achieve water self-sufficiency, multiple technologies must be employed. Nevertheless, the acquisition and use of rainwater through RWH can provide a considerable amount of water and ensure substantial financial savings to households.
The quantity and quality of collected rainwater depends on geographic location, local climate characteristics, the presence of anthropic activities in the area and storage tank volume. In general, rainwater is relatively clean, has low hardness and a quasi-neutral pH, and is free of sodium [
9]. Runoff from rooftops is often considered unpolluted [
10] or at least is of relatively good quality compared with runoff from surface catchments [
11]. However, there is still disagreement about the quality of rooftop runoff, ranging from good or acceptable [
12,
13] to contaminated [
14,
15], depending on the roofing material, environmental conditions and atmospheric pollution. Subject to basic treatments such as filtration and/or chlorination, as necessary, collected rainwater can be utilized for different non-potable uses, including toilet flushing, washing machine use and garden irrigation (or any other use that does not require high-quality water). Different studies have highlighted the benefits of using harvested rainwater for toilet flushing [
16,
17]. Zhang
et al. [
18] observe that harvesting all roof runoff for use in toilet flushing can reduce water consumption in residential buildings by about 25%.
The performance and design of RWH systems has been investigated using different approaches, including water balance simulation analyses and mass curve analyses [
19,
20,
21], probabilistic methods [
22] and economic optimization [
3]. The results indicate that the storage capacity of tanks cannot be standardized but is considerably influenced by local rainfall, catchment surface characteristics and the number of people in the household.
Several studies have explored the implementation of RWH systems in response to growing water demand in Africa [
7,
23,
24], Asia [
25,
26,
27], USA. [
17,
18,
19,
20,
21,
22,
23,
24,
25,
26,
27,
28] and Australia [
18,
19,
20,
21,
22,
23,
24,
25,
26,
27,
28,
29]. Additional studies on RWH systems have been carried out in the Mediterranean region as well. In Greece, Sazakli
et al. [
30] analyzed the quality and utilization of rainwater for domestic and drinking purposes. In Spain, Farreny
et al. [
8] analyzed the cost-efficiency of an RWH system in a high-density social housing neighbourhood comprised of multi-storey buildings. In Southern Italy, Campisano and Modica [
31] defined a dimensionless methodology to derive the optimal design of RWH systems for domestic use. This methodology was based on the results of daily water balance simulations carried out for 17 rainfall gauging stations.
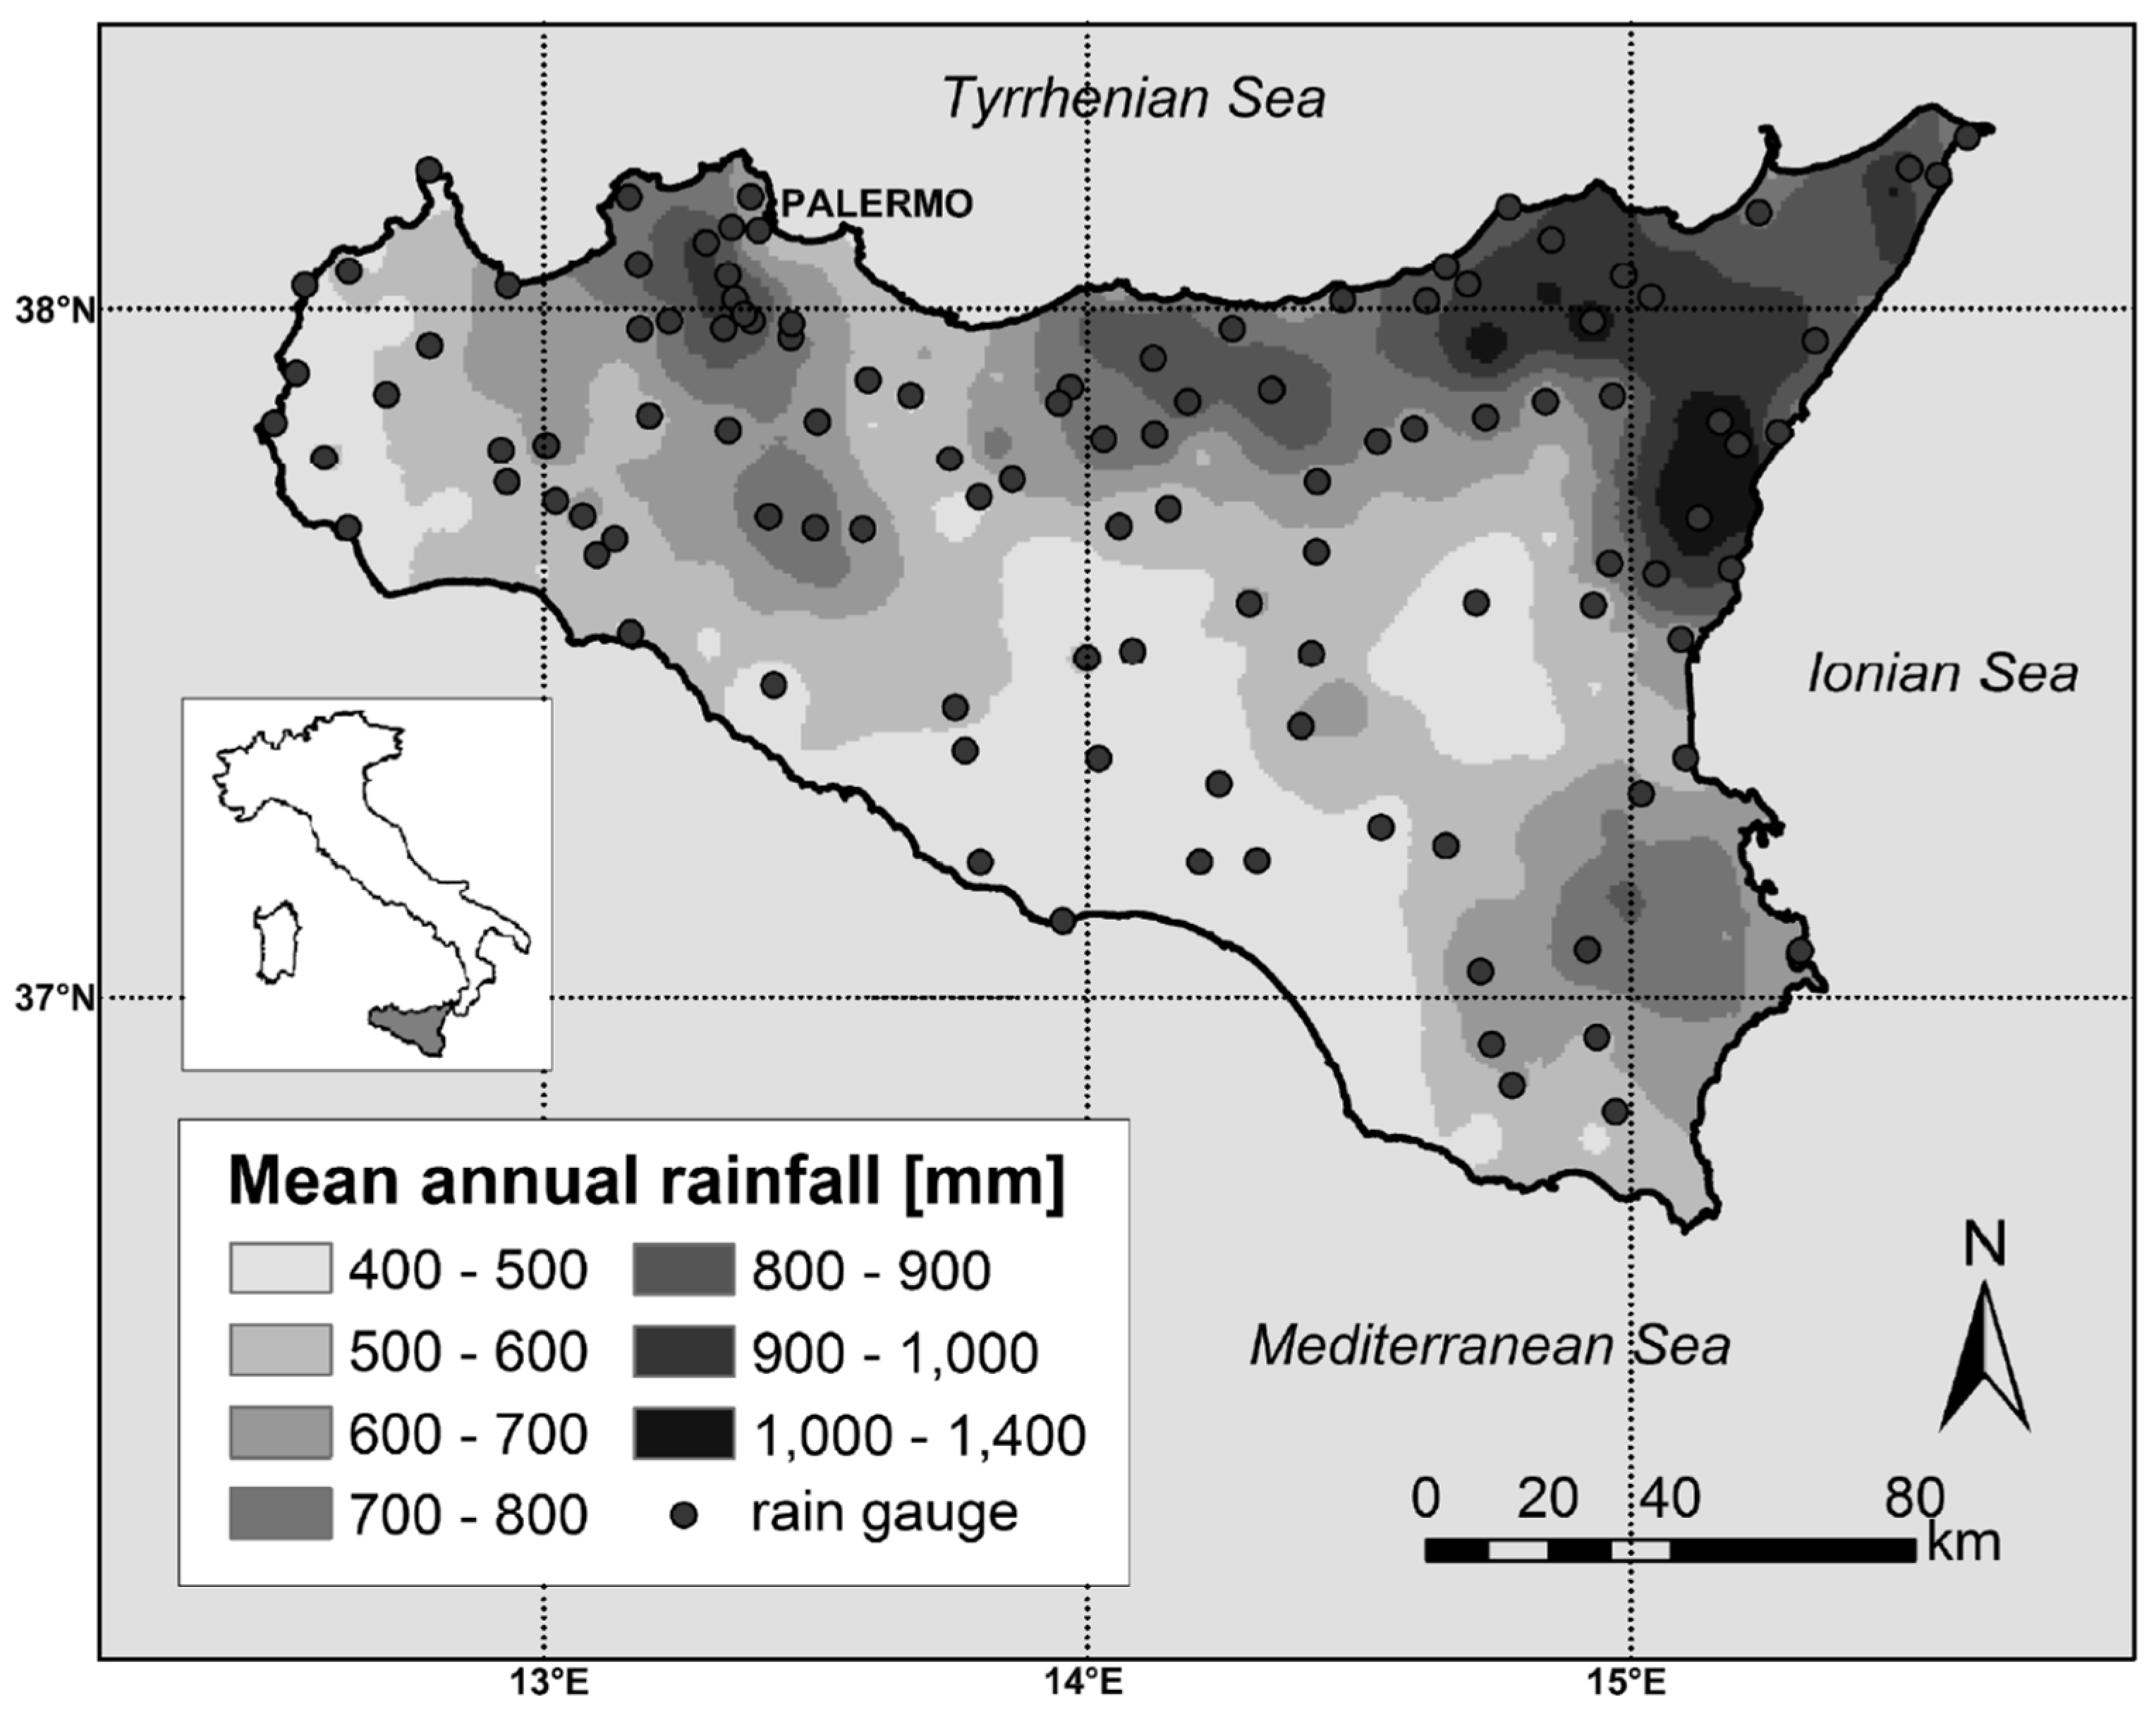
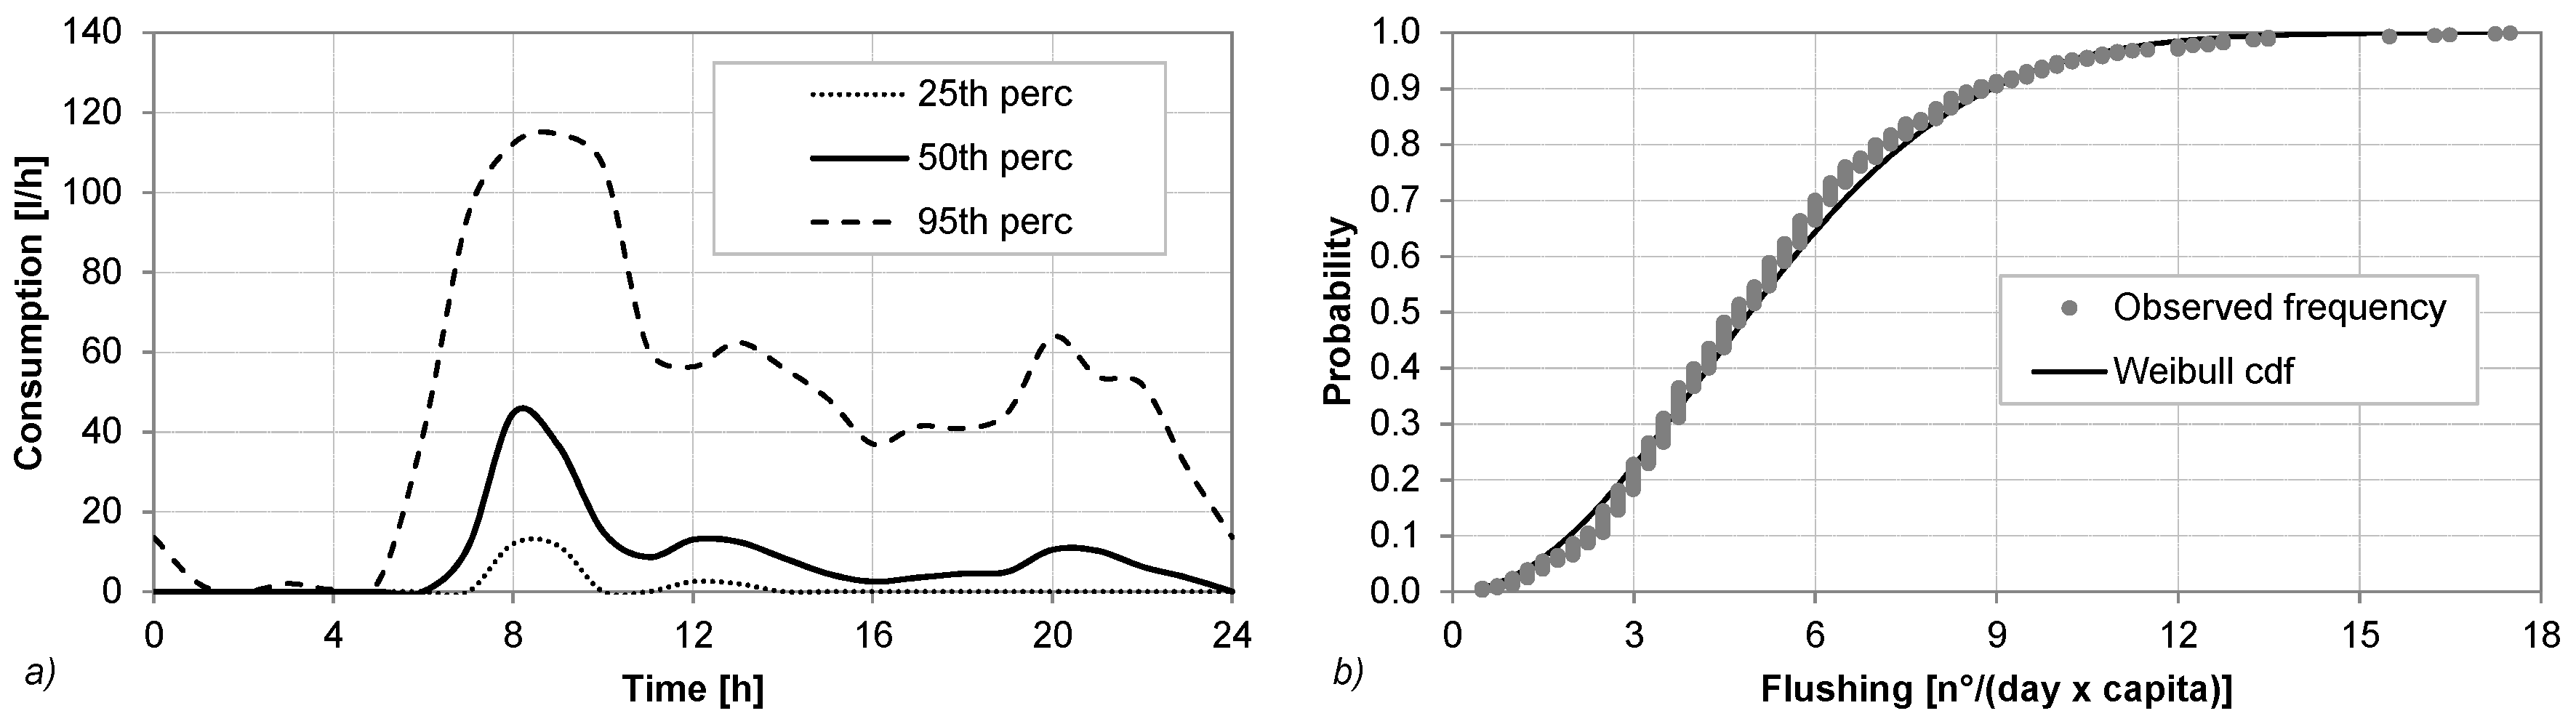
The present study investigated the performance of a proposed RWH tank for a model single-family home in a residential area. Performance was tested for varying levels of annual precipitation using data from over 100 different sites in Sicily. The application of the yield-after-spillage algorithm enabled an evaluation of site-specific system efficiency. Performance was assessed for three tank sizes (10, 15 and 20 m3) and three uses of the collected rainwater: toilet flushing, garden irrigation and both uses combined. Simulations were run using data from 2002 to 2004. The researchers analyzed water consumption data recorded from single-family homes in Palermo (Northwestern Sicily) during the selected time period to define a temporal pattern for flushing water demand. Water demand for garden irrigation was defined using recorded mean monthly evapotranspiration rates. Once the system’s performance was evaluated for the entire study area, its reliability was analyzed as a function of mean annual precipitation to determine mathematical expressions that have regional validity and could be practically applied. A data resampling procedure was applied to evaluate uncertainty related to the regional model previsions. Finally, a cost-benefit analysis was performed in order to estimate the payback period on the capital cost for the RWH system installation.
The study highlights the limits and benefits related to the application of RWH systems in the area of study. In particular, the regional analysis allowed researchers to identify areas in which the installation of the selected RWH system would be most effective and for which rainwater uses.
3. Results and Discussion
3.1. Evaluation of Daily Reliability
The historical rainfall series recorded at 111 rain gauges during the 2002–2004 period were used to evaluate the performance of the RWH system in
Figure 2. First of all, a preliminary analysis was carried out in order to examine the effect of the tank capacity
S on the daily reliability
RV and to identify the tank capacity providing the most feasible value of the average daily
RV for each site in Sicily (assuming the same system configuration in terms of catchment surface).
Several tank capacities
S in the range 1–30 m
3 were considered. Water balance simulations were performed at daily scale, thus accounting for the effect of extreme rainfall of 24 h duration and dry spells on the RWH system. Namely, for any tank size, the daily average
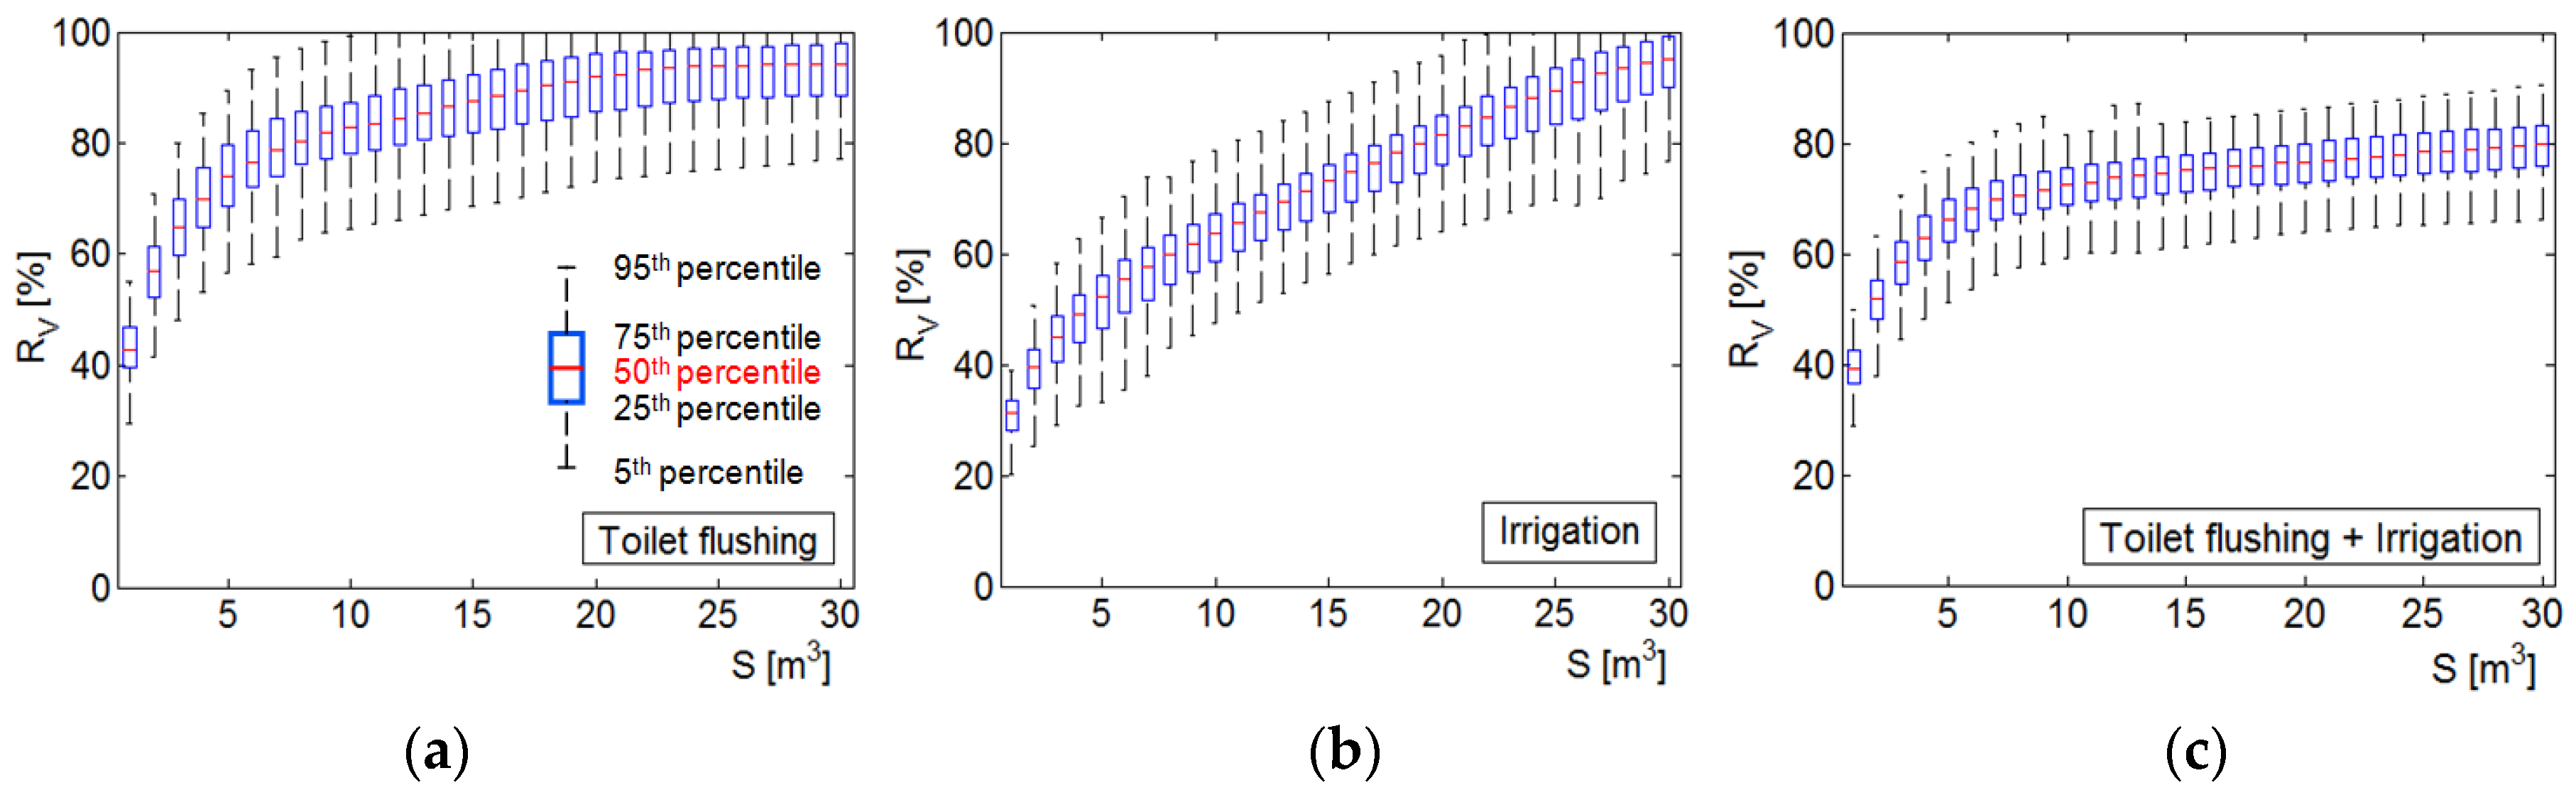
RV of each site was computed on the entire analysis period. Then, the related percentiles values were estimated. Results are summarized in the box-whisker graphs in
Figure 4.
Focusing on the median line (50th percentile), the average daily RV grows with tank capacity: For S ranging between 1 and 30 m3, RV varies in the range from 43% to 94% for toilet flushing use; this rise is steeper for irrigation use, specifically from 31% to 95%, while it is moderate for the combined use (RV ranging from 39% to 80%).
Regarding toilet flushing use, when S is equal to 10 m3, the RWH system reliability is higher than 80% and is equal to 92% for a capacity of 20 m3. Further increases of S produce a slight improvement of RV, with an achievable maximum value equal to 94%. For irrigation use, the median line shows an higher dependence of RV on S. The system is able to provide an RV value equal to 95% in more than 50% of the analyzed sites when a capacity of 30 m3 is accounted. For this use the temporal shift between the rainwater demand for irrigation (higher during summer months) and rainfall amounts (lower during summer months) highly affects RWH system performance: Higher tank capacities permit the storing of greater rainwater volumes in winter in order to satisfy irrigation demand in summer. This effect is mitigated if combined use is considered because, in this case, the rainwater demand is widespread throughout the entire year. Indeed, the average daily RV slightly increases for capacities higher than 10 m3.
Figure 4.
Box-whisker graphs of the daily reliability RV vs. tank capacity S for different rainwater uses. (a) toilet flushing use; (b) irrigation use; (c) toilet flushing and irrigation use.
Figure 4.
Box-whisker graphs of the daily reliability RV vs. tank capacity S for different rainwater uses. (a) toilet flushing use; (b) irrigation use; (c) toilet flushing and irrigation use.
In order to assess the uncertainty linked to the
RV appraisal for each site, the average width of the
RV percentiles band (shown in
Figure 4) was computed. Regarding the 25th and 75th percentile band, the average width values are equal to 19.8%, 8.8% and 7.1% for toilet flushing, irrigation and combined use, respectively. The average uncertainty regarding the 5th and 95th percentile band is 19.2% for combined use and about 24.5% for toilet flushing and irrigation. The reduced variability of
RV values among the analyzed sites for combined use highlights that rainwater demand represents a limiting factor to the achievement of higher RWH system performance in all the analyzed sites.
The performance improvement of RWH system in terms of
RV is moderate and not advantageous for tank capacity greater than 20 m
3 for toilet flushing and combined uses. Tank capacities higher than 20 m
3 may provide a significant improvement for irrigation use, but could be less economically feasible for a residential household (see
Section 3.5. Cost-benefit analysis). Therefore, after this preliminary analysis, the performance of the RWH system were investigated focusing on three different capacities: 10, 15 and 20 m
3.
In order to analyze the effect of the temporal aggregation of the daily water balance output on RV , the system performance was evaluated, for each site, at annual and monthly scales according to Equation (6). The following sections illustrate the obtained results.
3.2. Analysis of Annual Reliability
The annual reliability of the RWH system for each site of the studied area was assessed as average of the annual RV values related to the three years chosen as the analysis period.
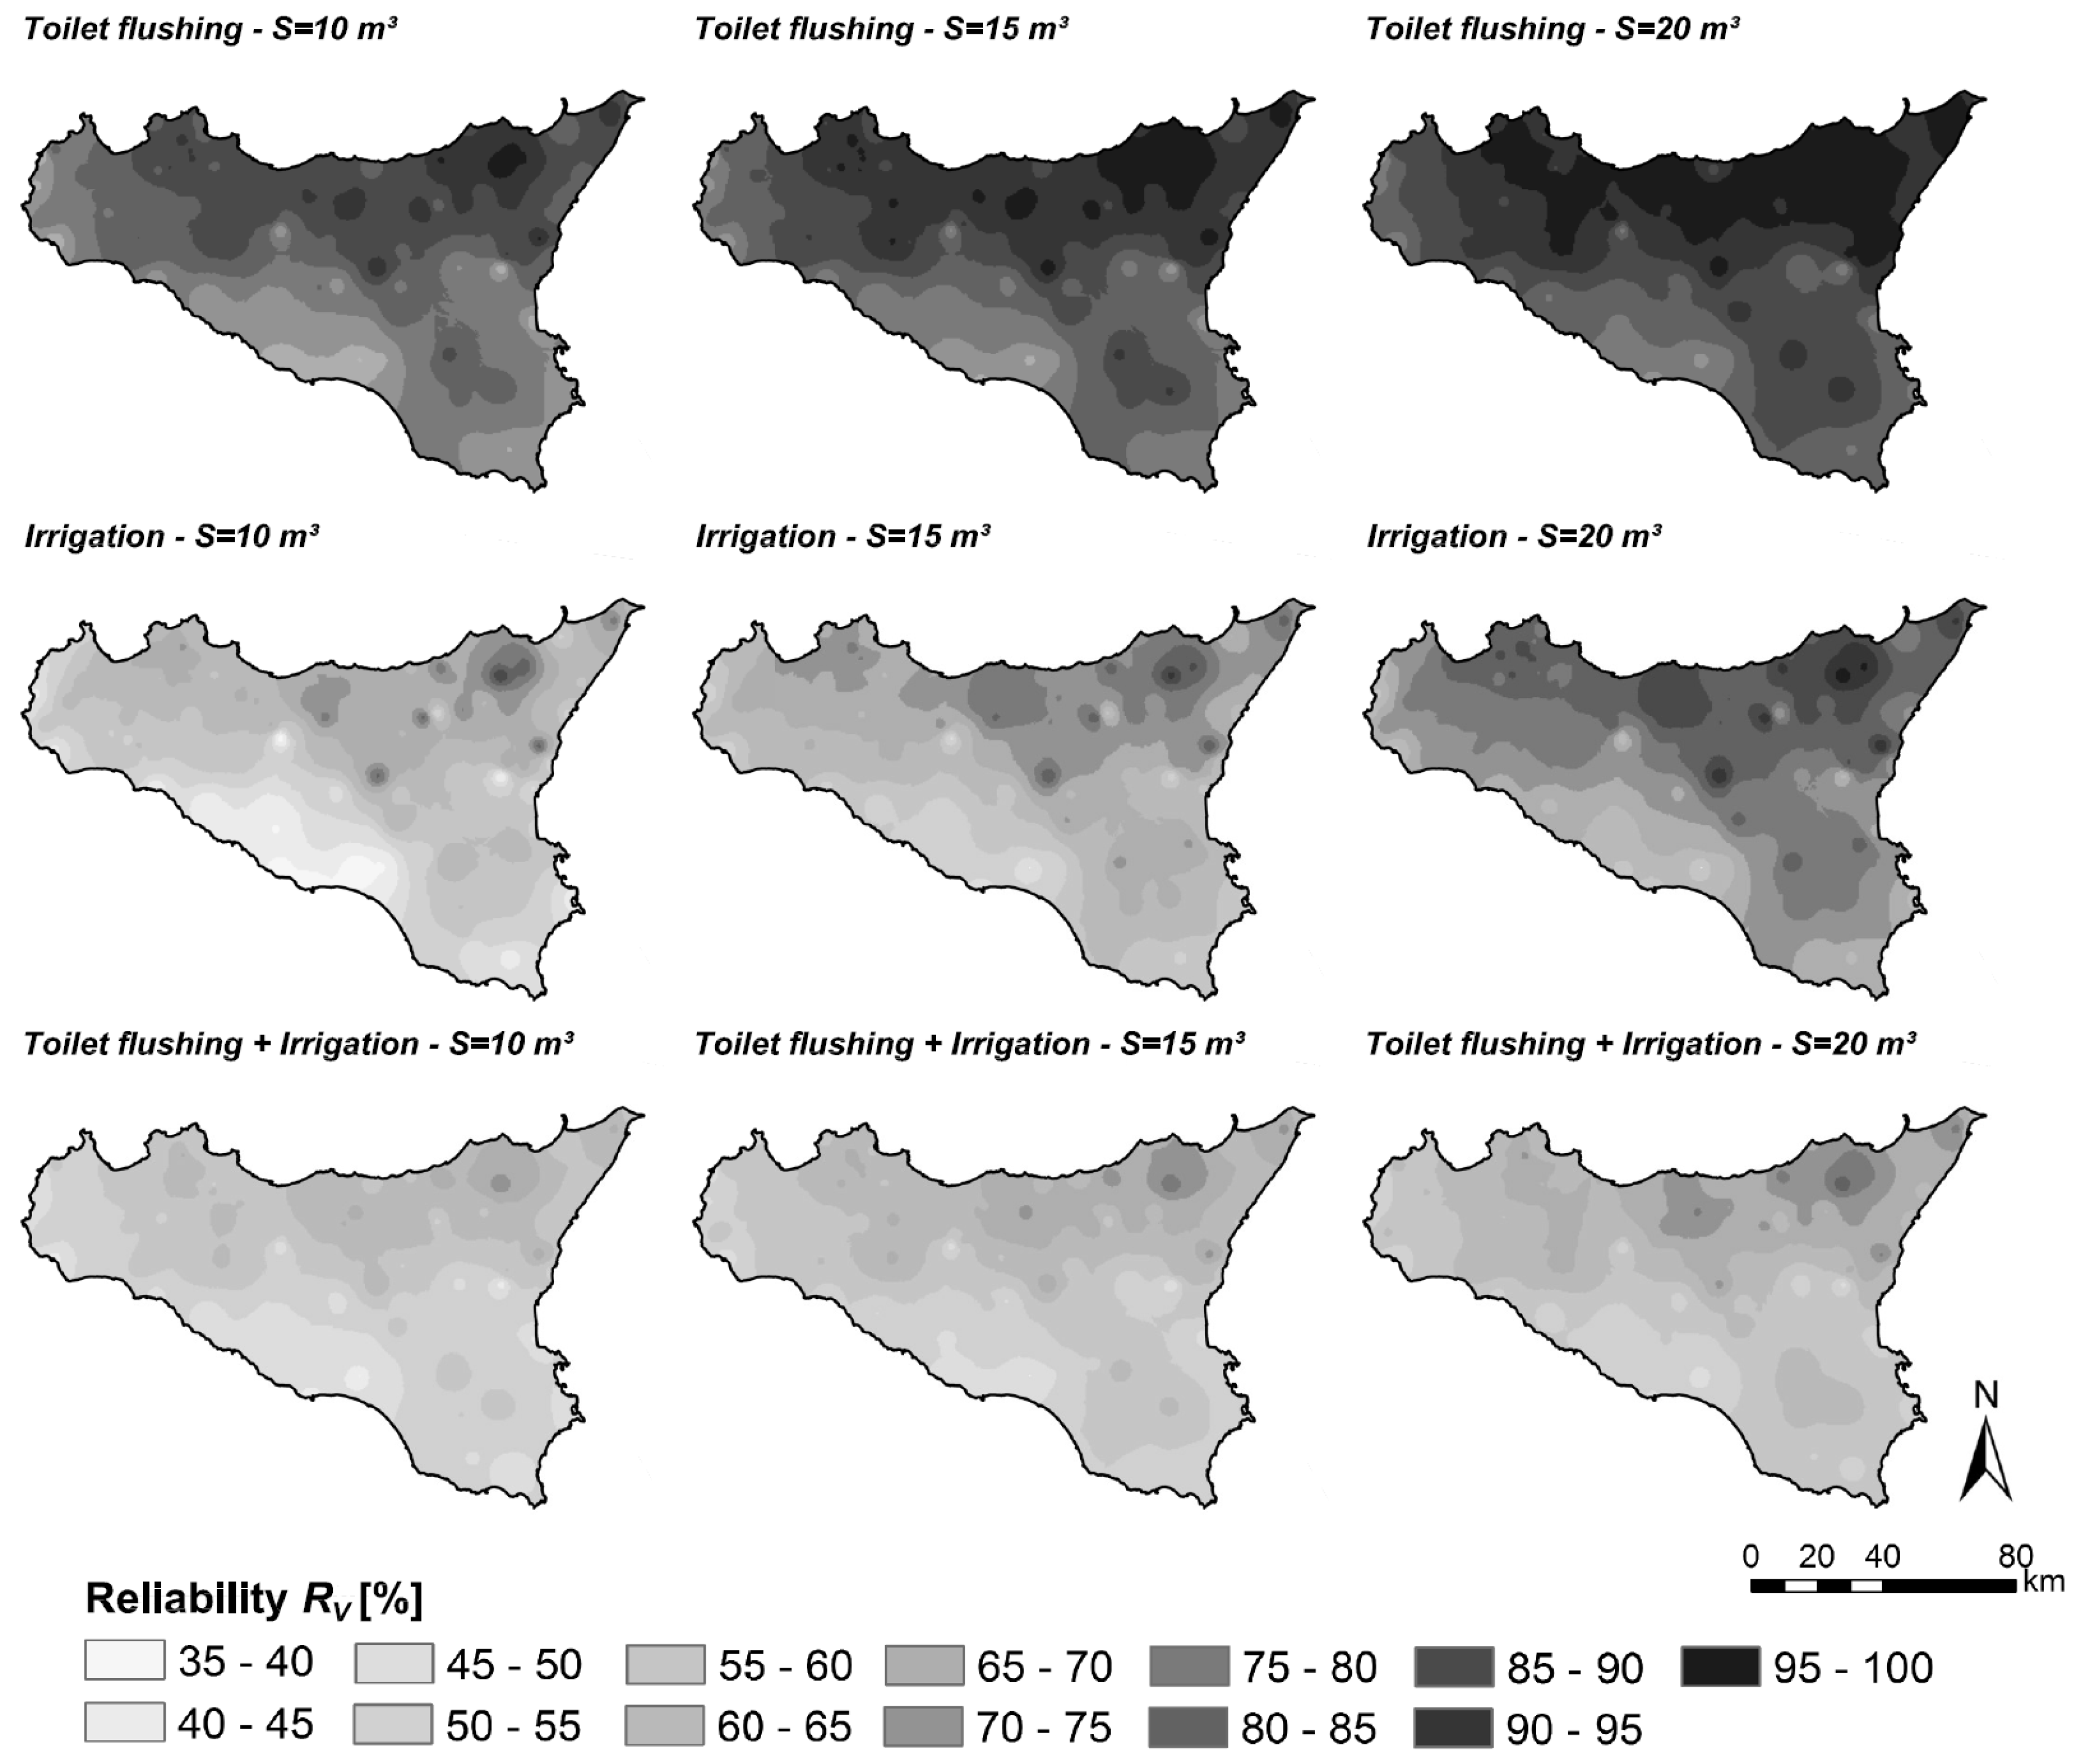
Figure 5 shows the spatial distribution of the annual reliability values over the study area. The use of the RWH system for toilet flushing provided the highest mean annual
RV values. The amount of water needed for toilet flushing for a family of four is approximately 80 m
3 per year. In the northwestern part of the island, where the mean annual precipitation ranges from 600 to 1000 mm, the performance of the system reached
RV values close to 100%, meaning that, in this area, the demand of water for toilet flushing can be completely satisfied by the water stored in an RWH system with a tank volume of just 10 m
3. Reliability was lower in sites located along the Mediterranean coast, where the mean annual precipitation ranges from 400 to 600 mm. In this zone, a 20 m
3 storage capacity was able to ensure reliability values up to 80%. A 10 m
3 RWH tank appears sufficient to ensure adequate
RV values in most of the area of study, while a larger capacity is required in the driest areas of the island. Conversely, a 10 m
3 storage capacity is not enough to meet the water demand for garden irrigation.
Figure 5 shows that the use of an RWH system for garden irrigation results in poor performance. Specifically, for
S = 10 m
3, the mean annual
RV was approximately 55%.
Figure 5.
Spatial distribution of mean annual reliability RV (%) for different rainwater uses and for S equal to 10, 15 and 20 m3.
Figure 5.
Spatial distribution of mean annual reliability RV (%) for different rainwater uses and for S equal to 10, 15 and 20 m3.
A wide area along the southern coast had RV values that ranged from 35% to 45%. Therefore, a 10 m3 storage capacity is not able to meet half of the annual water demand for garden irrigation. For this use, a 15 m3 storage capacity increased reliability just 5% (RV ranging from 45% to 50%). The use of a 20 m3 tank was able to ensure good performance only in the northern part of the island, where the annual reliability of the system reached 80%; in the South, RV ranged between 60% and 70%. To completely meet the water demand for garden irrigation, higher volumes of harvested rainwater are required. The mean annual demand for irrigation water is approximately 45 m3; however, unlike the water demand for toilet flushing, which is homogeneously distributed over the year, irrigation demand is concentrated in spring and summer and has a peak in August. This temporal pattern deeply affects the performance of RWH systems because rainfall is scarce in Sicily during summer months, when increased evapotranspiration rates result in greater water demands for irrigation.
In the combined use case, the tank volumes considered in this analysis were not sufficient to ensure adequate system performances. The maps show that, when S is equal to 10 m3, the average RV was approximately 50%. Increased storage capacity up to 20 m3 provided a slight increase in reliability, mainly in the northeastern part of the island, where the mean annual precipitation reaches 1,000 mm. Therefore, when limited rooftop and courtyard areas are available, the increase in storage volume is not enough to ensure the good performance of the RWH system, especially when rainwater must fill multiple needs with different temporal demand patterns, such as toilet flushing and garden irrigation. Furthermore, the increase in costs related to the installation of a larger storage tank makes the use of an RWH system less advantageous as capacity requirements increase.
3.3. Analysis of Monthly Reliability
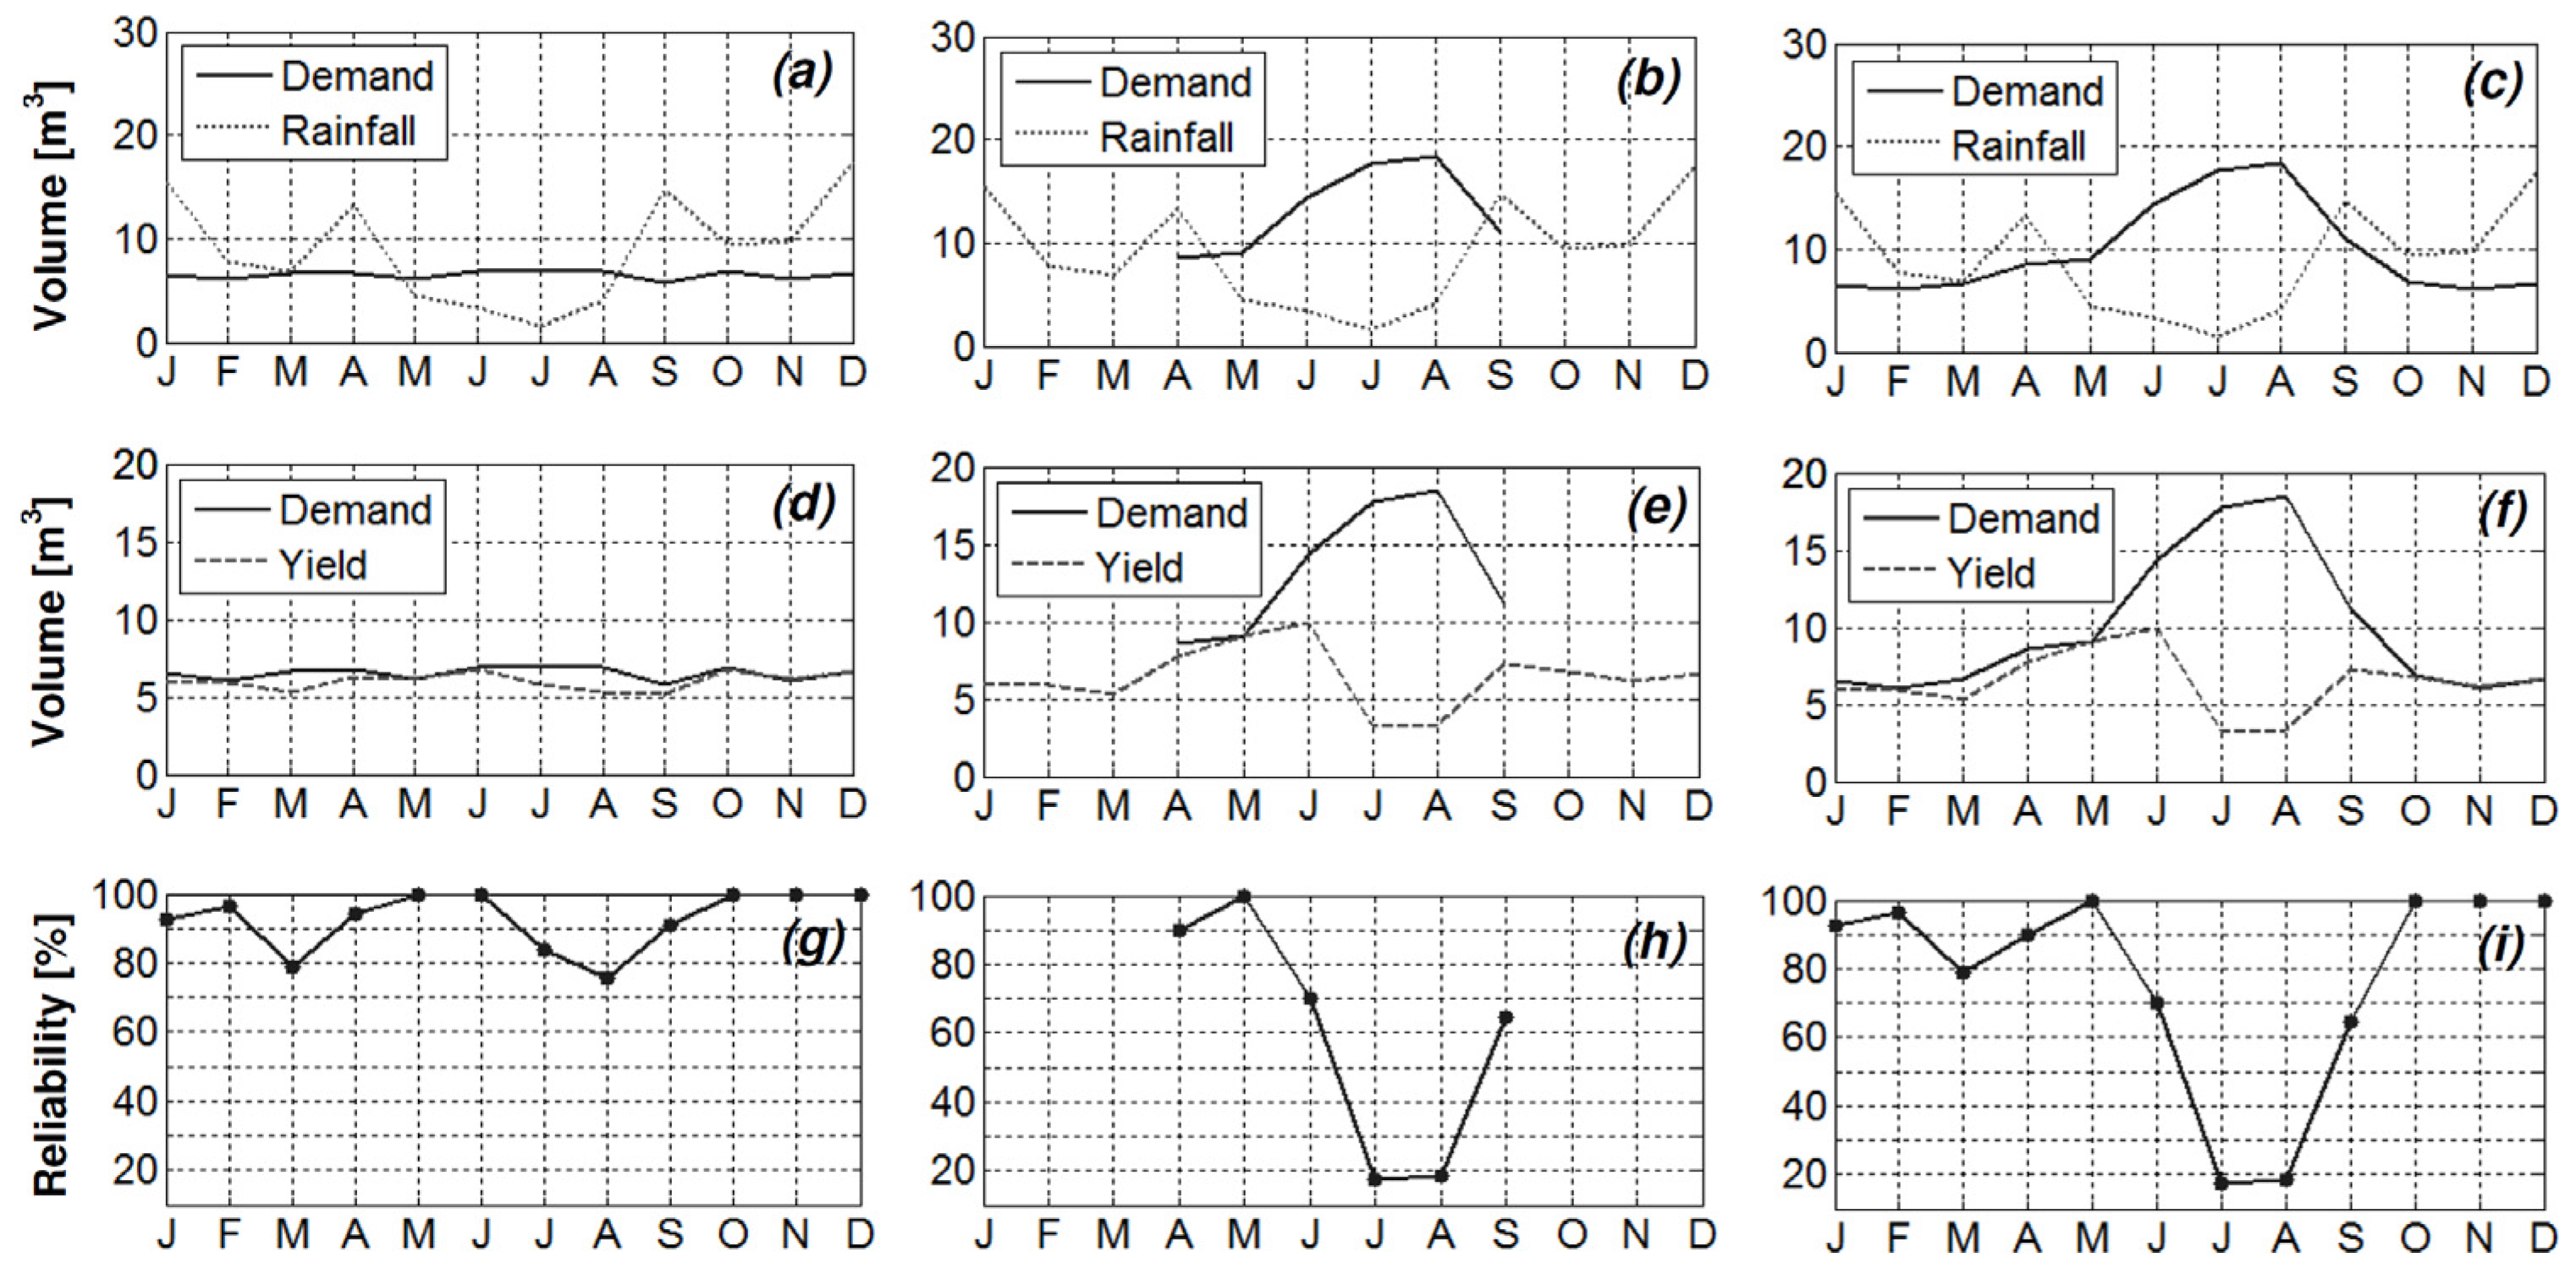
To analyze the monthly variability of the RWH system’s reliability, a separate analysis was performed for a particular location. The site selected for this analysis was Palermo, located on the northwestern coast of the island, where consumption data for toilet flushing were measured and analyzed. For
S = 20 m
3,
Figure 6a,d,g show plots of mean monthly demand, rainfall volumes and yield over the simulation period, as well as the corresponding monthly variation in reliability
RV when rainwater is used to flush toilets.
Figure 6.
Monthly water demand, rainfall volume and yield, and monthly variation of system reliability for toilet flushing (a,d,g); garden irrigation (b,e,h); and both uses (c,f,i).
Figure 6.
Monthly water demand, rainfall volume and yield, and monthly variation of system reliability for toilet flushing (a,d,g); garden irrigation (b,e,h); and both uses (c,f,i).
In
Figure 6a, water demand and rainfall volumes are compared. Water demand for toilet flushing is clearly unaffected by monthly and seasonal variations, and shows only slight differences from month to month (on the order of 1 m
3), while rainfall volumes are affected by an evident seasonal pattern, with the lowest values occurring during summer months and the minimum value occurring in July.
Figure 6d shows water demand and yield. When demand and yield overlap or the yield exceed the demand, the RWH system is able to completely meet the water demand for toilet flushing, ensuring a reliability of 100% (
Figure 6g). Monthly
RV varies between 74% (in August) and 100% (in May, June, October, November and December).
In the case of garden irrigation (
Figure 6b,e,h), the RWH system must provide water only during the period from April to September. Water demand is highest during summer months (
Figure 5b), when temperatures are higher and evapotranspiration increases.
Figure 6e shows that the demand exceeds the yield in June, July, August and September. This accounts for low monthly
RV values, especially in August when
RV equals 20% (
Figure 6h), and means that a significant volume of water would need to be collected from other sources when rainwater is unavailable from the tank. For the examined site and the considered system, the use of rainwater for garden irrigation appears disadvantageous during summer months because the RWH system is not able to provide high levels of water savings compared to the costs incurred for system installation and maintenance. Because the water demand volumes are higher than the maximum capacity of the tank (20 m
3), the poor performance of the system highlights the need to accumulate more rainwater during rainfall events by increasing the area of collection surfaces.
Figure 6c,f,i shows the results of the RWH system under the combined use scenario. The total water demand is the sum of monthly water volume required for toilet flushing and monthly water volume needed for garden irrigation (
Figure 6c). The demand for irrigation is much higher than that for toilet flushing, as shown by the consistent increase in total water demand during the summer months. However, the water collected during the winter, spring and autumn months ensures adequate yields to meet the water demand for toilet flushing, reaching
RV levels up to 100% (
Figure 6f). The performance of the RWH system clearly declines during the summer when the collected water is not enough to meet the higher demand for garden irrigation, resulting in a significant decrease in monthly
RV (
Figure 6i).
3.4. Regional Reliability Curves and Related Uncertainty
The relationship between annual reliability and mean annual precipitation was investigated to define equations for a system analogous to the one analyzed here (for
S equal to 10, 15 and 20 m
3) and valid at the regional scale. The goal of these equations is to provide a reliability
RV that an RWH system can attain at an annual scale for each value of mean annual precipitation
P and the uncertainty related to its estimation. Starting from simulation results previously shown, the points (
P,
RV) were interpolated according to the following procedure:
From the original dataset of annual reliabilities of the RWH system, which were obtained by applying the YAS algorithm to the 111 sites distributed over the Sicilian territory for the 2002–2004 period, 10,000 sub-datasets were extracted, in which 30% of points were randomly excluded to investigate the uncertainty affecting the results related to the selected sites;
for each sub-dataset the interpolation curve was estimated;
for each value of P, the 5th, 50th and 95th percentiles were obtained from the interpolation curves. The interpolation curve obtained for the 50th percentile represents the relationship between P and RV, while the uncertainty related to the estimation of RV as a function of P is given by the width of the interpolation curves for the 5th and 95th percentiles, respectively.
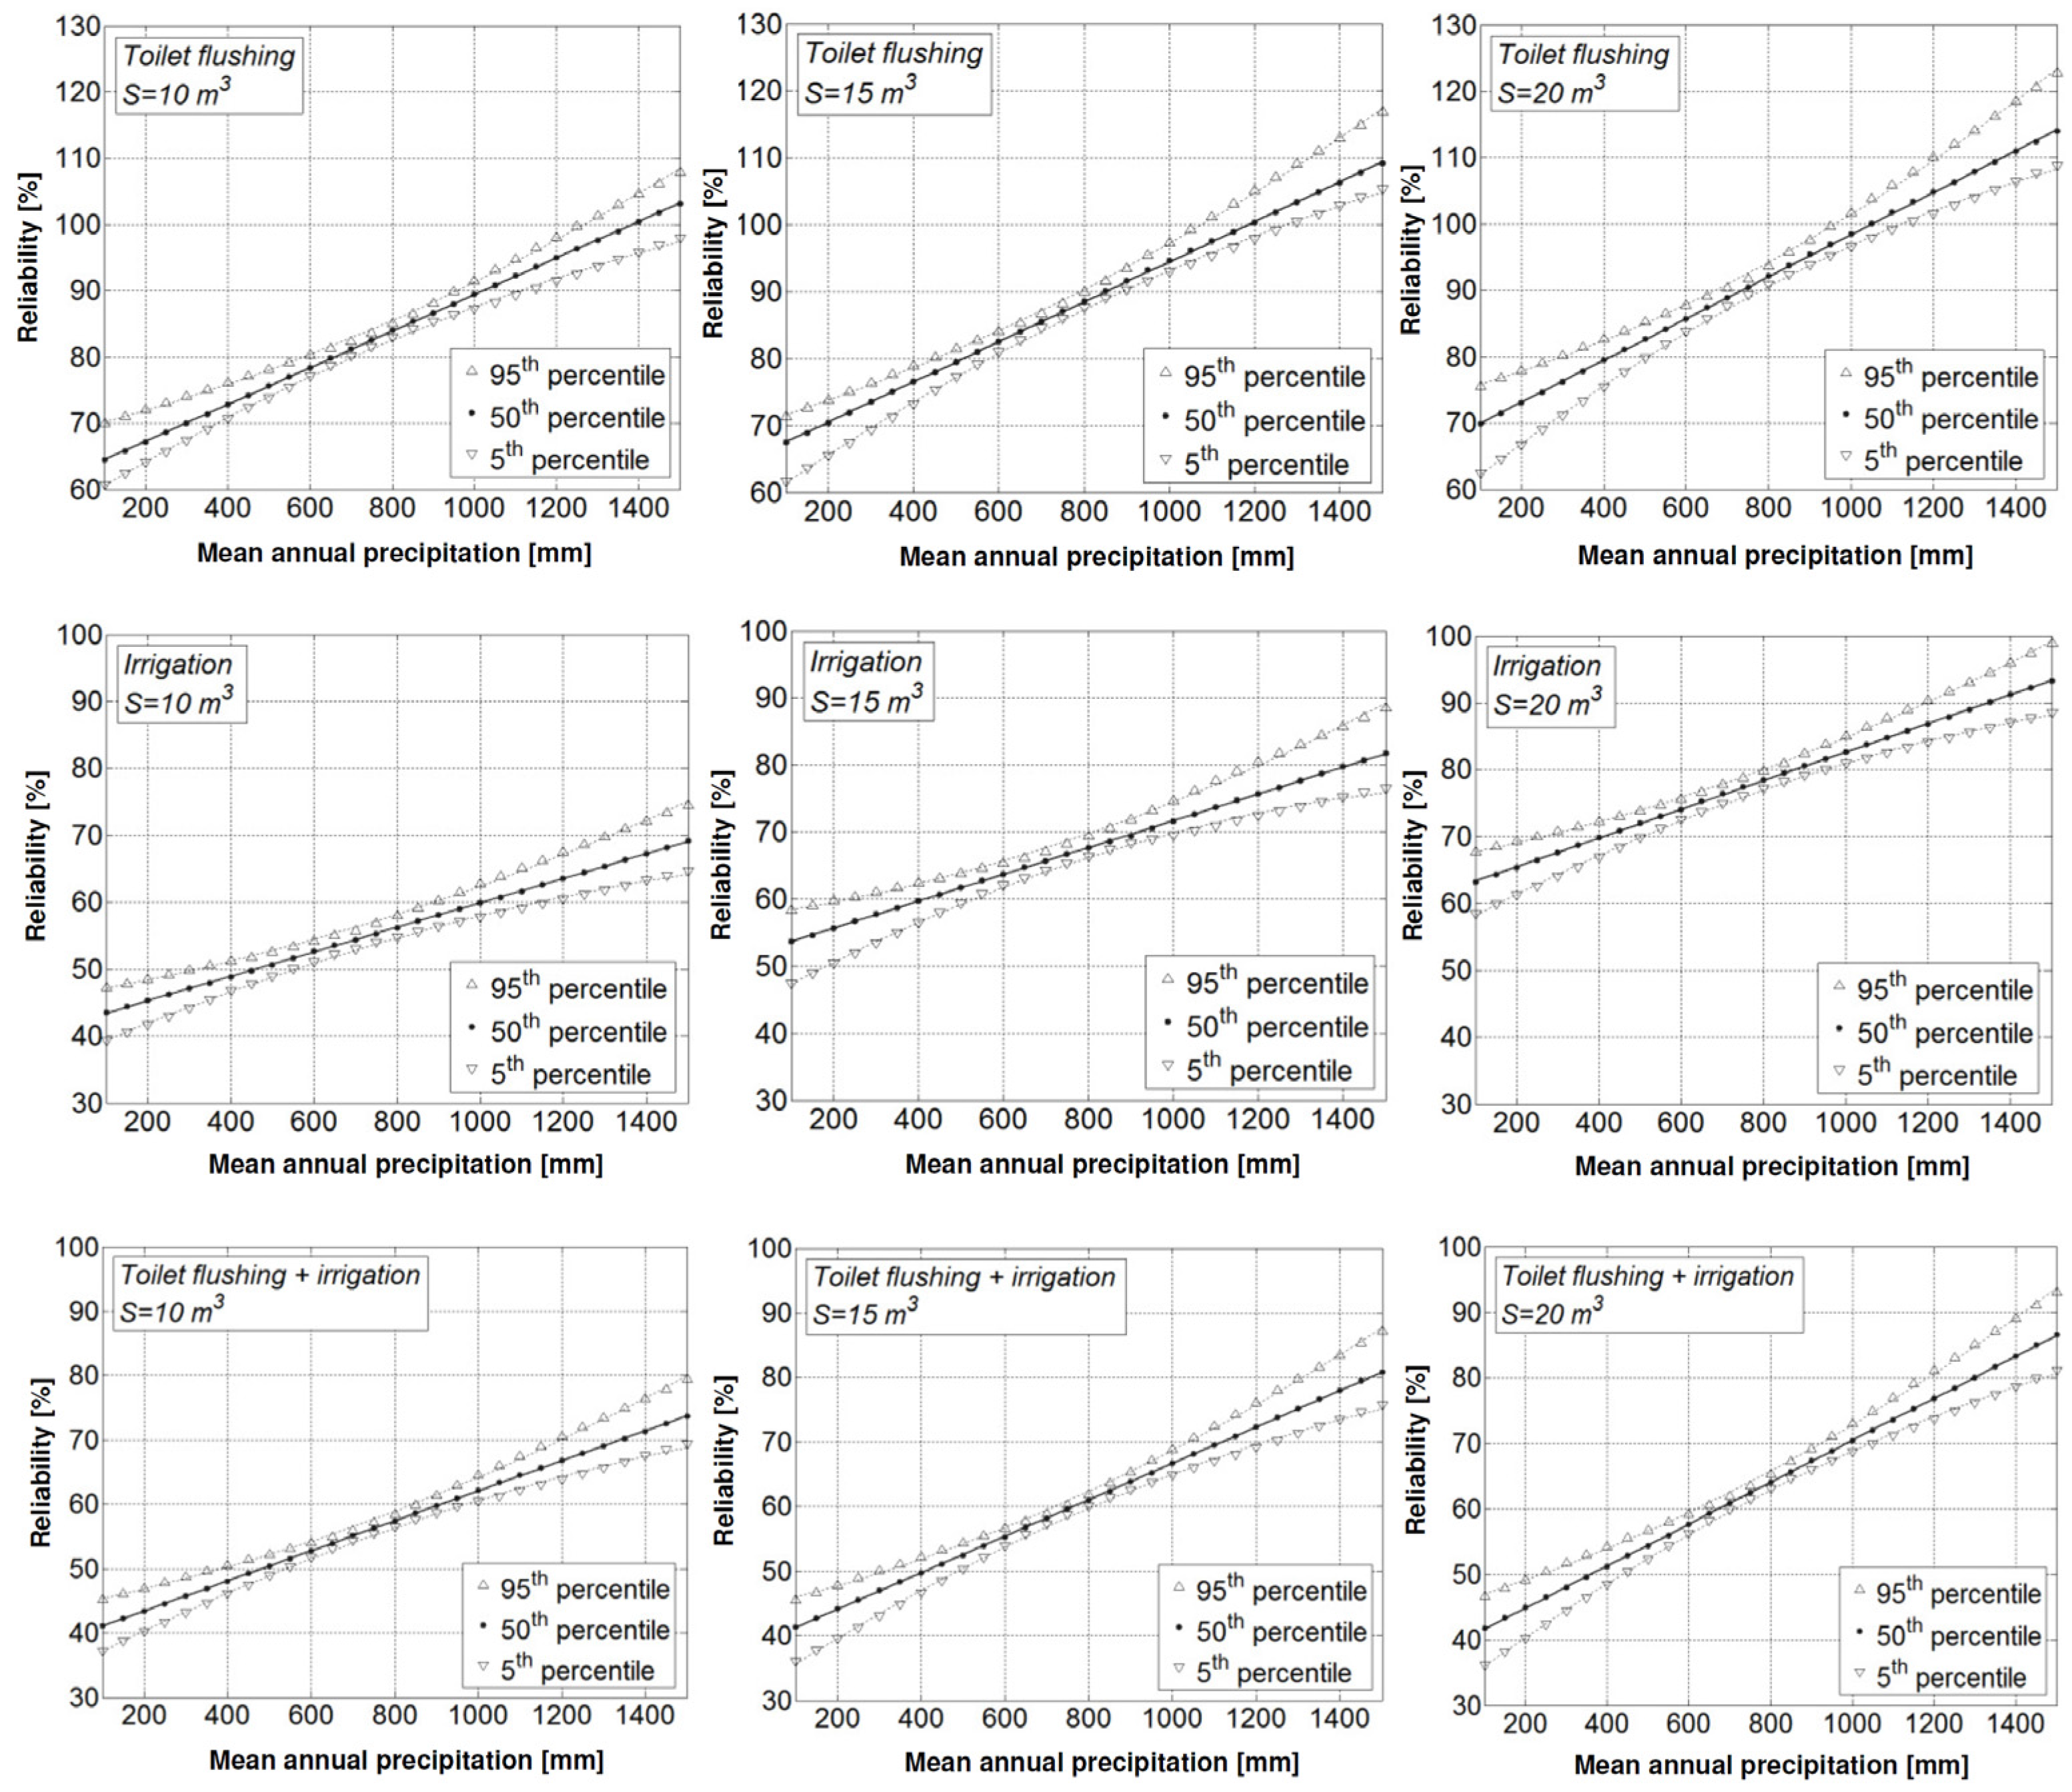
For each rainwater use and each value of
S,
Figure 7 shows the interpolation curves and the resulting uncertainty bands (dotted lines) obtained by interpolating the 5th and 95th percentiles.
Table 3 shows the equation of the curves and the uncertainty bands. In general, reliability increases with mean annual precipitation and tank size. For the same values of
P, the highest reliability can be obtained using the harvested rainwater only for toilet flushing. In this case, the RWH system is able to ensure an annual
RV that varies from 80% and 100% in locations characterized by a mean annual precipitation ranging from 600 to 1000 mm. According to these results, the installation of an RWH tank is particularly effective on the northeastern part of the island (as shown in
Figure 5).
In terms of rainwater use for garden irrigation, when S = 10 m3 RV does not reach 100% even at the sites with the highest mean annual precipitation values. Garden irrigation requires a storage of at least 20 m3 to obtain higher values of RV; however, these values remain under 100%. The curves illustrate that the RWH system’s performance declines if the rainwater is intended for the dual uses of toilet flushing and garden irrigation.
For every use, the evaluation of the system’s reliability is affected by a lower level of uncertainty corresponding to a mean annual precipitation in the range from 600 to 1000 mm, as shown by the smaller width of the band. RV values that exceed 100% indicate that the installation of an RWH system can completely meet the water demand and supply additional volume, which could be allocated to other uses. This occurs where the mean annual precipitation is greater than 1400, 1200 and 1100 mm when S equals 10, 15 and 20 m3, respectively. However, the uncertainty related to higher values of P is greater than that related to the range 600–1000 mm, as shown by the increased width of the band of uncertainty.
Table 3.
Equations of interpolating curves of 5th, 50th and 95th percentiles for each rainwater use and tank volume.
Table 3.
Equations of interpolating curves of 5th, 50th and 95th percentiles for each rainwater use and tank volume.
| Rainwater Use | Tank Volume(m3) | P-RV Curve | Uncertainty Bands |
|---|
| 50th Percentile | 5th Percentile | 95th Percentile |
|---|
| toilet flushing | 10 | 0.0276 × P + 61.782 | −7 × 10⁻⁶ × P2 + 0.0379 × P + 56.864 | 8×10⁻⁶ × P2 + 0.0148 × P + 68.685 |
| 15 | 0.0299 × P + 64.589 | −8×10⁻⁶ × P2 + 0.0445 × P + 57.073 | 8×10⁻⁶ × P2 + 0.0191 × P + 69.642 |
| 20 | 0.0316 × P + 66.804 | −1×10⁻⁵ × P2 + 0.0505 × P + 57.233 | 1×10⁻⁵ × P2 + 0.0164 × P + 74.115 |
| garden irrigation | 10 | 0.0183 × P + 41.614 | −6×10⁻⁶ × P2 + 0.0271 × P + 36.728 | 6×10⁻⁶ × P2 + 0.0104 × P + 46.063 |
| 15 | 0.0200 × P + 51.705 | −9×10⁻⁶ × P2 + 0.0352 × P + 43.927 | 8×10⁻⁶ × P2 + 0.0087 × P + 57.493 |
| 20 | 0.0214 × P + 61.223 | −8×10⁻⁶ × P2 + 0.0338 × P + 54.87 | 7×10⁻⁶ × P2 + 0.0113 × P + 66.569 |
| toilet flushing and garden irrigation | 10 | 0.0233 × P + 38.775 | −7×10⁻⁶ × P2 + 0.0335 × P + 33.891 | 8×10⁻⁶ × P2 + 0.0125 × P + 44.048 |
| 15 | 0.0282 × P + 38.482 | −9×10⁻⁶ × P2 + 0.0424 × P + 31.477 | 9×10⁻⁶ × P2 + 0.0153 × P + 44.332 |
| 20 | 0.0320 × P + 38.508 | −9×10⁻⁶ × P2 + 0.0466 × P + 31.437 | 9×10⁻⁶ × P2 + 0.0185 × P + 45.036 |
Figure 7.
Reliability curves and their uncertainty bands for each uses and analyzed storage volumes.
Figure 7.
Reliability curves and their uncertainty bands for each uses and analyzed storage volumes.
In every case, the width of the uncertainty bands increases for the lowest and highest values of mean annual precipitation. In the case of the lowest values, the uncertainty is related to the fact that the reliability of the system is considerably affected by the amount of harvested rainwater, because of the potential failure of the RWH system in meeting the water demand. In the case of the highest values, the uncertainty in the reliability is related to the fact that the amount of harvested water is likely to exceed the water demand. The installation of an RWH system in the above mentioned cases requires a deeper analysis to verify its cost-effectiveness. Where the amount of rainwater is not enough to meet the water demand, the analyzed volumes and collection surfaces are not adequate to ensure a high level of water savings, making households dependent on other water sources for most or part of the year. On the other hand, where the amount of rainwater exceeds the needs of the household, the rainwater that overflows the storage tank represents an economic loss because this water could meet other demands, allowing a greater independence from the traditional supply system and, therefore, further savings.
3.5. Cost-Benefit Analysis
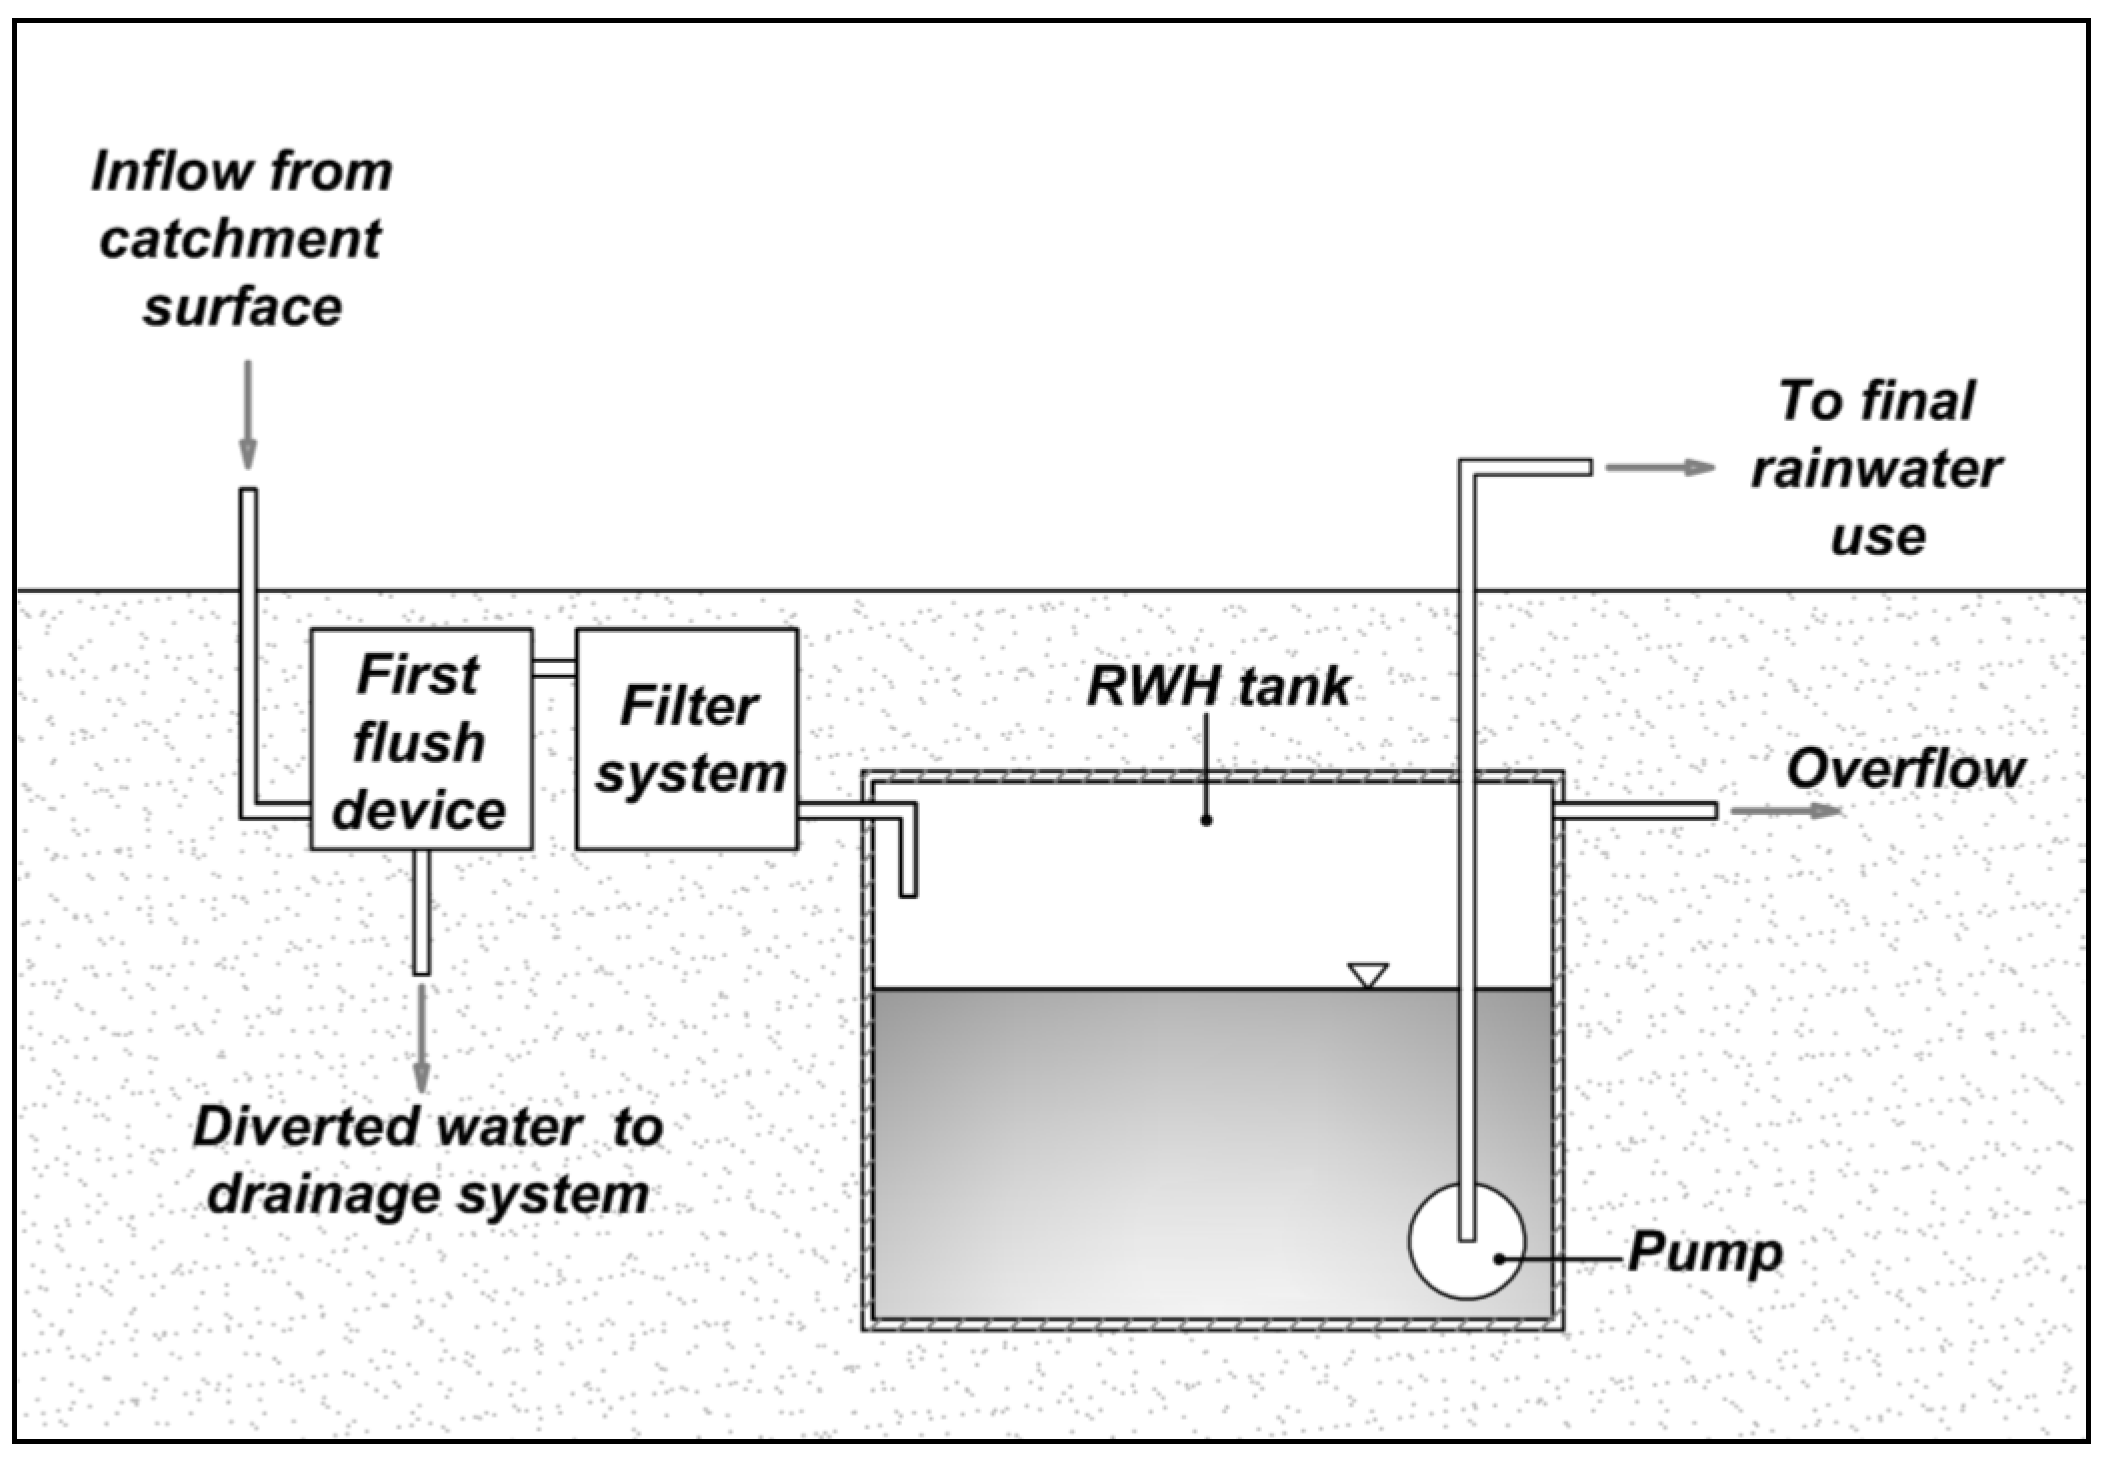
An economic analysis of the RWH system was carried out in order to investigate the balance between the investment/cost for system purchase and installation, and the benefits obtained by the rainwater use for the three considered demands. To this aim, a schematic underground installation of an RWH system was considered, consisting of a pre-fabricated concrete tank provided with a first flush device, a manhole with a rainwater filter, a pumping system and its Programmable Logic Controller (PLC) equipment, the drainage piping system inlet and outlet, the tank, and the piping distribution system to supply the rainwater for the analyzed uses (
Figure 8).
Table 4 summarizes the costs of the RWH system elements for each tank capacity and each use. These costs have been obtained starting from the unit rates, drawn from the official regional price list for civil infrastructures [
48], and by means of a market survey.
Figure 8.
Schematic underground installation of the RWH system.
Figure 8.
Schematic underground installation of the RWH system.
The tank purchase and installation highly affects the total RWH system cost (
Table 4), as confirmed by different studies in the literature [
49,
50,
51]. Moreover, the RWH system for toilet flushing is more expensive than that for only irrigation use, due to the installation costs related to the piping distribution system in the building.
In the present analysis, the costs related to the system maintenance were considered negligible when compared to purchase and installation costs [
50]. With regard to operation costs and, in particular, the energy costs needed to pump the rainwater for the analyzed uses, these costs were neglected. Regarding this assumption, some considerations have to be made. In most of the sites in Sicily, water managers often adopt the intermittent distribution to cope with water shortage periods or to contain high water losses, due to the lack of adequate maintenance of the supply networks [
52,
53]. As a consequence, the plumbing systems of households are frequently equipped with pumping stations and private tanks to collect potable water during service periods and supply water when the service is not available. Because of the lack of confidence of users on the reliability of the water supply service, the private tanks and the pumping system are not bypassed, even if the distribution system operates on a continuous basis. Thus, the users are prepared for unexpected interruption of the supply service. Therefore, in most of the sites of Sicily, users nowadays have to pay a large amount for energy needed to draw water from the public network because of private storage tanks and pumping systems [
54].
Table 4.
Elements costs of a schematic RWH system for each tank size and rainwater use.
Table 4.
Elements costs of a schematic RWH system for each tank size and rainwater use.
| Item | Toilet Flushing | Irrigation | Toilet Flushing + Irrigation |
|---|
| Tank capacity [m3] | 10 | 15 | 20 | 10 | 15 | 20 | 10 | 15 | 20 |
| Cost for concrete tank purchase, the first flush device and their underground placing | € 1778 | € 2284 | € 2991 | € 1700 | € 2284 | € 2991 | € 1700 | € 2284 | € 2991 |
| Pipes drainage system inlet and outlet tank | € 178 | € 178 | € 178 | € 178 | € 178 | € 178 | € 178 | € 178 | € 178 |
| Piping system for not potable water supply | € 194 | € 194 | € 194 | € 290 | € 290 | € 97 | € 290 | € 290 | € 290 |
| Pump and PLC equipment | € 2000 | € 2000 | € 2000 | € 2000 | € 2000 | € 1500 | € 2000 | € 2000 | € 2000 |
| Rainwater filter | € 220 | € 220 | € 250 | € 220 | € 220 | € 250 | € 220 | € 220 | € 250 |
| Total costs | € 4370 | € 4876 | € 5612 | € 4388 | € 4973 | € 5016 | € 4388 | € 4973 | € 5709 |
With regard to the benefits related to the RWH system installation, only the benefits due to the potable water saving have been considered. In particular, the financial benefit has been evaluated in terms of reduction of the annual water bill from water utilities. Even if relevant, in this analysis the environmental and social benefits have not been accounted. The cost-benefit analysis has been carried out according to the “
Guide to cost-benefit analysis of investment projects” in Europe [
55]. Namely, two performance indicators, the Net Present Value (
NPV) and the payback period
(PBP), have been evaluated, as described by Khastagir and Jayasuriya [
50] and Matos
et al. [
56]. In the analysis, some assumptions have been made:
The evaluation period to assess the
NPV has been set equal to 20 years [
8,
56,
57];
according to [
55], a discount rate of 5% has been assumed;
the inflation rate has been assumed equal to 8% (on the basis of the inflation rate of potable water price in Italy in recent years);
the actual price for potable water has been set equal to 2.5 €/m3 (obtained as the average of the actual prices adopted by different water utilities operating in Sicily).
The effect of the variability of annual yield related to the different location of the system installation has been accounted for in the
PBP and the
NPV appraisal, considering the minimum, the maximum and the mean annual yield in the area of study. Results are shown in
Table 5 for each tank size and rainwater use. As expected, for a given use, the payback period increases with the tank capacity. For the toilet flushing use, a 10 m
3 tank capacity was found to to be adequate, since an increase of the tank size of 5–10 m
3 improves the system
RV of only the 1%. For a yield equal to the mean annual value, the payback period is 21 years (closer to the assumed evaluation period). As regards to irrigation use, the annual benefits are scarce, due to the lower annual yield values. As a consequence, payback periods are higher than the assumed evaluation period, specifically about 34 years for the three annual yield values, meaning that 20 years are enough to get back only half of the costs of system installation. In terms of annual
RV, a 20 m
3 capacity was found to be a feasible solution for this use. For both uses, the payback period related to the mean annual yield are similar, as well as the system
RV. Therefore, in this case, the 10 m
3 capacity seems to be the most advantageous.
Table 5.
NPV and PBP values related to each tank size and different annual yields for each rainwater use.
Table 5.
NPV and PBP values related to each tank size and different annual yields for each rainwater use.
| Rainwater Use | Tank Volume | Investments/Costs | Annual Yield/Water Saving | Annual RV | NPV (20 Years) | PBP = NCER |
|---|
| (m3) | (€) | (m3/year) | (%) | (€) | (year) |
|---|
| Toilet flushing | 10 | € 4388 | max | 78 | 100% | € 1,137 | 17 |
| mean | 60 | 77% | −€ 134 | 21 |
| min | 34 | 43% | −€ 1969 | 31 |
| 15 | € 4973 | max | 78 | 100% | € 631 | 19 |
| mean | 61 | 78% | −€ 569 | 22 |
| min | 34 | 43% | −€ 2476 | 34 |
| 20 | € 5709 | max | 78 | 100% | −€ 106 | 21 |
| mean | 61 | 78% | −€ 1306 | 25 |
| min | 34 | 43% | −€ 3212 | 37 |
| Irrigation | 10 | € 3773 | max | 38 | 86% | −€ 1090 | 26 |
| mean | 25.6 | 58% | −€ 1965 | 34 |
| min | 13.4 | 30% | −€ 2827 | 50 |
| 15 | € 4279 | max | 44.4 | 100% | −€ 1596 | 29 |
| mean | 30.7 | 69% | −€ 2112 | 33 |
| min | 15.2 | 34% | −€ 3206 | 50 |
| 20 | € 5016 | max | 44.4 | 100% | −€ 1881 | 29 |
| mean | 34.7 | 78% | −€ 2566 | 34 |
| min | 15.2 | 34% | −€ 3943 | 55 |
| Toilet flushing + Irrigation | 10 | € 4370 | max | 94.5 | 77% | € 2283 | 15 |
| mean | 63.7 | 52% | € 109 | 20 |
| min | 33.9 | 28% | −€ 1995 | 32 |
| 15 | € 4876 | max | 104.5 | 85% | € 1699 | 16 |
| mean | 65.5 | 53% | −€ 348 | 22 |
| min | 33.9 | 28% | −€ 2579 | 34 |
| 20 | € 5612 | max | 109.5 | 89% | € 2022 | 16 |
| mean | 66.5 | 54% | −€ 1014 | 24 |
| min | 33.9 | 28% | −€ 3316 | 38 |
4. Conclusions
For a long time, urban design and planning has ignored the advantages of RWH as a sustainable water resources management tool; however, interest in RWH systems as an alternative water source has recently increased. These systems can provide a supplementary water supply in urbanized areas when integrated with existing conventional water supply systems, or they can serve as the main water source in rural areas where the availability of water resources is a critical issue. Moreover, utilizing RWH represents an effective adaptive strategy to climate change against the reduction of water availability. The feasibility of rainwater harvesting in a particular locality is highly dependent on rainfall characteristics (intensity and frequency). Other variables, such as catchment area and type of catchment surface, usually can be modified to improve system performance.
In this study, a behavioral model was applied to assess the performance of an RWH system in terms of its reliability. Water demand for toilet flushing and garden irrigation and three years of historical daily rainfall data for 111 locations in Sicily were used as input to the system simulation model, the YAS algorithm. The analysis of simulation results, in terms of annual reliability of the RWH system, highlighted the possibility of obtaining good performances when the collected water is intended solely for toilet flushing. In this case, the saving of water from other supply systems makes the RWH system to be cost-effective in most of the analyzed territory. In particular, a storage capacity of 20 m3 is able to ensure the complete meeting of water demand for toilet flushing in a wide northern area of Sicily. On the other hand, the use of rainwater for garden irrigation requires, in most of the island, higher storage capacities in order to obtain advantageous performances in terms of water saving. Due to the different temporal patterns of water demands, the coupling of the two uses, toilet flushing and garden irrigation, is not particularly advantageous for the considered storage volumes and collection surfaces.
The analysis of the monthly variability of the RWH system’s reliability showed that the temporal variability of rainfall over the year has an important impact on storage volume. In an area with uniform monthly precipitation throughout the year, a smaller storage volume is necessary than that required in an area with a distinct seasonal precipitation distribution.
Results from the application of the YAS algorithm to different sites in Sicily were used to analyze the correlation between mean annual precipitation and the reliability of the examined RWH system. The analysis defined curves that are valid for the entire area of study and relate to the above mentioned variables. The equations of these curves represent a useful tool for practical application in Sicily, easily and quickly providing a value of the RWH reliability corresponding to a given value of mean annual rainfall. The uncertainty related to the obtained curves was assessed by reducing the original dataset and obtaining alternative curves. Future research can assess the implications of household occupancy and the impacts of rooftop and courtyard areas and storage capacity on reliability. These factors can then be integrated into the proposed equations to obtain general relationships to more effectively evaluate the performance of any RWH system.
A cost-benefit analysis has been performed, providing the Net Present Value and the payback periods on the capital cost of system installation. Results enabled the identification of the most feasible tank capacity. Despite the high payback periods of capital cost, the environmental and social advantages related to the use of RWH systems cannot be neglected. Indeed, these systems promote a more sustainable water use and a greater resilience to water scarcity.
Further analysis should also account for the effect of climate change on precipitation. The equations presented here are valid under the assumption that the mean annual precipitation will not be affected by variations in the next years. The existence of trends could significantly affect the performance of an RWH system. Specifically, the reduction of rainfall amount and the variation of rainfall temporal distribution over the year (in particular the concentration of annual rainfall in short periods) could lead to a considerable decrease of the system efficiency. Therefore, the design of RWH tanks should also involve an analysis of future climate scenarios derived from regional climate models.
In summary, RWH systems can play an important role in supplementing conventional water supply systems. For this reasons, incentives and government support could be important to encourage householders to adopt RWH water systems in residential urban areas.


