
Effects of Environmental Factors on the Disinfection Performance of a Wastewater Stabilization Pond Operated in a Temperate Climate


Abstract
:1. Introduction
2. Materials and Methods
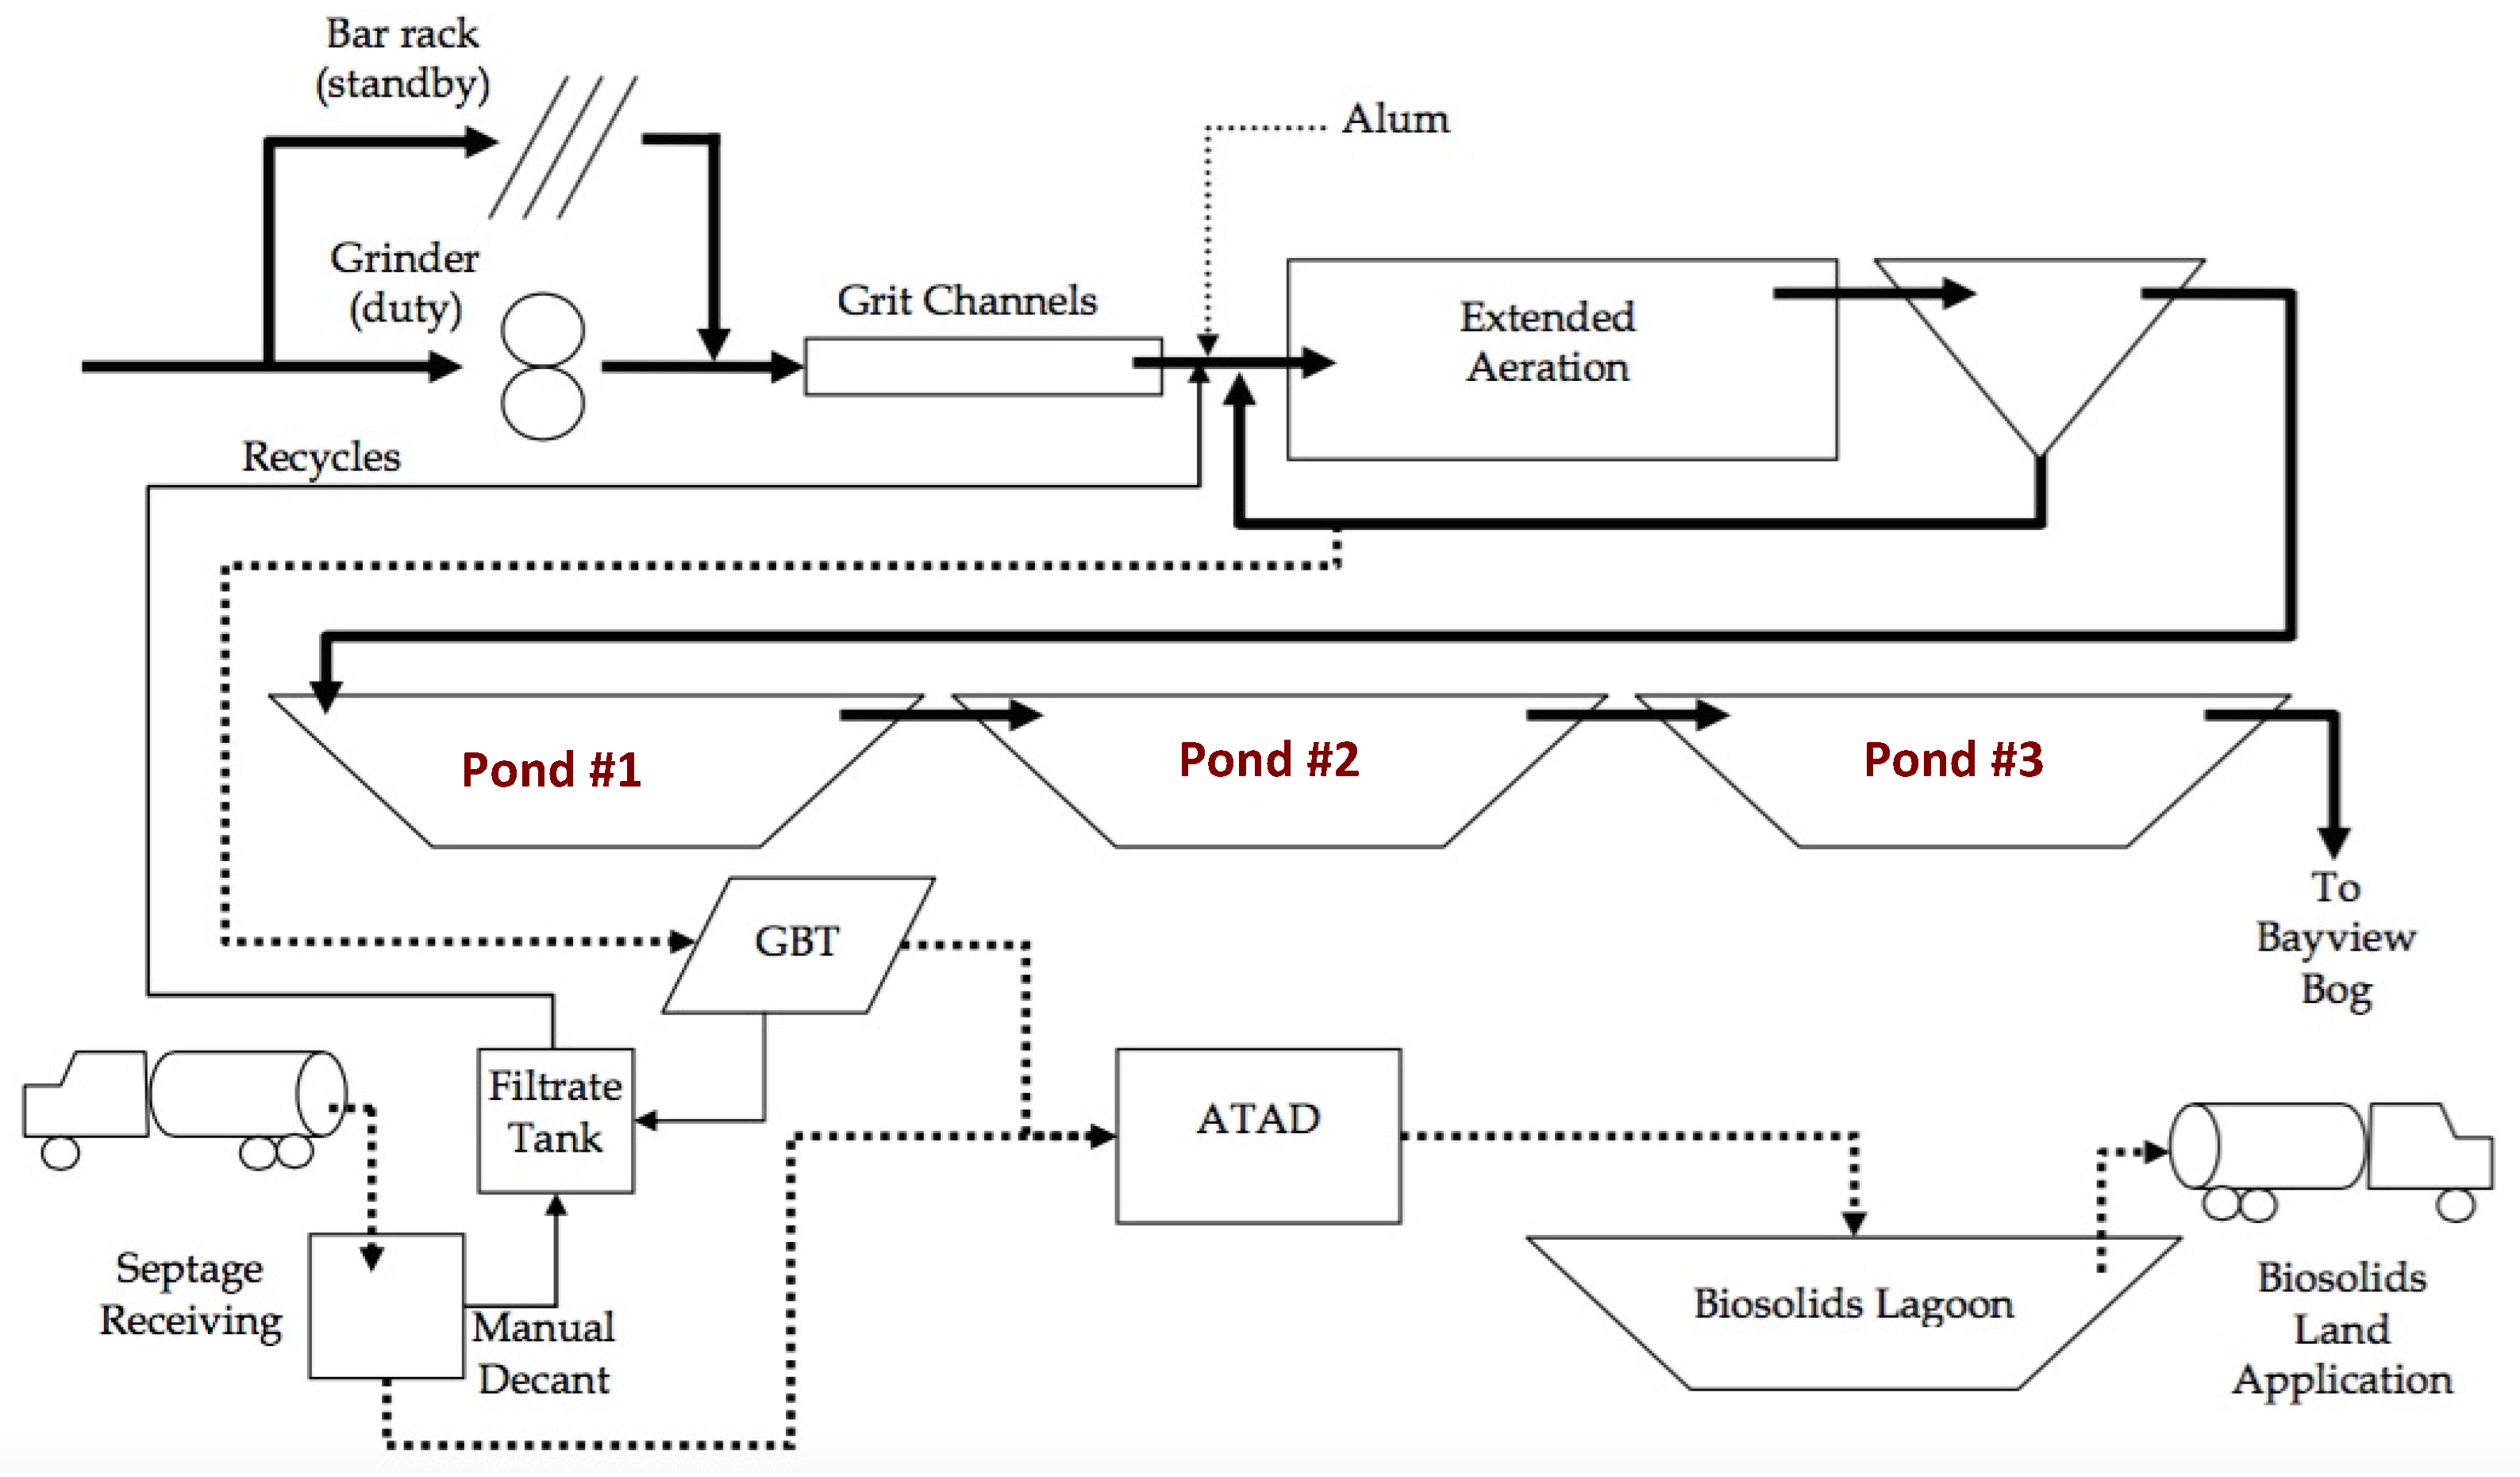
2.1. System Overview


| WSP | Surface Area (m2) | Volume (m3) | Depth (m) |
|---|---|---|---|
| 1 | 48,600 | 78,246 | 1.61 |
| 2 | 28,200 | 40,044 | 1.42 |
| 3 | 31,200 | 36,504 | 1.17 |
| Total | 108,000 | 154,794 | 4.2 |
2.2. Field Monitoring and Sampling
2.3. Statistical Analysis
3. Results and Discussion


| E. coli | |
|---|---|
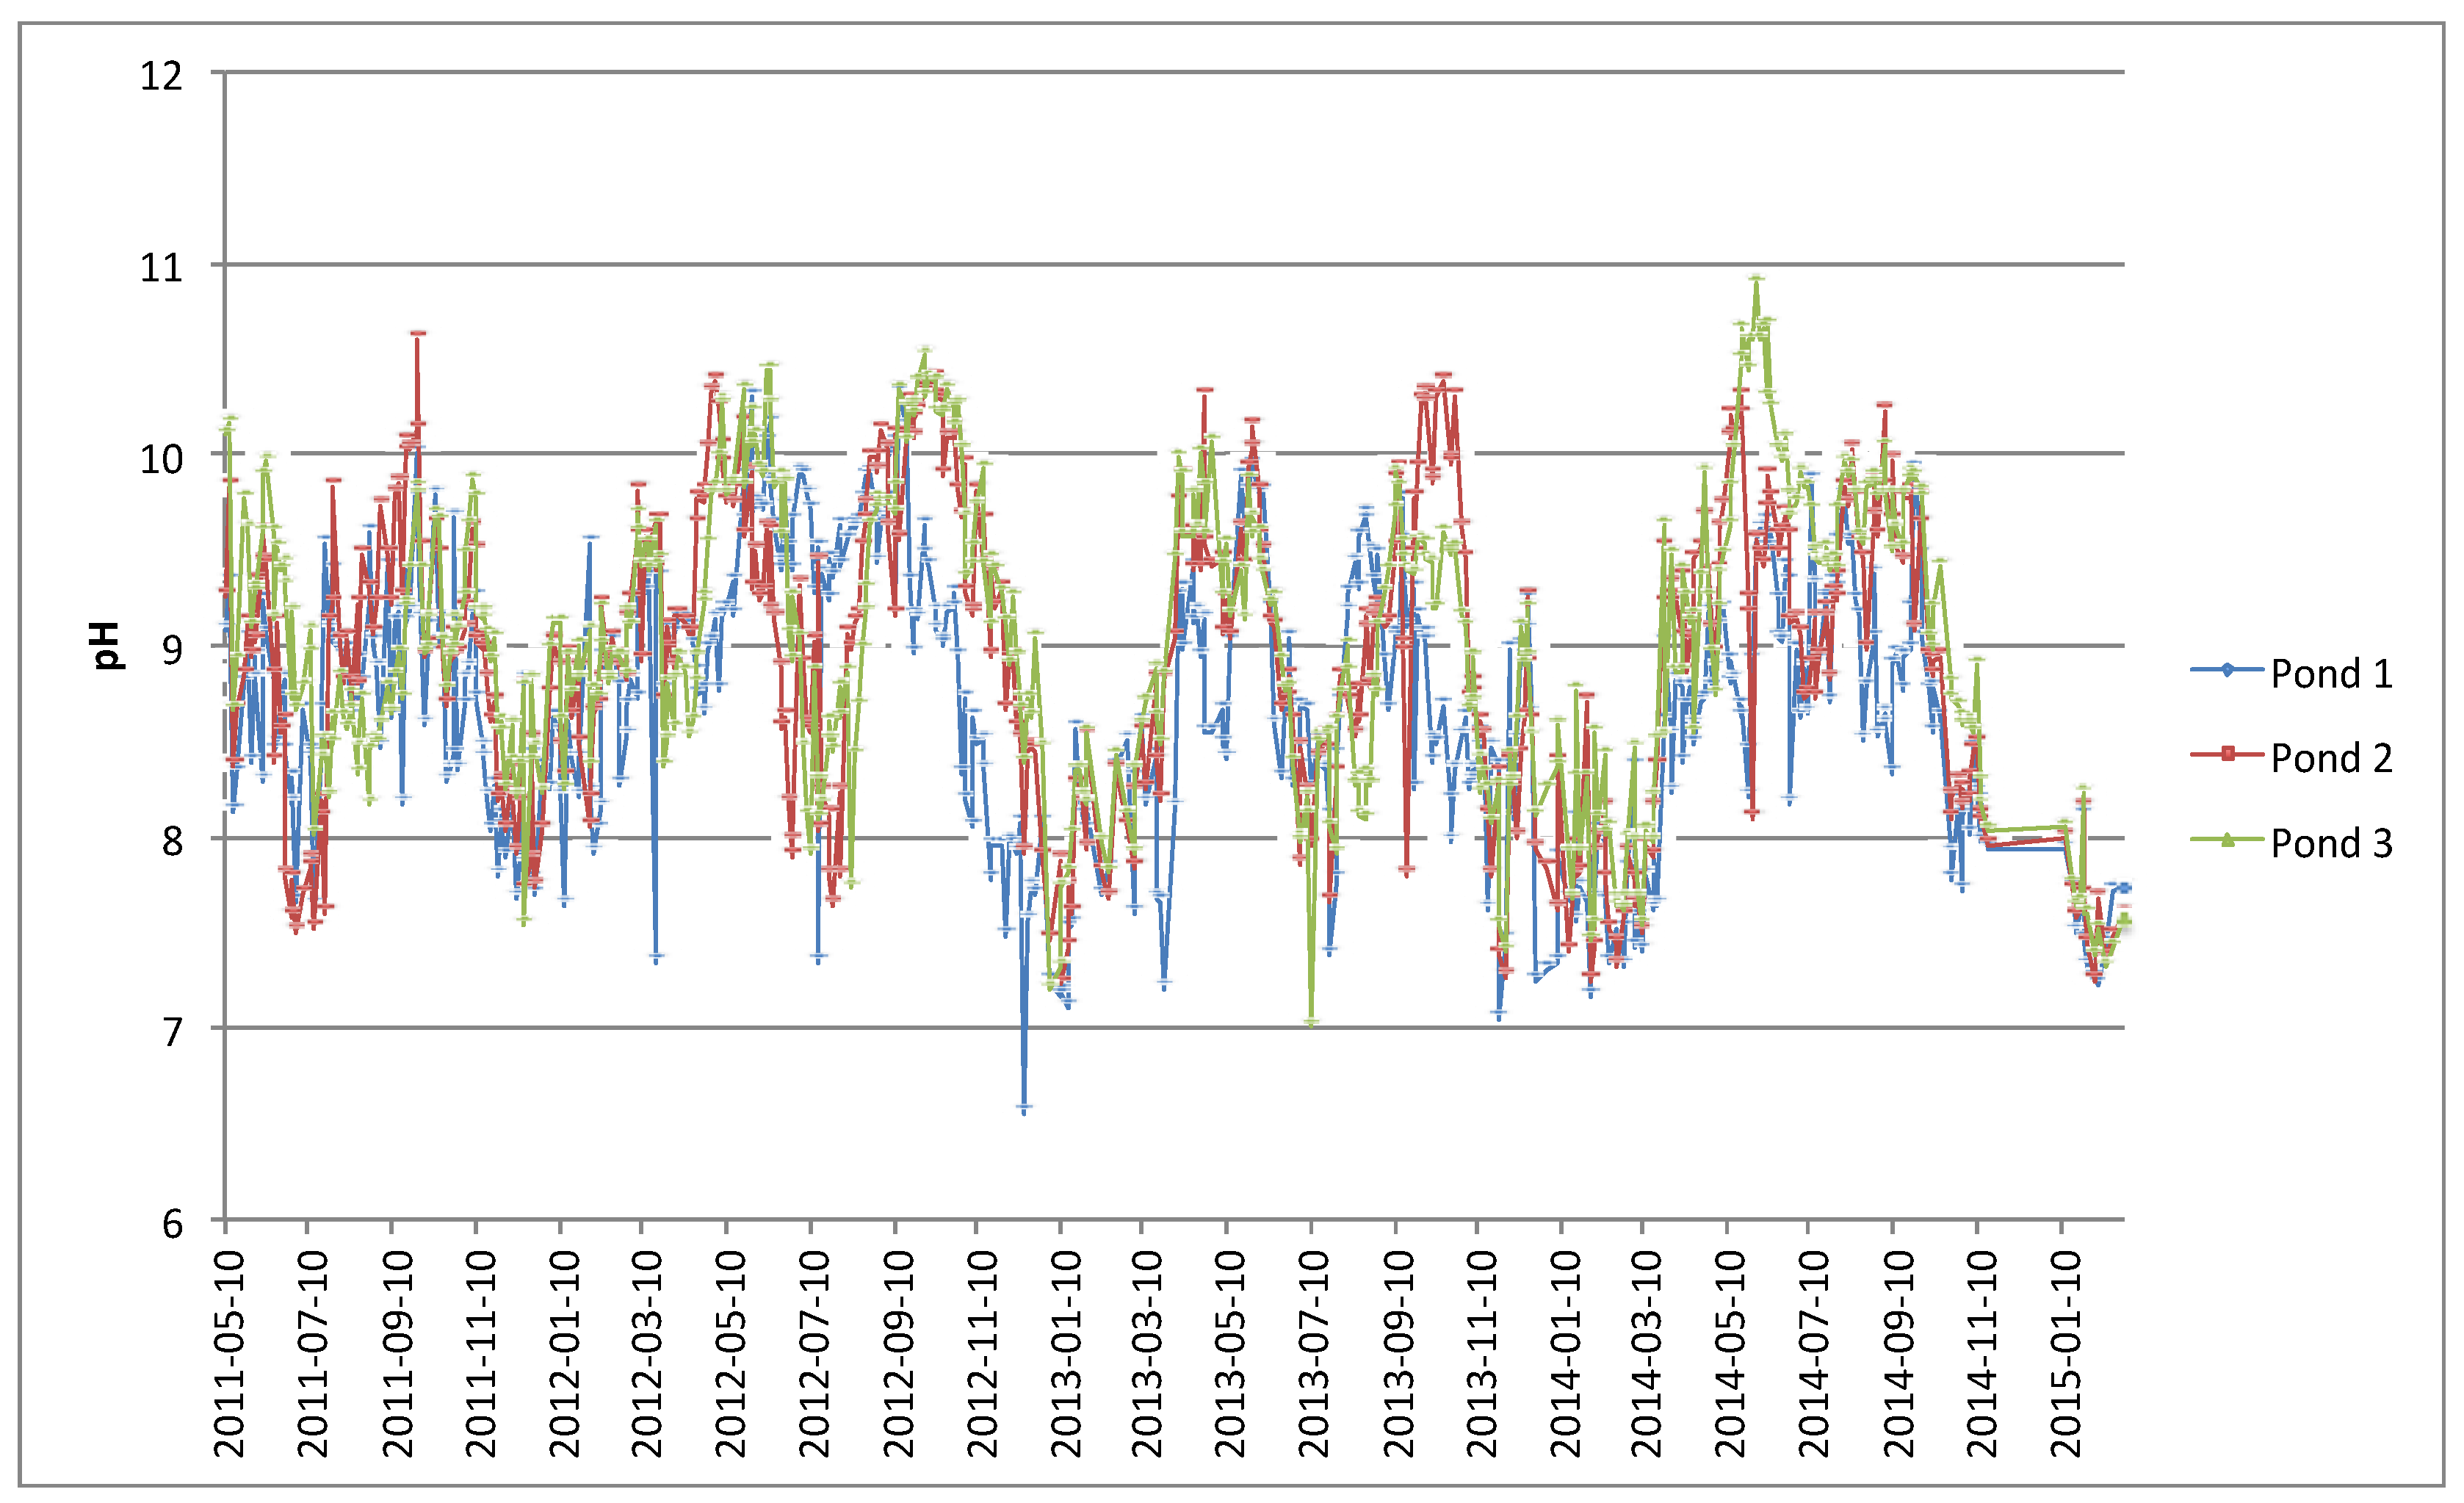
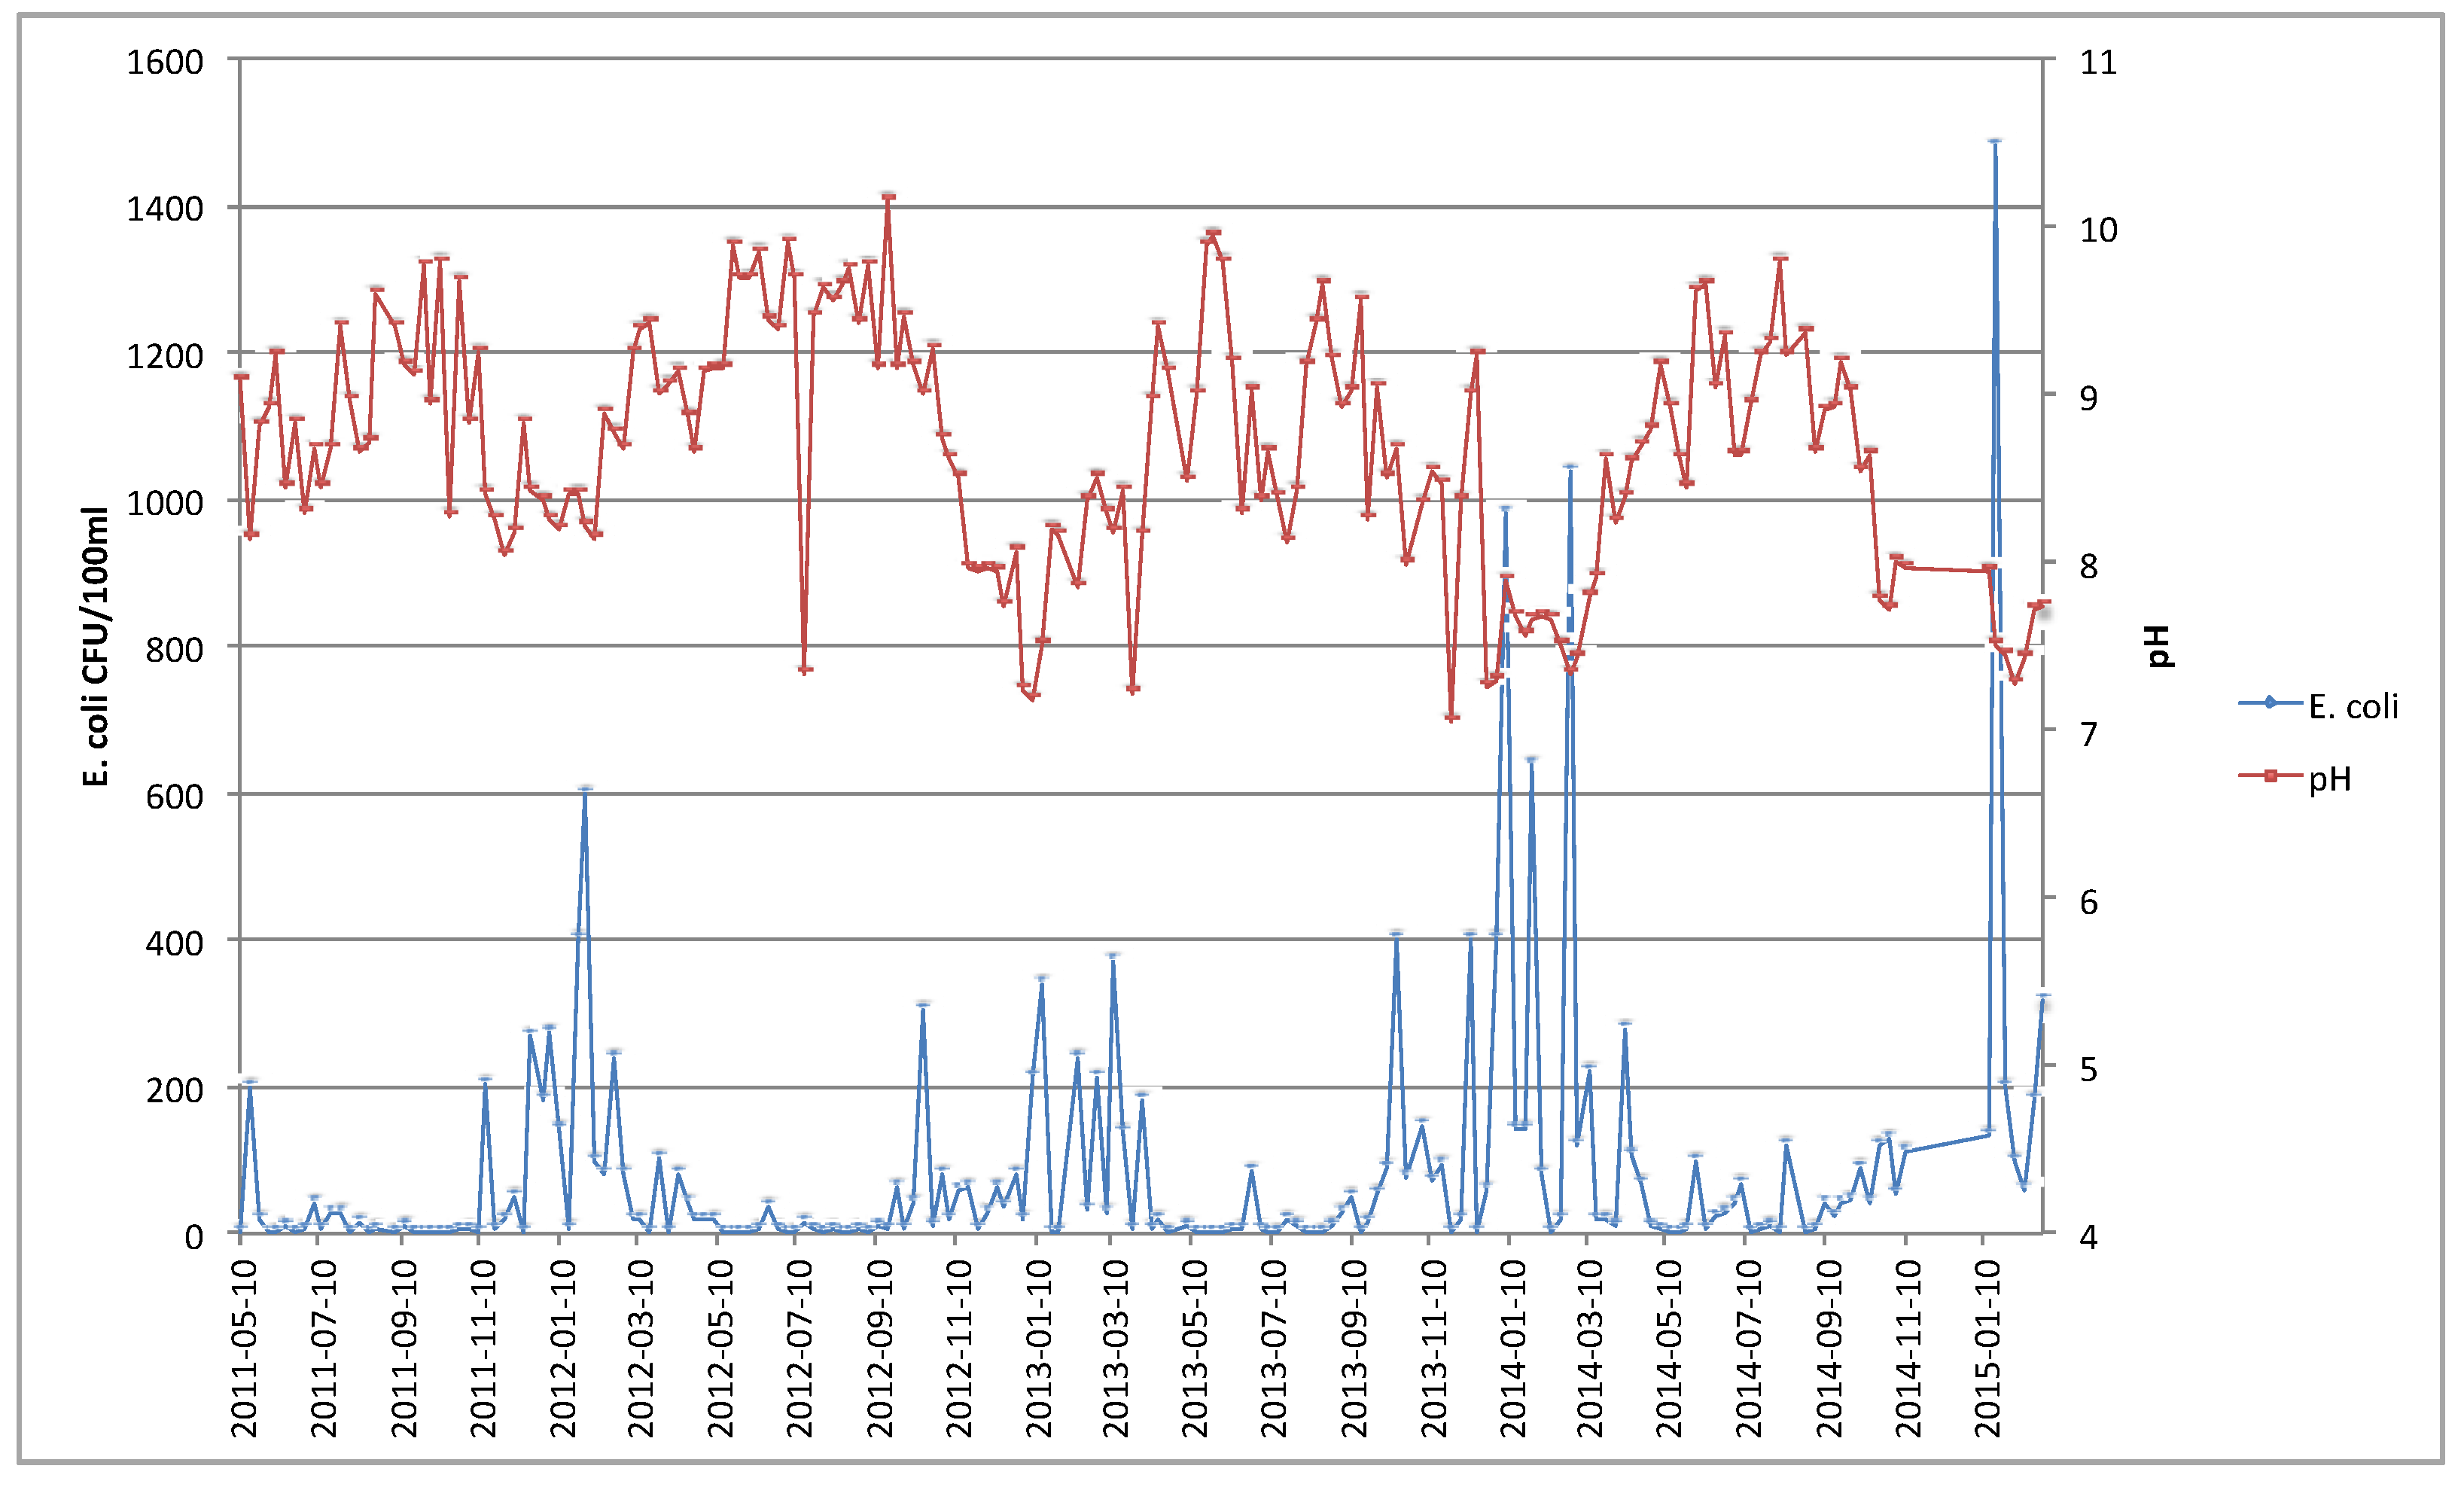
| pH | −0.54 |
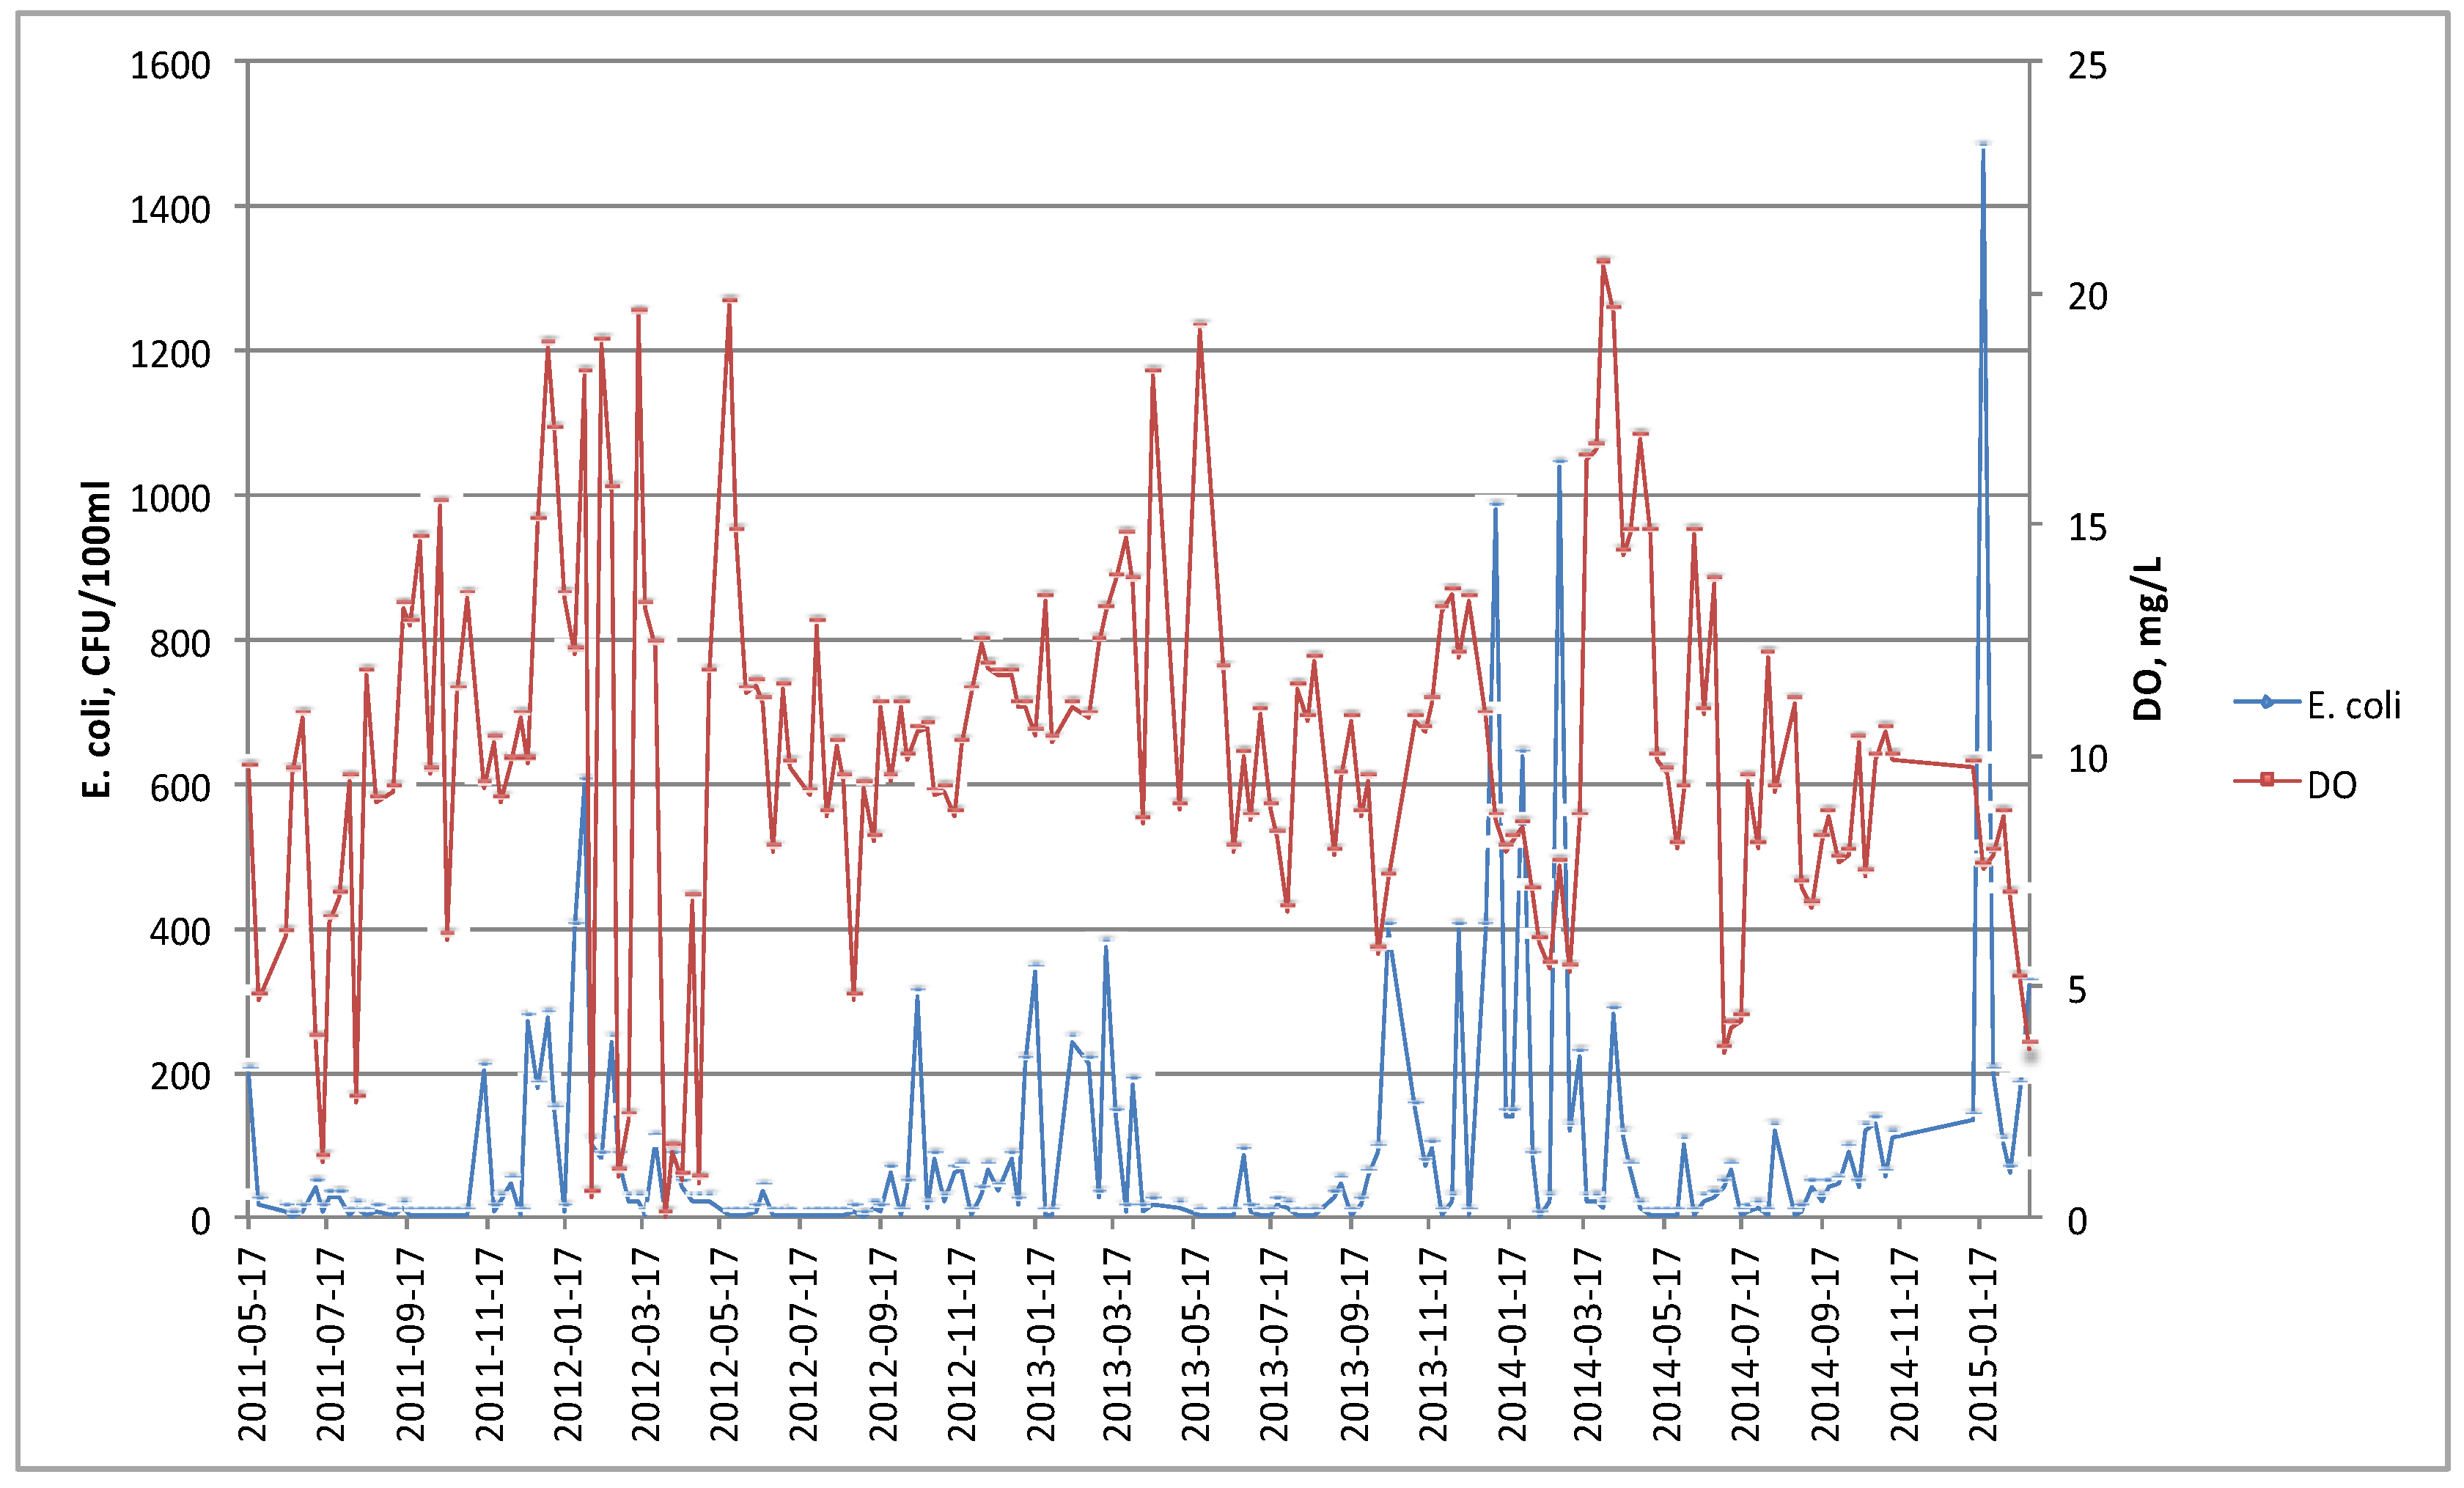
| DO | −0.11 |
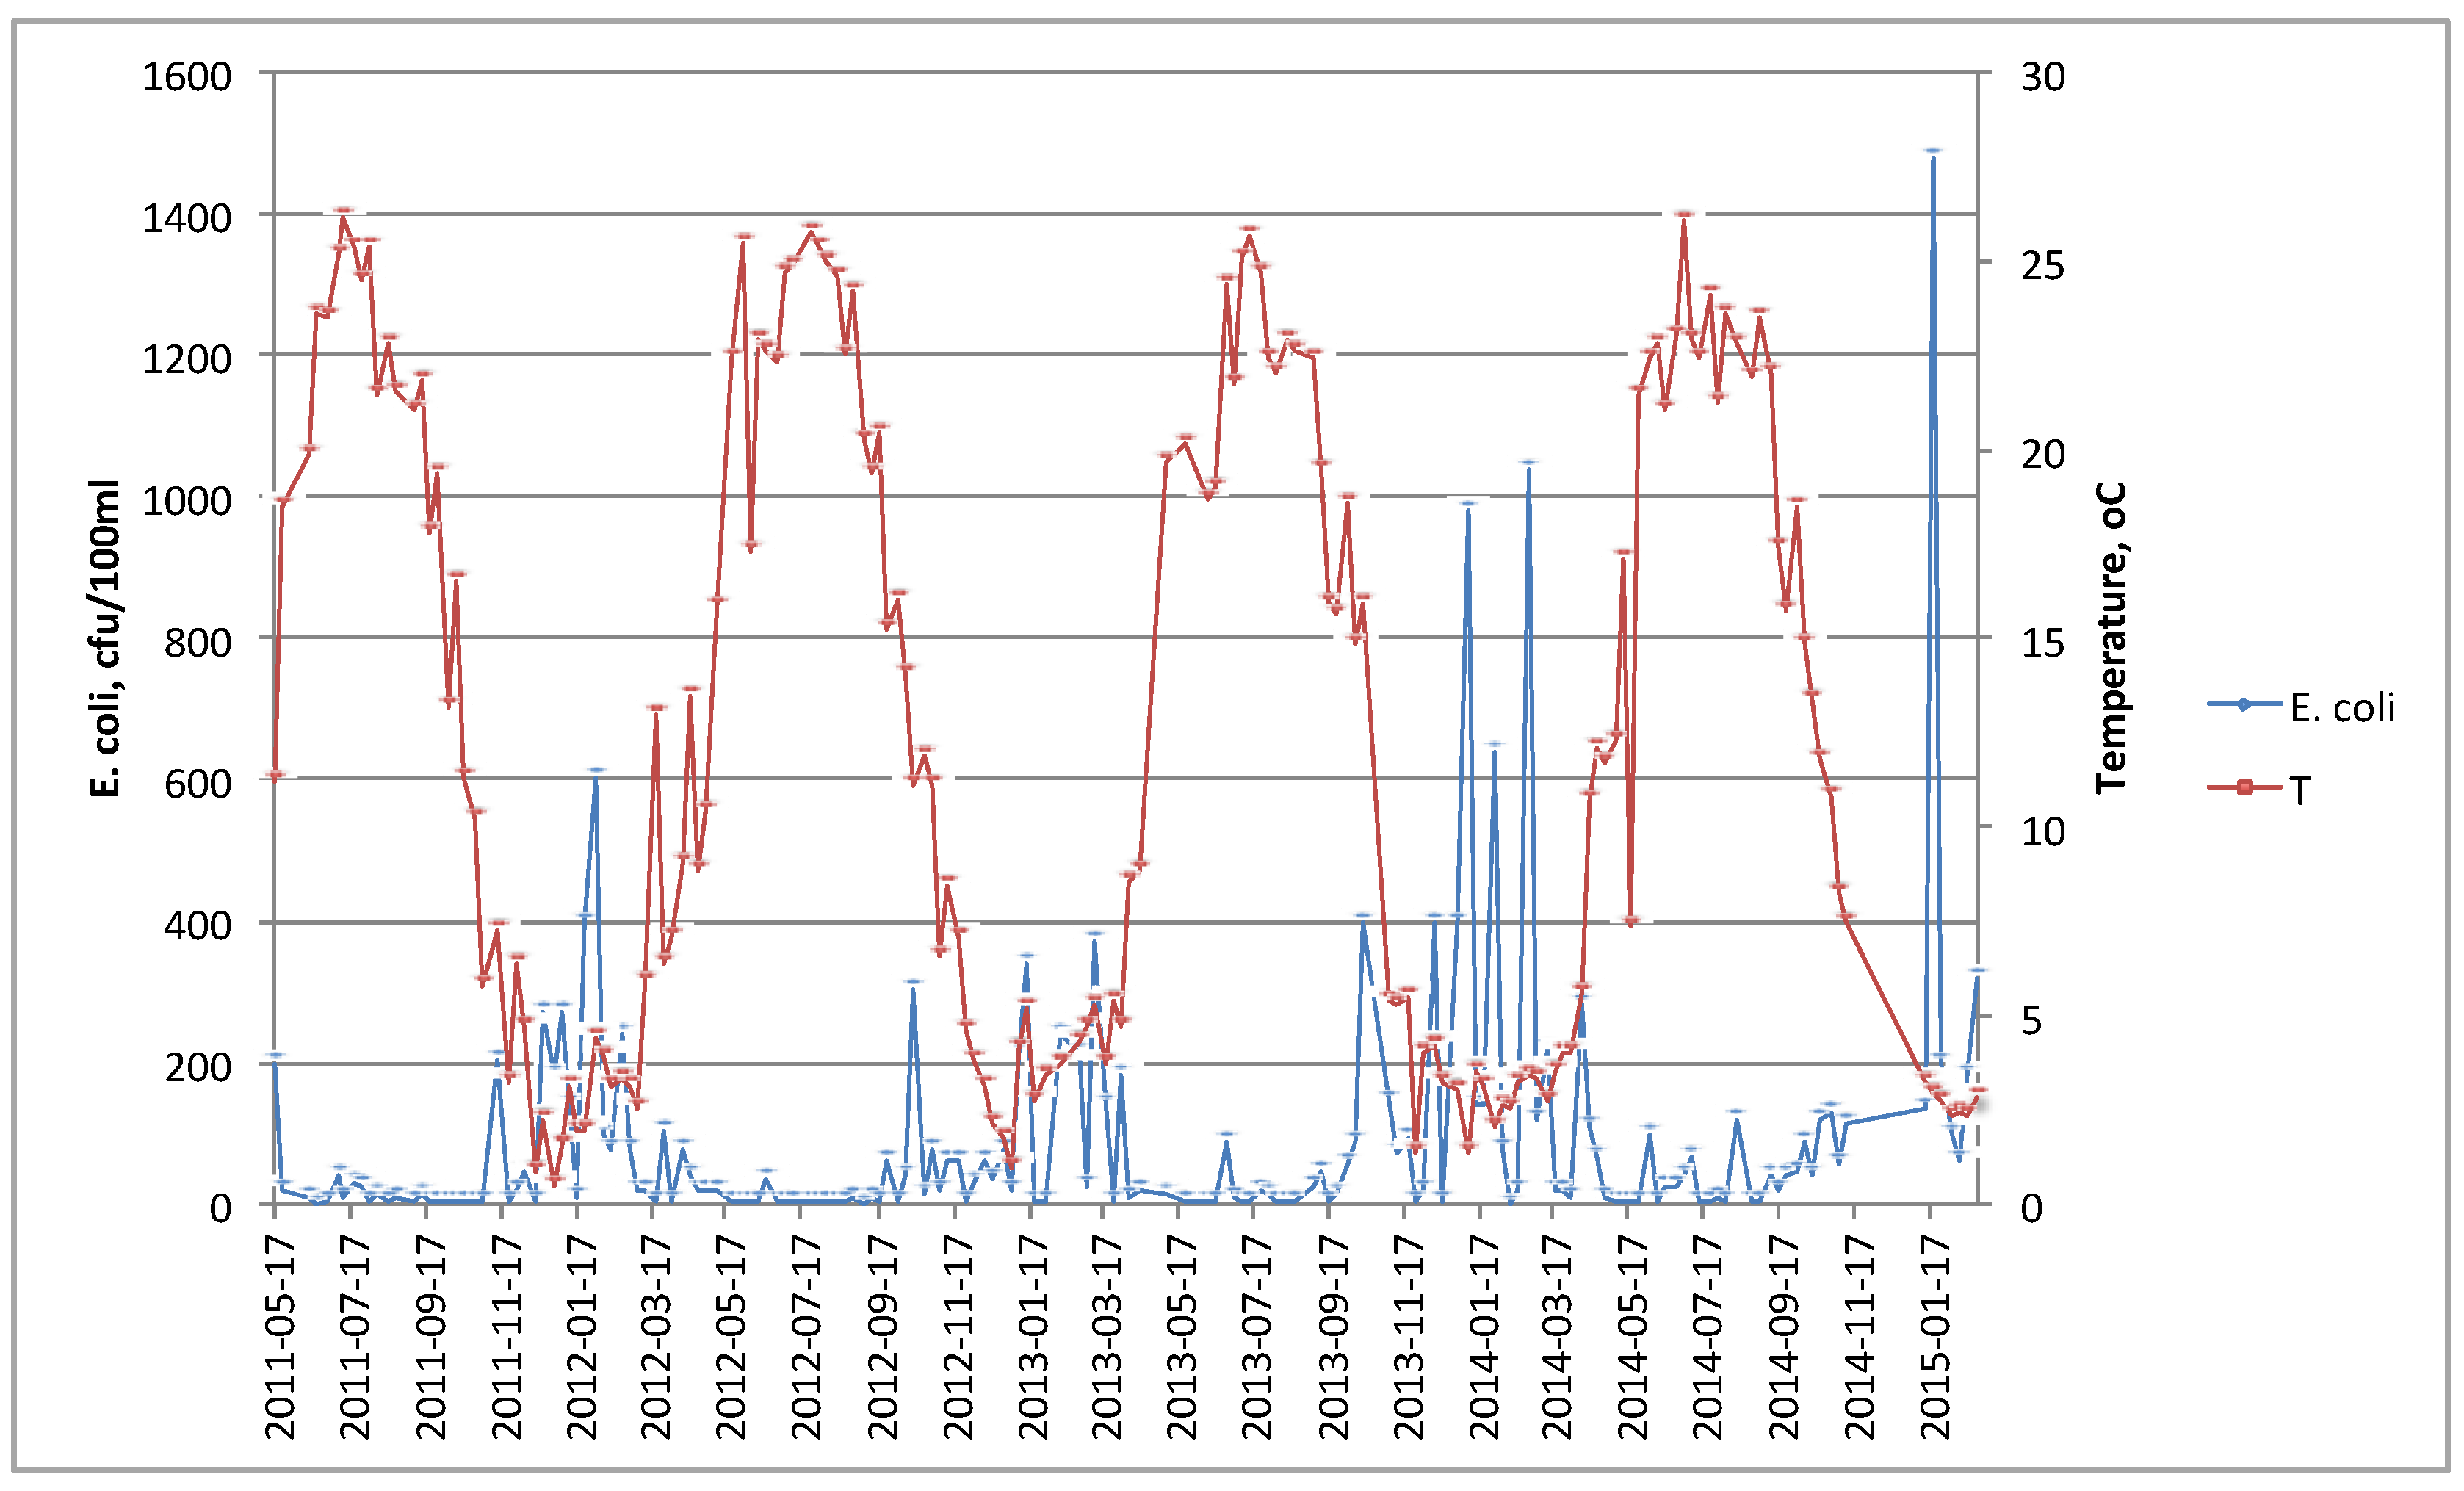
| Temperature | −0.5 |


4. Conclusions
Acknowledgments
Author Contributions
Conflicts of Interest
References
- Rose, J.B.; Farrah, S.R.; Harwood, V.J.; Levine, A.D.; Lukasik, J.; Menendez, P.; Scott, T.M. Reduction of Pathogens, Indicator Bacteria, and Alternative Indicators by Wastewater Treatment and Reclamation Processes; WERF Report; The International Water Social Association: London, UK, 2004. [Google Scholar]
- Mosteo, R.; Ormad, M.P.; Goni, P. Identification of pathogen bacteria and protozoa in treated urban wastewaters discharged in the Ebro River (Spain): Water reuse possibilities. Water Sci. Technol. 2013, 68, 575–583. [Google Scholar] [CrossRef] [PubMed]
- Bolton, N.F.; Cromar, N.J.; Hallsworth, P.; Fallowfield, H.J. A review of the factors affecting sunlight inactivation of microorganisms in waste stabilisation ponds: Preliminary results for enterococci. Water Sci. Technol. 2010, 61, 885–890. [Google Scholar] [CrossRef] [PubMed]
- Maynard, H.E.; Ouki, S.K.; Williams, S.C. Tertiary lagoons: A review of removal mechanisms and performance. Water Res. 1999, 33, 1–13. [Google Scholar] [CrossRef]
- Reinoso, R.; Torres, L.A.; Bécares, E. Efficiency of natural systems for removal of bacteria and pathogenic parasites from wastewater. Sci. Total Environ. 2008, 395, 80–86. [Google Scholar] [CrossRef] [PubMed]
- Jiménez, B. Helminth ova removal in wastewater and sludge for advanced and conventional sanitation. Water Sci. Technol. 2007, 56, 43–51. [Google Scholar] [CrossRef] [PubMed]
- Jiménez, B. Helminth Ova Control in Wastewater and Sludge for Agricultural Reuse, Water and Health. Available online: http://www.eolss.net/sample-chapters/c03/e2-20a-06-09.pdf (accessed on 15 April 2015).
- Drechsel, P.; Scott, C.A.; Raschid-Sally, L.; Redwood, M.; Bahri, A. Wastewater Irrigation and Health-Assessing and Mitigating Risk in Low-Income Countries; IDRC Books: Ottawa, ON, Canda, 2009. [Google Scholar]
- Ansa, E.D.O.; Lubberding, H.J.; Ampofo, J.A.; Amegbe, G.B.; Gijzen, H.J. Attachment of faecal coliform and macro-invertebrate activity in the removal of faecal coliform in domestic wastewater treatment pond systems. Ecol. Eng. 2011, 42, 35–41. [Google Scholar] [CrossRef]
- Molleda, P.; Blanco, I.; Ansola, G.; de Luis Calabuig, E. Removal of wastewater pathogen indicators in a constructed wetland in León. Span. Ecol. Eng. 2008, 33, 252–257. [Google Scholar] [CrossRef]
- Abreu-Acosta, N.; Vera, L. Occurrence and removal of parasites, enteric bacteria and faecal contamination indicators in wastewater natural reclamation systems in Tenerife-Canary Islands. Span. Ecol. Eng. 2011, 37, 496–503. [Google Scholar] [CrossRef]
- Lesgne, J.; Baleux, B.; Boussaid, A.; Hassan, L. Dynamics of non Vibrio cholerae in experimental sewage stabilization ponds under Mediterranean conditions. Water Sci. Technol. 1991, 24, 387–390. [Google Scholar]
- Mezrioui, N.E.; Oudra, B. Dynamics of picoplankton and microplankton flora in the experimental wastewater stabilization ponds of the arid region of Marrakech, Morocco and cyanobacteria effects on Escherichia coli and Vibrio cholerae survival. In Wastewater Treatment with Algae; Wong, Y.-S., Tam, N.F.Y., Eds.; Springer-Verlag and Landes Bioscience: New York, NY, USA, 1998; pp. 165–188. [Google Scholar]
- Awuah, E. Pathogen Removal Mechanisms in Waste Stabilisation Ponds. Ph.D. Thesis, Wageningen University/UNESCO-IHE Institute for Water Education, Wageningen, The Netherlands, 2006. [Google Scholar]
- Burkhardt, W., III; Kern, R.; Calci, W.; Watkins, D.; Rippey, S.R.; Chirtel, S.J. Inactivation of indicator organisms in estuarine waters. Water Res. 2000, 34, 2207–2214. [Google Scholar] [CrossRef]
- Len, Y.; Wen-Shi, C.; Mong-Na, L.H. Natural disinfection of wastewater in marine outfields. Water Res. 2000, 34, 743–750. [Google Scholar]
- Nascimento, M.J.; Oliveira, J.S.; Mexia, J.T. Contribution for the study of new pathogenic indicators removal from waste stabilization pond in Portugal. Water Sci. Technol. 1991, 24, 381–386. [Google Scholar]
- Loyalist Township. Available online: http://www.loyalisttownship.ca (accessed on 15 April 2015).
- Wallace, J.; Champagne, P.; Hall, G.; Yin, Z.; Liu, X. Determination of algae and macrophyte species distribution in three wastewater stabilization ponds using metagenomics analysis. Water 2015, 7, 3225–3242. [Google Scholar] [CrossRef]
- American Public Health Association (APHA). Standard Methods of Water and Wastewater, 18th ed.; American Public Health Association, American Water Works Association, Water Environment Federation publication: Washington, DC, USA, 1992. [Google Scholar]
- Mayes, W.M.; Batty, L.C.; Younger, P.L.; Jarvis, A.P.; Kõiv, M.; Vohla, C.; Mander, U. Wetland treatment at extremes of pH: A review. Sci. Total Environ. 2009, 407, 3944–3957. [Google Scholar] [CrossRef] [PubMed]
- Uusitalo, J. Algal carbon uptake and the difference between alkalinity and high pH (“alkalinization”), exemplified with a pH-drift experiment. Sci. Mar. 1996, 60, 129–134. [Google Scholar]
- Gschlößl, T.; Steinmann, C.; Schleypen, P.; Melzer, A. Constructed wetlands for effluent polishing of lagoons. Water Res. 1998, 32, 2639–2645. [Google Scholar] [CrossRef]
- Davies-Colley, R.J.; Donnison, A.M.; Speed, D.J.; Ross, C.M.; Nagels, J.W. Inactivation of faecal indicator microorganisms in waste stabilisation ponds: Interaction of environmental factors with sunlight. Water Res. 1999, 33, 1220–1230. [Google Scholar] [CrossRef]
- Ouali, A.; Jupsin, H.; Ghrabi, A.; Vasel, J.L. Removal kinetic of Escherichia coli and enterococci in a laboratory pilot scale wastewater maturation pond. Water Sci. Technol. 2014, 69, 755–759. [Google Scholar] [CrossRef] [PubMed]
- Awuah, E.; Anohene, F.; Asante, K. Environmental conditions and pathogen removal in macrophyte- and algal-based domestic wastewater treatment systems. Water Sci. Technol. 2001, 44, 11–18. [Google Scholar] [PubMed]
- Davies-Colley, R.J.; Donnison, A.M.; Speed, D.J. Towards a mechanistic understanding of pond disinfection. Water Sci. Technol. 2000, 42, 149–158. [Google Scholar]
- Ansa, E.D.O.; Lubberding, H.J.; Ampofo, J.A.; Gijzen, H.J. The role of algae in the removal of Escherichia coli in a tropical eutrophic lake. Ecol. Eng. 2011, 37, 317–324. [Google Scholar] [CrossRef]
- Davies-Colley, R.J.; Donnison, A.M.; Speed, D.J. Sunlight wavelengths inactivating faecal indicator microorganisms in waste stabilisation ponds. Water Sci. Technol. 1997, 35, 219–225. [Google Scholar] [CrossRef]
- Bosshard, F.; Bucheli, M.; Meur, Y.; Egli, T. The respiratory chain is the cell’s Achilles’ heel during UVA inactivation in Escherichia coli. Microbiology 2010, 156, 2006–2015. [Google Scholar] [CrossRef] [PubMed]
- Bosshard, F.; Riedel, K.; Schneider, T.; Geiser, C.; Bucheli, M.; Egli, T. Protein oxidation and aggregation in UVA irradiated Escherichia coli cells as signs of accelerated cellular senescence. Environ. Microbiol. 2010, 12, 2931–2945. [Google Scholar] [CrossRef] [PubMed]
- Curtis, T.P.; Mara, D.D.; Dixo, N.G.H.; Silva, S.A. Light penetration in waste stabilization ponds. Water Res. 1994, 28, 1031–1038. [Google Scholar] [CrossRef]
- Raven, J.A.; Geider, R.J. Temperature and algal growth. New Phytol. 1988, 110, 441–461. [Google Scholar] [CrossRef]
- Mezrioui, N.; Oufdou, K.; Baleux, B. Dynamics of non-01 Vibrio cholerae and faecal coliforms in experimental stabilization ponds in the arid region of Marrakesh, Morocco, and the effect of pH, temperature, and sunlight on their experimental survival. Can. J. Microbiol. 1995, 41, 489–498. [Google Scholar] [CrossRef] [PubMed]
- Barzily, A.; Kott, Y. Survival of pathogenic bacteria in an adverse environment. Water Sci. Technol. 1991, 24, 395–400. [Google Scholar]
- Pearson, H.W.; Mara, D.D.; Mills, S.W.; Smallman, D.J. Factors determining algal populations in waste stabilization ponds and influence on algae pond performance. Water Sci. Technol. 1987, 19, 131–140. [Google Scholar]
- Pearson, H.W.; Mara, D.D.; Mills, S.W.; Smallman, D.J. Physiochemical parameters influencing faecal bacteria survival in waste stabilization ponds. Water Sci. Technol. 1987, 19, 145–152. [Google Scholar]
- Polprasert, C.; Dissanayake, M.G.; Thanh, N.C. Bacterial die-off kinetics in waste stabilization ponds. J. Water Pollut. Control Fed. 1983, 55, 285–296. [Google Scholar]
- Von Sperling, M. Modelling of coliform removal in 186 facultative and maturation ponds around the world. Water Res. 2005, 39, 5261–5273. [Google Scholar] [CrossRef] [PubMed]
- Von Sperling, M. Performance evaluation and mathematical modelling of coliform die-off in tropical and subtropical waste stabilization ponds. Water Res. 1999, 33, 1435–1448. [Google Scholar] [CrossRef]
© 2015 by the authors; licensee MDPI, Basel, Switzerland. This article is an open access article distributed under the terms and conditions of the Creative Commons by Attribution (CC-BY) license (http://creativecommons.org/licenses/by/4.0/).
Share and Cite
Liu, L.; Hall, G.; Champagne, P. Effects of Environmental Factors on the Disinfection Performance of a Wastewater Stabilization Pond Operated in a Temperate Climate. Water 2016, 8, 5. https://doi.org/10.3390/w8010005
Liu L, Hall G, Champagne P. Effects of Environmental Factors on the Disinfection Performance of a Wastewater Stabilization Pond Operated in a Temperate Climate. Water. 2016; 8(1):5. https://doi.org/10.3390/w8010005
Chicago/Turabian StyleLiu, Lei, Geof Hall, and Pascale Champagne. 2016. "Effects of Environmental Factors on the Disinfection Performance of a Wastewater Stabilization Pond Operated in a Temperate Climate" Water 8, no. 1: 5. https://doi.org/10.3390/w8010005