Article

Reduced Runoff Due to Anthropogenic Intervention in the Loess Plateau, China

1
Key Laboratory of Water Cycle and Related Land Surface Processes, Institute of Geographic Sciences and Natural Resources Research, Chinese Academy of Sciences, Beijing 100101, China
2
University of Chinese Academy of Sciences, Beijing 100049, China
3
Key Laboratory of Watershed Geographic Sciences, Nanjing Institute of Geography and Limnology, Chinese Academy of Sciences, Nanjing 210000, China
4
Guizhou Survey/Design Research Institute for Water Resources and Hydropower, Guiyang 550000, China
5
Yellow River Institute of Hydraulic Research, Yellow River Conservancy Commission, Zhengzhou 450003, China
*
Author to whom correspondence should be addressed.
Water 2016, 8(10), 458; https://doi.org/10.3390/w8100458
Submission received: 2 August 2016 / Revised: 10 October 2016 / Accepted: 12 October 2016 / Published: 17 October 2016

Abstract

:
To maintain the sustainable utilization of water resources and reduce soil erosion in the Loess Plateau, the Chinese government has adopted a number of environmental restoration strategies since 1999, including the Grain for Green Project (GFGP) and the Natural Forest Conservation Program; these large projects greatly alter the regional water cycle. Detecting runoff changes and quantitatively assessing the contribution of anthropogenic activities (including land use/cover change (LUCC) and water diversion) and climate change (including potential evaporation and precipitation) are imperative for implementing sustainable management strategies. Using observed records from 15 hydrological stations and 85 national meteorological stations from 1980 to 2013, the decomposition method, based on the Budyko hypothesis, is used to quantify the impact of climate variation and anthropogenic interference on annual runoff for the 12 catchments in the Loess Plateau. The results show the following: (1) the observed annual runoff exhibited a negative trend in all 12 catchments (significant in eight catchments) with a range of −1.94 to −0.16 mm·year−1 and exhibited a substantial difference before and after 1999; (2) the sensitivity of runoff to vegetation change, precipitation, and potential evapotranspiration increased in most catchments after 1999, indicating that great challenges and uncertainties might be introduced to regional water resource availability; and (3) the anthropogenic interference, particularly LUCC caused by forest strategies, has become the main contribution to runoff change. We suggest that more attention should be given to water resource availability and that the hydrologic consequences of revegetation should be taken into account in future management.

1. Introduction

Intensifying anthropogenic interference and changing climate can greatly impact land surface processes [1], particularly the water cycle [2]. The hydrological cycle and water yield can be directly or indirectly affected by changes in climate and human activities and will be more vulnerable to anthropogenic disturbance and natural change in semi-arid and semi-humid regions [3,4]. The change in runoff, one of the most pressing issues in hydrological research, is also mainly influenced by climatic variability and human activities [5,6,7,8]. Climate variables include precipitation, temperature, and radiation, whereas the influences of anthropogenic interference are mainly manifested by water diversion [9], hydropower development [10], reservoir regulation [5,6], agricultural irrigation [7], urbanization [11], and land use/cover change (LUCC) [8,12,13] in general. Quantification of runoff changes and identifying the various factors that contribute to these changes are both a challenge and a necessity for a better understanding of the variation mechanisms in the hydrological cycle and water yield, and can be greatly beneficial in improving basin water management.
There are various methods to quantitatively assess the climatic and human impact on runoff change [14], such as hydrological modeling [15,16] and the elasticity method [17,18]. In these methods, the elasticity method coupled with the Budyko hypothesis is considered an effective way to separate the sensitivity and contribution of climate change and human activities to runoff [8,19,20,21]. Liu et al. [21] investigated the sensitivity of runoff to climate change and human activities in the Danjiangkou Reservoir using the climate elasticity method and found that climate variation was the dominant contributor to runoff change. Based on the Budyko hypothesis, Zheng et al. [17] found that the LUCC played a more important role in the decreased runoff in the headwaters of the Yellow River Basin.
The Loess Plateau (LP) is located in the middle reaches of the Yellow River in the transition zone between the semi-arid and semi-humid regions of China; thus, it is sensitive to climate change [22] and vulnerable to human activities [23]. In recent decades, due to economic growth, population increase, urbanization, and climate change, the LP ecosystem has been severely disturbed, and the sustainable availability of water resources in the Yellow River Basin has become a serious and urgent problem to be solved [4]. To address this issue, the Chinese government adopted various strategies to solve the water resources deficit since 1999, including the Natural Forest Conservation Program (NFCP) and Grain for Green Project (GFGP) [24]. Until recently, the vegetation cover increased significantly on the Loess Plateau (it doubled according to monitoring from satellites between 1999 and 2013), and the ecological degradation was effectively halted [25,26,27]. Thus, researchers argue [25,28,29] that vegetation has reached a balance with water availability, climate conditions, and levels of erosion, and that the development of the GFGP should be slowed down. Otherwise, the continued expansion of reforestation will intensify the water resource shortage, and then decrease the vegetation cover and vegetation diversity [30]. However, the Chinese government implemented new strategies to expand the GFGP, with the aim of converting 2.8 million m2 of cultivated land to forest or grassland by 2020 [31]. It is urgent to reassess the water resource availability, especially in terms of runoff and its related factors since 1999; this is significant not only for water resource security but also for regional development. Many studies have reported the decreasing trend of runoff in one or several basins in the Loess Plateau for the last several decades [3,23]. Huang et al. [32] evaluated the impact of afforestation on runoff in a pair of small watersheds (≤1.15 km2) from 1956 to 1980, and found that afforestation caused a 32% reduction in runoff. Li et al. [33] separated the impact of human activities and climate change in the Wuding River during the period 1961–1997, finding that soil conservation measures and climate change accounted for 87% and 13%, respectively, of the total reduction in the annual decrease in runoff. Zhang et al. [3] compared the responses of runoff to climate changes and LUCC in 11 basins from 1956 to 2000 and found that LUCC was the dominant factor accounting for runoff reduction in eight out of the 11 catchments. However, few studies have focused on the dynamics of runoff after implementation of the GFGP (i.e., 2000–2013). In addition, most studies only considered human interference in terms of LUCC (human indirect impact), neglecting direct human impacts such as water diversion. Water diversion can account for approximately 37% of observed runoff in the Loess Plateau [4], and the conclusions might be impaired if they do not consider water consumption and diversion in the climate and Earth system models [7]. Therefore, the novel points of our paper are as follows: (1) obtaining the latest dynamics of runoff compared with the period 1980–1999; (2) quantifying the impact of water diversion to runoff (significant but always neglected in previous studies); (3) selecting typical basins across the Loess Plateau for the study.
Distinguishing the relative impacts of anthropogenic interference, particularly indirect (LUCC) and direct impacts (water diversion), and climatic change on runoff is vital for understanding the consequences of climate change and implementing sustainable ecological restoration strategies for the Loess Plateau. The main objectives of this paper are to (1) investigate the runoff trends in the 12 catchments from 1980 to 2013, and study the difference between 1980–1999 (Period I) and 2000–2013 (Period II); (2) analyze the elasticity of runoff to precipitation, potential evaporation, and vegetation change between the two periods; and (3) determine the contributions of climatic and human factors to the variation of runoff. This study is structured as follows: In Section 2 and Section 3, the study area, datasets, and methodology used in our study are described. In Section 4, the trends and elasticity of runoff are evaluated, and the contributions of climate and human activities are determined. In Section 5, the relationship between the vegetation condition and runoff change is discussed. The conclusions are presented in the final section.

2. Study Area and Data
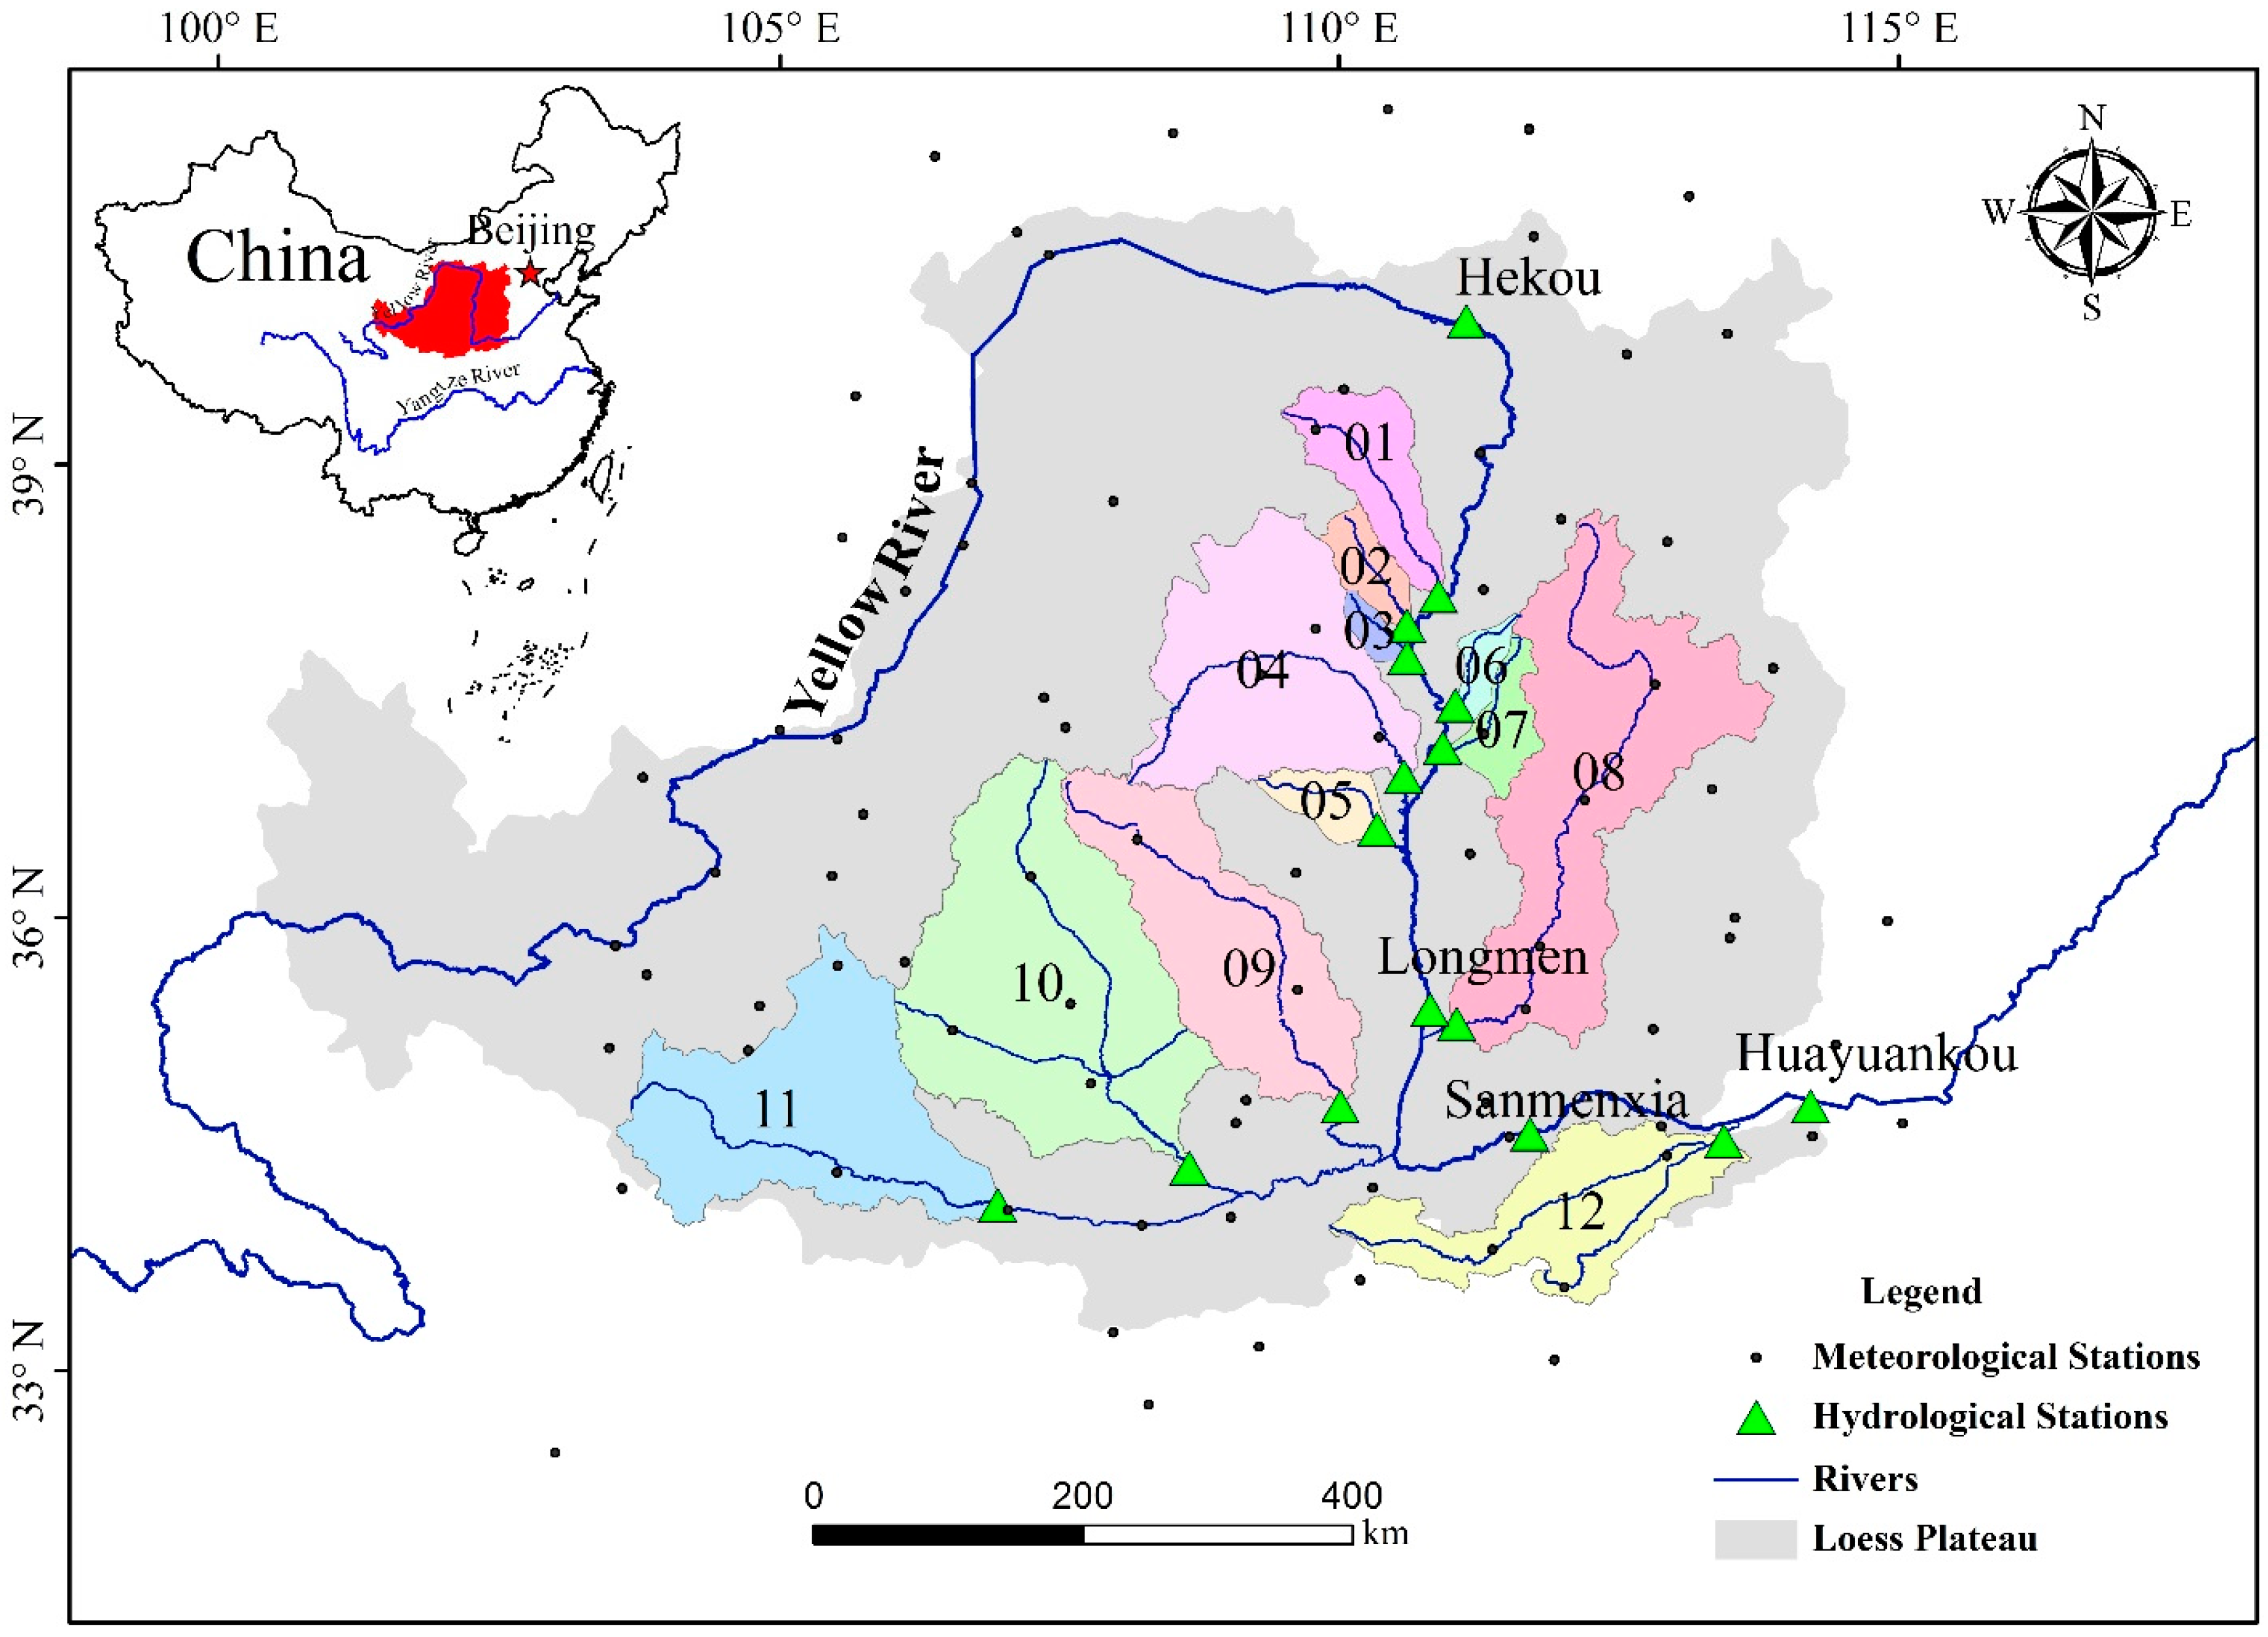
2.1. Study Area

The Loess Plateau (33°43′–41°16′ N, 100°54′–114°33′ E) is located in the middle reaches of the Yellow River Basin in China (Figure 1), covering approximately 6.2 × 10⁵ km2 and accounting for approximately 6.7% of the total land area of China. The rainy season, from June to September, accounts for approximately 65% of the total precipitation, most of which is in the form of frequent high-intensity storms [34]. Vegetation cover consists of forest, forest steppe, typical steppe, and desert steppe zones from southeast to northwest, and the land use is predominantly cultivated croplands and improved grassland. The 12 unregulated catchments selected in this paper are located on the tributary of the Yellow River without large reservoirs. The Basin ID and basic information of the catchments are shown in Figure 1 and Table 1. The area of basins varies from 1121 km2 in Jialu River to 43,216 km2 in Jing River. The multi-year mean runoff depth ranges from 13.52 mm in Fen River to 113.47 mm in Yiluo River. The precipitation increases gradually from 379 mm·year−1 in the northwestern Kuye River basin to 677 mm·year−1 in the southeast Yiluo River basin, whereas the potential evaporation follows the reverse spatial distribution of precipitation, i.e., generally decreasing from the northwest to southeast basins. The aridity index in all of the basins is higher than 1.37 and less than 2.59; thus, most of the Loess Plateau belongs to semi-humid and semi-arid regimes [35].

2.2. Data Collection

The monthly meteorological records (including precipitation, temperature, relative humidity, and sunshine duration) of 85 national meteorological stations from 1980 to 2013 from the National Climatic Center of China Meteorological Administrator were used in the paper (Figure 1). The datasets of LUCC in 1990 and 2010 were obtained from the Institute of Geographic Sciences and Natural Resources Research, CAS (http://www.resdc.cn/data.aspx?DATAID=99) with a spatial resolution of 1 km × 1 km [36]. The annual observed runoff at hydrological stations and water diversion from each basin (Figure 1) were obtained from the Yellow River Hydrological Bureau (YRHB). The daily water diversion was observed by YRHB at each section of the basins, and then was aggregated to the year. The naturalized runoff was obtained from the observed runoff and calibrated water diversion. The improved third-generation Global Inventory Modeling and Mapping Studies [37] Normalized Difference Vegetation Index (NDVI) and Leaf Area Index (LAI) (http://cliveg.bu.edu/modismisr/lai3g-fpar3g.html) were employed to investigate the vegetation condition change.

3. Methodology

3.1. Statistical Methods

The rank-based non-parametric Mann-Kendall statistical test [38] is commonly used for trend detection due to its robustness for non-normally distributed data, hence it is frequently applied to hydro-climatic time series [39,40]. Assuming a normal distribution at the significant level of p = 0.05, a positive Mann-Kendall statistic Z larger than 1.96 indicates an significant increasing trend, whereas a negative Z lower than −1.96 indicates a significant decreasing trend. Critical Z values of ±1.64, ±2.58, and ±3.29 were used for the probabilities of p = 0.1, 0.01, and 0.001, respectively. Spatial interpolation with the Kriging method and zonal statistical method in the ArcGIS 10.2 spatial analysis toolbox [34] was used to obtain the spatial distribution of the monthly and annual precipitation and the LAI and NDVI information in each basin.

3.2. Potential Evaporation

The Penman-Monteith ET0 [41] is calculated at a daily scale according to the following equation:
E T 0 = 0.408 Δ ( R n G ) + γ 900 T a + 273 u 2 V P D Δ + γ ( 1 + 0.34 u 2 )
where Rn is the net radiation at the canopy surface (MJ·m−2·d−1), G is the soil heat flux density (MJ·m−2·d−1) calculated by the difference of the mean daily air temperature between two continuous days, Ta is the mean daily air temperature at 2 m height (°C), u2 is the wind speed at 2 m height (ms−1), VPD is the vapor pressure deficit (kPa) (the difference between saturated and actual vapor pressure), ∆ is the slope of saturated vapor pressure in relation to air temperature (kPa·°C−1), and γ is the psychrometric constant (kPa·°C−1). Rn is a function of solar radiation, which can be estimated by the difference between the net shortwave radiation (Rns) and the net long-wave radiation (Rnl). Rs can be estimated as follows:
R s = ( a s + b s n N ) R a
where n is the actual duration of sunshine (hours), N is the maximum possible duration of sunshine or daylight hours (h) (n/N is the relative sunshine duration), and Ra is the extraterrestrial radiation intensity (MJ·m−2·d−1). The coefficients as and bs were estimated by an optimized method for solar radiation [42], which can improve the precision of the ET0 estimation.

3.3. Attribution Analysis of Runoff Change

The elasticity coefficient was proposed by Schaake and Waggoner [43] and defined as the ratio of the change rate of the dependent variable to the change rate of the independent variable. It has been considered an effective indicator of runoff sensitivity to the other variables (such as precipitation and potential evapotranspiration) [17,21,44]. The elasticity of runoff to potential impact factors can be expressed by the following equation:
E x = lim Δ x / x 0 [ Δ R / R Δ x / x ] = R x × x R
where R is the runoff (mm) and x is the factor (such as climate change or human activities) that can influence the runoff. The elasticity method can quantitatively separate the contribution of underlying factors to runoff, and it has been widely used in hydrological research [19,45]. A positive (negative) elasticity coefficient of the x factor suggests that an increase (decrease) in the x variable will cause an increase (decrease) in runoff. An elasticity coefficient of 0.1 indicates that a 10% increase of the x factor would lead to an increase in runoff of 1%. For a specific catchment, the climate change and anthropogenic interference can play important roles in the observed runoff change. The impact of climate change on runoff includes the variation of precipitation and evaporation. The anthropogenic interference can be separated into direct impacts (including water diversion from the river for agricultural irrigation, industry, and domestic use) and indirect impacts (including LUCC, soil, and terrain). Thus, the change in runoff can be expressed as follows [7]:
Δ R o b s = Δ R c + Δ R h u m a n = ( Δ R P + Δ R E T 0 ) + ( Δ R d i r + Δ R i n d i r )
where Δ R c and Δ R h u m a n are changes in runoff due to the climatic change (including precipitation change Δ R P and potential evaporation Δ R E T 0 ) and human disturbance (direct impact Δ R d i r and indirect impact Δ R i n d i r ), respectively.
The naturalized runoff ( Δ R n a t u r a l ) can be estimated by summing the observed runoff ( Δ R o b s ) and the water diversion ( Δ R d i v , also the direct impact Δ R d i r ) as follows:
Δ R n a t u r a l = Δ R o b s + Δ R d i v
In addition, the soil or terrain for a given basin always remains unchanged; thus, LUCC is considered the main reason causing the runoff change. On this assumption, Equation (4) can be rearranged as follows:
Δ R n a t u r a l = Δ R P + Δ R E T 0 + Δ R L U C C
For a long-term period (usually an annual or longer time scale) in a closed basin, the water storage change is always assumed to be negligible, steady-state water flow [46,47,48]. The runoff change, with the assumption of negligible changes in water storage, can be calculated on the basis of the long-term balance as follows [7]:
R = P E T a
where R is the annual natural runoff at multi-year scale (mm·year−1), P is annual precipitation (mm·year−1), and ETa is annual actual evapotranspiration (mm·year−1).
Without considering the water storage change, the long term actual evapotranspiration E T a can be estimated using the Budyko framework [49]. The Budyko framework is considered a simple but effective tool for evaluating linkages and feedbacks between climate change and underlying surface characteristics of water and energy cycles at the basin [50] and global scale [51]. One of the proposed equations, based on the Budyko framework, is the Choudhury-Yang Equation [19,45,52]:
E T a = P E T 0 ( P n + E T 0 n ) 1 / n
It has been reported that the parameter of n can effectively reflect the plant condition in a basin [53], and a strong relationship exists between the change in the landscape parameter n and vegetation change [19]. Based on Equations (7) and (8), the change in naturalized runoff can be expressed as a differential equation as follows:
d R = f P d P + f E T 0 d E T 0 + f n d n = ε P d P P R + ε E T 0 d E T 0 E T 0 R + ε n d n n R
where ε P , ε E T 0 and ε n are the elasticity coefficient of precipitation, potential evaporation, and vegetation, respectively. Assuming ϕ = ET0/P, the elasticities can be estimated by the following equations:
ε P = ( 1 + φ n ) 1 / n + 1 φ n + 1 ( 1 + φ n ) [ ( 1 + φ n ) 1 / n φ ]
ε E T 0 = 1 ( 1 + φ n ) [ 1 ( 1 + φ n ) 1 / n ]
ε n = l n ( 1 + φ n ) + φ n l n ( 1 + φ n ) n [ ( 1 + φ n ) ( 1 + φ n ) 1 / n + 1 ]

4. Results

4.1. Changes in Runoff

Table 2 lists the long-term trend in observed runoff (Robs), water division (Rdiv), natural runoff (Rnatural), the runoff coefficient (Rcoeff), potential evapotranspiration (ET0), precipitation (Pre), and the aridity index (AI) of the Loess Plateau from 1980 to 2013. The observed runoff showed a decreasing trend in all basins, ranging from −0.16 mm·year−2 in Fen River (Basin 8) to −1.94 mm·year−2 in Yiluo River (Basin 12). Except for four basins (Basins 5, 7, 8, and 12), the observed runoff in the other basins decreased significantly (p < 0.01). The annual water diversion depth (Rdiv) increased significantly in nine out of the 12 basins (p < 0.05, Table 2), which were mainly located in the Hekou-Longmen Region (Figure 1), whereas no significant decreases were observed in Jing River and Wei River (p > 0.05). The naturalized runoff (the sum of Robs and Rdir) showed an increasing trend in Qiushui River and Fen River, which was mainly caused by the significant increase in the water diversion (p < 0.001). The runoff coefficient (proportion of runoff to precipitation) was considered an effective tool in engineering hydrology, and it should be constant if no change has occurred in a given basin for a long time [54]. However, the runoff coefficient for a catchment can vary with the physical characteristics of the catchment and climate change (such as precipitation or temperature). The runoff coefficients decreased in all basins, and significantly decreased in nine out of 12 basins. Concurrently, the climate factors (potential evapotranspiration and precipitation) did not show substantial changes in most of the basins, which indicated a large change of the precipitation–runoff relationship due to human activities (including LUCC and water diversion). It should be noted that the aridity index decreased in the six basins, all of which were located in the north part of the Loess Plateau and considered the main GFGP regions [23]. The drought trend can decrease the water resource availability and be harmful for regional ecological restoration.
Figure 2 shows the differences in naturalized runoff, the runoff coefficient, precipitation, and potential evapotranspiration between Period I (1980–2013) and Period II (2000–2013). Except for Fen River (Basin 8), the naturalized runoff in Period II was less than that of Period I (Figure 2a), with a percentage decrease ranging from 3.73% in Sanchuan River (Basin 7) to 54.16% in Kuye River (Basin 1). The naturalized runoff coefficient decreased in all basins in Period II (Figure 2b). Coincidentally, the maximum percentage decrease also occurred in Kuye River with a value of 56.25%, followed by Wei River (decreasing by 42.86%). In contrast, both the precipitation and potential evapotranspiration exhibited slight increases in Period II, averaging 4.44% and 3.26%, respectively. This indicates that climate change was not significant in recent years compared with before 2000, and hence the significant change in runoff is likely driven by a change of the underlying physical characteristics in the Loess Plateau. To clarify the impact of climate and vegetation change on runoff, comparing the runoff sensitivity to climate and vegetation between the two periods is necessary.

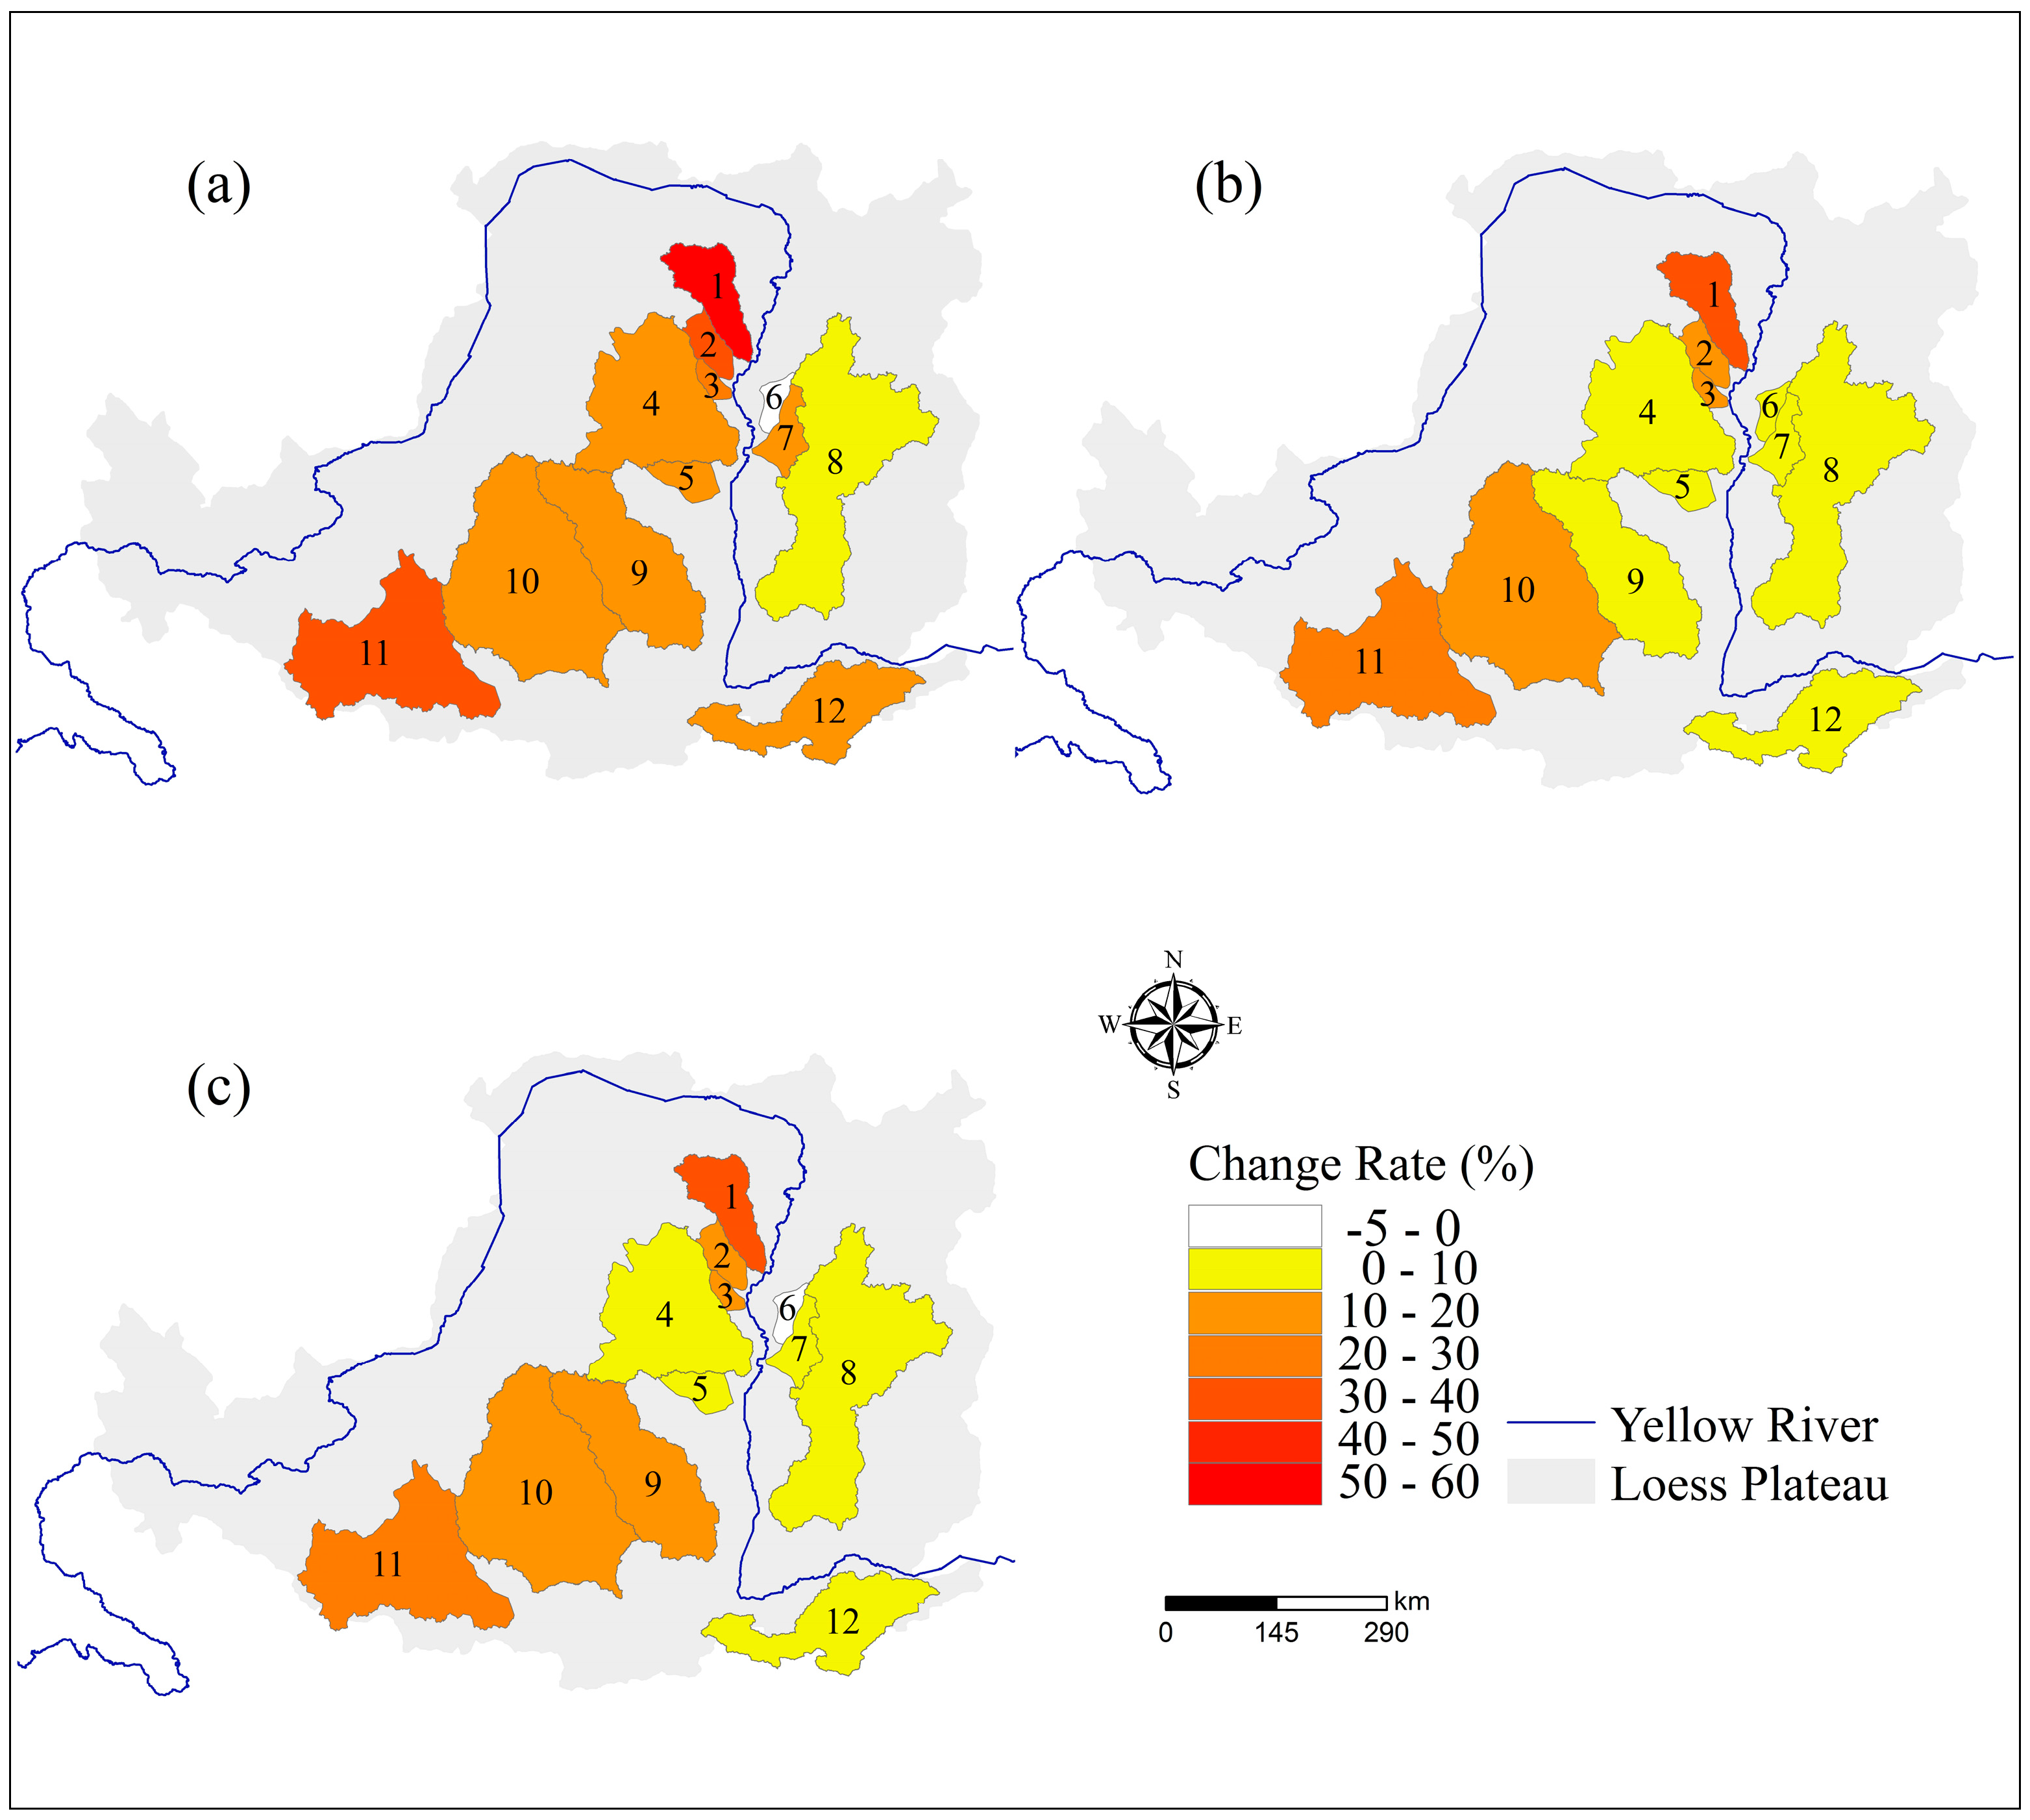
4.2. Changes in Climate and LUCC Elasticity of Naturalized Runoff

Table 3 and Figure 3 show the climate and vegetation elasticity of runoff estimated by the water balance model based on Choudhury-Yang models [45,55] under the Budyko framework. The elasticity of runoff to potential evapotranspiration, precipitation, and catchment characteristics did not remain constant; they varied distinctly from Period I to Period II.
The runoff elasticity to potential evapotranspiration (εET0) was negative in all basins for the two periods but positive for precipitation (εPre, Table 3). This indicates that the increase in εET0 and εPre will cause a decrease and increase in runoff, respectively. In addition, the absolute elasticity coefficient of runoff with respect to precipitation was larger than that of ET0, which indicated that the runoff is more sensitive to precipitation than to ET0. In Period I, for the 12 catchments across the Loess Plateau, a 1% increase in ET0 would lead to a 0.85%–2.54% (1.68% on average) decrease in runoff, whereas a 1% increase in precipitation would produce a 1.85%–3.54% (2.68% on average) runoff increase. Both εET0 and εPre increased in Period II, indicating the greater sensitivity of runoff to climate change. Compared with Period I (εET0 = 1.68%), a 1% increase in ET0 can decrease the runoff more than 0.3% in Period II (εET0 = 1.98%). This implies that a larger absolute εET0 has caused the considerable decrease in runoff since 2000. However, researchers have documented that the ET0 increased significantly in China [56] and the Loess Plateau [34] since the 1990s. Additionally, Zhang et al. [57] predicted ET0 with three GCMs in China and found ET0 will increase by 2.13%–10.77%, 4.42%–16.21%, and 8.67%–21.27% during the 2020s, 2050s, and 2080s compared with the average annual ET0 during 1960–1990, respectively. This suggests that ET0 will cause a greater decrease in runoff in the future, which would increase the risk of water resource shortage in the Loess Plateau. The change percentage in ET0 elasticity was larger than that of precipitation, significant in Kuye River (Basin 1), followed by Tuwei River and Wei River (Basins 2 and 11, Figure 3a). In these basins, the change rate of runoff elasticity to ET0 was larger than that to precipitation in the Loess Plateau (Figure 3a,b).
In Equation (8), ETa is a function of P, ET0, and n. The parameter n is determined by catchment characteristics, for example, catchment area, soil type and texture, slope, and vegetation (or LUCC). However, for a given catchment, the factors, except for vegetation, can remain constant for a long time. Therefore, the changes of parameter n mainly reflect the vegetation variation for a relatively short time span [58]. Zhang et al. [19] found that the changes of the landscape parameter n had a strong relationship with the LUCC, and the LUCC can be converted into a change of parameter n. The vegetation elasticity (εn) of runoff was negative in all catchments, which indicated runoff is reduced when n increases. In Period I, εn ranged from −2.36 to −1.26 with a mean of −2.04 and a standard deviation of 0.34, exhibiting a great regional variability. The absolute εn increased in all catchments except for Qiushui River (Basin 6), implying greater sensitive of runoff to LUCC. The largest change rate (59.02%) occurred in the Kuye River (Basin 1), followed by Wei River (23.5%, Basin 11, Figure 3c). We deduce that the runoff will continue to decrease when the new GFGP strategies are implemented in the future [31], and this presents a huge challenge for sustainable water resource management.

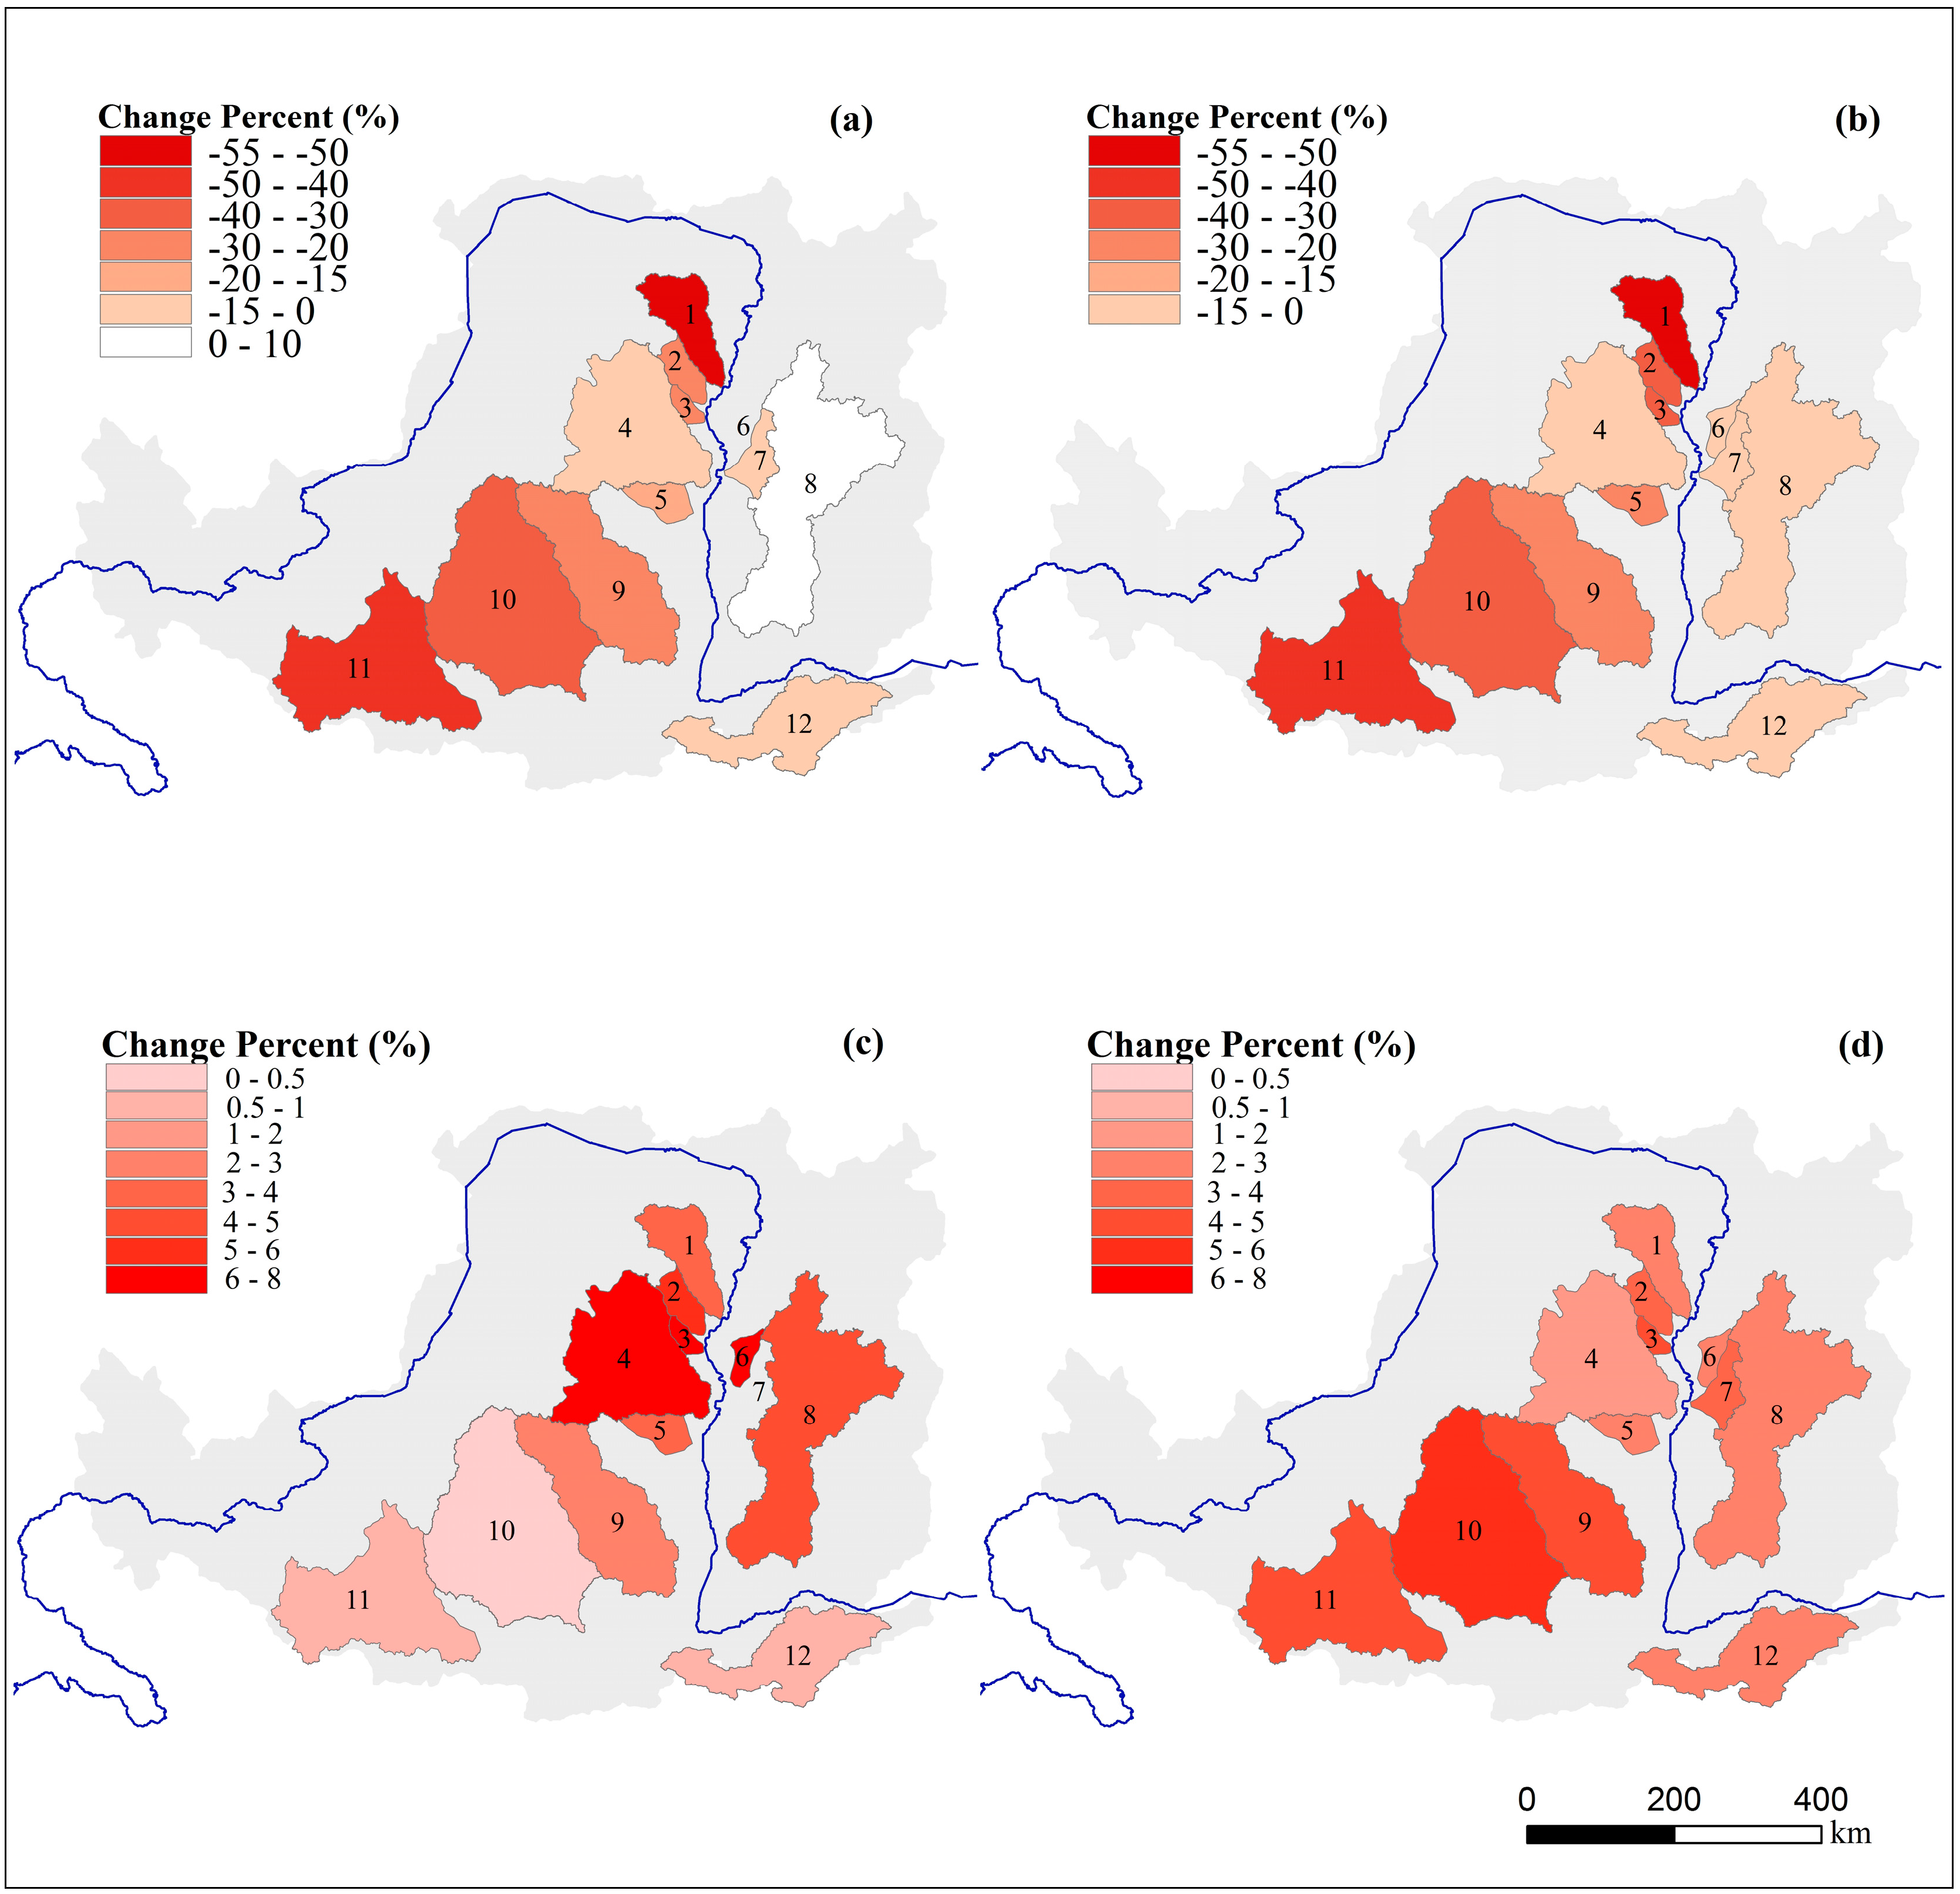
4.3. Quantifying the Runoff Response to Climate and Anthropogenic Interference

Based on the elasticity coefficient (Table 3) and Budyko framework (Equation (9)), the contribution of LUCC, precipitation, ET0, and direct water diversion by humans were calculated in the 12 catchments. Figure 4 clearly shows that all the factors exhibited significant catchment differences. The LUCC was the dominant factor determining the decrease in observed runoff in most catchments except for Qiushui River and Fen River (Basins 6 and 8). The vegetation change can account for more than 95% in Kuye River, and the smallest can also reach 22% in Qiushui River. Coincidentally, these basins are located in the region of Hekou and Longmen (Figure 1), which has been the main area of the GFGP since 1999 [3,23]. This suggests that the ecological restoration project has strongly influenced the hydrological cycle. The water diversion caused naturalized runoff to decrease in Basins 1–9 after 1999, and it became the main factor in the Qiushui River and Fen River. In contrast, water diversion caused runoff to increase in Basins 10–12, which is why the water diversion was restricted in this area by the government after 1999. Climate change caused runoff to increase in Basins 1–8 but decrease in the other basins. The increase in precipitation resulted in runoff increasing from 0.61 mm to 11.77 mm (5.52 mm on average), whereas ET0 resulted in a 0.61–5.52 mm decrease in runoff. Precipitation had a larger contribution in runoff than ET0 in Basins 1–8, in contrast to the other basins.
In general, the results indicated that LUCC played the most important role in the decrease of runoff during 2000–2013 in most catchments, followed by the direct human impact (water diversion). Therefore, we can conclude that anthropogenic interference caused the runoff decrease during 2000–2013 in the Loess Plateau. In addition, the significant vegetation change will affect the water cycle [2], especially green water consumption, which is the rain water that evaporates after being taken up by vegetation [59]. Since the forests are being expanded according to the management programs of the Chinese government [24], green water consumption should be taken into account in studies of water consumption and water availability [60] in the Loess Plateau.

5. Discussion

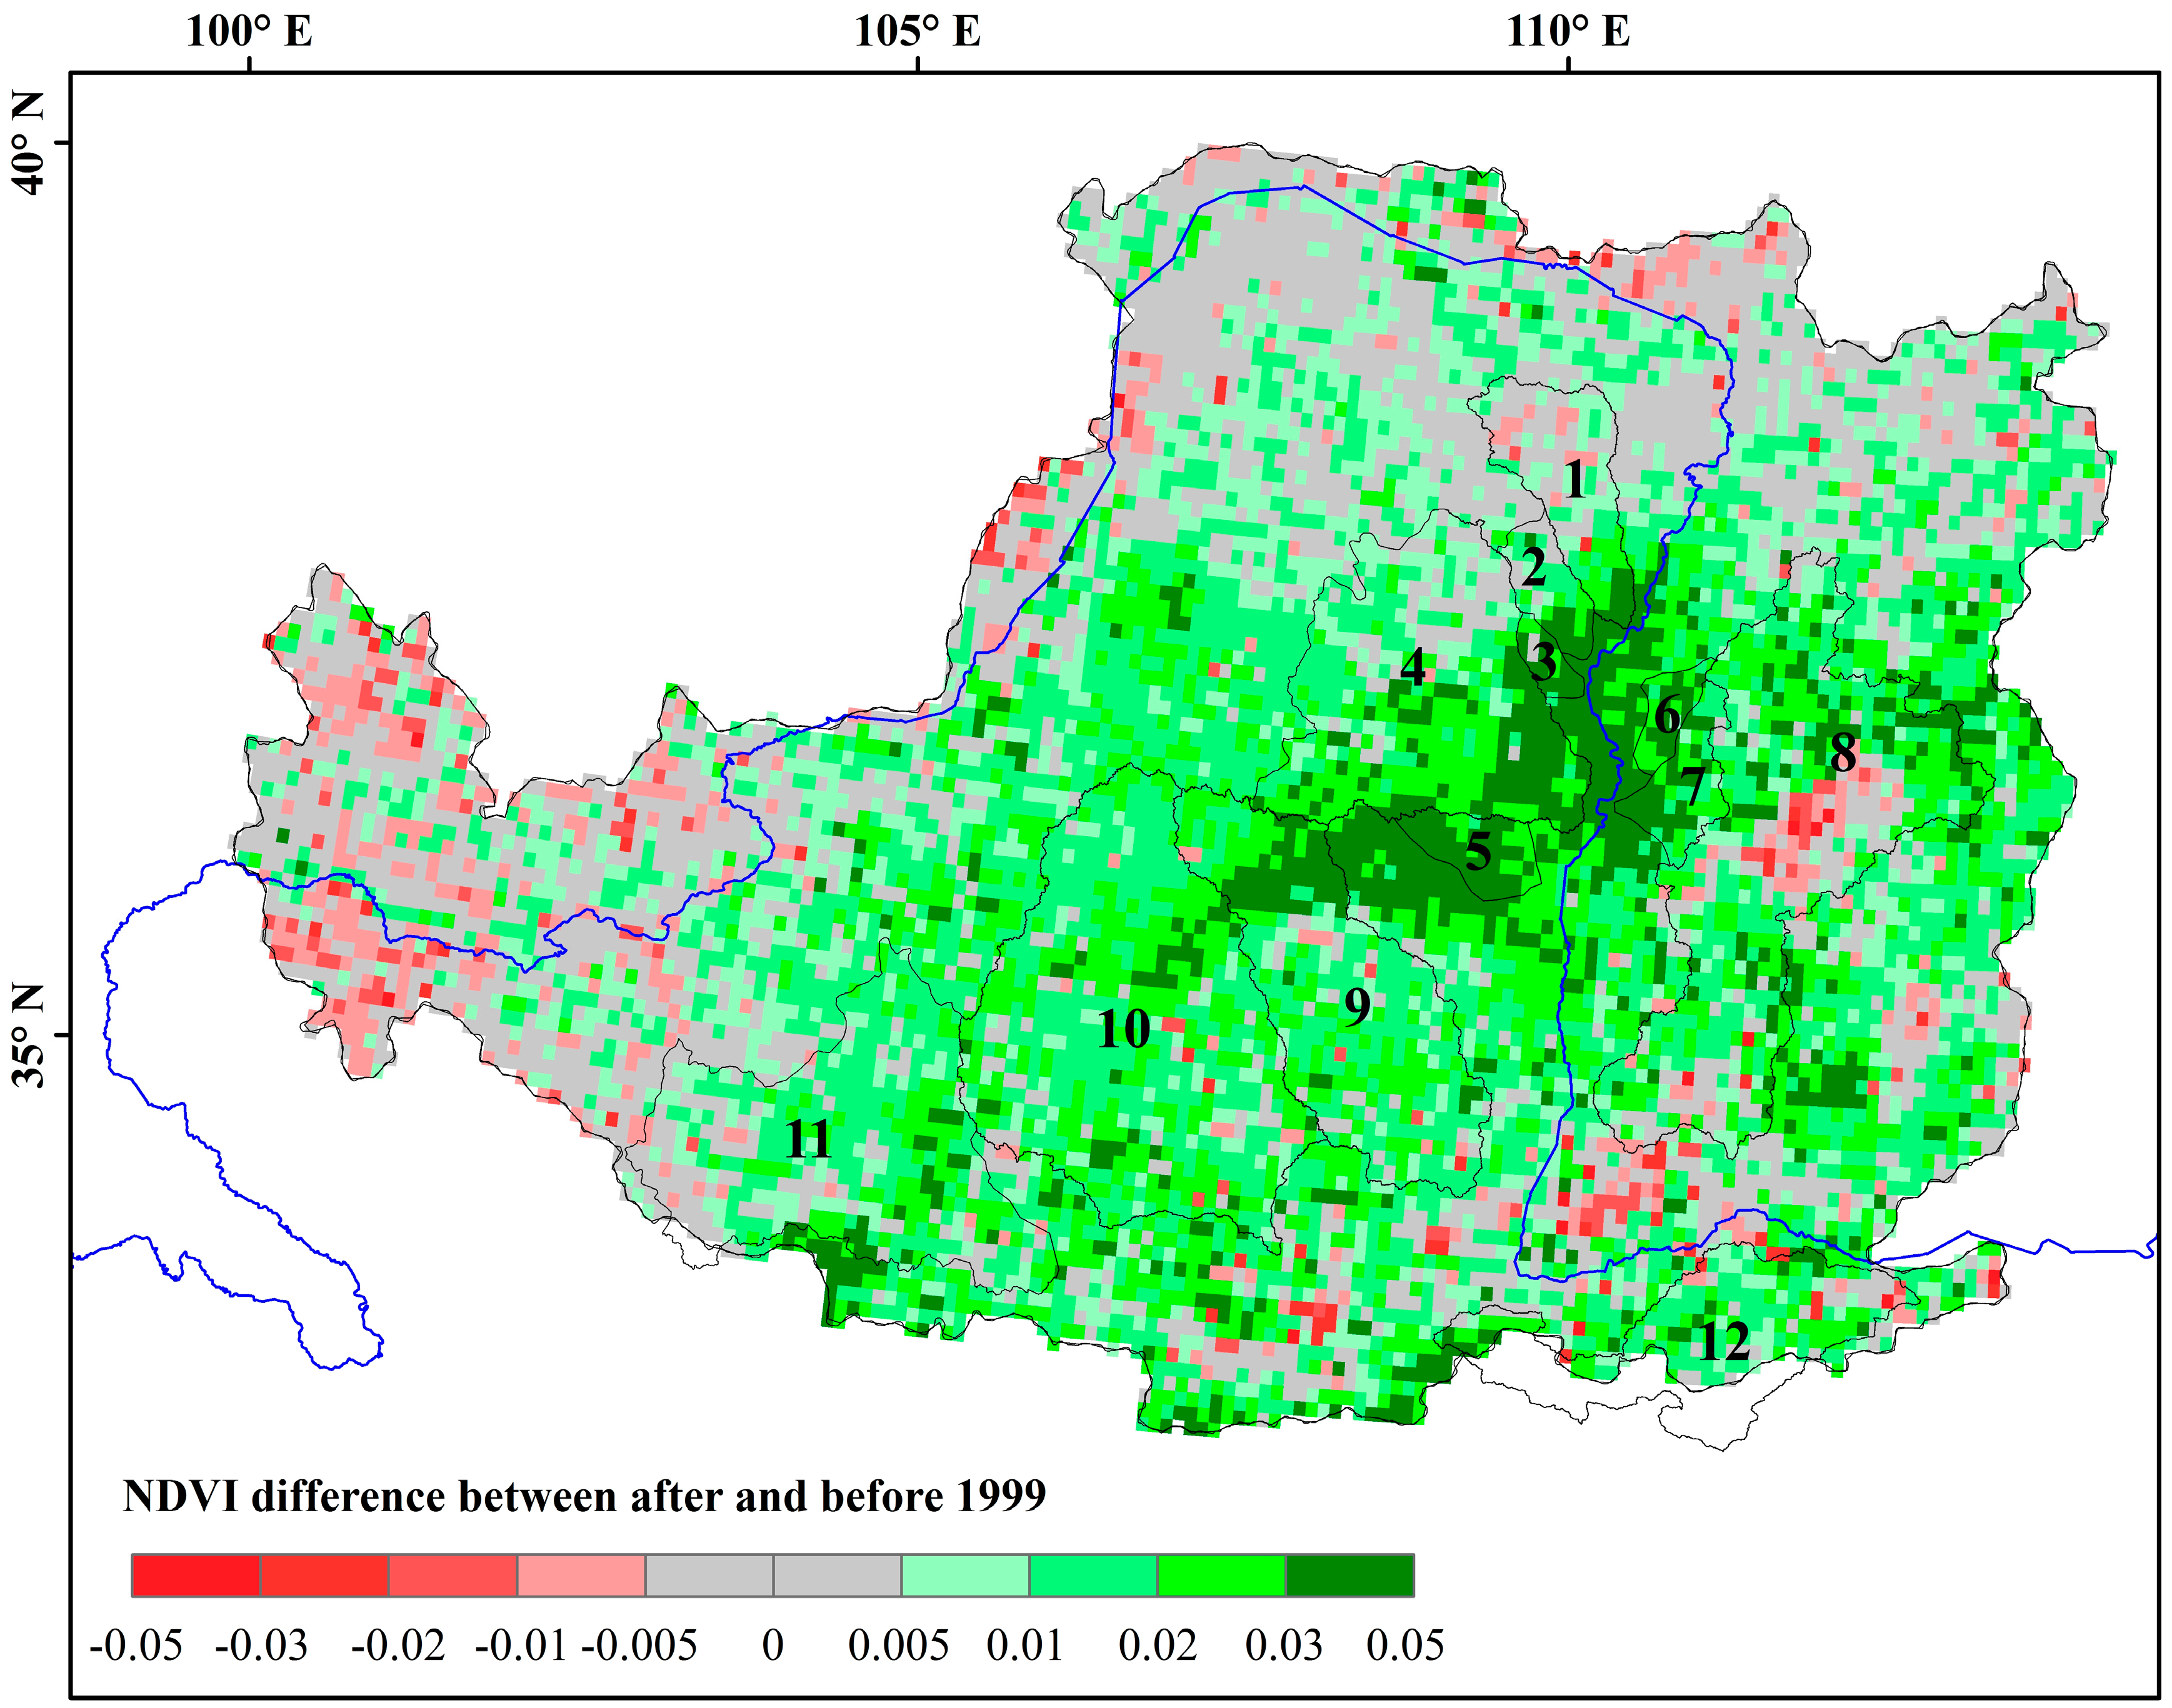
5.1. Correlation between Vegetation Parameter n and LUCC, LAI, and NDVI

To further illustrate the impact of vegetation change on runoff variability, the LUCC, LAI, and NDVI in the Loess Plateau were investigated (Table 4 and Table 5, Figure 5). With respect to LUCC, grassland was the dominant land use type in the Loess Plateau, accounting for approximately 42%, followed by farmland (Table 3). For the two periods before and after 1999, the largest change rate was residential land (20.36%), followed by forest (10.24%). The increasing residential area indicated that more water resources were in demand. To meet this demand, water diversion increased, and finally reduced the runoff. The forest area has increased by 9342 km2 since 1999, with the proportion increasing from 14.5% to 16.1%. The increasing forest area can significantly increase transpiration [61,62] to meet the needs of plant physiology. However, the increasing forest area can also enhance LAI (Table 5), thereby increasing rainfall interception and evaporation by the forest crown [63]. Finally, the increasing evapotranspiration can reduce the runoff and runoff coefficient to account for water balance. These results have been confirmed by our findings (Table 2 and Figure 2b).
Table 5 lists the change rate in parameter n (reflecting vegetation condition) and LAI between the two periods. The results showed that this parameter n increased in all the basins, with the change rate ranging from 2.12% in Qiushui River to 44.35% in Kuye River. Interestingly, the change rate of LAI also generally followed the same variation of parameter n, and the Pearson coefficient was 0.42. This indicated that the parameter n in the Budyko framework can effectively reflect the change of vegetation or LUCC. Figure 5 shows the spatial distribution of NDVI change before and after 1999. It can be clearly observed that the vegetation recovered greatly in Basins 1–7, which also had good spatial consistency with parameter n (Table 5) and LUCC contribution to runoff change (Figure 4). This finding confirmed again that the anthropogenic interference, especially that on LUCC caused by ecological restoration strategies, was the main reason for reducing runoff in the Loess Plateau from 2000 to 2013.

5.2. Uncertainties and Suggestions

Uncertainties existed in the runoff change and its contribution of factors in this analysis. First, although four factors (LUCC, water diversion, ET0, and precipitation) were employed to investigate the runoff change, other factors, for example, construction of check dams, terrace farming, and reservoir regulation, may also account for a certain proportion, and they were not included in this paper. Although ignoring such factors can produce uncertainty to some extent, it should not play an important role in our study. Papers have documented that terrace farming, check dams, and reservoirs could effectively control the runoff at the beginning of construction [64]; however, their contribution to controlling runoff may became weaker with time as they are progressively filled with eroded material [26]. Therefore, the human impact on runoff should be attributed to the following two aspects: first is the significant vegetation increase as a result of large-scale vegetation rehabilitation programs, particularly the GFGP, which launched in 1999; the other is human water consumption, which has increased by 86% from the 1980s to 2010 according to the Yellow River Water Resources Bulletin. The second uncertainty came from the assumption of the Budyko theory employed in our paper. Equation (8), which was used for quantifying the contribution of LUCC and climate to runoff change, was based on the assumption that LUCC was independent of other factors. However, LUCC and the climate factors interact with each other. On a large scale, climate change plays an important role in vegetation growth [27], and, hence, can influence runoff [1]. The third uncertainty was from the assumption of no change in the groundwater and water storage in the basins. However, researchers have reported that the water storage [39,65] or groundwater [66,67] varied significantly, and was sensitive to changes in climate [68] and vegetation [61]. Therefore, with this assumption in Equations (7) and (8), the Budyko relationships may be affected by the variation of groundwater flow and water storage [69]. However, the uncertainty of its effect should be limited, as we used equations for a long-term period (20 and 14 years for Period I and II, respectively). Despite some uncertainties in our study, we found that the GFGP successfully changed the vegetation in the Loess Plateau since 1999, although it also presented a new challenge in terms of the regional water resource availability. Implementing new strategies to increase vegetation in the future may increase the risk of water shortage in semi-arid regions. In addition, the growing population and expansion of industrial and agricultural activities along the Yellow River will only lead to greater demand for water. All of these situations are not beneficial for maintaining the achievement of the GFGP and sustainable development in the future. The expansion of vegetation recovery strategies should be carefully and cautiously re-inspected and slowed down; in addition, determining a proper threshold value of vegetation recovery from the perspective of the hydrological cycle is urgently necessary. In addition, new crop species that consume less water and advanced agricultural facilities could be introduced to meet the increasing demand for food and farmland of growing population.
To fully understand the impact of LUCC on the hydrological cycle, more detailed studies about actual evapotranspiration [70] and soil moisture variation are required. For example, simulation of the vegetation dynamically interacting with the environment [71] and future runoff changes should offer useful insight for making effective ecological strategies. In addition, comparing the changes in evapotranspiration and its components (plant transpiration, canopy interception, and soil evaporation) with those in vegetation [62,72] will provide a better vehicle for further understanding the impact of vegetation change on runoff.

6. Conclusions

To change the ecological environment, the Chinese government has implemented a number of ecological conservation and protection projects in the Loess Plateau. In this paper, the elasticity method, which is based on the Budyko framework, was employed to assess the elasticity of runoff to climate change and LUCC. The results showed the following: (1) from 1980 to 2013, the observed and naturalized annual runoff decreased in most catchments. The water consumption increased significantly in the Hekou-Long regions, which were the key regions of GFGP and where significant vegetation changes were observed, as demonstrated by the LAI and NDVI. Compared with 1980–1999, the runoff and runoff coefficient decreased greatly in 2000–2013; however, the climate was not a significant contributor to this change; (2) The elasticity of runoff to climate variables increased after 1999, and varied between catchments. The elasticity coefficient of potential evapotranspiration was larger than that of precipitation, implying greater uncertainty of runoff in a warming climate in the future. The vegetation elasticity increased in all basins except for the Qiushui River basin, which indicated that runoff was more sensitive to vegetation; (3) Human disturbances, including direct human water diversion and indirect vegetation restoration projects, have played the most important role in the naturalized runoff decrease. The anthropogenic interferences have changed the hydrological cycle in recent years in the Loess Plateau; (4) The expansion of vegetation recovery strategies should be carefully and cautiously re-evaluated to determine a proper threshold value of vegetation recovery from the perspective of the hydrological cycle.

Acknowledgments

This research was financially supported by the Natural Science Foundation of China (No. 41330529, 41501032, 41571024, 41301496), the Natural Sciences Foundation of Jiangsu Province (BK20141059), and Planning of Technology in Guizhou ([2015]3006) supported by Guizhou Science and Technology Project. We thank the two anonymous reviewers for their critical comments and constructive suggestions on the manuscript.

Author Contributions

Yanzhong Li performed the data processing and wrote the manuscript. Changming Liu edited the English language and gave constructive suggestions towards the revised manuscript. Dan Zhang and Xinan Li helped process the potential evapotranspiration and hydrological data. Kang Liang provided the ideas and the data used in the manuscript. Guotao Dong gave us great support and help on the water diversion records for the revised manuscript.

Conflicts of Interest

The authors declare no conflict of interest.

References

  1. Piao, S.; Ciais, P.; Huang, Y.; Shen, Z.; Peng, S.; Li, J.; Zhou, L.; Liu, H.; Ma, Y.; Ding, Y.; et al. The impacts of climate change on water resources and agriculture in China. Nature 2010, 467, 43–51. [Google Scholar] [CrossRef] [PubMed]
  2. Sterling, S.M.; Ducharne, A.; Polcher, J. The impact of global land-cover change on the terrestrial water cycle. Nat. Clim. Chang. 2013, 3, 385–390. [Google Scholar] [CrossRef]
  3. Zhang, X.; Zhang, L.; Zhao, J.; Rustomji, P.; Hairsine, P. Responses of streamflow to changes in climate and land use/cover in the Loess Plateau, China. Water Resour. Res. 2008, 44, 2183–2188. [Google Scholar] [CrossRef]
  4. Liu, C.; Xia, J. Water problems and hydrological research in the Yellow River and the Huai and Hai River Basins of China. Hydrol. Process. 2004, 18, 2197–2210. [Google Scholar] [CrossRef]
  5. Jaramillo, F.; Destouni, G. Local flow regulation and irrigation raise global human water consumption and footprint. Science 2015, 350, 1248–1251. [Google Scholar] [CrossRef] [PubMed]
  6. Nilsson, C.; Reidy, C.A.; Dynesius, M.; Revenga, C. Fragmentation and flow regulation of the world’s large river systems. Science 2005, 308, 405–408. [Google Scholar] [CrossRef] [PubMed]
  7. Destouni, G.; Jaramillo, F.; Prieto, C. Hydroclimatic shifts driven by human water use for food and energy production. Nat. Clim. Chang. 2013, 3, 213–217. [Google Scholar] [CrossRef]
  8. Jaramillo, F.; Destouni, G. Developing water change spectra and distinguishing change drivers worldwide. Geophys. Res. Lett. 2014, 41, 8377–8386. [Google Scholar] [CrossRef]
  9. Kingsford, R.T. Ecological impacts of dams, water diversions and river management on floodplain wetlands in Australia. Aust. Ecol. 2000, 25, 109–127. [Google Scholar] [CrossRef]
  10. Levi, L.; Jaramillo, F.; Andričević, R.; Destouni, G. Hydroclimatic changes and drivers in the Sava River Catchment and comparison with Swedish catchments. Ambio 2015, 44, 624–634. [Google Scholar] [CrossRef] [PubMed]
  11. Franczyk, J.; Chang, H. The effects of climate change and urbanization on the runoff of the Rock Creek basin in the Portland metropolitan area, Oregon, USA. Hydrol. Process. 2009, 23, 805–815. [Google Scholar] [CrossRef]
  12. Guo, J.; Su, X.; Singh, V.P.; Jin, J. Impacts of climate and land use/cover change on streamflow using SWAT and a separation method for the Xiying River basin in northwestern China. Water 2016, 8, 192. [Google Scholar] [CrossRef]
  13. Li, Z.; Liu, X.; Niu, T.; Kejia, D.; Zhou, Q.; Ma, T.; Gao, Y. Ecological restoration and its effects on a regional climate: The source region of the Yellow River, China. Environ. Sci. Technol. 2015, 49, 5897–5904. [Google Scholar] [CrossRef] [PubMed]
  14. Jaramillo, F. Changes in the Freshwater System: Distinguishing Climate and Landscape Drivers. Ph.D. Thesis, Stockholm University, Stockholm, Sweden, 2015. [Google Scholar]
  15. Adam, J.C.; Haddeland, I.; Su, F.; Lettenmaier, D.P. Simulation of reservoir influences on annual and seasonal streamflow changes for the Lena, Yenisei, and Ob’ rivers. J. Geophys. Res. Atmos. 2007, 112, D24114. [Google Scholar] [CrossRef]
  16. Immerzeel, W.W.; van Beek, L.P.; Bierkens, M.F. Climate change will affect the Asian water towers. Science 2010, 328, 1382–1385. [Google Scholar] [CrossRef] [PubMed]
  17. Zheng, H.; Zhang, L.; Zhu, R.; Liu, C.; Sato, Y.; Fukushima, Y. Responses of streamflow to climate and land surface change in the headwaters of the Yellow River basin. Water Resour. Res. 2009, 45, 641–648. [Google Scholar] [CrossRef]
  18. Wang, D.; Hejazi, M. Quantifying the relative contribution of the climate and direct human impacts on mean annual streamflow in the contiguous United States. Water Resour. Res. 2011, 47, W00J12. [Google Scholar] [CrossRef]
  19. Zhang, S.; Yang, H.; Yang, D.; Jayawardena, A. Quantifying the effect of vegetation change on the regional water balance within the Budyko framework. Geophys. Res. Lett. 2016, 43, 1140–1148. [Google Scholar] [CrossRef]
  20. Zhang, L.; Hickel, K.; Dawes, W.R.; Chiew, F.H.S.; Western, A.W.; Briggs, P.R. A rational function approach for estimating mean annual evapotranspiration. Water Resour. Res. 2004, 40, 89–97. [Google Scholar] [CrossRef]
  21. Liu, X.; Liu, C.; Luo, Y.; Zhang, M.; Xia, J. Dramatic decrease in streamflow from the headwater source in the central route of China’s water diversion project: Climatic variation or human influence? J. Geophys. Res. Atmos. 2012, 117. [Google Scholar] [CrossRef]
  22. Huang, J.; Wen, J.; Hinokidani, O.; Yasuda, H. Runoff and water budget of the liudaogou catchment at the wind-water erosion crisscross region on the Loess Plateau of China. Environ. Earth Sci. 2014, 72, 3623–3633. [Google Scholar]
  23. Zhang, X.; Zhang, L.; McVicar, T.R.; Van Niel, T.G.; Li, L.T.; Li, R.; Yang, Q.K.; Wei, L. Modelling the impact of afforestation on average streamflow in the Loess Plateau, China. Hydrol. Process. 2007, 22, 1996–2004. [Google Scholar] [CrossRef]
  24. Zhang, P.; Shao, G.; Zhao, G.; Master, D.C.L.; Parker, G.R.; Dunning, J.B.J.; Li, Q. China’s forest policy for the 21st century. Science 2000, 288, 2135–2136. [Google Scholar] [CrossRef] [PubMed]
  25. Chen, Y.; Wang, K.; Lin, Y.; Shi, W.; Song, Y.; He, X. Balancing green and grain trade. Nat. Geosci. 2015, 8, 739–741. [Google Scholar] [CrossRef]
  26. Wang, S.; Fu, B.; Piao, S.; Lu, Y.; Ciais, P.; Feng, X.; Wang, Y. Reduced sediment transport in the yellow river due to anthropogenic changes. Nat. Geosci. 2016, 9, 38–41. [Google Scholar] [CrossRef]
  27. Piao, S.; Yin, G.; Tan, J.; Cheng, L.; Huang, M.; Li, Y.; Liu, R.; Mao, J.; Myneni, R.B.; Peng, S. Detection and attribution of vegetation greening trend in China over the last 30years. Glob. Chang. Biol. 2015, 21, 1601–1609. [Google Scholar] [CrossRef] [PubMed]
  28. Liu, C.; Li, Y.; Liu, X.; Bai, P.; Liang, K. Impact of vegetation change on water transformation in the middle Yellow River. Yellow River 2016, 38, 1–12. (In Chinese) [Google Scholar]
  29. Feng, X.; Fu, B.; Piao, S.; Wang, S.; Ciais, P.; Zeng, Z.; Lu, Y.; Zeng, Y.; Li, Y.; Jiang, X.; et al. Revegetation in China Loess Plateau is approaching sustainable water resource limits. Nat. Clim. Chang. 2016. [Google Scholar] [CrossRef]
  30. Cao, S. Why large-scale afforestation efforts in China have failed to solve the desertification problem. Environ. Sci. Technol. 2008, 42, 1826–1831. [Google Scholar] [CrossRef] [PubMed]
  31. XinhuaNet. New Task for Grain for Green Project in 2014. Available online: http://news.xinhuanet.com/energy/2014-09/27/c_127041568_2.htm (accessed on 27 September 2014).
  32. Huang, M.; Zhang, L.; Gallichand, J. Runoff responses to afforestation in a watershed of the Loess Plateau, China. Hydrol. Process. 2003, 17, 2599–2609. [Google Scholar] [CrossRef]
  33. Li, L.J.; Zhang, L.; Wang, H.; Wang, J.; Yang, J.W.; Jiang, D.J.; Li, J.Y.; Qin, D.Y. Assessing the impact of climate variability and human activities on streamflow from the Wuding River basin in China. Hydrol. Process. 2007, 21, 3485–3491. [Google Scholar] [CrossRef]
  34. Li, Y.; Liang, K.; Bai, P.; Feng, A.; Liu, L.; Dong, G. The spatiotemporal variation of reference evapotranspiration and the contribution of its climatic factors in the Loess Plateau, China. Environ. Earth Sci. 2016, 75, 1–14. [Google Scholar] [CrossRef]
  35. Maliva, R.G.; Missimer, T.M. Arid Lands Water Evaluation and Management; Springer Science & Business Media: Berlin, Germany, 2012. [Google Scholar]
  36. Liu, J.; Kuang, W.; Zhang, Z.; Xu, X.; Qin, Y.; Jia, N.; Zhou, W.; Zhang, S.; Li, R.; Yan, C. Spatiotemporal characteristics, patterns, and causes of land-use changes in China since the late 1980s. J. Geogr. Sci. 2014, 24, 195–210. [Google Scholar] [CrossRef]
  37. Zhu, Z.; Bi, J.; Pan, Y.; Ganguly, S.; Anav, A.; Xu, L.; Samanta, A.; Piao, S.; Nemani, R.R.; Myneni, R.B. Global data sets of vegetation leaf area index (LAI)3g and fraction of photosynthetically active radiation (FPAR)3g derived from global inventory modeling and mapping studies (GIMMS) normalized difference vegetation index (NDVI3g) for the period 1981 to 2011. Remote Sens. 2013, 5, 927–948. [Google Scholar]
  38. Kendall, M.G. Rank Correlation Methods; Charles Griffin: London, UK, 1948. [Google Scholar]
  39. Li, Y.; Liang, K.; Liu, C.; Liu, W.; Bai, P. Evaluation of different evapotranspiration products in the middle Yellow River basin, China. Hydrol. Res. 2016, 47. [Google Scholar] [CrossRef]
  40. Fathian, F.; Dehghan, Z.; Bazrkar, M.H.; Eslamian, S. Trends in hydrological and climatic variables affected by four variations of the Mann-Kendall approach in Urmia Lake basin, Iran. Hydrol. Sci. J. 2016, 61, 892–904. [Google Scholar] [CrossRef]
  41. Allen, R.G.; Pereira, L.S.; Raes, D.; Smith, M. Crop Evapotranspiration—Guidelines for Computing Crop Water Requirements; FAO Irrigation and Drainage Paper 56; FAO: Roma, Italy, 1998. [Google Scholar]
  42. Liu, C.; Zhang, D.; Liu, X.; Zhao, C. Spatial and temporal change in the potential evapotranspiration sensitivity to meteorological factors in China (1960–2007). J. Geogr. Sci. 2012, 22, 3–14. [Google Scholar] [CrossRef]
  43. Schaake, J.C.; Waggoner, P. From Climate to Flow, in Climate Change and U.S. Water Resources; John Wiley: New York, NY, USA, 1990. [Google Scholar]
  44. Liu, X.; Liu, W.; Xia, J. Comparison of the streamflow sensitivity to aridity index between the Danjiangkou Reservoir basin and Miyun Reservoir basin, China. Theor. Appl. Climatol. 2013, 111, 683–691. [Google Scholar] [CrossRef]
  45. Choudhury, B. Evaluation of an empirical equation for annual evaporation using field observations and results from a biophysical model. J. Hydrol. 1999, 216, 99–110. [Google Scholar] [CrossRef]
  46. Xue, B.; Wang, L.; Li, X.; Yang, K.; Chen, D.; Sun, L. Evaluation of evapotranspiration estimates for two river basins on the Tibetan Plateau by a water balance method. J. Hydrol. 2013, 492, 290–297. [Google Scholar] [CrossRef]
  47. Hobbins, M.T.; Ramírez, J.A.; Brown, T.C. The complementary relationship in estimation of regional evapotranspiration: An enhanced advection-aridity model. Water Resour. Res. 2001, 37, 1389–1403. [Google Scholar] [CrossRef]
  48. Zhang, Y.; Leuning, R.; Chiew, F.H.; Wang, E.; Zhang, L.; Liu, C.; Sun, F.; Peel, M.C.; Shen, Y.; Jung, M. Decadal trends in evaporation from global energy and water balances. J. Hydrometeorol. 2012, 13, 379–391. [Google Scholar] [CrossRef]
  49. Budyko, M.I. Evaporation under Natural Conditions, Gidrometeoizdat, Leningrad 1948; English Translation by Israel Program for Scientific Translations; IPST: Jerusalem, Israel, 1963. [Google Scholar]
  50. Patterson, L.A.; Lutz, B.; Doyle, M.W. Climate and direct human contributions to changes in mean annual streamflow in the South Atlantic, USA. Water Resour. Res. 2013, 49, 7278–7291. [Google Scholar] [CrossRef]
  51. Gudmundsson, L.; Greve, P.; Seneviratne, S.I. The sensitivity of water availability to changes in the aridity index and other factors—A probabilistic analysis in the budyko-space. Geophys. Res. Lett. 2016, 43, 6985–6994. [Google Scholar] [CrossRef]
  52. Roderick, M.L.; Farquhar, G.D. A simple framework for relating variations in runoff to variations in climatic conditions and catchment properties. Water Resour. Res. 2011, 47, W00G07. [Google Scholar] [CrossRef]
  53. Yang, D.; Shao, W.; Yeh, P.J.F.; Yang, H.; Kanae, S.; Oki, T. Impact of vegetation coverage on regional water balance in the nonhumid regions of China. Water Resour. Res. 2009, 45, W00A14. [Google Scholar] [CrossRef]
  54. Gottschalk, L.; Weingartner, R. Distribution of peak flow derived from a distribution of rainfall volume and runoff coefficient, and a unit hydrograph. J. Hydrol. 1998, 208, 148–162. [Google Scholar] [CrossRef]
  55. Yang, H.; Yang, D.; Lei, Z.; Sun, F. New analytical derivation of the mean annual water-energy balance equation. Water Resour. Res. 2008, 44, W03410. [Google Scholar] [CrossRef]
  56. Liu, X.; Luo, Y.; Zhang, D.; Zhang, M.; Liu, C. Recent changes in pan-evaporation dynamics in China. Geophys. Res. Lett. 2011, 38, L13404. [Google Scholar] [CrossRef]
  57. Zhang, D.; Liu, X.; Hong, H. Assessing the effect of climate change on reference evapotranspiration in China. Stoch. Environ. Res. Risk Assess. 2013, 27, 1871–1881. [Google Scholar] [CrossRef]
  58. Yang, H.; Qi, J.; Xu, X.; Yang, D.; Lv, H. The regional variation in climate elasticity and climate contribution to runoff across China. J. Hydrol. 2014, 517, 607–616. [Google Scholar] [CrossRef]
  59. Falkenmark, M.; Rockström, J. The new blue and green water paradigm: Breaking new ground for water resources planning and management. J. Water Resour. Plan. Manag. 2006, 132, 129–132. [Google Scholar] [CrossRef]
  60. Jaramillo, F.; Destouni, G. Comment on “planetary boundaries: Guiding human development on a changing planet”. Science 2015, 348, 1217. [Google Scholar] [CrossRef] [PubMed]
  61. Bearup, L.A.; Maxwell, R.M.; Clow, D.W.; McCray, J.E. Hydrological effects of forest transpiration loss in bark beetle-impacted watersheds. Nat. Clim. Chang. 2014, 4, 481–486. [Google Scholar] [CrossRef]
  62. Zhang, Y.; Peña-Arancibia, J.L.; Mcvicar, T.R.; Chiew, F.H.S.; Jai, V.; Liu, C.; Lu, X.; Zheng, H.; Wang, Y.; Liu, Y.Y.; et al. Multi-decadal trends in global terrestrial evapotranspiration and its components. Sci. Rep. 2016, 6, 19124. [Google Scholar] [CrossRef] [PubMed] [Green Version]
  63. Van Dijk, A.I.J.M.; Bruijnzeel, L.A. Modelling rainfall interception by vegetation of variable density using an adapted analytical model. Part 2. Model validation for a tropical upland mixed cropping system. J. Hydrol. 2001, 247, 239–262. [Google Scholar] [CrossRef]
  64. Zhao, G.; Mu, X.; Wen, Z.; Wang, F.; Gao, P. Soil erosion, conservation, and eco-environment changes in the Loess Plateau of China. Land Degrad. Dev. 2013, 24, 499–510. [Google Scholar] [CrossRef]
  65. Lettenmaier, D.P.; Famiglietti, J.S. Hydrology: Water from on high. Nature 2006, 444, 562–563. [Google Scholar] [CrossRef] [PubMed]
  66. Szilagyi, J.; Zlotnik, V.A.; Jozsa, J. Net recharge vs. Depth to groundwater relationship in the Platte River Valley of Nebraska, United States. Groundwater 2013, 51, 945–951. [Google Scholar] [CrossRef] [PubMed]
  67. Fan, Y. Groundwater in the earth’s critical zone: Relevance to large-scale patterns and processes. Water Resour. Res. 2015, 51, 3052–3069. [Google Scholar] [CrossRef]
  68. Maxwell, R.M.; Kollet, S.J. Interdependence of groundwater dynamics and land-energy feedbacks under climate change. Nat. Geosci. 2008, 1, 665–669. [Google Scholar] [CrossRef]
  69. Condon, L.E.; Maxwell, R.M. Analyzing the impact of groundwater flow and storage changes on budyko relationships across the continental US. Hydrol. Earth Syst. Sci. Discuss. 2016. [Google Scholar] [CrossRef]
  70. Li, Z.; Liu, X.; Ma, T.; Kejia, D.; Zhou, Q.; Yao, B.; Niu, T. Retrieval of the surface evapotranspiration patterns in the alpine grassland–wetland ecosystem applying SEBAL model in the source region of the Yellow River, China. Ecol. Model. 2013, 270, 64–75. [Google Scholar] [CrossRef]
  71. Sitch, S.; Smith, B.; Prentice, I.C.; Arneth, A.; Bondeau, A.; Cramer, W.; Kaplan, J.O.; Levis, S.; Lucht, W.; Sykes, M.T.; et al. Evaluation of ecosystem dynamics, plant geography and terrestrial carbon cycling in the LPJ dynamic global vegetation model. Glob. Chang. Biol. 2003, 9, 161–185. [Google Scholar] [CrossRef]
  72. Good, S.P.; Noone, D.; Bowen, G. Hydrologic connectivity constrains partitioning of global terrestrial water fluxes. Science 2015, 349, 175–177. [Google Scholar] [CrossRef] [PubMed]
Figure 1. Distribution of basins used in the study. The four main hydrological stations are Hekou, Longmen, Sanmenxia, and Huayuankou.
Water 08 00458 g001
Figure 2. Spatial distribution of the percentage decrease (%) in naturalized runoff (a); the runoff coefficient (b); precipitation (c); and potential evapotranspiration (d) between 1980–1999 and 2000–2013.
Water 08 00458 g002
Figure 3. Spatial distribution of elasticity in naturalized runoff to potential evapotranspiration (a); precipitation (b); and LUCC (c) between 1980–1999 and 2000–2013.
Water 08 00458 g003
Figure 4. Contribution of the four factors to runoff change in the 12 catchments between the periods 1980–1999 and 2000–2013.
Water 08 00458 g004
Figure 5. Difference of Normalized Difference Vegetation Index (NDVI) between the two periods in the Loess Plateau.
Water 08 00458 g005
Table 1. Descriptions of the 12 river basins located in the Loess Plateau.
Basin IDRiver NameStation NameArea (km2)Robs (mm·year−1)Pre (mm·year−1)ET0 (mm·year−1)AI
1Kuye RiverWenjiachuan851542.833799422.59
2Tuwei RiverGaojiachuan325379.563969502.48
3Jialu RiverShenjiawan112133.064129532.38
4Wuding RiverBaijiachuan29,66230.633899642.56
5Qingjian RiverYanchuan346835.874609272.09
6Qiushui RiverLinjiaping187321.874499322.14
7Sanchuan RiverHoudacheng410239.554609162.06
8Fen RiverHejin38,72813.524778961.93
9Beiluo RiverZhuangtou25,64527.745158681.74
10Jing RiverZhangjiashan43,21631.524848591.84
11Wei RiverLinjiacun30,66148.944917861.65
12Yiluo RiverHeishiguan18,563113.476778891.37
Notes: Robs refers to the runoff depth, defined as the streamflow divided by drainage area. Pre refers to the multi-year precipitation. ET0 refers to the potential evapotranspiration calculated by the Penman–Monteith model, and AI refers to the aridity index, defined as the ratio of ET0 to Pre. The time span ranges from 1980 to 2013.
Table 2. Trends of runoff and climate factors from 1980 to 2013 in the 12 basins in the Loess Plateau.
Basin IDRiver NameRobs
(mm·year−2)
Rdiv
(mm·year−2)
Rnatural
(mm·year−2)
Rcoeff
(× 10−2)
ET0
(mm·year−2)
Pre
(mm·year−2)
AI
(× 10−2)
1Kuye River−1.56 ***0.12 ***−1.45 ***−0.46 ***1.091.59−0.52
2Tuwei River−1.33 ***0.10 ***−1.23 ***−0.42 ***1.59 *1.90−0.56
3Jialu River−0.61 ***0.09 ***−0.51 ***−0.19 ***1.89 *1.81−0.35
4Wuding River−0.30 ***0.23 ***−0.07−0.11 ***0.591.42−0.57
5Qingjian River−0.270.10 ***−0.17−0.061.250.240.24
6Qiushui River−0.37 **0.59 ***0.22−0.09 **1.481.38−0.20
7Sanchuan River−0.390.38 ***−0.01−0.11 **1.631.27−0.11
8Fen River−0.160.34 **0.18−0.031.300.680.01
9Beiluo River−0.48 **0.02 *−0.46 **−0.08 ***2.36 *−0.560.55
10Jing River−0.62 **−0.01−0.63 **−0.12 ***2.45 *−0.420.54
11Wei River−1.67 ***−0.05−1.73 ***−0.32 ***1.93 **−0.490.40
12Yiluo River−1.940.06−1.88−0.221.76−1.650.66
Notes: Robs, Rdiv, and Rnatural refer to the observed runoff, water diversion, and natural runoff (summed from Robs and Rdiversion), respectively. Rcoeff refers to the runoff coefficient, defined as the ratio of runoff to precipitation. Climate factors include annual potential evaporation (ET0), precipitation (Pre), and aridity index (AI, defined as the ratio of ET0 to Pre). * significant at the 0.1 level, ** significant at the 0.01 level, *** significant at the 0.001 level.
Table 3. The elasticity of naturalized runoff to potential evapotranspiration (ET0), precipitation (Pre), and vegetation (n) in 1980–1999 (Period I) and 2000–2013 (Period II).
Period IPeriod IIChange Rate (%)
IDεET0εPreεnεET0εPreεn∆εET0∆εPre∆εn
1−1.152.15−1.97−1.822.82−2.6159.0231.5332.75
2−0.851.85−1.62−1.162.16−1.9036.1316.5917.25
3−1.562.56−2.28−1.982.98−2.5926.4316.1213.25
4−1.512.51−2.36−1.672.67−2.4110.456.292.33
5−1.822.82−2.24−2.103.10−2.4215.259.847.94
6−1.832.83−2.33−1.852.85−2.261.430.92−2.73
7−1.602.60−2.07−1.772.77−2.1211.126.842.23
8−2.013.01−2.24−2.073.07−2.243.362.250.30
9−2.543.54−2.26−2.833.83−2.4911.508.2510.08
10−2.133.13−2.13−2.513.51−2.4817.912.1716.16
11−1.732.73−1.72−2.363.36−2.1235.8522.7423.5
12−1.402.40−1.26−1.612.61−1.3614.868.688.27
Note: parameter n representing catchment characteristics, such as land use/cover change, slope, and soil type and texture.
Table 4. Land use/cover change (LUCC) in 1990 and 2010 in the Loess Plateau.
Area (km2)
Land UseBefore 1999After 1999ChangeChange Rate (%)
Cultivated202,527202,019−508−0.25
Forest91,251100,593934210.24
Grassland270,619257,767−12,852−4.75
Water bodies812685544285.27
Residential13,57216,335276320.36
Unused40,90741,7568492.08
Table 5. Change in parameter n and LAI before and after 1999.
Basin IDn1n2∆ (%)∆LAI (%)
11.412.0344.3577.93
21.141.4326.2985.82
31.812.2121.62109.46
41.741.909.4173.67
52.112.3812.5295.68
62.102.142.1248.69
71.902.099.9732.39
82.322.393.1836.75
92.913.168.6835.8
102.492.8113.0254.5
112.182.7526.3033.8
121.982.1910.7438.87

