Article

Spatiotemporal Characteristics of Groundwater Drought and Its Response to Meteorological Drought in Jiangsu Province, China

1
College of Hydrology and Water Resources, Hohai University, Nanjing 210098, China
2
Key Laboratory of Earth Fissures Geological Disaster, Ministry of Land and Resources, Nanjing 210018, China
3
Geological Survey of Jiangsu Province, Nanjing 210018, China
*
Author to whom correspondence should be addressed.
Water 2016, 8(11), 480; https://doi.org/10.3390/w8110480
Submission received: 28 July 2016 / Revised: 12 October 2016 / Accepted: 17 October 2016 / Published: 26 October 2016

Abstract

:
In this study, the temporal and spatial variations of groundwater drought using a Standardized Groundwater Level Index (SGI) were analyzed based on 40 monthly groundwater level observation wells from 1989 to 2012 in Jiangsu Province, China. Meteorological drought, calculated by the Standardized Precipitation Index (SPI), was also included to reveal its propagation and impact on the groundwater drought process. Results showed that the southern region of Jiangsu faced more frequent groundwater droughts and lower intensity, while the northern region faced less frequent groundwater drought with higher intensity. Furthermore, the cross-correlation between the spatial average of SGI and SPI for SPI accumulation periods of q = 1 to 12 was computed. The relationship between SGI and SPI varied in different regions. Detailed analysis of the characteristics of groundwater and meteorological drought for each region showed that meteorological droughts happened more frequently than groundwater drought in Jiangsu Province during the study period, while the mean duration and mean magnitude of groundwater droughts were longer and larger than those of meteorological droughts. It is expected that this study will provide useful information for drought monitoring and mitigation in Jiangsu and similar areas.

1. Introduction

Natural droughts are recurring phenomena that affect all components of the water cycle [1]. It is commonly considered that drought originates from precipitation deficiency and propagation through the hydrological cycle. Different types of physical drought can therefore be defined depending on the hydrological variable considered. Three types have been defined by Wilhite and Glantz [2]: meteorological drought, agricultural drought, and hydrological drought.
Groundwater drought, which is a type of hydrological drought characterized by sustained low groundwater levels, reduced baseflow, and reduced flows to springs and groundwater-fed rivers and wetlands [3,4], has profound adverse impacts on water resources such as groundwater discharge to the groundwater-dependent surface waters and ecosystems, and also affects public water supply, industry supplies, and agricultural irrigation [5].
The causative mechanisms of groundwater drought are complex. Generally, groundwater drought originates from meteorological drought, which lack of precipitation combined with higher evaporation rates propagates through the hydrological cycle, into soil moisture depletion and eventually into the groundwater [3]. Another cause of groundwater drought is pumping to support irrigation, which may enhance naturally occurring droughts [3]. A number of studies have focused on analyzing the propagation of meteorological droughts through the hydrologic systems for a better understanding of the evolution of groundwater droughts. Eltahir and Yeh [6] analyzed the characteristics of natural variability in the regional-scale hydrological cycle of Illinois and showed precipitation shaping the natural variability in the regional hydrological cycle. Peters et al. [7] investigated the propagation of a drought from groundwater recharge to discharge and the influence of aquifer characteristics on the propagation by tracking a drought in recharge through a linear reservoir. Their results showed how the droughts change from many and short droughts in the recharge to fewer and longer droughts in the groundwater discharge. Peters et al. [8] also analyzed the propagation and spatial distribution of the drought in the groundwater system through simulated recharge, hydraulic heads, and groundwater discharge for a groundwater catchment located in England; they found that there are many short droughts in the recharge and in the discharge, whereas fewer, more severe droughts occurred in the hydraulic head. Tallaksen et al. [9] studied drought propagation through the hydrologic cycle using spatially aggregated drought characteristics of precipitation, groundwater recharge, hydraulic head, and discharge in a groundwater-fed catchment located in England.
Other studies have sought to develop indices of groundwater drought for charactering the trends, drought monitoring, and forecasting. Bhuiyan et al. [10] applied the Standard Water-Level Index (SWI), similar to the Standardized Precipitation Index (SPI), to 20 years of twice-yearly (pre- and post-monsoon) groundwater level data from 541 wells across Rajasthan, India. Mendicino et al. [11] developed a Groundwater Resource Index (GRI) derived from a distributed water balance model output, monthly “groundwater detention,” for monitor and forecast summer droughts in southern Italy. Bloomfield and Merchant [12] developed the standardized groundwater level index (SGI), for characterizing groundwater droughts using a non-parametric normal scores transform of the groundwater level for each calendar month. Bailing and Matthew [13] evaluated a groundwater drought index (GWI) derived from monthly groundwater storage output from the Catchment Land Surface Model using a GWI similarly derived from in situ groundwater in eight regions of central and northeastern USA.
Understanding the unique characteristics of drought is crucial to establishing an effective and comprehensive monitoring and early warning system [14]. Jiangsu Province is located in east China, and the Yangtze and Huai Rivers enter the sea. The land surface consists of a flood plain of the Yellow River and the Huai River and the Yangtze River Delta. The monsoon climate of Jiangsu makes it a drought- and flood-prone area. Meanwhile, Jiangsu is China’s major wheat-producing region and has the second highest GDP of all the Chinese provinces, and its local economy may be exposed to the threats of drought or flood disasters. Furthermore, although there are developed irrigation network, groundwater drought may still increase the cost of agriculture and the vulnerability of the regional ecology. In several studies, meteorological droughts in Jiangsu Province were analyzed using drought indices such as the composite index (CI) and Palmer Drought Severity Index (PDSI), based on observed meteorological data [15,16]. However, no known study has focused on groundwater drought or its response to meteorological drought in this region.
In this study, we analyze the groundwater droughts based on 40 groundwater observation wells located in Jiangsu Province of China. Section 2 describes the study area and data availability. Section 3 describes drought indices and procedures applied to identify spatial and temporal drought events. An overview of the drought experienced in Jiangsu is provided first (Section 4.1). Groundwater drought characteristics are explored at the local scale in order to highlight the regional differences in drought characteristics (Section 4.2). Regional characteristics of groundwater droughts and meteorological droughts are then analyzed, aiming at assessing variations in the spatial response of groundwater to meteorological droughts (Section 4.3). Finally, a discussion is given in Section 5.

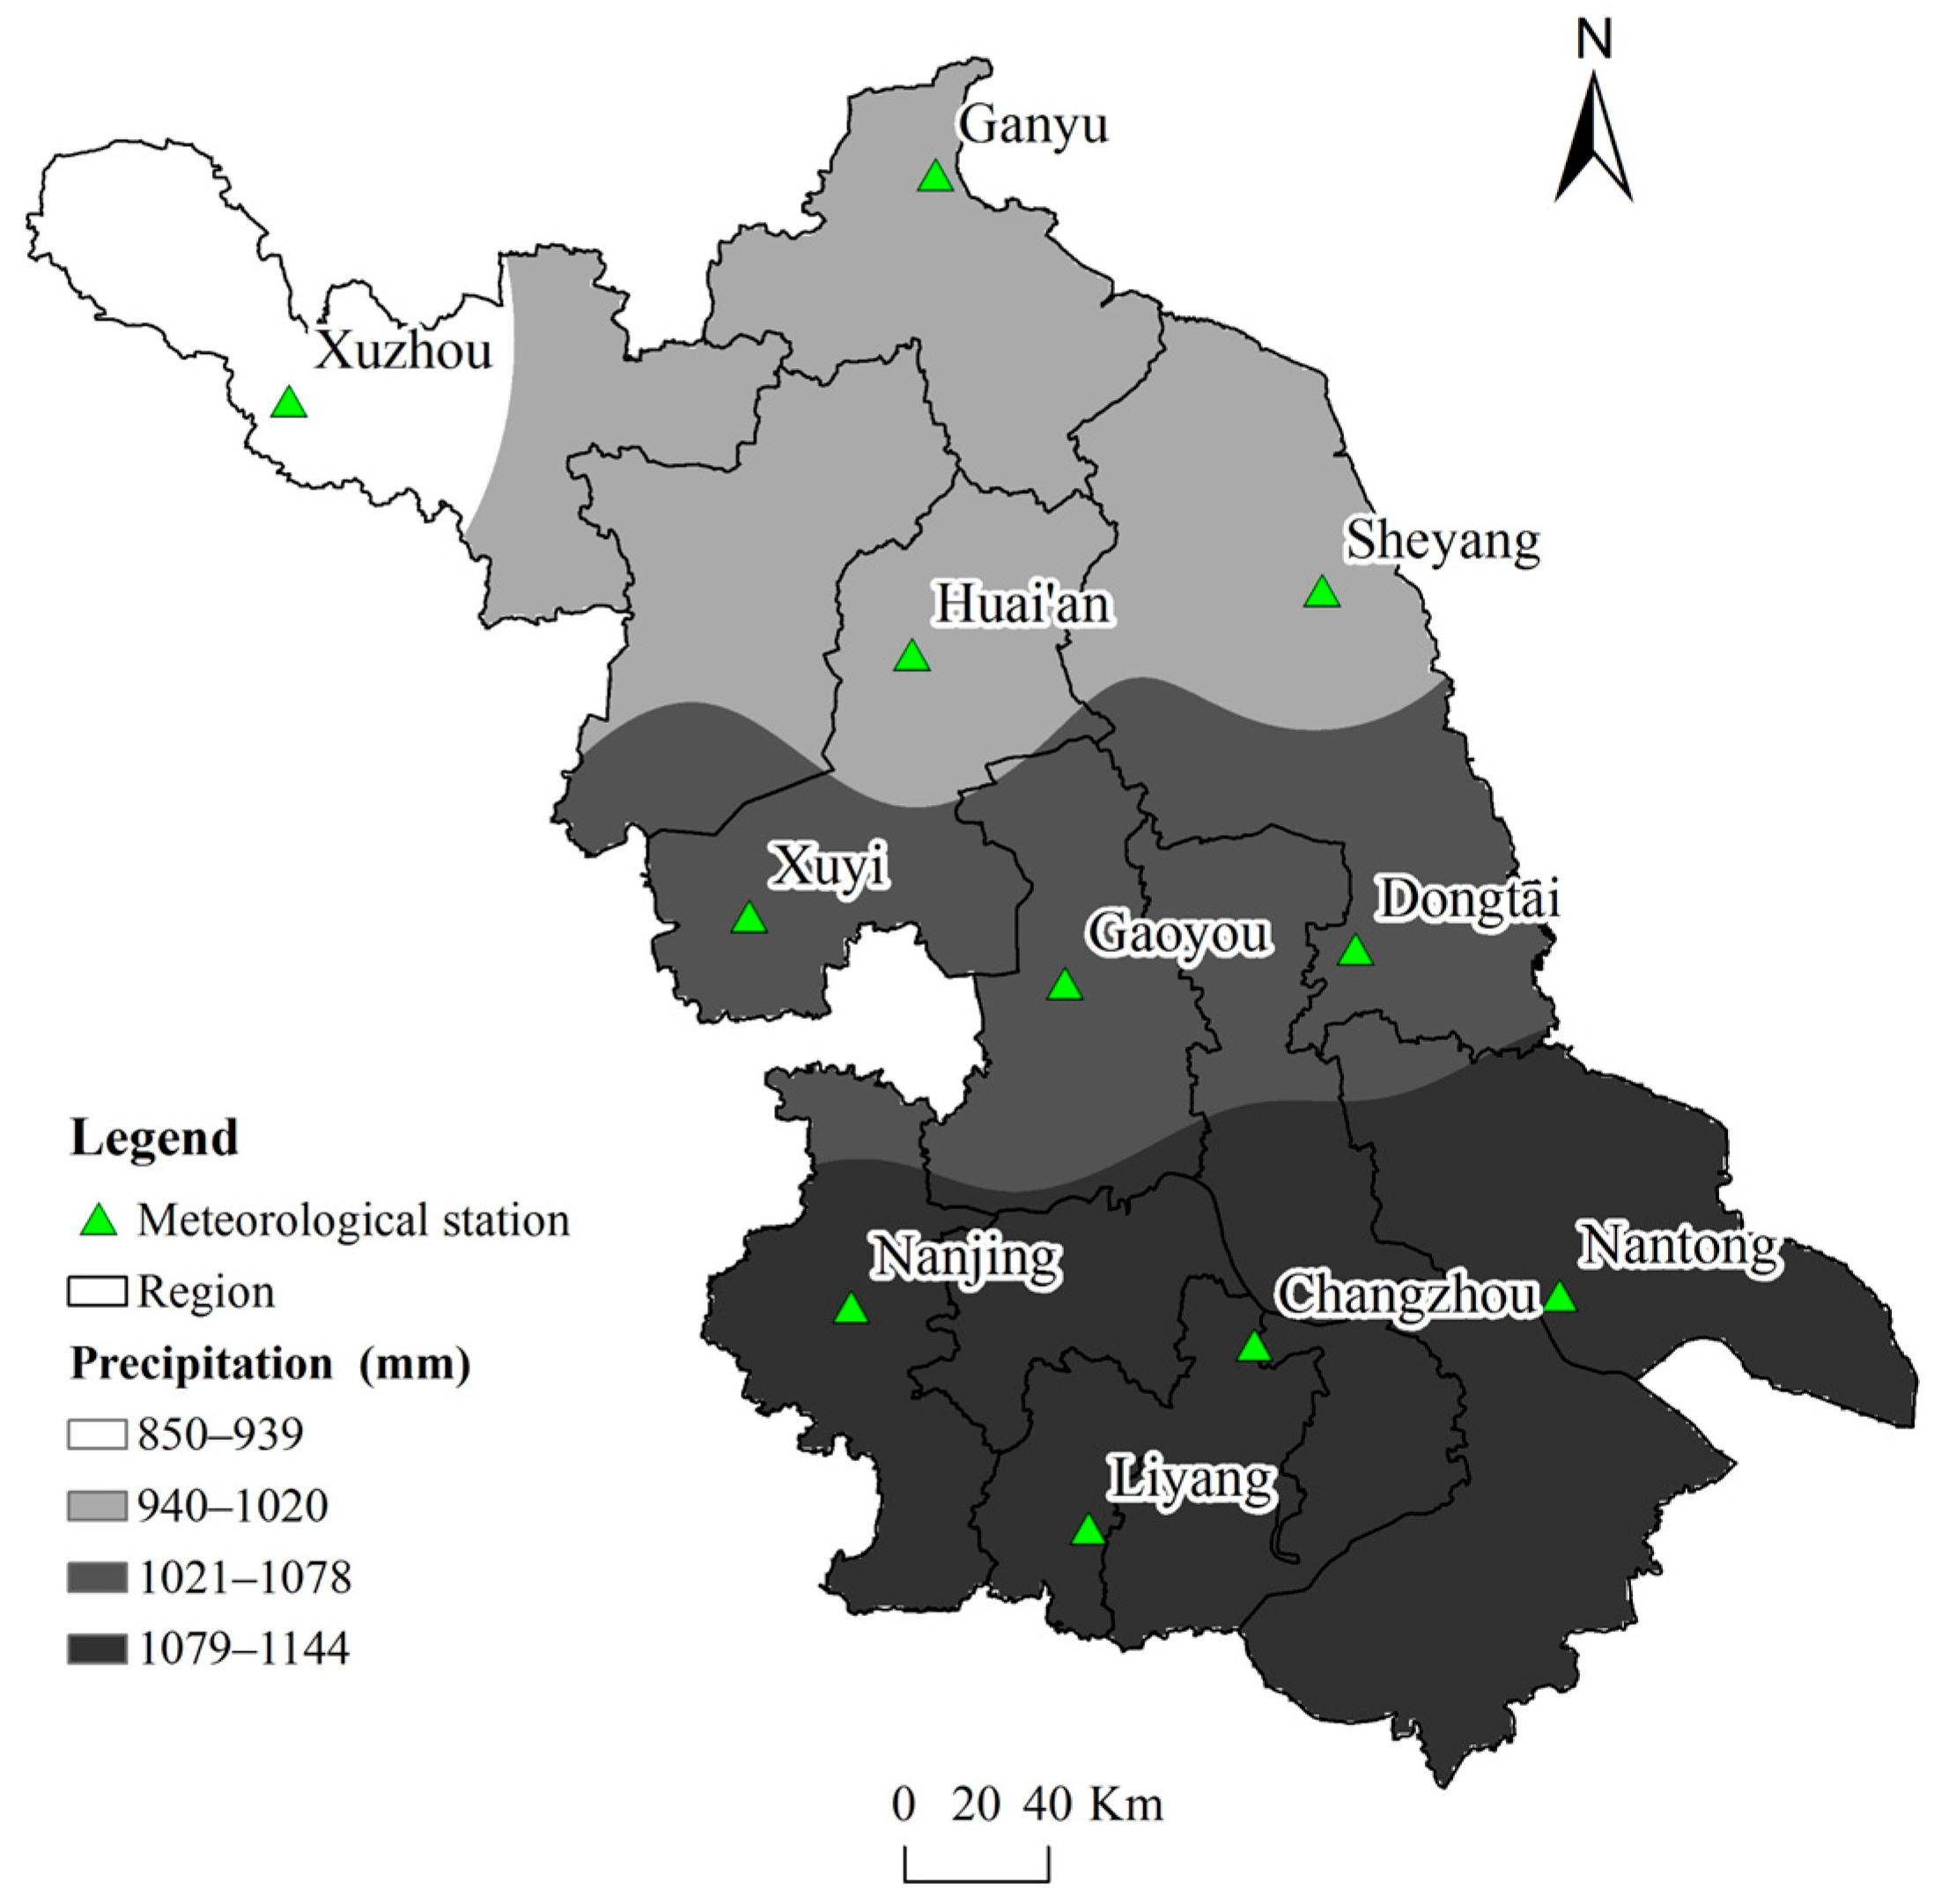
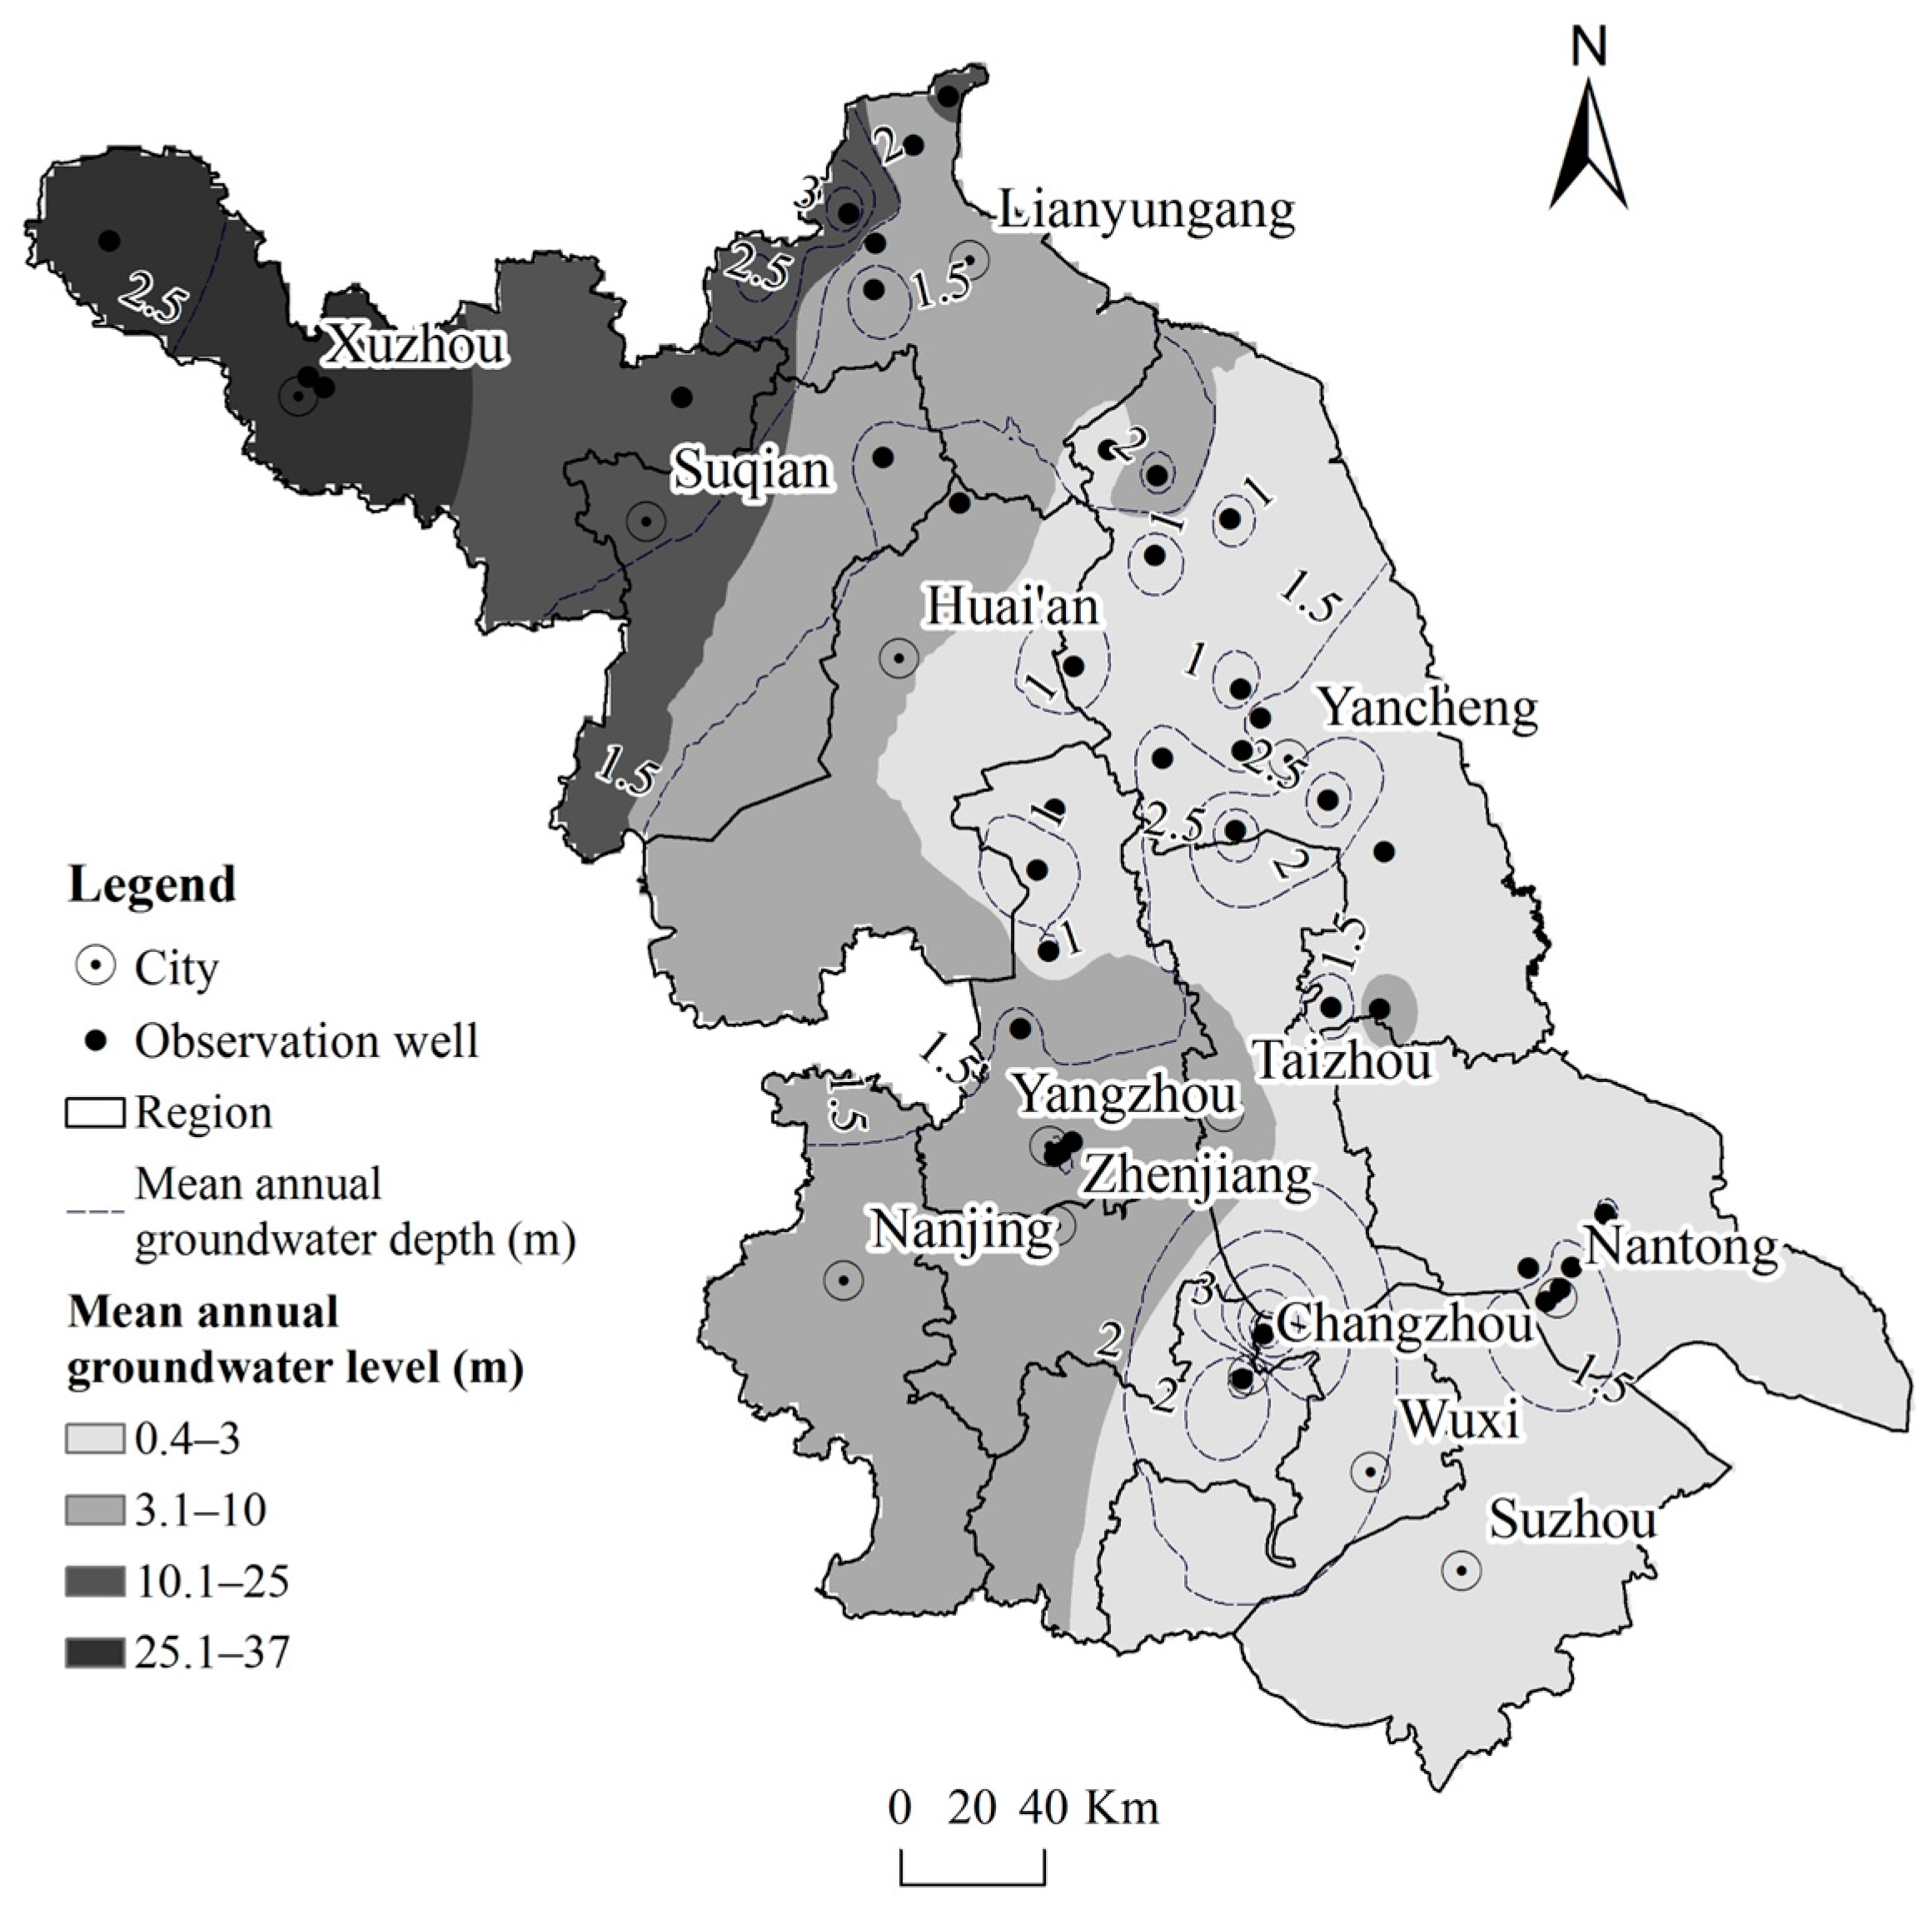
2. Study Area and Data

Jiangsu is located in the eastern coastal area of China. It covers an area of about 100,000 km2, ranging from 116.22° E to 121.56° E and 30.45° E to 35.08° E. It is bounded by the Yellow Sea and East Sea to its eastern border and Taihu Lake on its southern border; the Yangtze River passes through the province in its southern part to reach the East China Sea, as does the Huai River in northern Jiangsu to reach the Yellow Sea. The land of Jiangsu Province is generally flat and low-lying. The plains, rivers and lakes, and hills and lower mountains cover 68%, 16.8%, and 14.3%, respectively, of the total provincial land. The inland landform feature is roughly higher in the northwest but lower in the southeast, and the majority of the land lies less than 50 meters above sea level. The location and topography of the study area are shown in Figure 1.
The precipitation datasets were obtained from China Climate Dataset (http://data.cma.cn/). This study selected 11 national meteorological stations. Monthly precipitation records for the period of 1957–2012 are available. For consistency between precipitation and groundwater level datasets, the precipitation records during the period from 1989 to 2012 were used in this study. The locations of the selected national meteorological stations are shown in Figure 1. In addition, detailed information of these stations is listed in Table S1. The long-term annual average precipitation of Jiangsu Province is 1017.53 mm. Precipitation falls frequently between spring and summer; the annual mean precipitation is 800 to 1200 mm from north to south, concentrated mostly in the summer (Figure 2).
The Quaternary strata are widely distributed and the thickness of the unconsolidated deposits increases from west to east. The Quaternary sediments are primarily composed of sandy silt, medium-coarse sand, and medium-coarse sand with gravels, with some clay and loam interlayers [17]. According to the climate and geographical conditions, the study area was divided into four regions, namely, the northwest region (NW), the northeast region (NE), a central region, and the south region. The NW region, which mainly includes Xuzhou City, is located in the Huai River Basin and not adjacent to the sea. The NE region, which mainly covers Lianyungang City, Suqian City, the northern part of Huai’an City, and the northern part of Yancheng City, is mainly located in the lower Huai River Basin. The central region, which mainly covers the southern part of Huai’an City, Yangzhou City, the northern part of Taizhou City, and the southern part of Yancheng City, is mainly located in the plain of the Yangtze–Huai Rivers. The south region, which mainly covers Nanjing City, Zhenjiang City, Changzhou City, Wuxi City, Suzhou City, the southern part of Taizhou City, and Nantong City, is mainly located in the Yangtze River Delta. Summary information is given in Table 1.
To create a representative groundwater level database for the plain of Jiangsu Province, groundwater observation from 80 wells across the study area were collected from Geological Survey of Jiangsu Province. For most wells, the observation frequency is about five days, six times per month for each well. Yet the quality and length of the observation data range widely between stations. The groundwater level records range in length from 6 to 24 years. The groundwater level records for most stations are complete and standard from 1989 to the end of 2012 and were selected for the long-term variation analysis of this study. A total of 40 groundwater level wells across the plain of Jiangsu Province were selected. Time series with 10% or more of the data missing for the total period of the series were excluded and missing data were linearly interpolated. The monthly groundwater level records from January 1989 to December 2012 were used. In addition, detailed information of these stations is listed in Table S2.
Figure 3 shows the contour of annual mean groundwater level for 1989–2012 in the study area. The long-term annual average groundwater level is 7.84 m, and the corresponding water table depth is 1.72 m. Generally, the groundwater in Jiangsu flows with topography from the northwest to the southeast toward the sea and the groundwater velocity is relatively very slow with a hydraulic gradient of about 2/10,000 [17]. The groundwater level is relatively high in Xuzhou City at 37.16 m and low in Yancheng City at 0.31 m. The lowest groundwater depth is found in the central region, with a range of 0.45 to 1.5 m; the largest depth is found in the southern region, mainly in Changzhou city, with a range of 3.5 m to 4.5 m, while the majority depth in the rest of south region is in the range of 1 to 2 m. The depths in the NW region are mainly in the range of 2 to 3 m and in the NE region they are mainly in the range of 1 to 2 m (Table 1). It can be inferred that groundwater is closely connected with precipitation.

3. Method

3.1. Drought Indices

3.1.1. Standardized Precipitation Index

The Standardized Precipitation Index (SPI) was developed by McKee et al. [18] to characterize the wetness and dryness conditions of a region based on the departure of the monthly precipitation estimate from their (average) normal value. Computation of the SPI involves fitting a gamma distribution to long-term precipitation records for a given accumulation period (typically at 3, 6, 12, 24, or 36 months). This fitted distribution is then transformed into a standard normal distribution and the estimated standardized values combined to produce the SPI time series. McKee et al. [18] also arbitrarily defined drought intensity according to the values of the SPI (Table 2). SPI has been used widely to characterize meteorological drought and has recently been promoted by the WMO as the reference index for meteorological drought [19].

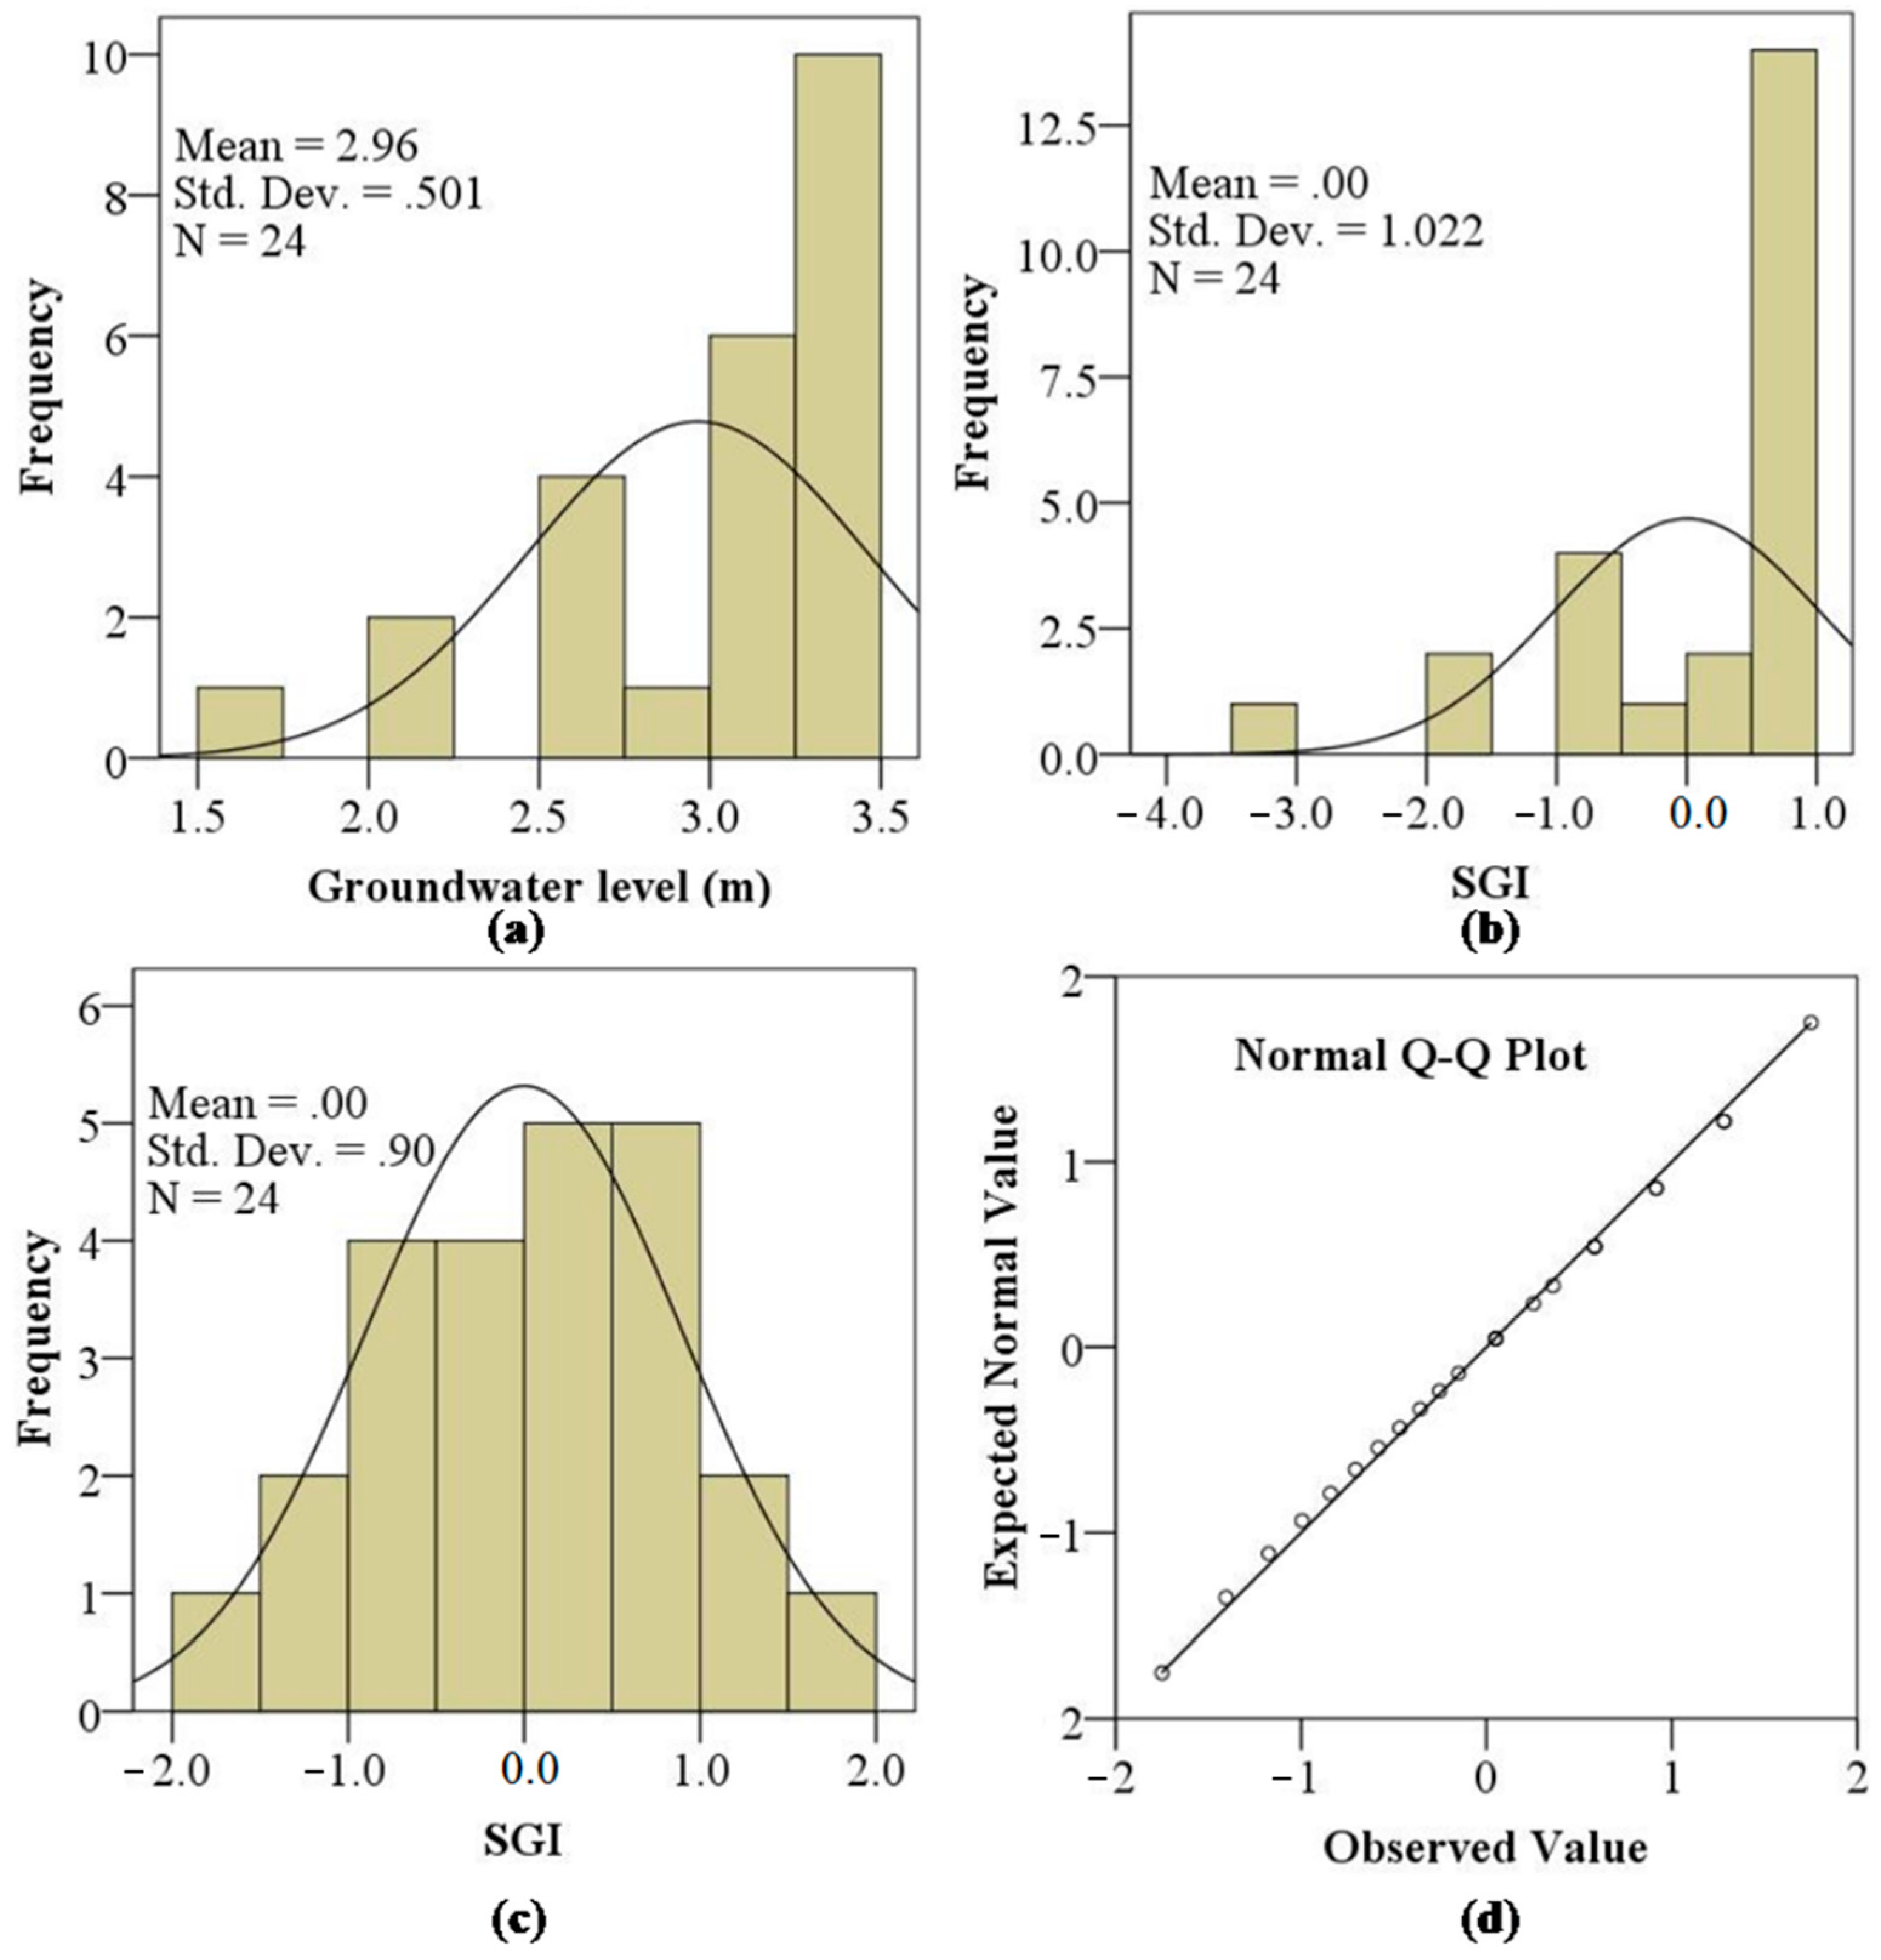
3.1.2. Standardized Groundwater Level Index

McKee et al. [18] suggested that the procedure of SPI can be applied to other variables relevant to drought, e.g., stream flow or groundwater. In addition to the gamma distribution, a range of other distributions (including those related to the gamma distribution) have been used to normalize hydrological time series, for example, Pearson Type III for precipitation [20,21], beta distributions and nonparametric approach kernel densities for soil moisture [22,23], log-normal for runoff [24], and six three-parameter distributions (lognormal, Pearson Type III, log-logistic, general extreme value, generalized Pareto, and Weibull) for streamflow [25].
Like many other hydrological time series, the distributions of monthly observed groundwater levels may not conform to a gamma distribution. However, due to the impact of auto-correlation, long-term trends, or human activities, groundwater level time series appear to be particularly irregular in the form of their distribution of monthly groundwater levels [12]. For example, the distribution of SGI calculated from groundwater level for #0029 groundwater observation in Yancheng City in June from 1989 to 2012 fitted gamma distribution well but failed to pass the Kolmogorov–Smirnov (K–S) normality test at the p   =   0.05 level (Figure 4a,b).
Here we apply the normal scores transform. This approach has previously been used to estimate a standardized groundwater level in unconfined, consolidated aquifers in the United Kingdom [12]. This is a nonparametric normalization of data that assigns a value to the monthly groundwater levels based on their rank within groundwater levels for a given month from a hydrograph. The groundwater level time series is denoted as zij for i = 1, 2…, N and j = 1, 2…, 12, where zij is the groundwater level of the jth month of the ith year and N is the total number of years of the observation data. For a given month, the probability pi is determined based on the rank within the total years, then we apply the inverse normal cumulative distribution function to the pi values to get the SGI values. Figure 4c shows an example of groundwater level using normal scores transform for the #0029 groundwater level observation well in Yancheng City in June from 1989 to 2012. The results of this groundwater level observation well are close to the expected normal values (Figure 4d). The SGI distribution that results from this transform will always pass the K–S normality test.
In summary, for each of the 40 wells, normalized indices are estimated from the groundwater level data for each calendar month using the normal scores transform. These normalized indices are then merged to form to a continuous SGI. For consistency between groundwater and precipitation indices, SPI are estimated using the normal scores transform applied to accumulated precipitation data for each calendar month. The accumulated precipitation for each month is determined from previous months. For instance, the three-month SPI calculated for January 1990 would have utilized the precipitation total of November 1989, December 1989, and January 1990 in order to calculate the index.

3.2. Drought Identification and Characteristics

The procedure described above helps with generating drought index values. The next step consists of identifying drought events and determining the characteristics of these events. The groundwater drought identification method adopted corresponds to the one proposed initially by McKee et al. (Table 2) [18]. A drought event is defined as a period in which the index is continuously negative and reaches a given threshold. Usually, there are three characteristics to describe the drought events, namely the frequency (or number of drought events), duration, and magnitude. The duration of a drought event is the number of months where the index is continuously negative. The magnitude of the event is the absolute value of the sum of index values during the event. The mean duration and mean magnitude are calculated to quantitatively compare drought characteristics at local and regional scale. The mean duration is calculated as the duration divided by the number of drought events, and the mean magnitude is calculated as the magnitude divided by the number of drought events, the results of which are presented in Section 4.2.3 and Section 4.2.4.

3.3. Variance Correction Pre-Whitening Mann–Kendall Test

The Mann–Kendall (MK) test is one of the most widely used statistical tools to assess trends in time series. It is assumption of serial independence of data by the MK test. However, the hydrometerological data, in this study the groundwater level and the corresponding standardized groundwater index, are typically auto-correlated. The autocorrelation seriously interferes with the real type I error and the power of the test, potentially resulting in distorted results [26]. To mitigate this impact, some efforts focus on adjusting the original test to the auto-correlated data, commonly a pre-whitening (PW) approach, trend-free pre-whitening (TFPW). However, these approaches may be inadequate to analyze real data because of the high variance of slope estimators [27]. These problems were solving by involving the correction of both the slope and serial variances in the original TFPW approach, Variance Correction Pre-Whitening Method. The Variance Correction Pre-Whitening Mann Kendall method (VCPW-MK) [26] is used for trend detection in this study.
The Mann–Kendall statistic (S) is defined as:
S = i   =   1 n - 1 j   =   i   +   1 n sgn ( x j - x i )
where:
sgn ( θ )   =   { 1 , θ   >   0 0 , θ   =   0 1 , θ   <   0
where n is the number of data points. For large samples (n > 10), the test is conducted using a normal distribution (Helsel and Hirsch [28]) with the mean and the variance as follows:
E ( S )   =   0
Var ( S )   =   n ( n 1 ) ( 2 n   +   5 )   k = 1 n t k ( t k 1 ) ( 2 t k   +   5 ) 18 ,
where n is the number of tied (zero difference between compared values) regions, and tk is the number of data points in the kth tied region. The standard normal deviate (Z statistic) is then computed as:
Z   =   { S 1 Var ( S ) ,   S   >   0 0 ,   S   =   0 S   +   1 Var ( S ) ,   S   <   0 .
If Z > 1.96 or Z < −1.96, the null hypothesis of no trend in the time series is rejected at the 95% significance level. Whereas Z > 1.96 means a significant increase, Z < −1.96 denotes a significant decrease.
The procedure of VCPW-MK method is outlined as follows:
Step 1. The initial slope estimator of linear trend β is estimated and removed from the original series:
A t   =   X t β t .
Step 2. The lag-1 data autocorrelation coefficient estimator r 1 is computed from the detrended series. If r 1 is significant, the AR(1) component is removed [Equation (7)]; otherwise, the detrended series is independent, and the MK test is directly applied to the original series:
A t   =   A t r 1 A t 1 .
Step 3. The variances of A t and A t are estimated, yielding δ A 2 and δ ϵ 2 , respectively. A corrected trend-free pre-whitened series A t , which has the same variance as A t , is computed by
A t = A t . δ A 2 / δ ϵ 2 .
Step 4. The modified slope estimator β is computed for r 1   >   0 by introducing VIF. If r 1     0 , β = β is considered:
β = β / VIF
VIF     ( 1   +   r 1 ) / ( 1 r 1 ) .
Step 5. Recombine A t with the modified trend component as
X t = A t + β t .
Step 6. The MK test is applied to the new transformed series X t .

4. Results

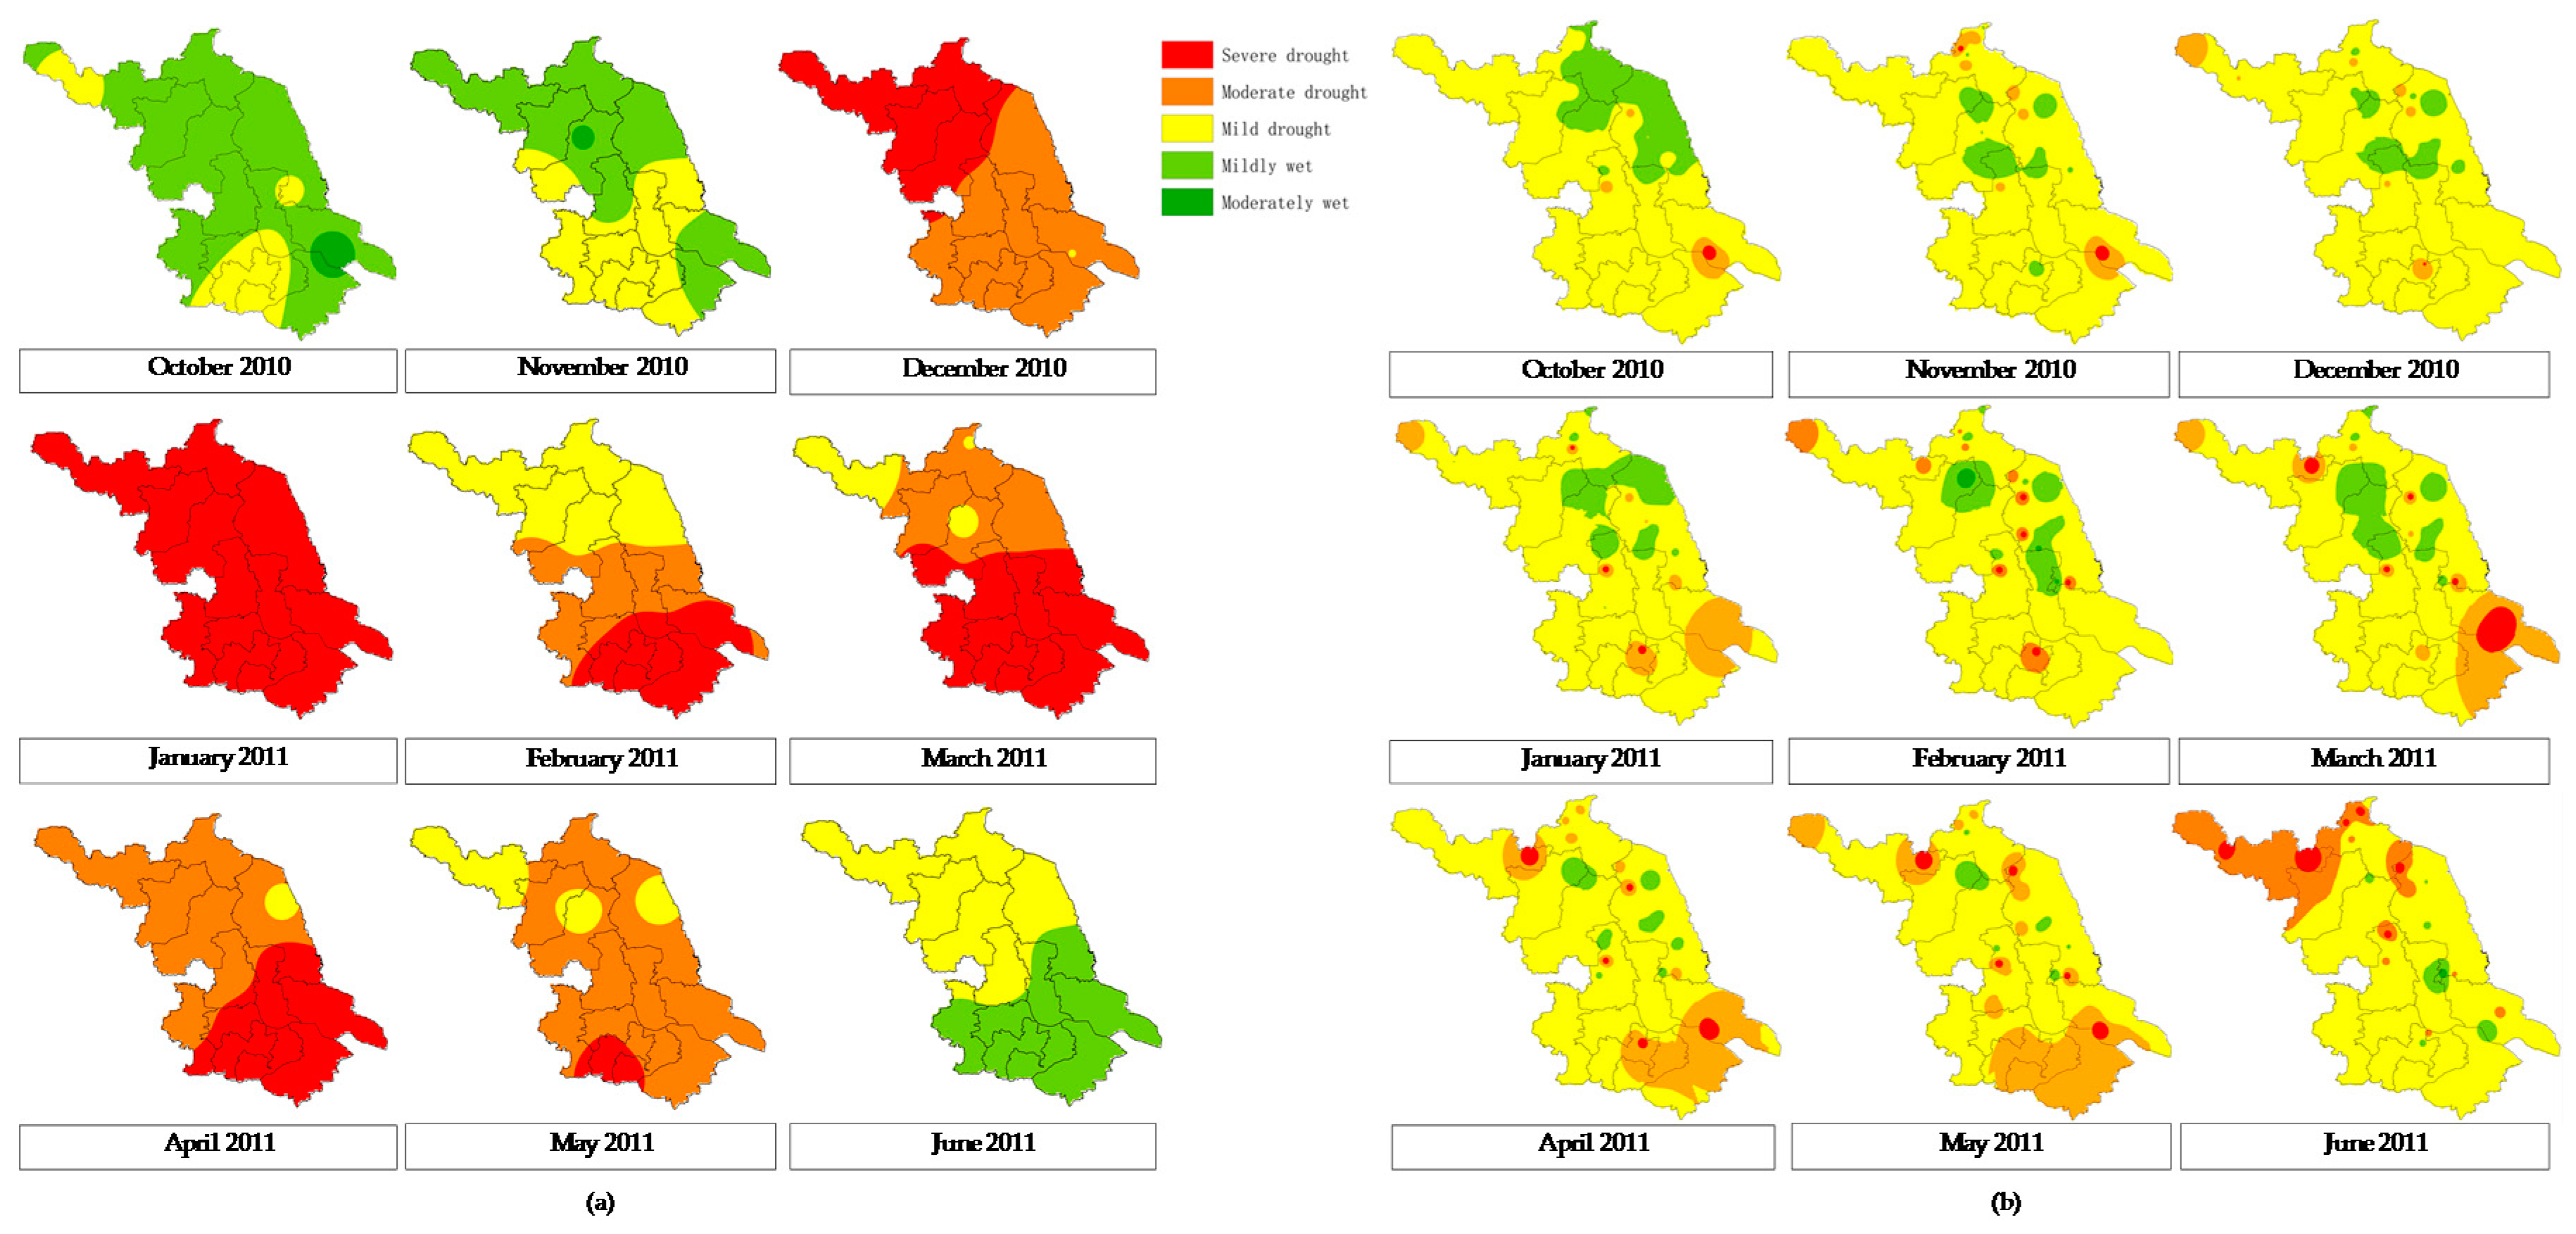
4.1. Overview of Droughts

To provide an overview of the development of meteorological droughts and groundwater droughts in the study area, the mean SPI and SGI for the entire region were analyzed. The mean SPI was calculated for each meteorological station then averaged to represent the study area, and so was SGI for each groundwater observation well.
Figure 5a shows the cross correlation coefficient between mean SPI for precipitation accumulation periods q = 1 to 12 months and SGI, as well as the lags between SPI and SGI of 0 to 6 months. The maximum correlation (0.74) occurs when precipitation accumulation period is 3 months (SPI-3) and the lag is zero between SPI and SGI time series.
Figure 5b shows the mean SPI-3 time series during the period from 1989 to 2012. As can be seen from Figure 5b, the lowest value of mean SPI-3 (−1.56) was found in January 2011, while the highest value of mean SPI-3 (1.67) was found in January 1998. There are seven moderately wet events and two severely wet events during the study period. Most moderate wet events happened after 2000, and the longest duration for such an event lasted nine months, from February to October 2003. Both severely wet events happened in the 1990s, with the longest duration lasting ten months from December 1997 to September 1998. As for drought, there are eight moderate drought events and three severe drought events during the study period; the longest duration for moderate drought was twelve months from January to December 2004 and severe drought also lasted eight months from April to November 2001.
The overall trend of SPI-3 time series shows a slight linear decrease. The study area experienced persistent wetness from 1990 to 1991 and relative dryness between 1992 and 1997, then fluctuated between wetness and dryness during the period from 1998 to 2010 before moving towards dryness from 2011 to 2012 (Figure 5b).
Figure 5c shows the mean SGI time series during the study period. As can be seen from Figure 5c, the lowest value of mean SGI ( 0.69) was identified in May 2011, while the highest value (1.08) was identified in June 1991. Due to the meteorological and hydrogeological conditions of Jiangsu Province, the average spatial groundwater level usually fluctuates within a range of 2 m, thus the SGI value ranges are less than SPI ranges. The mild groundwater droughts happened frequently and mostly concentrated in the mid-1990s and around the year 2011. There was one moderately wet event during the study period with a duration of nine months from February to October 1991. No severe groundwater drought was detected for the whole province.
The average SPI-3 and SGI time series have similar features (Figure 5b,c). For example, high values of SGI in 1990–1991, 1998, 2001, and 2003 correspond with high values of SPI-3. Meanwhile, episodes of regional groundwater drought (negative SGI values) from June 1994 to May 1996, September 1998 to September 1999, April 2001 to November 2001, February 2004 to January 2005, and October 2010 to July 2011 correspond closely with episodes of negative SPI-3 time series. This is consistent with what has been documented, mainly at the meteorological level [15,16]. It is inferred from these observations that the drought history of the study area is represented well by the averaged SPI-3 and SGI time series.
Although SGI was well correlated with SPI, these observations also highlight the differences in drought characteristics based on the averaged SPI-3 and SGI time series. For instance, groundwater drought occurred in June 1994 lasted to May 1996, while there were two mild meteorological wet events during the same period. Moreover, groundwater drought is of less intensity than corresponding meteorological droughts. Thus, there is a need to consider different variables in order to completely characterize droughts.

4.2. Groundwater Drought Characteristics

4.2.1. Statistic Trend Analyses of Groundwater Drought

The trends of groundwater drought were analyzed based on the VCPW-MK statistics of the SGIs for each observation well during the period from 1989 to 2012. The spatial patterns of trends in the SGI index in Jiangsu Province are displayed in Figure 6. The trend tests detected a negative trend in the SGI series at 23 out of 40 stations (16 stations passed the 95% significance level) and a positive trend at 17 out of 40 stations (13 stations passed the 95% significance level).
Statistically significant negative trends of the SGI index towards dryer conditions were mainly found in the NW region (all four stations showed negative trend; all passed the significance test) and the central region (eight out of 14 stations showed negative trend and seven passed the significance test), whereas positive trends of SGI towards wetter conditions were mainly found in the NE region (nine out of 15 stations showed a positive trend and six stations passed the significance test); the southern region showed a non-significant dryer trend (five out of seven stations showed a negative trend, but only two stations passed the significance test).

4.2.2. Frequency of Drought

Figure 7 shows the spatial distributions of a number of different drought categories in Jiangsu Province during the study period. As shown in Figure 7a, small numbers of moderate drought events (less than six events during 1989–2012) are mainly found in the NE region, specifically the northern part of Lianyungang City and the center of Yancheng City, while the most moderate drought events (more than six events during 1989–2012) occurred in Xuzhou City, in the eastern part of Suqian City, and in the southern parts of Yancheng and Nantong City in the central region. It should be noted that no moderate groundwater drought was detected in Huai’an City (#8178), Yangzhou City (#6031), or Changzhou City (#3080).
The numbers of moderate drought events ranged from 3 to 8 in the NW region (average 5.8), from 0 to 13 in the NE region (average 4.7), from 0 to 15 in the central region (average 6.2), and from 0 to 13 in the south region (average 7). The central and southern regions experienced more frequent moderate drought than the NW or NE regions.
As shown in Figure 7b, for all the groundwater stations in the province, at least one severe groundwater drought event was detected during the study period. A very low number of severe groundwater drought events were identified in Yancheng City (#0137 and #6031, both one event; #0028 and #0029, both two events), Yangzhou City (#6036, two events), and Xuzhou City (#9384, two events). A high number of severe groundwater drought events were identified in Yancheng City (#0127, 11 events), Yangzhou City (#6021, 10 events), and Nantong City (#7052, 10 events).
The numbers of severe drought events in the NW region ranged from 3 to 5 (average 3.8), from 2 to 6 in the NE region (average 3.7), from 1 to 11 in the central region (average 5.2), and from 4 to 10 in the southern region (average 7.1). The central and southern region experienced more frequent severe droughts than the NW and NE regions.
In general, the frequency of severe drought has a similar distribution to that of moderate drought, whereas the southern and central regions had more frequent droughts than the NW and NE regions. However, there are less severe drought events than moderate drought events in the study area except for the southern region.

4.2.3. Mean Duration of Drought

The spatial distributions of moderate and severe drought mean duration are shown in Figure 8. As shown in Figure 8a, there are four groundwater level observation wells for which the mean moderate drought duration is shorter than three months and six groundwater level observation wells for which the mean moderate drought duration is longer than 12 months. The longest mean moderate duration is 19 months and is found in Yancheng City (#0029), and the mean duration for most stations in the province ranges from three to nine months.
The mean moderate durations ranges from 7.2 to 14.7 months in the NW region (average 9.4 months), from 0 to 19 months in the NE region (average 8.2 months), from 0 to 13 months in the central region (average 6.5 months), and from 0 to 5.5 months in the southern region (average 3.7 months). Generally, the southern and central regions show shorter mean moderate drought durations than the northern part of the study area.
As shown in Figure 8b, there are three groundwater level observation wells with a mean severe drought duration shorter than six months and 23 wells with a mean severe drought duration longer than 12 months. The shortest mean severe duration event was 3.6 months and was observed in Yangzhou City (#6021), while the longest mean severe duration event was 79 months and was found in another well of the same city (#6031). For most groundwater wells in the province, the mean severe duration ranges from 12 to 24 months.
The mean severe durations in the NW region ranged from 10 to 24.3 months (average 15.2 months), from 7.6 to 31.3 months in the NE region (average 18 months), from 3.6 to 79 months in the central region (average 16.9 months), and from 5.2 to 16.7 months in the southern region (average 8.6 months). Generally, the southern region shows shorter mean moderate drought durations than the northern and central regions.
Overall, the spatial distributions of mean moderate and severe drought durations show contrasting patterns with those of mean moderate and severe drought frequencies. The central and southern region experience shorter mean moderate drought durations than the NW and NE regions; as for mean severe drought, the southern region shows shorter durations than the rest of the study area. However, the mean duration of severe drought is longer than that of moderate drought for all wells except #6010 in Yangzhou City (9 months of mean severe drought duration and 12 months of mean moderate drought duration).

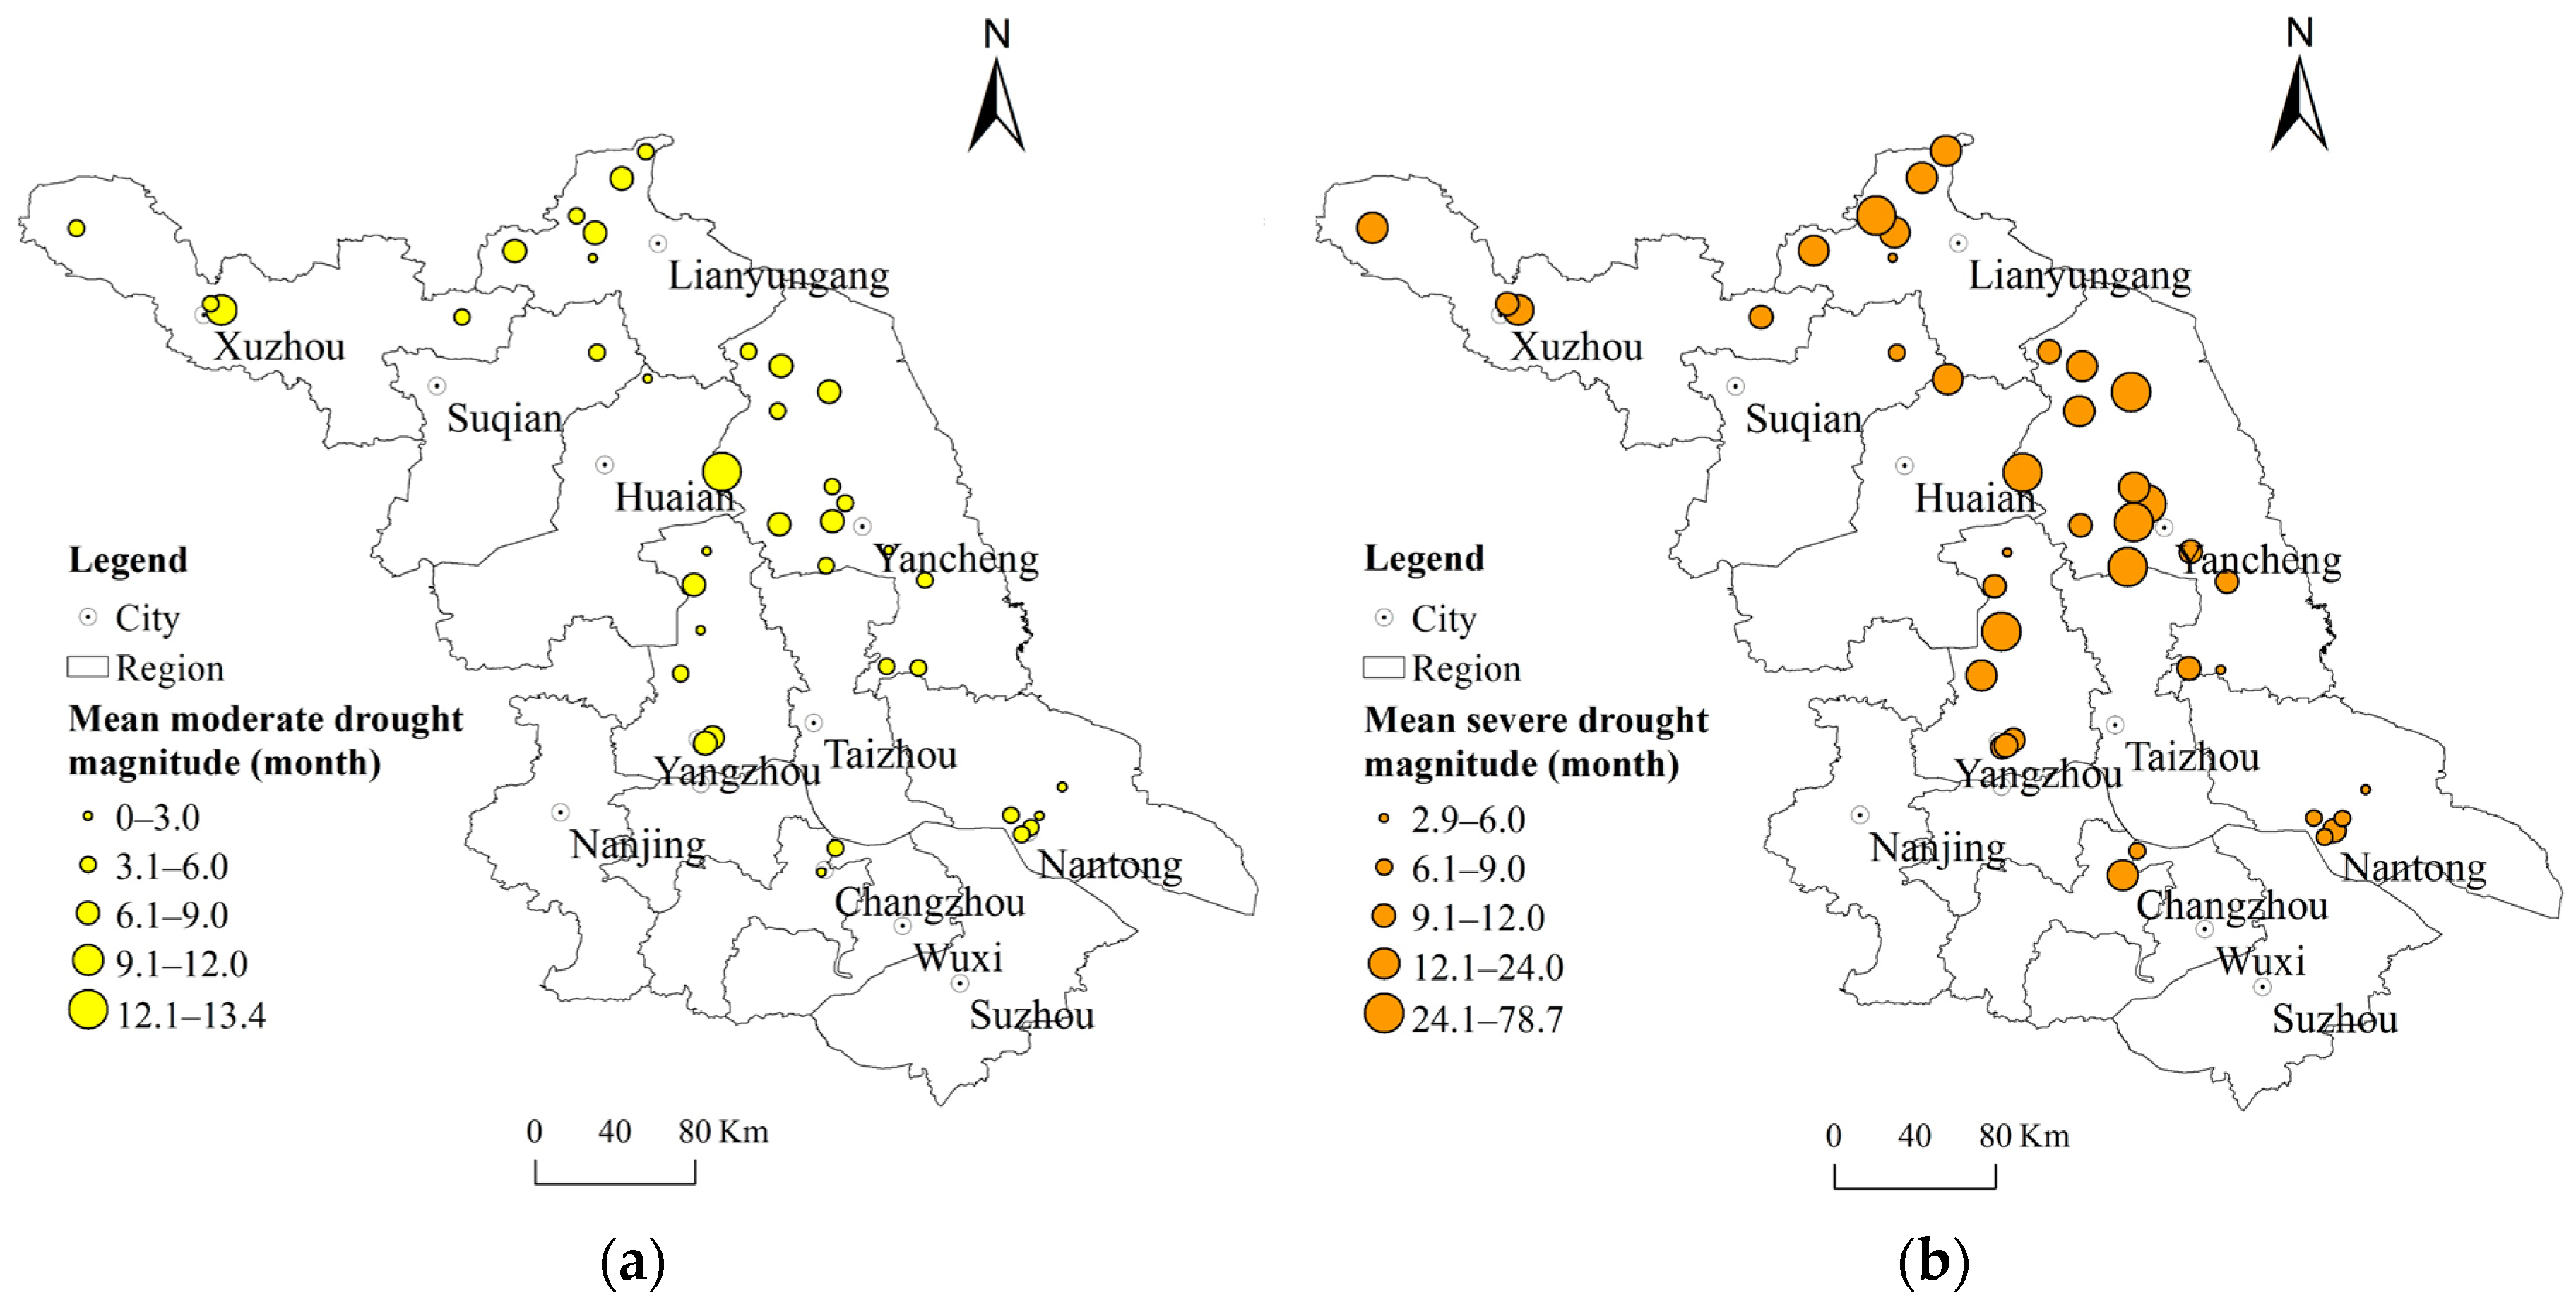
4.2.4. Mean Magnitude of Drought

The magnitude integrates both the severity and the duration of the event considered. This index is in terms of months. Figure 9 shows the spatial distributions of the mean magnitude of moderate and severe drought.
As can be seen in Figure 9a, mean moderate drought magnitude was less than 3 months for eight groundwater level observation wells and it was longer than 12 months for one groundwater observation well. The longest mean moderate magnitude was 13.4 months and was found in Yancheng City (#0029), and the majority mean moderate magnitude ranged from three to six months.
The mean moderate drought magnitude in the NW region ranges from 5.3 to 9.6 months (average 6.7), from 0 to 19 months in the NE region (average 8.2), from 0 to 8.2 months in the central region (average 4.7) and from 0 to 4.6 months in the southern region (average 2.8). Generally, the southern and central regions show less mean moderate drought magnitude than the northern part of the study area.
As can be seen in Figure 9b, mean severe drought magnitude was less than 3 months for one groundwater level observation well and it was longer than 12 months in 19 groundwater observation wells. The smallest mean severe drought magnitude was 2.9 months and was found in Lianyungang City (#L019), while the largest mean severe drought magnitude was 78.7 months in Yangzhou City (#6031). For most groundwater observation wells, mean severe magnitude ranges from 9 to 18 months.
The mean severe drought magnitude in the NW region ranged from 11.3 to 21 months (average 15.6), from 2.9 to 33.3 months in the NE region (average 18.1), from 4 to 78.7 months in the central region (average 17.7) and from 6.3 to 15 months in the southern region (average 8.7). Generally, the south shows less mean severe drought magnitude than the northern and central regions. The spatial distributions of mean moderate and severe drought magnitude are similar to those of mean moderate and severe drought duration. The southern region and central region exhibit lower mean magnitude for moderate drought than the NW and NE regions; as for mean severe drought magnitude, the southern region shows lower mean magnitude than the rest of the study area. However, the mean magnitude of severe drought is larger than that of moderate drought.

4.3. Regional Characteristics of Groundwater Drought and Meteorological Drought

The SPI and SGI are computed at each station within the region, then averaged to represent the regional mean SPI and SGI for each sub-region. The cross-correlation between mean SGI and SPI for SPI accumulation periods of q = 1 to 12 months has been computed for each region and is shown in Figure 10. The maximum cross-correlation coefficients between SGI and SPI are in the range of 0.52 to 0.68, with the highest coefficients of 0.68 associated with the central region and the lowest coefficients of 0.52 associated with the NW region. Moreover, the cross-correlation between groundwater drought and meteorological drought reaches its maximum at q = 5, 6 respectively in the NW and NE regions (0.52 and 0.66, respectively), and it sustains a high level for the SPI accumulation periods of q = 3 to 8 (around 0.5 and 0.6, respectively), while the cross-correlation reaches its maximum at q = 2 (0.68 and 0.67, respectively) then drops with an increase of the SPI accumulation periods in the central and southern regions.
The corresponding largest SPI accumulation periods, SPI q max , and mean SGI time series for each region are shown in Figure 11.
The SPI q max time series in the study area can be divided into two patterns. The SPI-5 time series for the NW region and SPI-6 time series for the NE region show similar patterns. For example, the SPI-5 time series in both regions show high SPI values in the early 1990s and low values of SPI between 1992 and 1997, then fluctuate between wetness and dryness from 1998 to 2005, and then decrease after 2006. In contrast, the SPI-2 time series for the central and southern regions show broadly similar patterns: small cyclical ‘dryness–wetness’ patterns, with a dryness tendency before the twenty-first century and a tendency towards wetness at the beginning of the twenty-first century. The southern region experiences the most frequent moderately wet and moderate drought (12 and 15 events, respectively), while the northwest region shows the lowest frequent moderate wetness with three events and the central region presents the lowest frequent moderate drought with seven events. As for the frequency of severe events, the central region exhibits the most frequency for both severely wet and severe drought (8 and 10 events, respectively), whereas the northeast region shows the lowest frequent severe wetness and severe drought (both only one event).
The mean SGI time series show clear distinctions between the four regions. Specifically, the NW region experiences a ‘wetness–dryness’ pattern, with wetness from 1990 to 1998 and dryness at the beginning of the twenty-first century. In contrast, the NE region experiences a ‘dryness–wetness’ pattern, with dryness from 1990 to 1997 and wetness after 1998. However, the central region shows relative wetness in the 1990s then exhibits relative dryness in the 2000s. Also, the southern region shows contrasting patterns. This region shows wetness in the early 1990s before sustaining drought in the middle of the 1990s, then sustains wetness in the late 1990s and early 2000s; after 2003, this region tends towards dryness.
In summary, different regions show differences in terms of the response of groundwater drought to meteorological drought. Specifically, the NE and NW regions show weaker correlation between groundwater drought and meteorological drought compared with the southern and central regions. For instance, the SPI-5 time series shows fluctuation between drought and wetness from 1992 to 1995 both in the NW region and the NE region, whereas the SGI time series shows persistent wetness in the NW region and long drought in the NE region during the same time period. In contrast, SPI-2 and the SGI time series are well correlated in the central and southern region. It is also interesting to note that different responses of groundwater drought to meteorological drought are detected in the central and southern regions; for example, the SPI-2 time series shows a similar pattern of fluctuating between wetness and dryness from 1990 to 1997 in the central and southern regions, while the SGI time series shows relative wetness in the central region and relative dryness in the southern region during the same time period.
The number of drought events, mean drought duration, and mean drought magnitude of the corresponding SPI q max and SGI for each region are analyzed in this study. The trends of region-averaged SGI and SPI are calculated and tested by the VCPW-MK method. As shown in Table 3, decreasing trends for meteorological drought were observed in all four regions, but none passed the 95% significance level. An increasing trend for groundwater drought was only observed in the NE region, whereas decreasing trends were observed in the other regions. Specially, this trend in the NW region passed the 95% significance level, which is consistent with the findings in Section 4.2.1. The values of the negative trends for meteorological drought are in the range of −0.22 in the NE region and −1.40 in the NW region, while those for groundwater drought are in the range of −5.68 in the NW and 2.33 in the NE.
The southern region experienced the most frequent moderate meteorological droughts (18 episodes) but low mean drought duration and low mean drought magnitude (3.4 and 2.6 months, respectively). Similarly, this region showed the most frequent moderate groundwater droughts (four episodes) with long mean drought durations (9.5 months) but low mean magnitude (5.7 months). In contrast, the NW region exhibited the lowest frequent moderate meteorological droughts (six episodes) but the longest mean drought duration and mean drought magnitude (10.2 and 6.9 months, respectively). In addition, this region showed a low frequency of groundwater drought with the longest mean drought durations (9.7 months) and mean magnitude (10.7 months). The frequencies of moderate meteorological and groundwater drought for the NE region were the same as those for the central region, while the mean drought duration and mean drought magnitude for the NE region are more than twice those of the central region. As for severe meteorological drought, the central region showed the most frequent meteorological droughts (10 events) which is twice that of the southern region (five events), whereas the mean meteorological drought duration and mean drought magnitude are similar to those of the southern region. In addition, the northeast region presents the lowest frequent meteorological droughts (one event) but the longest drought duration and mean drought magnitude (14 and 15.7 months, respectively).
Overall, Jiangsu Province experienced more frequent meteorological drought than groundwater drought for both moderate and severe droughts during the study period, while the mean duration and mean magnitude of groundwater drought were longer than those of the corresponding regional meteorological drought. In addition, there was a strong relationship between mean drought duration and magnitude for moderate drought, whereby longer mean durations of meteorological drought and groundwater drought were associated with droughts of greater mean magnitude. However, there is no such regular relationship for severe drought in the study area. As for severe meteorological drought, the mean duration in the central region (5.8 months) was longer than that in the southern region (5.6 months), while the mean magnitude in the central region (5.1 months) was lower than that in the southern region (5.7 months).

5. Discussion

In this study, the temporal and spatial characteristics of groundwater droughts were analyzed based on SGI in Jiangsu Province over the period of 1989 to 2012. We saw that there can be distinct differences in the characteristics of groundwater drought in terms of the number of drought events, the mean duration, and the mean magnitude. The central and southern regions experienced more frequent but shorter moderate drought durations than the NW and NE regions; as for mean severe drought durations, the southern region showed more frequent but shorter durations than the rest of the study area. Similarly, the southern region exhibited lower mean magnitude for moderate drought than the NW and NE regions; as for mean severe drought magnitude, the southern region showed lower mean magnitude than the rest of the study area. In summary, the results indicate that the southern region faced more frequent but less intense groundwater drought, while the NE region faced less frequent but more intense groundwater drought.
Furthermore, the relationship between regional groundwater drought and meteorological drought is analyzed based on regional average SGI and SPI. The results are consistent with conceptual dynamics of drought propagation, i.e., attenuation, lag and lengthening [29]. Attenuation is smoothing of the maximum negative anomaly, lag describes the delay in the onset of the drought signal as it passes through the hydrological cycle, and lengthening extends the period of drought. There is evidence of a general attenuation of the regional mean SGI in four regions compared with regional mean SPI (Figure 11). Lagging of groundwater drought behind meteorological drought is not so easy to quantify, which is sensitive to the accumulation period of SPI that most closely correlated with SGI. For example, the accumulation periods required to achieve maximum correlation between the SPI and SGI time series are five months required for the NW region, six months for the NE region, two months for the central region, and two months for the southern region, respectively. Table 3 summarizes the drought characteristics of four regions, and it demonstrates that groundwater droughts are lengthening in NE and south region.
An example of propagation from meteorological drought based on SPI-3 to groundwater drought based on SGI in the period of October 2010 to June 2011 is shown in Figure 12. The figure uses a color scale associated with the original SPI classification proposed by McKee et al. [18]. As can be seen in Figure 12a, the 2011 meteorological drought started in December 2010 and the northern part of the study area reached a peak in December and January before an easing of the drought until June 2011, while the southern region experienced severe drought from January 2011 to May 2011 before a rather quick recovery in June. It can be seen in Figure 12b that several differences can be identified in the spatial evolution of groundwater drought. In general, most of the province experienced mild groundwater drought from October 2010 to June 2011. The severe meteorological drought from December 2010 to January 2011 brought about scattered moderate groundwater drought in the northern part of the study area, while the severe meteorological droughts in the southern region from January to April 2011 turned into regional moderate groundwater drought in March–May. This illustrates well the different responses of groundwater to precipitation in different regions during a very dry period.
The SGI is a normalized drought index for groundwater levels, building on an SPI-like method. The weaknesses inherent in the SPI approach were obviated when developing the SGI by using a non-parametric approach (the normal scores transform) to normalization of the groundwater level time series [12]. For example, SPI values are sensitive to the form of the probability distribution that is fitted to the observed data [5], and the length of observation record will impact the SPI due to differences in the shape and scale parameters of the fitted gamma (or other) distribution [30]. Because the non-parametric normal scores transform is based on the rank of the groundwater level time series when estimating SGI rather than fitting gamma or another distribution to groundwater level time series, SGI is more robust than SPI for different length of records. However, the values of SGI may still vary with the length of the groundwater level time series, so the longer length of time series are preferred.
It is also noted that the number of precipitation stations in a region used for calculation of SPI has an effect on the detected characteristics. For instance, in the central region 15 moderate meteorological drought events were detected by SPI calculated from Dongtai station, while it represented 10 events by SPI of Gaoyou station. The moderate drought frequency detected by average SPI of the above two stations was 10 events, 33.3% less than that detected by a single station (Dongtai). In contrast, the moderate drought frequency detected from all stations in the NE and southern regions was more than that index from only one station. The central region exhibited 9 and 10 severe meteorological drought events by SPI from Dongtai and Gaoyou station, respectively, and less than that detected by the average of two stations. The severe drought frequency detected from all the four stations in the NE and southern regions was less than that index from only one station. The variations of drought duration and magnitude were similar to that of the frequency in these three regions.
The present study has analyzed the groundwater drought characteristics, building on the standardized index proposed by Bloomfield and Marchant. Unlike those who investigated the cross-correlation between groundwater drought and meteorological drought at 14 wells in unconfined consolidated aquifers in the United Kingdom, the present study has investigated the character of groundwater drought in unconsolidated aquifers in Jiangsu Province and the response of groundwater drought to meteorological drought at a regional scale. Understanding the differences in groundwater drought response to meteorological drought among different regions is extremely useful for planning and designing applications of drought monitoring and prediction, as droughts usually occur at the regional scale.

6. Conclusions

This study applied standardized indices to precipitation and groundwater level observed in unconsolidated aquifers in Jiangsu Province, China during the period from 1989 to 2012. Groundwater drought characteristics were identified at local observation wells in order to detect regional differences and the response to meteorological drought at the regional scale. The findings are listed as follows:
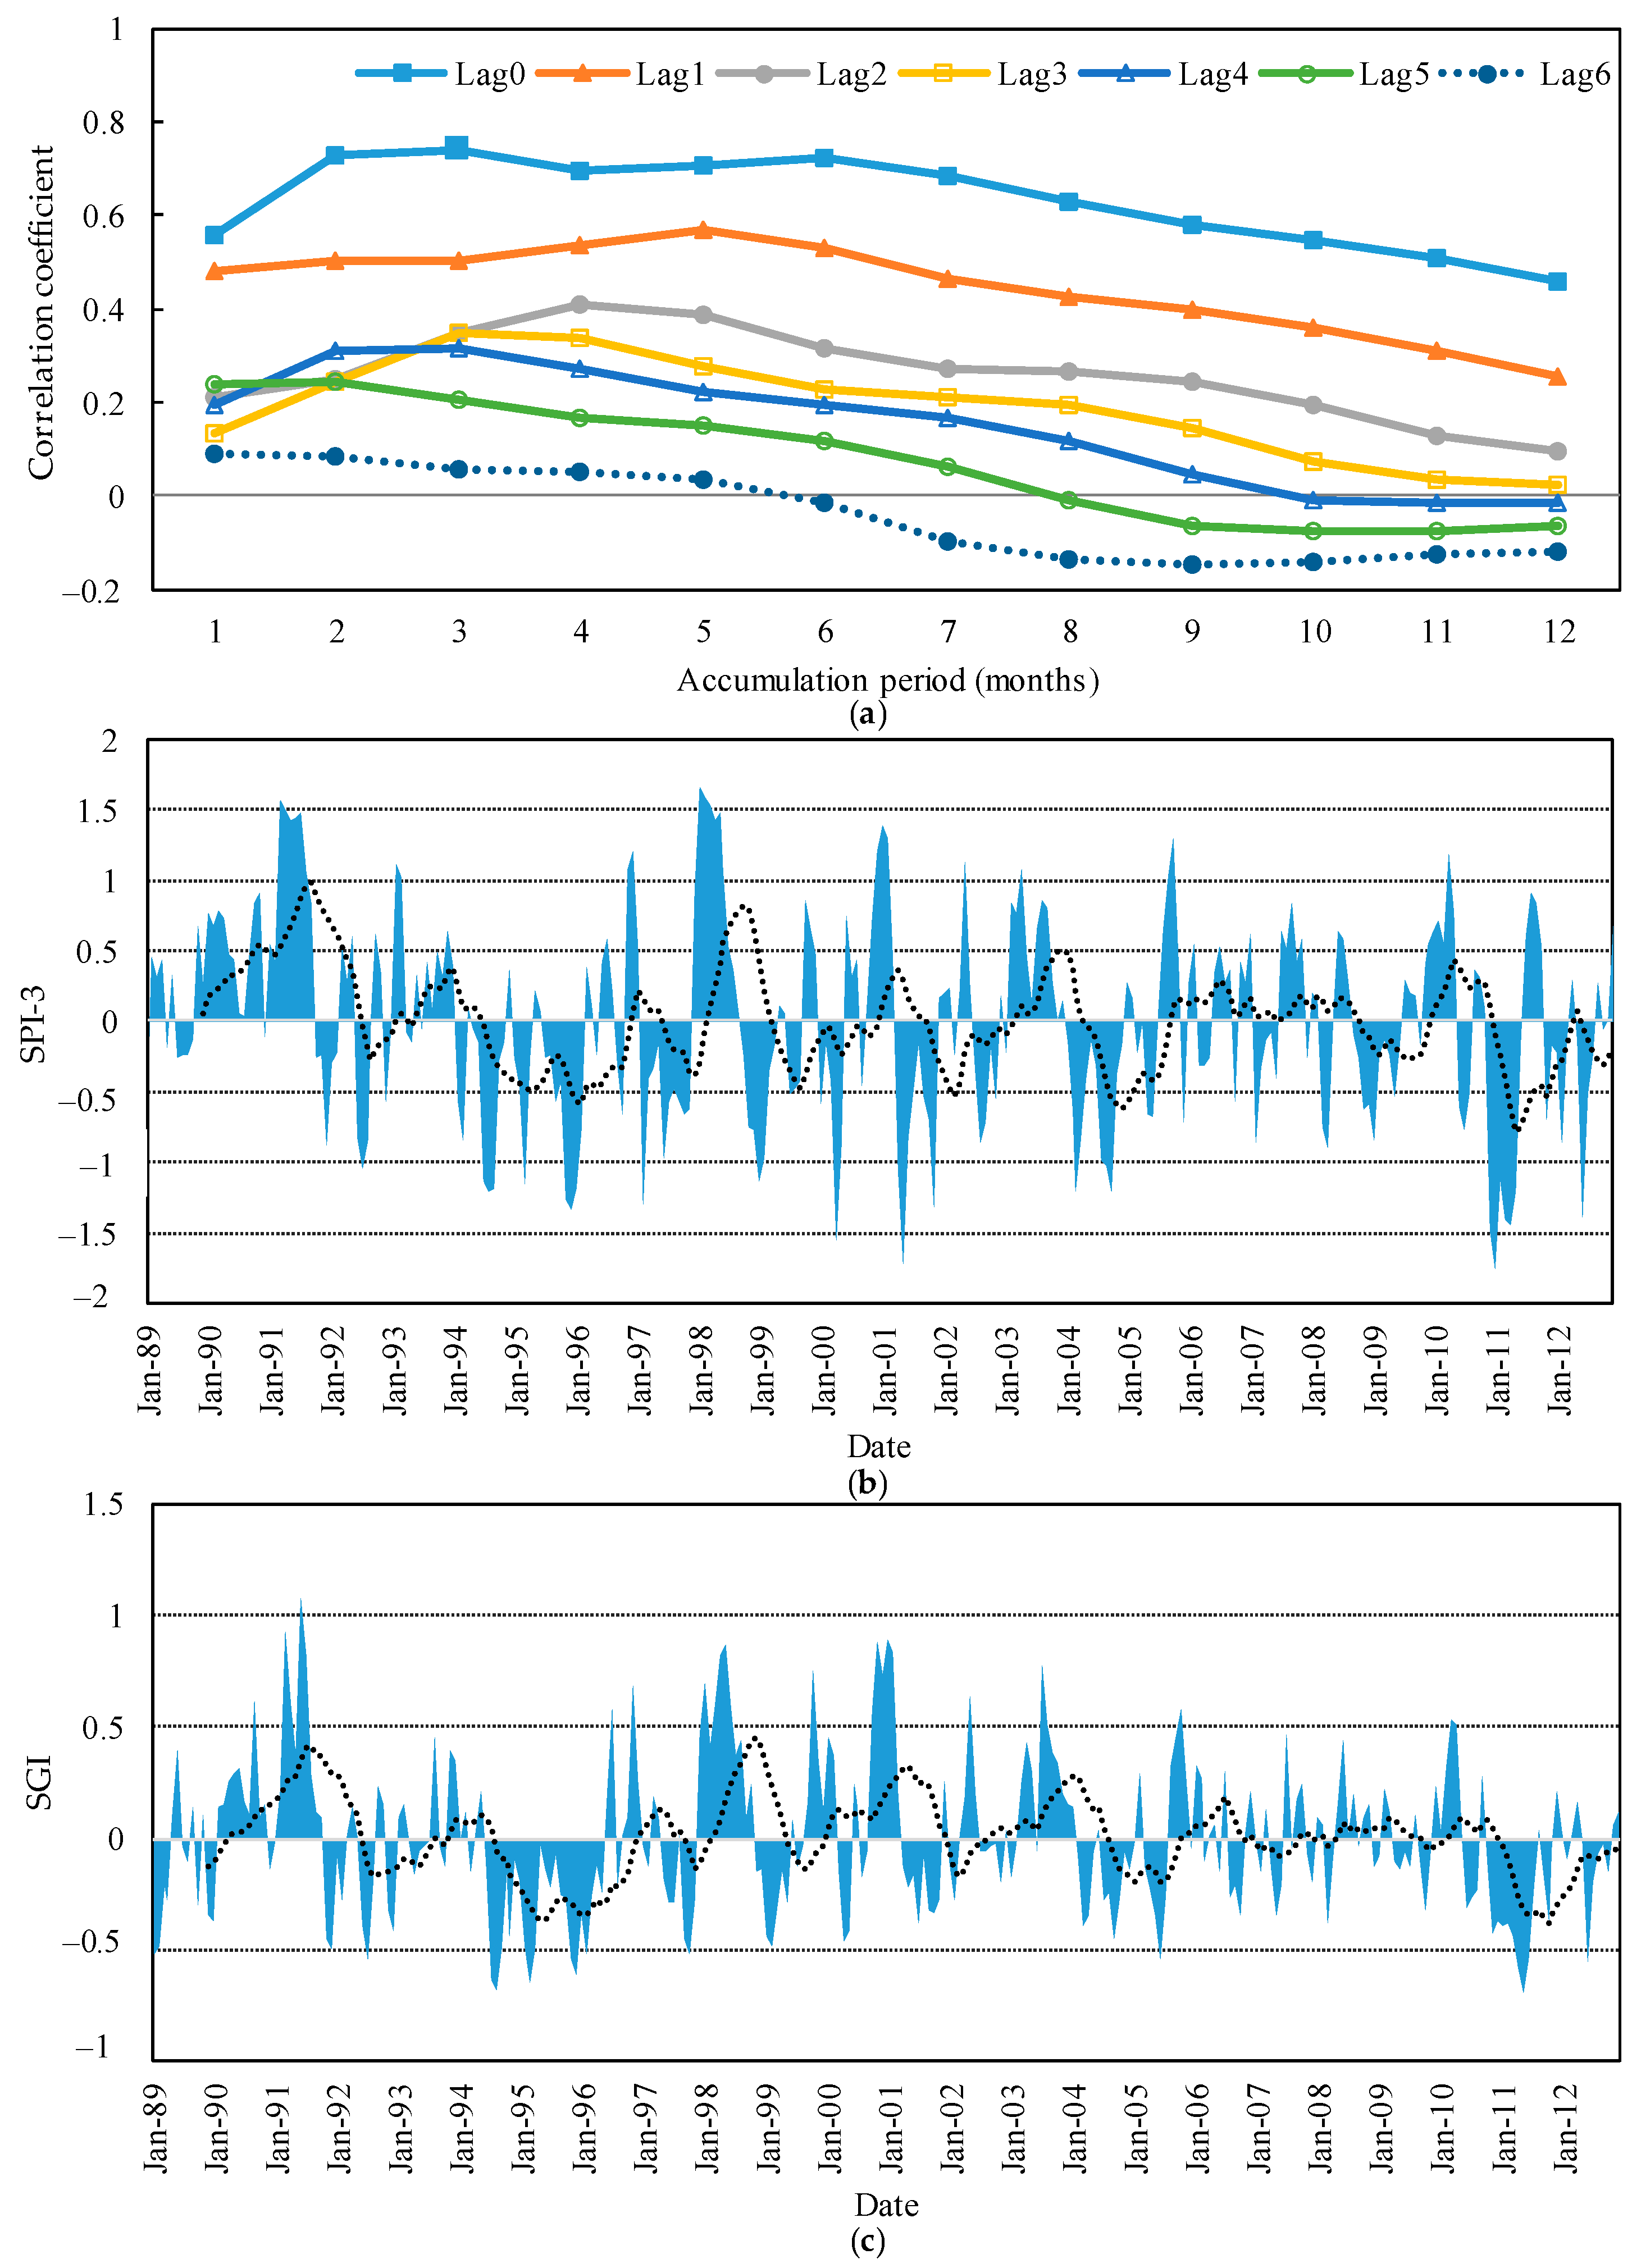
  • Although the mean SPI and SGI for the entire region showed good correlation, there were clear discrepancies between the SGI and SPI. This reveals a mitigation process from meteorological droughts to groundwater droughts; therefore, there is a need to consider different variables in order to completely characterize droughts.
  • Groundwater drought showed different regional characteristics in this study area. Statistically significant negative trends of SGI index towards dryer conditions were mainly found in the NW and central regions, whereas positive trends of SGI towards wetter conditions were mainly found in the NE region; the southern region showed a nonsignificant dryer trend.
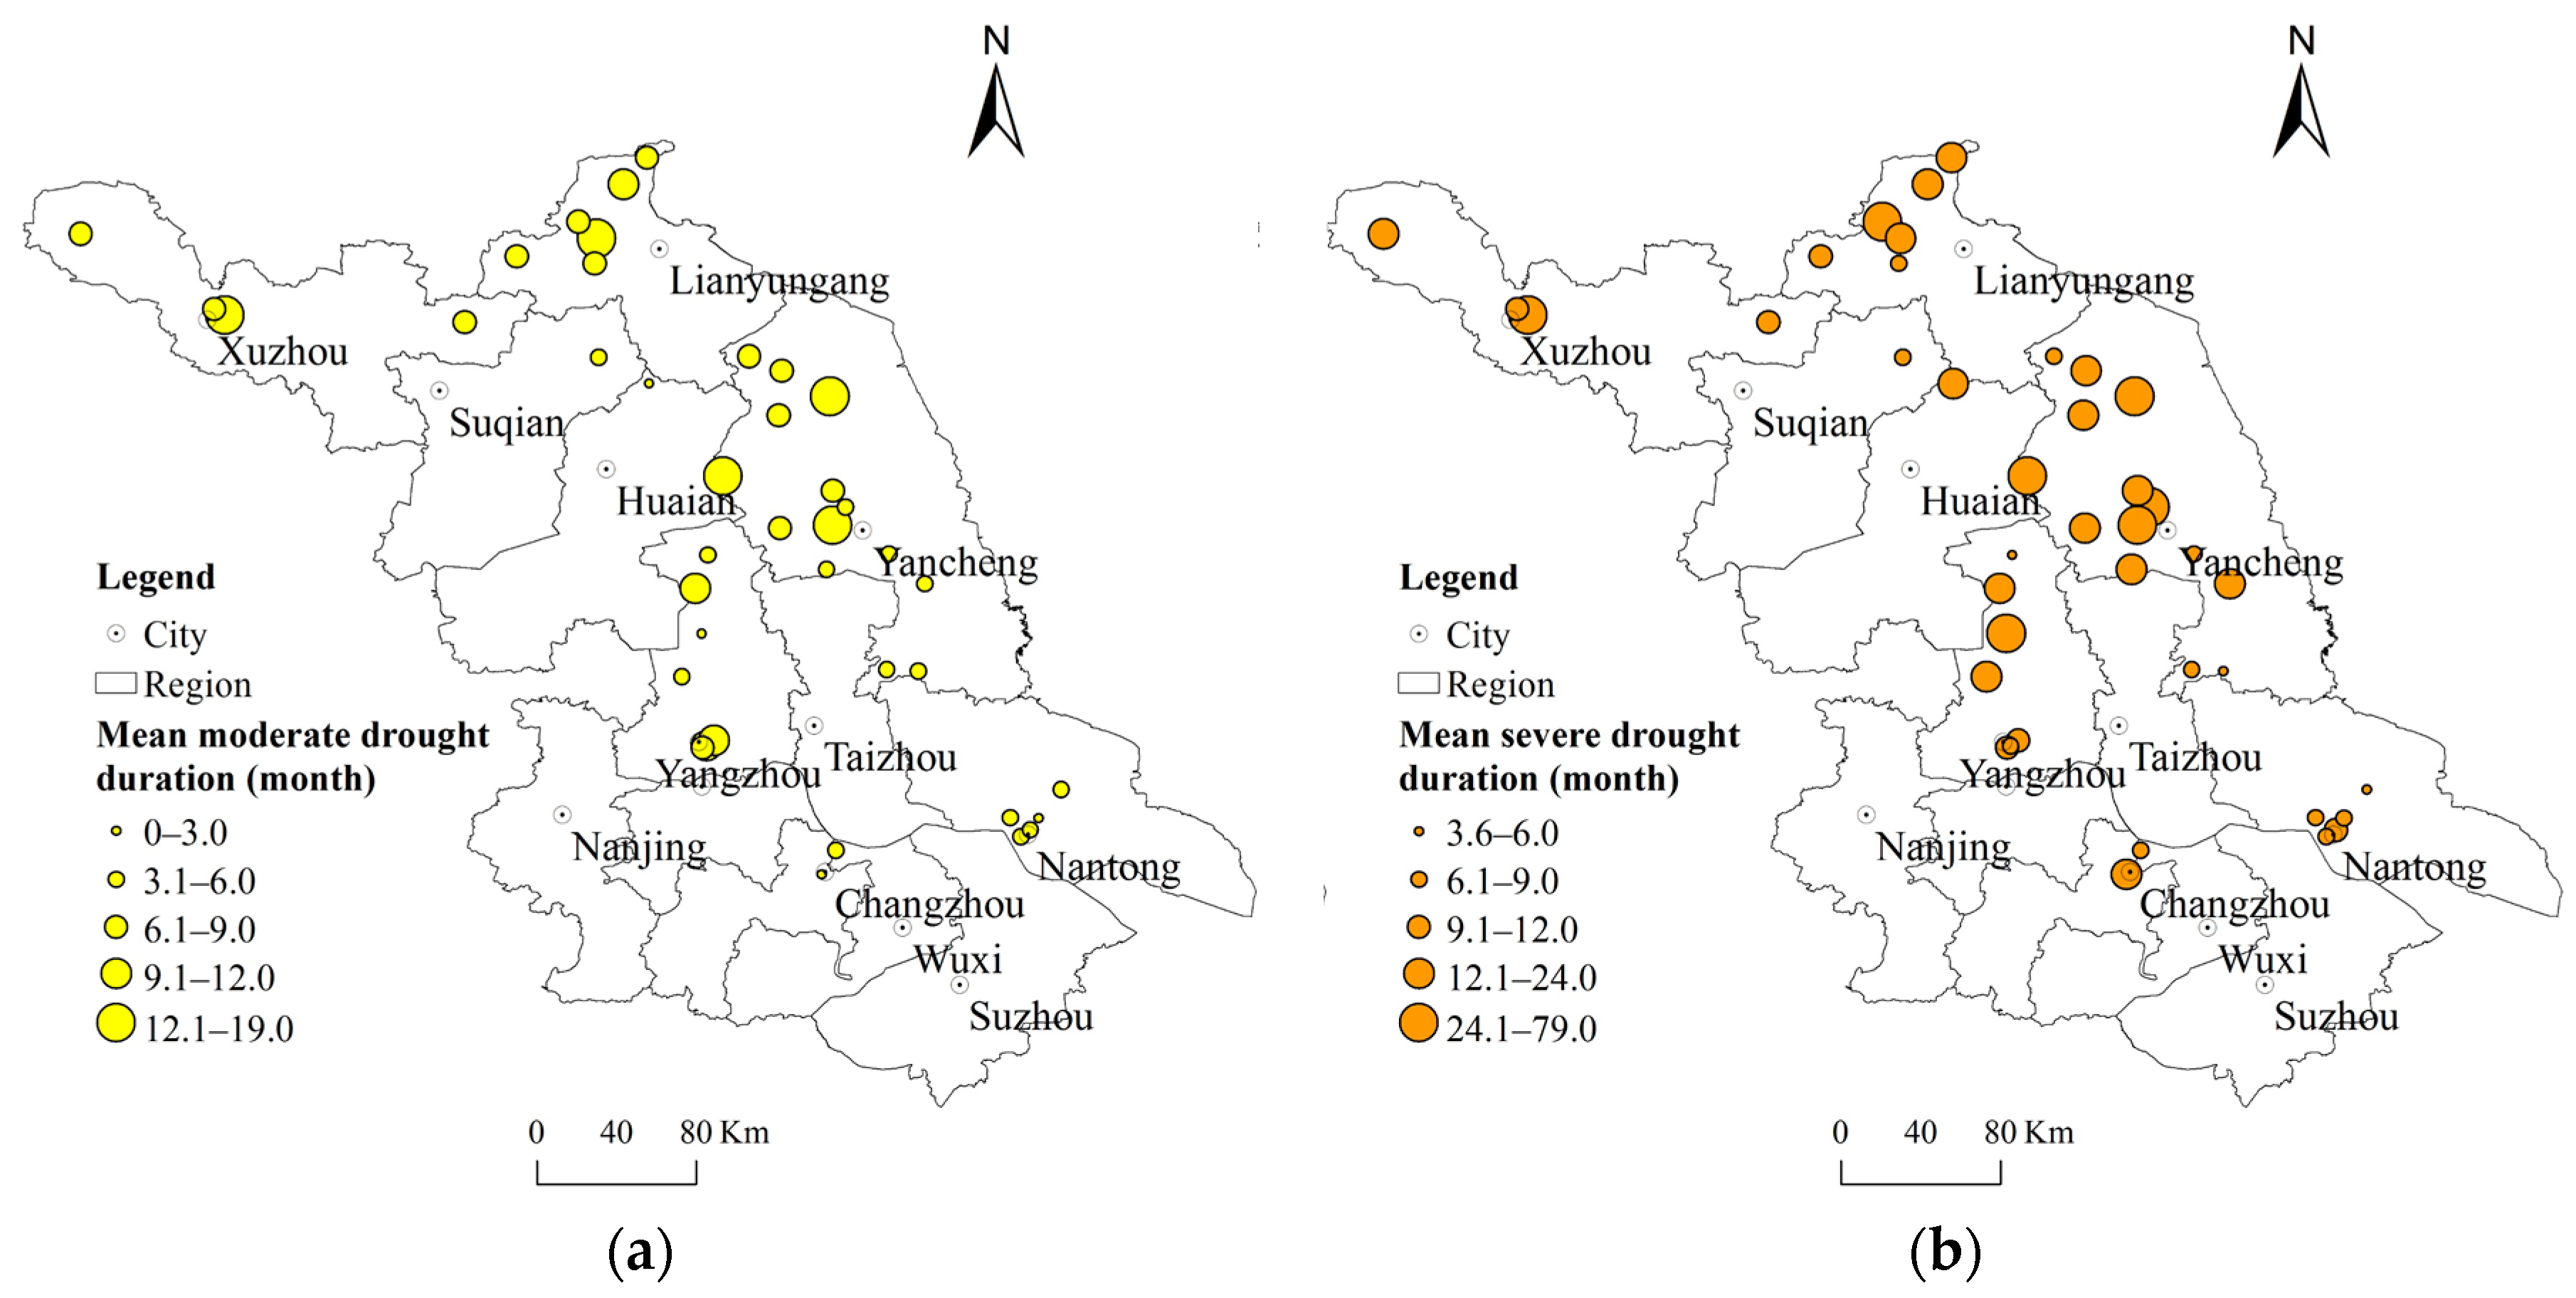
  • The frequency of severe drought had a similar distribution to that of moderate drought, with the southern and central regions showing higher frequency than the NW and NE regions. The spatial distributions of mean moderate and severe drought durations showed contrasting patterns to those of mean moderate and severe drought frequencies. The central and southern regions experienced shorter mean moderate drought durations than the NW and NE regions; as for mean severe drought, the southern region showed shorter duration than the rest of the study area. In addition, the spatial distributions of mean moderate and severe drought magnitude were similar to those of mean moderate and severe drought duration. The southern region exhibited lower mean magnitude for moderate drought than the NW and NE regions; as for mean severe drought magnitude, the southern region showed a lower mean magnitude than the rest of the study area.
  • Different regions showed differences in terms of the response of groundwater drought to meteorological drought. Specifically, the NE and NW regions showed weaker correlations between groundwater drought and meteorological drought compared with the southern and central regions.
  • Jiangsu Province experienced more frequent meteorological drought than groundwater drought for both moderate and severe droughts during the study period, while the mean duration and mean magnitude of groundwater drought were longer than those of corresponding regional meteorological drought. In addition, there was a strong relationship between mean drought duration and magnitude for moderate drought, whereby longer episodes of meteorological and groundwater drought were associated with droughts of greater magnitude. However, there was no such regular relationship for severe drought in the study area.

Supplementary Materials

The following are available online at www.mdpi.com/2073-4441/8/11/480/s1, Table S1: Summary information of meteorological stations, Table S2: Summary information of groundwater level observation wells.

Acknowledgments

The authors gratefully acknowledge the financial support by the National Natural Science Foundation of China (41301017). This work was co-supported by the Geology and mineral resources survey and evaluation of China (1212011220175), and it was also supported by the Special Project for Public Scientific Research of the Ministry of Land and Resources of China (201411096). The authors also thank the anonymous reviewers and editors for their constructive comments that greatly improve the quality of the manuscript.

Author Contributions

This research was carried out in collaboration among all authors. Bo Liu and Xiangqian Zhou had the original idea for the study. Wei Li conducted the research methods. Chengpeng Lu and Longcang Shu provided many improvements on the structure of the manuscript. All authors contributed their comments on the manuscript at all stages.

Conflicts of Interest

The authors declare no conflict of interest.

References

  1. Wilhite, D.A. Drought as a Natural Hazard: Concepts and Definitions. In Drought: A Global Assessmen; Donald, A.W., Ed.; Routledge: London, UK, 2000; Volume 1, pp. 3–18. [Google Scholar]
  2. Wilhite, D.A.; Glantz, M.H. Understanding: The Drought Phenomenon: The Role of Definitions. Water Int. 1985, 10, 111–120. [Google Scholar] [CrossRef]
  3. Van Lanen, H.A.J.; Peters, E. Definition, Effects and Assessment of Groundwater Droughts. In Drought and Drought Mitigation in Europe; Springer: Dordrecht, The Netherlands, 2000; Volume 14, pp. 49–61. [Google Scholar]
  4. Hisdal, H.; Clausen, B.; Gustard, A.; Peters, E.; Tallaksen, L.M. Event Definitions and Indices. In Hydrological Drought—Processes and Estimation Methods for Streamflow and Groundwater; Tallaksen, L.M., van Lanen, H.A.J., Eds.; Elsevier Science B.V.: Amsterdam, The Netherlands, 2004; Volume 48, pp. 139–198. [Google Scholar]
  5. Mishra, A.K.; Singh, V.P. A Review of Drought Concepts. J. Hydrol. 2010, 391, 202–216. [Google Scholar] [CrossRef]
  6. Eltahir, E.A.B.; Yeh, P.J.F. On the Asymmetric Response of Aquifer Water Level to Floods and Droughts in Illinois. Water Resour. Res. 1999, 35, 1199–1217. [Google Scholar] [CrossRef]
  7. Peters, E.; Torfs, P.J.J.F.; van Lanen, H.A.J.; Bier, G. Propagation of Drought through Groundwater—A New Approach Using Linear Reservoir Theory. Hydrol. Process. 2003, 17, 3023–3040. [Google Scholar] [CrossRef]
  8. Peters, E.; Bier, G.; van Lanen, H.A.J.; Torfs, P.J.J.F. Propagation and Spatial Distribution of Drought in a Groundwater Catchment. J. Hydrol. 2006, 321, 257–275. [Google Scholar] [CrossRef]
  9. Tallaksen, L.M.; Hisdal, H.; Lanen, H.A.J. Van. Space–time Modelling of Catchment Scale Drought Characteristics. J. Hydrol. 2009, 375, 363–372. [Google Scholar] [CrossRef]
  10. Bhuiyan, C.; Singh, R.P.; Kogan, F.N. Monitoring Drought Dynamics in the Aravalli Region (India) Using Different Indices Based on Ground and Remote Sensing Data. Int. J. Appl. Earth Obs. Geoinf. 2006, 8, 289–302. [Google Scholar] [CrossRef]
  11. Mendicino, G.; Senatore, A.; Versace, P. A Groundwater Resource Index (GRI) for Drought Monitoring and Forecasting in a Mediterranean Climate. J. Hydrol. 2008, 357, 282–302. [Google Scholar] [CrossRef]
  12. Bloomfield, J.P.; Marchant, B.P. Analysis of Groundwater Drought Building on the Standardised Precipitation Index Approach. Hydrol. Earth Syst. Sci. 2013, 17, 4769–4787. [Google Scholar] [CrossRef] [Green Version]
  13. Li, B.; Rodell, M. Evaluation of a Model-Based Groundwater Drought Indicator in the Conterminous U.S. J. Hydrol. 2015, 526, 78–88. [Google Scholar] [CrossRef]
  14. Wilhite, D.A.; Hayes, M.J.; Svoboda, M.D. Drought Monitoring and Assessment: Status and Trends in the United States. In Advances in Natural and Technological Hazards; Vogt, J.V., Somma, F., Eds.; Springer: Dordrecht, The Netherlands, 2000; pp. 149–160. [Google Scholar]
  15. Bao, Y.X.; Meng, C.L.; Shen, S.H.; Qiu, X.F.; Gao, P.; Liu, C. Temporal and Spatial Patterns of Droughts for Recent 50 Years in Jiangsu Based on Meteorological Drought Composite Index. Acta Geogr. Sin. 2011, 66, 599–608. [Google Scholar]
  16. Zhang, P.B.; Jiang, Y.S.; Liu, L.; Li, Y.; Hu, S.S. Comparative Analysis of Sustained Drought Processes in Jiangsu during 1971–2011. Plateau Meteorol. 2015, 34, 444–454. [Google Scholar]
  17. Shi, X.; Jiang, F.; Feng, Z.; Yao, B.; Xu, H.; Wu, J. Characterization of the Regional Groundwater Quality Evolution in the North Plain of Jiangsu Province, China. Environ. Earth Sci. 2015, 74, 5587–5604. [Google Scholar] [CrossRef]
  18. McKee, T.B.; Doesken, N.J.; Kleist, J. The Relationship of Drought Frequency and Duration to Time Scales. In Proceedings of the 8th Conference on Applied Climatology; American Meteorological Society: Boston, MA, USA, 1993; pp. 179–184. [Google Scholar]
  19. Hayes, M.; Svoboda, M.; Wall, N.; Widhalm, M. The Lincoln Declaration on Drought Indices: Universal Meteorological Drought Index Recommended. Bull. Am. Meteorol. Soc. 2011, 92, 485–488. [Google Scholar] [CrossRef]
  20. Vicente-Serrano, S.M. Differences in Spatial Patterns of Drought on Different Time Scales: An Analysis of the Iberian Peninsula. Water Resour. Manag. 2006, 20, 37–60. [Google Scholar] [CrossRef]
  21. Guttman, N.B. Accepting the Standardized Precipitation Index: A Calculation Algorithm1. J. Am. Water Resour. Assoc. 1999, 35, 311–322. [Google Scholar] [CrossRef]
  22. Sheffield, J.; Goteti, G.; Wen, F.; Wood, E.F. A Simulated Soil Moisture Based Drought Analysis for the United States. J. Geophys. Res. D Atmos. 2004, 109, 1–19. [Google Scholar] [CrossRef]
  23. Vidal, J.-P.; Martin, E.; Franchistéguy, L.; Habets, F.; Soubeyroux, J.-M.; Blanchard, M.; Baillon, M. Multilevel and Multiscale Drought Reanalysis over France with the Safran-Isba-Modcou Hydrometeorological Suite. Hydrol. Earth Syst. Sci. Discuss. 2009, 6, 6455–6501. [Google Scholar] [CrossRef]
  24. Shukla, S.; Wood, A.W. Use of a Standardized Runoff Index for Characterizing Hydrologic Drought. Geophys. Res. Lett. 2008, 35, 1–7. [Google Scholar] [CrossRef]
  25. Vicente-Serrano, S.M.; López-Moreno, J.I.; Beguería, S.; Lorenzo-Lacruz, J.; Azorin-Molina, C.; Morán-Tejeda, E. Accurate Computation of a Streamflow Drought Index. J. Hydrol. Eng. 2012, 17, 318–332. [Google Scholar] [CrossRef] [Green Version]
  26. Wang, W.; Chen, Y.; Becker, S.; Liu, B. Variance Correction Prewhitening Method for Trend Detection in Autocorrelated Data. J. Hydrol. Eng. 2009, 20, 1–10. [Google Scholar] [CrossRef]
  27. Hamed, K.H. Enhancing the Effectiveness of Prewhitening in Trend Analysis of Hydrologic Data. J. Hydrol. 2009, 368, 143–155. [Google Scholar] [CrossRef]
  28. Helsel, D.R.; Hirsch, R.M. Statistical Methods in Water Resources; Elsevier: Amsterdam, The Netherland, 1992; p. 522. [Google Scholar]
  29. Van Loon, A.F. Hydrological drought explained. Wiley Interdiscip. Rev. Water 2015, 2, 359–392. [Google Scholar] [CrossRef]
  30. Wu, H.; Hayes, M.J.; Wilhite, D.A.; Svoboda, M.D. The effect of the length of record on the standardized precipitation index calculation. Int. J. Climatol. 2005, 25, 505–520. [Google Scholar] [CrossRef]
Figure 1. The location of the Jiangsu Province and groundwater observation wells and meteorological stations.
Water 08 00480 g001
Figure 2. The location of meteorological stations and the spatial distribution of mean annual precipitation from 1989 to 2012.
Water 08 00480 g002
Figure 3. The spatial distribution of annual mean groundwater depth from 1989 to 2012.
Water 08 00480 g003
Figure 4. Examples of (a) histogram of groundwater level and standardized normal distribution for groundwater well #0029 in June from 1989 to 2012; (b) corresponding histogram of normalized values using gamma distribution and standardized normal distribution for groundwater well #0029 in June from 1989 to 2012; (c) corresponding histogram of normalized values using normal scores transform and standardized normal distribution for groundwater level well #0029 in June from 1989 to 2012; and (d) normal Q–Q plot of SGI using normal scores transform for #0029 in June from 1989 to 2012. Noted that Std. Dev. stands for standard deviation.
Water 08 00480 g004
Figure 5. (a) Correlation between SPI for precipitation accumulation periods q = 1 to 12 months and SGI for lags between SPI and SGI of 0 to 6 months from January 1989 to December 2012; (b) mean SPI-3 time series for meteorological stations from January 1989 to December 2012 and (c) mean SGI time series for groundwater observation wells from January 1989 to December 2012.
Water 08 00480 g005
Figure 6. Spatial distributions of trends in the SGI index at groundwater observation wells in Jiangsu Province for the period 1989–2012.Tthe blue filled triangle indicates a significant increasing trend, while the inverted red filled triangle indicates a significant decreasing trend.
Water 08 00480 g006
Figure 7. Number of (a) moderate groundwater drought events and (b) severe groundwater drought events.
Water 08 00480 g007
Figure 8. Mean duration of (a) moderate groundwater drought and (b) severe groundwater drought.
Water 08 00480 g008
Figure 9. Mean magnitude of (a) moderate groundwater drought and (b) severe groundwater drought.
Water 08 00480 g009
Figure 10. The cross-correlation between mean SGI and SPI from January 1989 to December 2012 for SPI accumulation periods of q = 1 to 12 months for each region.
Water 08 00480 g010
Figure 11. The mean SPI q max time series from January 1989 to December 2012 for (a) the northwest region; (b) the northeast region; (c) the central region; (d) the southern region; and the mean SGI time series from January 1989 to December 2012 for (e) the northwest region; (f) the northeast region; (g) the central region; and (k) the southern region; the dark line shows the five-year moving average.
Water 08 00480 g011
Figure 12. Evolution of meteorological drought based on SPI-3 (a) and groundwater drought based on SGI (b) from October 2010 to June 2011.Color keys match classifications defined in Table 2.
Water 08 00480 g012
Table 1. Summary information for each region.
RegionMean Annual Precipitation (mm)Average Elevation (m)Mean Annual Groundwater Depth (m)Number of Precipitation StationsNumber of Groundwater Observation Wells
Northwest85030–502–314
Northeast9503–201–2315
Central10502–100.4–1.5314
South11003–101–4.547
Table 2. Wet and drought period classification according to SPI values.
Index ValueClass
SPI 2 Extremely wet
1.5 SPI < 2 Severely wet
1 SPI < 1.5 Moderately wet
1 < SPI < 1 Near normal
1.5 < SPI 1 Moderate drought
2 < SPI 1.5 Severe drought
SPI 2 Extreme drought
Table 3. Summary of drought characteristics for moderate and severe drought (values in parentheses) for each region.
RegionDrought IndexVCPW MKNumber of Drought EventsMean Drought DurationMean Drought Magnitude
NorthwestSPI-5−1.406(6)10.2 (7.2)6.9 (8.1)
SGI-1−5.68 *3(1)9.7 (39)10.7 (28.8)
NortheastSPI-6−0.2210(1)7.7 (14)5.5 (15.7)
SGI-12.33 *0(0)0 (0)0 (0)
CentralSPI-2−1.3510(10)3.3 (5.8)2.4 (5.1)
SGI-1−1.000(0)0 (0)0 (0)
SouthSPI-2−0.9818(5)3.4 (5.6)2.6 (5.7)
SGI-1−0.874(0)9.5 (0)5.7 (0)
Note: * Significant at the 95% confidence level.

