Communication

National Large-Scale Wetland Creation in Agricultural Areas—Potential versus Realized Effects on Nutrient Transports

by
Stefan E. B. Weisner
1,*,
Karin Johannesson
2,
Geraldine Thiere
1,
Henrik Svengren
1,
Per Magnus Ehde
1 and
Karin S. Tonderski
2
1
RLAS/Wetland Research Centre, Halmstad University, 301 18 Halmstad, Sweden
2
IFM Biology, Linköping University, 581 83 Linköping, Sweden
*
Author to whom correspondence should be addressed.
Water 2016, 8(11), 544; https://doi.org/10.3390/w8110544
Submission received: 31 October 2016 / Revised: 11 November 2016 / Accepted: 16 November 2016 / Published: 19 November 2016

Abstract

:
During 2007–2013, the Swedish Board of Agriculture granted support within a national program to about 1000 wetlands, corresponding to a 5300-hectare wetland area, with the dual goal to remove nutrients from water and to improve biodiversity in agricultural landscapes. The aim of the present study was to compare the effects on nutrient transports that are realized within the national program to what could be obtained with the same area of wetlands if location and design of wetlands were optimized. In single, highly nutrient-loaded wetlands, a removal of around 1000 kg nitrogen and 100 kg phosphorus per hectare wetland area and year was estimated from monitoring data. Statistical models were developed to estimate the overall nutrient removal effects of wetlands created within the national program. Depending on model, the effect of the national program as a whole was estimated to between 27 and 38 kg nitrogen and between 2.7 and 4.5 kg phosphorus per hectare created wetland area and year. Comparison of what is achieved in individual wetlands to what was achieved in the national program indicates that nutrient removal effects could be increased substantially in future wetland programs by emphasising location and design of wetlands.

1. Introduction

Management practices to decrease negative impacts of agriculture on water quality involve landscape changes such as buffer strips along streams and creation of wetlands [1,2]. Increasing the wetland surface area is considered as an important component in stream restoration to improve nutrient retention in watersheds [3,4]. Creation of semi-natural wetlands to intercept nutrient transports from agricultural fields and to support biodiversity in agricultural landscapes has been done in Sweden on a national level since the 1990s [5]. Initially, wetland creation in agricultural areas in Sweden focused on increasing denitrification on a catchment level as a cost efficient method to reduce the transport of nitrogen to the Baltic Sea [6,7]. However, the impacts on biodiversity and on phosphorus transports were later added as important benefits obtained through wetland creation in agricultural areas [5,8,9]. There is also an increasing awareness worldwide that wetlands provide a multitude of ecosystem services [10,11,12]. Different national subsidy programs have been used in Sweden to provide incentives to farmers to create wetlands on their land [5,13]. According to the Swedish Board of Agriculture, these programs resulted in approximately 3000 created wetlands between 1996 and 2015, comprising a total wetland area of approximately 9000 hectares (ha). The latest national program for wetland creation was within the Swedish Rural Development Program (hereafter denoted to as SRDP), within which financial support was granted during 2007–2013 to creation of about 1000 wetlands with a total area of 5261 ha (data from the Swedish Board of Agriculture).
The aim of this paper is to evaluate the difference between the realized effects on nutrient transports within a national program for wetland creation in agricultural areas (SRDP) and the effects that could potentially be obtained with the same area of wetlands if location and design of wetlands could be optimized (e.g., through improved regulations or stronger support systems). This is done by comparing total nutrient removal levels obtained per created wetland area within the SRDP to what has been achieved in individual wetlands. Continuous automatic water sampling for estimation of nutrient removal has only been performed in a very restricted number of the wetlands created in agricultural field areas in Sweden. Further, estimations of annual phosphorus removal from water monitoring data in individual wetlands receiving water from agricultural fields are problematic due to that phosphorus transports are highly event-driven and concentration covaries strongly with water flow [14,15,16,17,18]. In this paper, we are approaching these problems. Several studies have shown that in runoff from agricultural fields, phosphorus is transported largely as particulate phosphorus [15,16,17,19,20,21,22]. Therefore, sedimentation is likely to be the predominant phosphorus removal process in wetlands receiving high phosphorus loads [23,24,25,26,27]. In addition to estimations of nutrient removal in individual wetlands based on water monitoring data, measurements of particulate phosphorus accumulation on sediments [23] were therefore included here. Total nutrient removal levels obtained per created wetland area within SRPD was estimated by using models based on the removal estimates from individual wetlands.

2. Methods

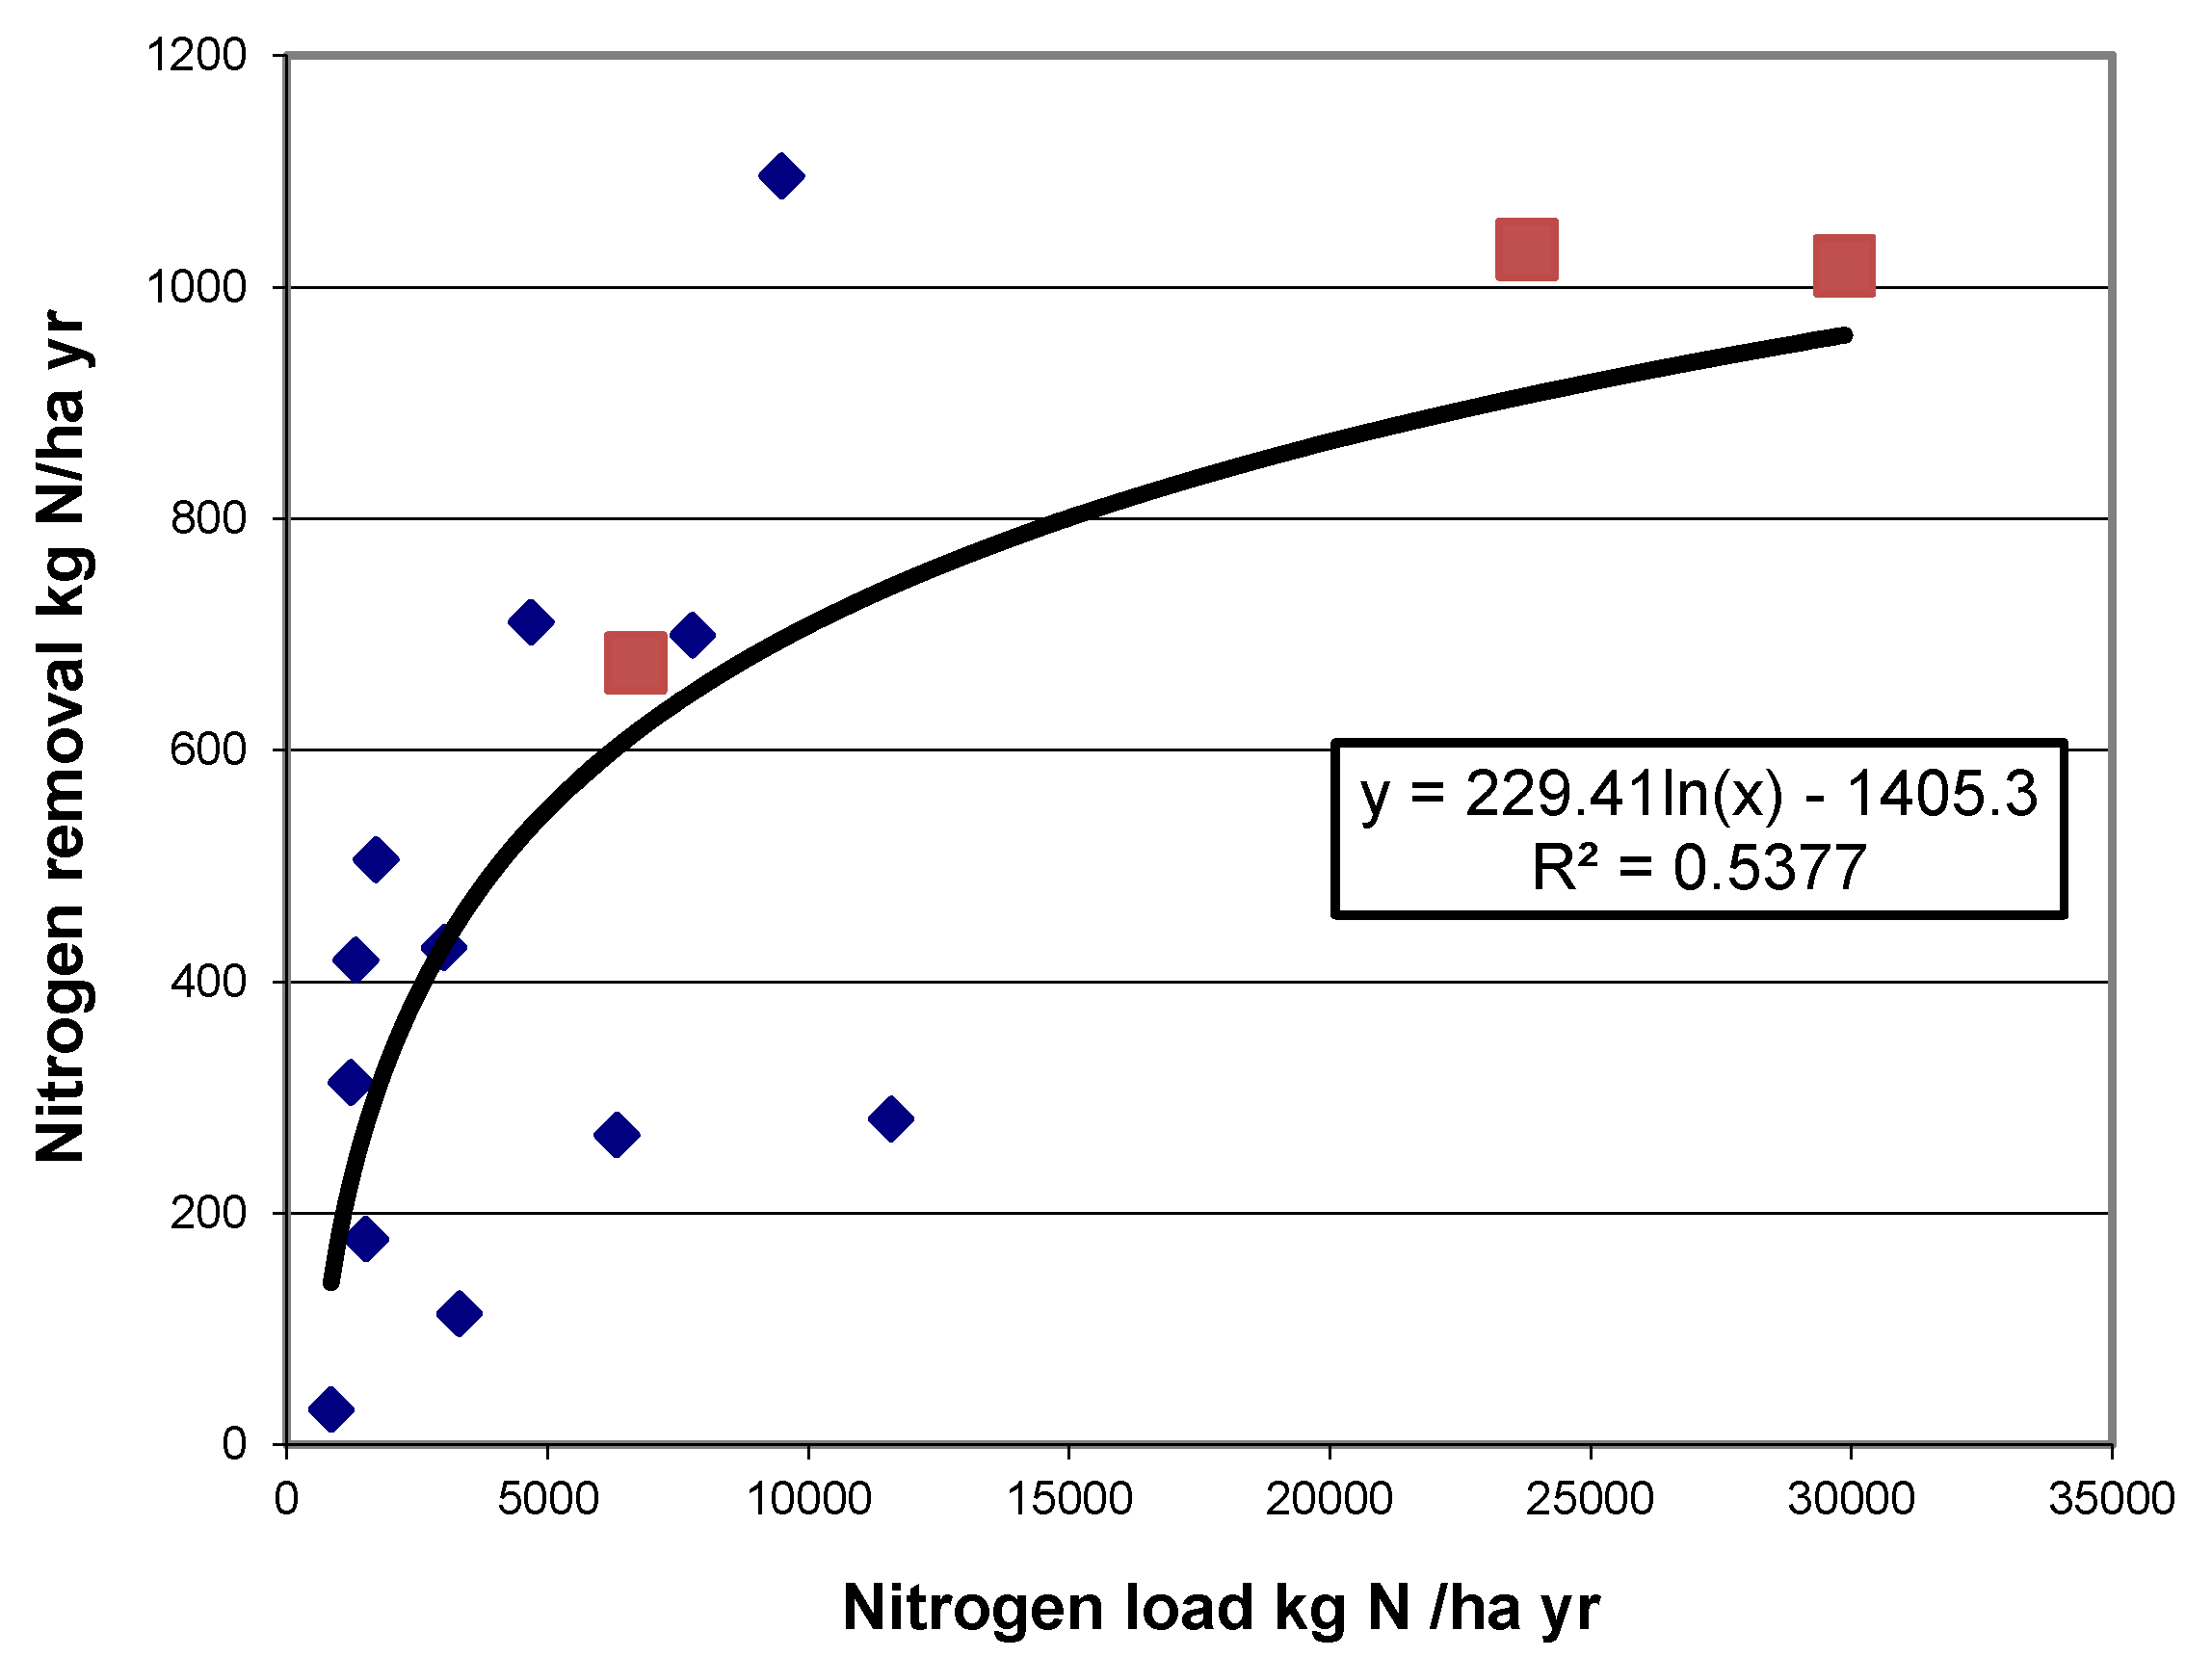
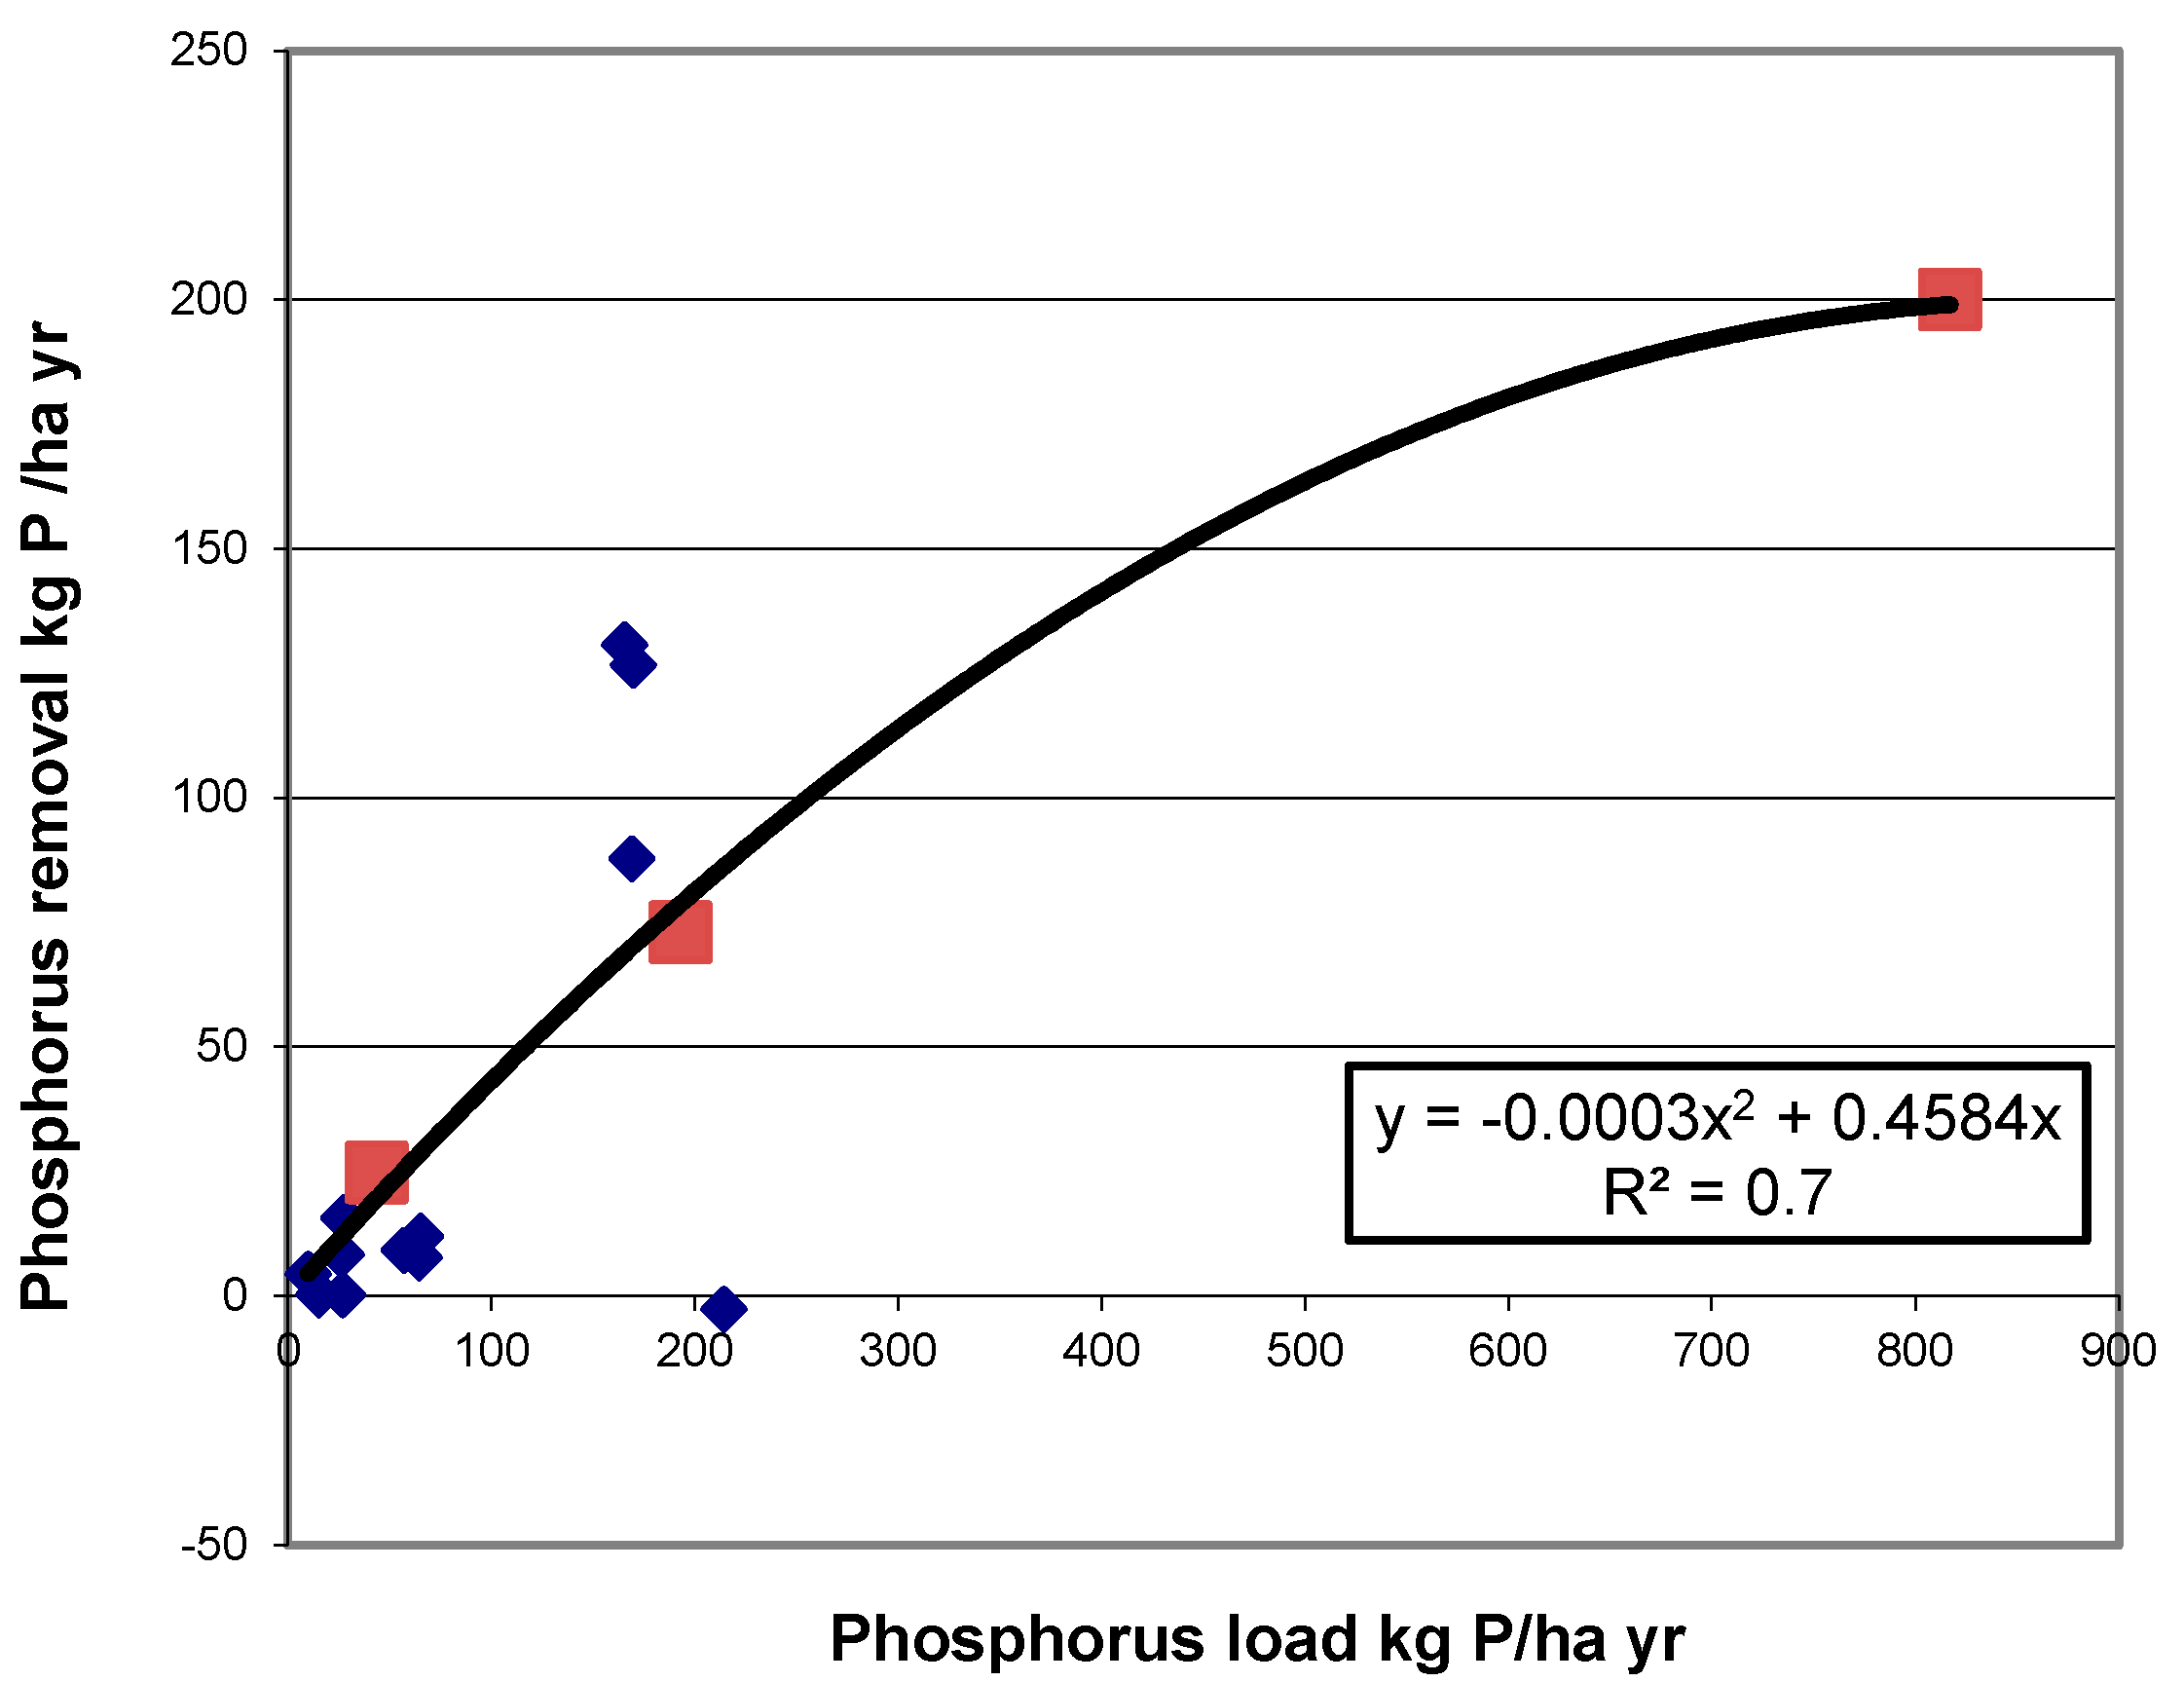
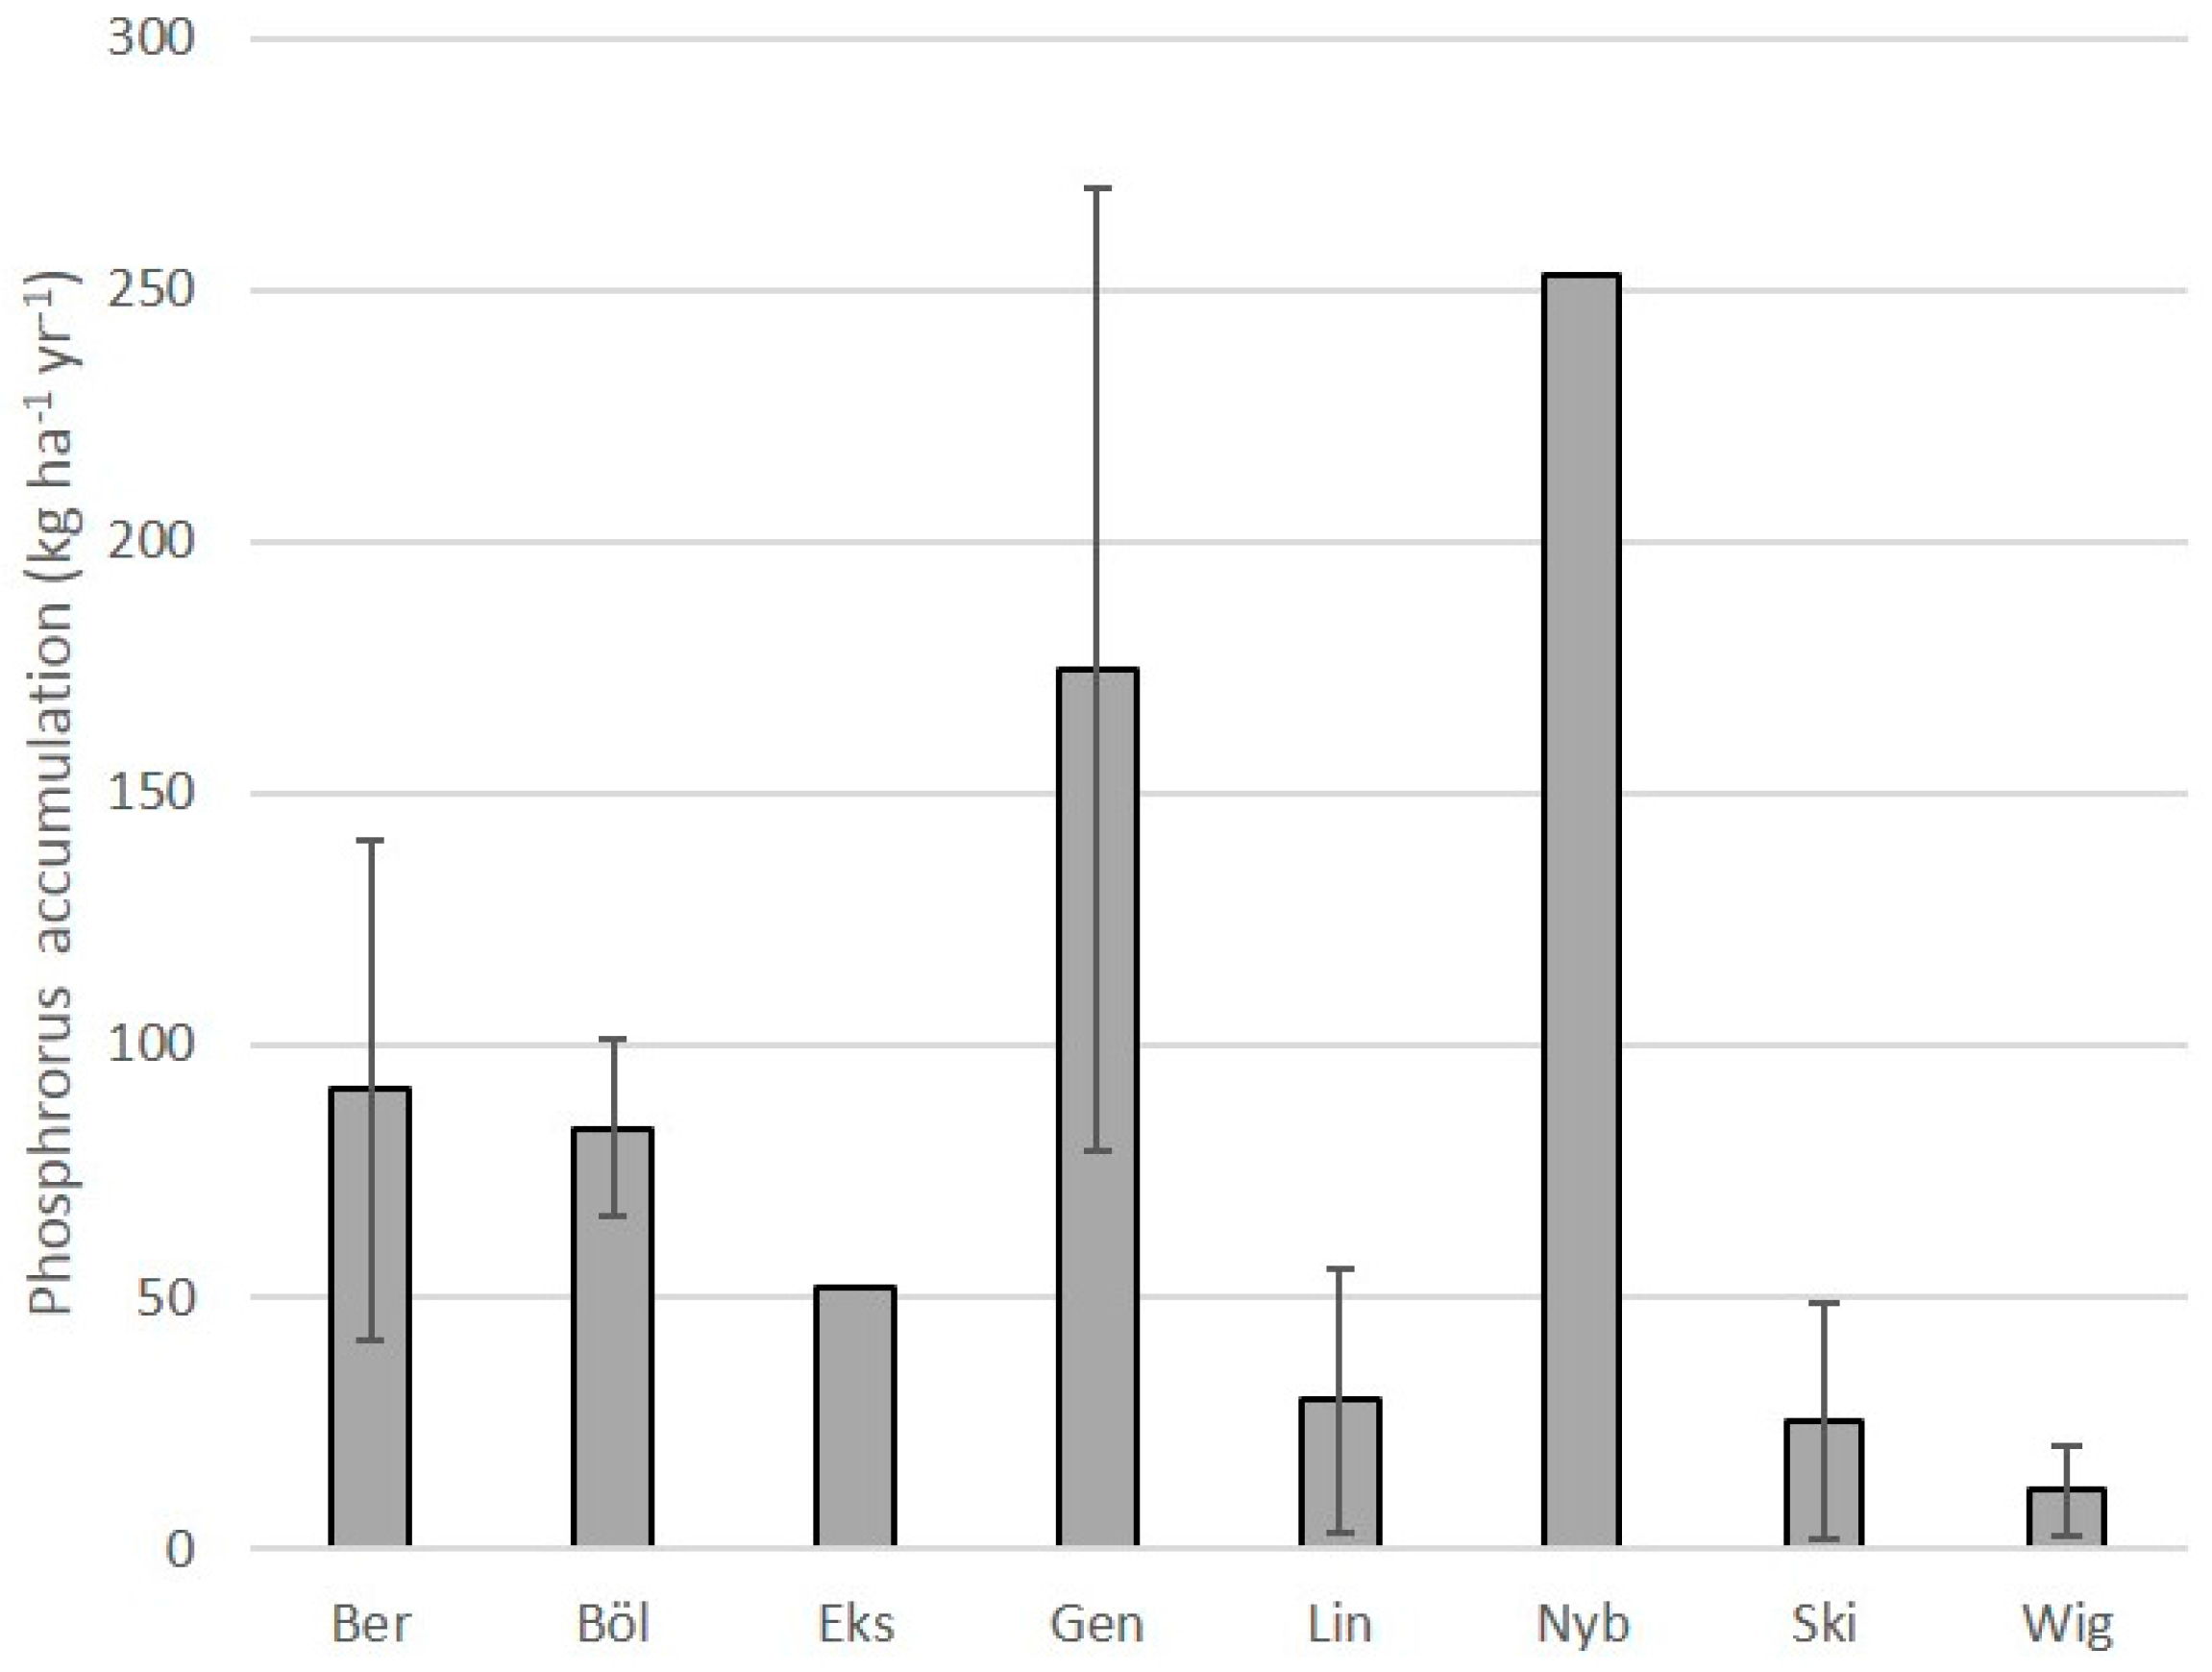
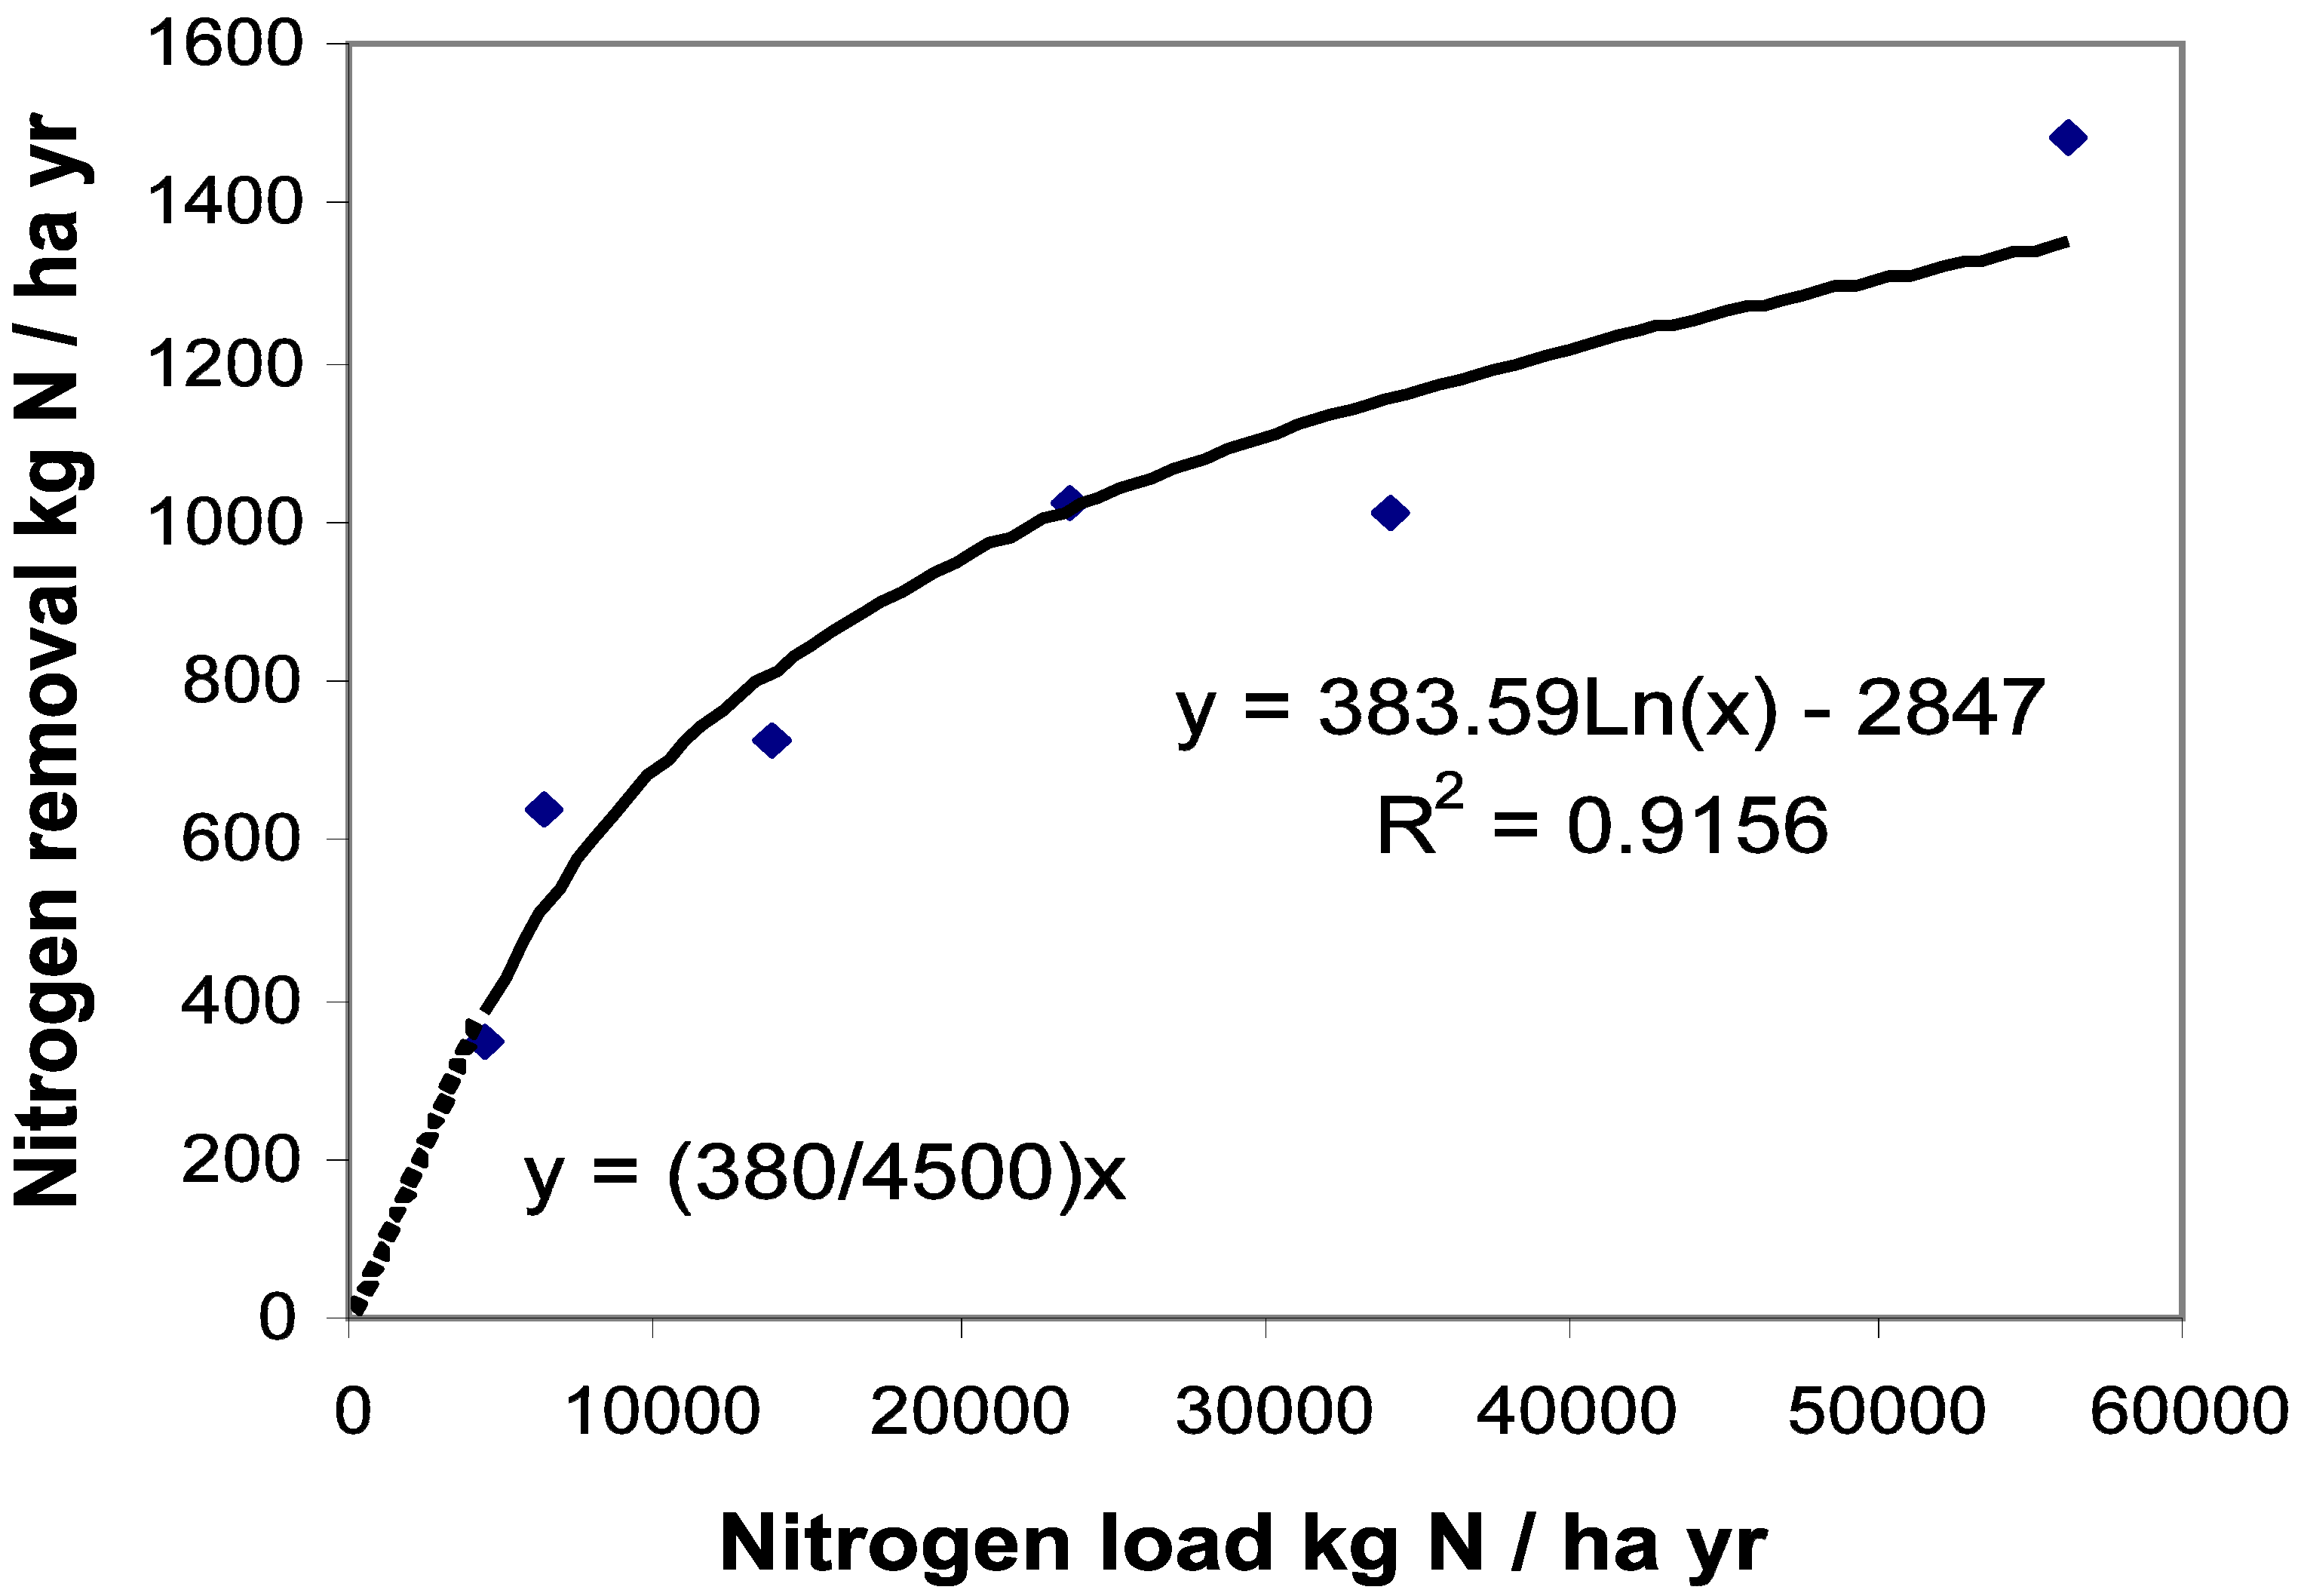
2.1. Nitrogen and Phosphorus Removal in Individual Created Wetlands

Transport and removal of nitrogen and phosphorus were monitored for 1.5–3 years through automatic flow-proportional water sampling in the inlet and outlet of three created wetlands receiving runoff from agricultural fields in southern Sweden. These wetlands represent wetlands with relatively high but different loads of incoming nitrogen and phosphorus, with a water surface area of between 0.22 and 0.4 ha, and receiving water from agricultural catchments of between 60 and 500 ha. Consequently, hydraulic load varied among these 3 wetlands between 61 and 391 m yr−1. Flow-weighted inflow nitrogen and phosphorus concentrations varied between 7.7 and 10.9 mg Tot-N L−1, and 22 and 182 μg Tot-P L−1, respectively. Water was automatically sampled flow-proportionally and transferred to be kept cool in a fridge at the inlet and outlet, respectively, and these composite samples were manually collected for analysis of nutrient concentrations with approximately 10 days intervals.
To increase the number of wetlands with water sampling for estimating nutrient removal, strategic grab sampling was performed in 14 created wetlands located in agricultural areas in south Sweden. The wetlands had water surface areas between 0.14 and 0.66 ha, and were chosen based on earlier studies from which plant and macroinvertebrate species composition as well as basic wetland parameters were known [8], to reflect the variation in abiotic and biotic ecosystem parameters among created wetlands of the region. This included two of the wetlands with automatic flow-proportional water sampling. Hydraulic load varied among these 14 wetlands between 17 and 326 m yr−1. Flow-weighted inflow nitrogen and phosphorus concentrations varied between 2.8 and 13.1 mg Tot-N L−1, and 9 and 475 μg Tot-P L−1, respectively. “Strategic” refers to that comparatively intense grab sampling was performed in in- and outlets of the wetlands within five different periods during 2 years to include different seasons and water flows. This was expected to give a clearer picture of wetland performance than if a similar amount of grab samples had simply been evenly distributed over time which may create large uncertainties [28].
Thus, nutrient removal was calculated for 15 wetlands based on automatic flow proportional sampling only (1 wetland), automatic flow proportional sampling and strategic grab sampling (2 wetlands), or strategic grab sampling only (12 wetlands). Annual removal of nitrogen and phosphorus in each wetland was estimated as the difference in transported mass between inlets and outlets. Annual precipitation in this part of Sweden is approximately 0.8 m and evapotranspiration approximately 0.4 m. The difference may cause a “dilution” effect in the wetlands, potentially resulting in overestimations of nutrient removal. However, hydraulic loads in the wetlands were around two orders of magnitude higher meaning than this dilution effect was negligible. Further details on water sampling and estimations of nutrient removal rates are given in Appendix A. For wetlands with automatic flow-proportional sampling, the results from this were used in further analysis. Finally, simple regression models were developed for annual removal of nitrogen as well as phosphorus in relation to annual loads, per wetland area, for the 15 wetlands in which automatic flow proportional sampling and/or strategic grab sampling had been done.
Measurements of particulate phosphorus accumulation on sediments were done in seven created wetlands in a previous study [23], and one additional created wetland was included here. Sedimentation plates were sampled once per year, and the results interpreted to represent the annual net sedimentation [23]. Finally, a multiple regression analysis was performed to achieve a model for net annual phosphorus accumulation in the eight wetlands. Variables to be tested in the model were retrieved for each of the 8 wetlands as described previously [23]. This included four catchment variables expected to have an effect on phosphorus transport from arable land (average slope of the arable land, clay and P-AL in catchment soils and animal density). Further, the wetland/catchment area ratio, the length/width ratio of the wetlands were included, as well as the modelled hydraulic and phosphorus load. These variables were first analysed through a Pearson correlation and variables that were significantly (p < 0.05) correlated were not included in the same multiple regression analysis. With stepwise exclusion of the least explanatory factor, a final regression model was obtained for estimation of phosphorus accumulation based on certain catchment and wetland characteristics.

2.2. Large-Scale Effects of a National Wetland Creation Program

For modelling of nutrient removal effects of the wetlands created within SRDP, basic data (including geographical location and wetland area) were obtained from the Swedish Board of Agriculture for the about 1000 wetland projects that had been granted support within the program [29]. From this database, 60 wetlands were selected for modelling of impact on transports of nitrogen and phosphorus to adjacent surface waters as well as to the Baltic Sea. Wetlands were selected using a stratified selection procedure to represent wetlands of different sizes (wetland area) within the 4 main agricultural (production) areas in south Sweden. For these 60 wetlands, additional information needed for modelling of nutrient removal was retrieved. This included length/width ratio, inlet type (ditch or belowground pipe), annual hydraulic load, and annual nitrogen and phosphorus loads. Annual hydraulic load was estimated from average annual runoff from the wetland’s catchment areas according to national hydrological data. To obtain nitrogen and phosphorus loads, hydraulic load was multiplied with concentrations obtained by combining agricultural area of each wetland catchment with annual leakage concentrations of phosphorus and nitrogen from agriculture in the region according to national data [30].
The removal of nitrogen and phosphorus in each of these 60 wetlands was estimated through two statistical models for nitrogen and phosphorus, respectively. The simple regression models mentioned above, acquired for removal of nitrogen as well as phosphorus in relation to loads for the 15 wetlands with automatic flow proportional sampling and/or strategic grab sampling, were used. Further, the multiple regression model mentioned above for annual net phosphorus accumulation developed based on the measurements on sedimentation plates in eight wetlands was used. Finally, a simple model on the relationship between nitrogen load and removal, used in an earlier evaluation and based on data from automatic time or flow proportional water sampling in six created wetlands in agricultural areas in southern Sweden (Appendix B), was used. To estimate the effects of the wetlands on the transport of nitrogen and phosphorus to the Baltic Sea, we accounted for downstream retention, i.e., how much of the nitrogen and phosphorus removed in each wetland that would not have reached the sea anyway due to removal processes between the wetland and the sea according to model estimates [31]. The removal effects (removal in wetlands as well as the effects of the wetlands on the nutrient transports to the Baltic Sea) per ha created wetland area and year was calculated as total effect/total wetland area of the 60 selected wetlands to represent what was achieved per created wetland area within SRDP.

3. Results

3.1. Nitrogen and Hosphorus Removal in Individual Created Wetlands

Annual nitrogen removal varied among the 15 sampled wetlands between about 20 and 1100 kg nitrogen per ha wetland area (Figure 1). About half (54%) of this variation could be explained by the variation in annual nitrogen load per wetland area as indicated by the regression model. The curvilinear relationship means that relative removal efficiency decreases at higher loads, although the absolute removal seems to continue to increase even at high loads. However, there was also a large variation in nitrogen removal per wetland area between wetlands with similar areal nitrogen loads. Annual nitrogen removal varied, as seen in the figure, from less than 300 up to 1100 kg nitrogen per ha wetland area for wetlands with annual loads of around 10,000 kg nitrogen per ha wetland area.
Annual phosphorus removal varied among the 15 wetlands with water sampling by between about 0 and 200 kg phosphorus per ha wetland area (Figure 2). A large proportion (70%) of this variation could be explained by the variation in annual phosphorus load per wetland area as indicated by the regression model. However, as seen in the figure, annual removal varied from around 0 up to 130 kg phosphorus per ha wetland area for wetlands with annual loads of around 200 kg phosphorus per ha wetland area. Further, one wetland had much higher load as well as removal than the other wetlands and the curvilinear relationship depends on how representative this wetland is for other wetlands with very high loads.
Annual phosphorus accumulation on sedimentation plates in the 8 wetlands in which this was measured varied from approximately 10 to 250 kg phosphorus per ha wetland area (Figure 3). The wetland “Böl” (as indicated in the figure) is one of the wetlands with automatic flow-proportional water sampling. Net accumulation of phosphorus in the wetland “Böl” was 96 and 71 kg per ha wetland area and year, respectively, during the two years this was measured [23]. This is comparable to the phosphorus removal from water which was 73 kg phosphorus per ha and year according to the automatic flow proportional water sampling in that wetland (the intermediate of the three wetlands with automatic flow proportional water sampling is indicated in Figure 2).

3.2. Large-Scale Effects of a National Wetland Creation Program

The best model from the multiple regression analyses explaining the variation in net annual phosphorus accumulation, among the 8 wetlands with sedimentation plates, included four independent variables: phosphorus load, inlet type (open ditch or drainage pipe), length/width ratio and the hydraulic load (as a dummy variable; 1 = high, 0 = low). The combination of the four factors explained 84% of the variation, and the regression model was:
Pacc = −23.1 + (0.55 × P) + (8.44 × L/W) − (284 × HL) + (47.1 × I)
where Pacc = net phosphorus accumulation on sediments (kg ha−1 yr−1), P = phosphorus load (kg ha−1 yr−1), L/W = length/width ratio, HL = hydraulic load (0 = HR < 365 m yr−1, 1 = HR > 365 m yr−1), and I = inlet type (1 = open ditch, 0 = drainage pipe). Modelled hydraulic load varied among these 8 wetlands between 22 and 646 m yr−1. The critical level for hydraulic load at 365 m yr−1 was based on earlier studies in similar wetlands [27]. When the model for phosphorus accumulation was applied to the 60 selected wetlands, it resulted in a calculated phosphorus accumulation that was negative, or that exceeded the phosphorus load, in some wetlands. In such cases, phosphorus accumulation was set to 0 or equal to the load, respectively.
This model for phosphorus accumulation on sediments, the two regression models based on nitrogen and phosphorus removal in 15 wetlands, and the existing simple model for nitrogen removal (Appendix B) were used here for calculating the total removal effects achieved per created wetland area within SRDP based on the 60 selected wetlands. Depending on model used, the average annual removal per ha created wetland area within SRDP was estimated to between 35 and 46 kg nitrogen, and between 3.5 and 6 kg phosphorus, per ha created wetland area (Table 1). The effect of the wetlands on decreased transport of nitrogen and phosphorus to the Baltic Sea was estimated to be between 27 and 38 kg nitrogen, and between 2.7 and 4.5 kg phosphorus, per ha wetland area (Table 1).

4. Discussion

Annual nitrogen as well as phosphorus removal per ha wetland area varied strongly among the sampled wetlands. Part of this variation could be explained by the variation in annual loads per wetland area as shown by regression models. This conforms to earlier studies [5,6,23,32]. Therefore, location of created wetlands on a landscape scale promoting high loads of nitrogen and phosphorus will result in a greater reducing effect on total nutrient transports compared to the situation if the same area of wetlands were to be located where less nutrients are being transported. However, there was also a considerable variation in nutrient removal per wetland area among wetlands with similar areal loads. This emphasizes that there are also other factors that are important to consider for obtaining high nutrient removal in created wetlands in agricultural catchments. These can be factors related to wetland design and biological composition [33,34,35,36,37,38], as well as concentrations and form of the nutrients in inflowing water or other factors related to catchment characteristics [6,23,27,32]. Further studies are needed to identify and evaluate the important factors affecting the nutrient removal efficiency of created wetlands in agricultural catchments.
The average annual removal of nitrogen as well as phosphorus per created wetland area within SRDP is, according to the model calculations, much lower than what can be achieved in individual wetlands according to removal values in some of the sampled wetlands. Since the model calculations are largely based on estimated nutrient loads to the wetlands, this suggests that the effect of wetland creation programs can be increased considerably if wetlands are located where they will receive higher nutrient loads. Further, the models are based on regressions which only explain part of the variation in removal capacity of included wetlands. This suggests that removal efficiency in wetland creation programmes in agricultural catchments can be increased substantially by more explicitly including wetland design and catchment factors affecting the nutrient removal efficiency of created wetlands. However, wetlands within SRDP seemed to be generally well located in relation to the final recipient, i.e., with low down-stream retention between the wetland and the Baltic Sea, since the difference between removal in the wetlands and the effect on decreased transport of nitrogen and phosphorus to the Baltic Sea was relatively small. This enhances the possibilities that the created wetlands will contribute to a decreased eutrophication of the Baltic Sea.
The main purpose with each of the 60 wetlands selected for modelling in this study was stated in the decisions from authorities to grant financial support. Improved biodiversity was included as a main purpose, solely or in combination with nutrient removal, for 37 of the wetlands. Nutrient removal was stated as the only main purpose for the remaining 23 wetlands. The modelled removal of nitrogen as well as phosphorus was substantially higher per created wetland area when nutrient removal was stated as the only main purpose (Table 2). This emphasizes the possibility to increase effects on nutrient removal if there is a clear focus on this in wetland creation programs.
This study shows a large variation in the amount of nitrogen as well as phosphorus annually removed per wetland area among wetlands created in agricultural areas in south Sweden. The removal of nitrogen as well as phosphorus in some individual wetlands was more than 10 times higher than what is achieved on average per created wetland area within the national wetland creation program. We conclude that a strict focus on nutrient removal, complemented by guidelines and functional regulations, can substantially increase nutrient removal effects in national wetland creation programs.

Acknowledgments

This study is based on projects that were financially supported by Bertebos Foundation, the Federation of Swedish Farmers (LRF), Sparbanksstiftelsen Kronan, the Swedish Board of Agriculture, the Swedish Water Management Research Program (VASTRA) which was financed by The Swedish Foundation for Strategic Environmental Research (MISTRA), and the Swedish Research Council for Environment, Agricultural Sciences and Spatial Planning (Formas; grants 21.5/2003-1111 and 215-2005-507).

Author Contributions

Stefan E. B. Weisner and Henrik Svengren designed the automatic flow proportional sampling; Stefan E. B. Weisner and Geraldine Thiere designed the strategic grab sampling; Karin Johannesson and Karin S. Tonderski conceived and designed the measurements of phosphorus accumulation on sediments; Henrik Svengren, Per Magnus Ehde, Geraldine Thiere and Karin Johannesson did field sampling and laboratory analyses; Stefan E. B. Weisner, Geraldine Thiere, Karin S. Tonderski and Karin Johannesson analyzed the data; Stefan E. B. Weisner conceived and designed the overall study and wrote the paper with contributions from all co-authors.

Conflicts of Interest

The authors declare no conflict of interest.

Appendix A

Transport and removal of nitrogen and phosphorus was monitored during 2003–2006 through automatic flow-proportional water sampling in the inlet and outlet of three created wetlands. The water sampler in the inlet as well as the outlet was controlled by the water flow in the outlet, and there were periods with time-proportional sampling due to malfunction of the flow-proportional sampling. This may give systematic effects on estimations of phosphorus loads and removal since concentrations of phosphorus in inlet as well as outlet of the wetlands were related to water flow [17]. Tackling this problem started with simulating hourly concentrations of phosphorus in inlets as well as outlets, based on hourly water flow measurements and regression models for relationships between water flow and phosphorus concentrations in grab samples [17,29]. Further, buffering of water flow in wetlands will result in more moderate water flow variations in outlets compared to inlets. Simultaneous measurements of water flow in in- and outlets of wetlands during the strategic water sampling described below confirmed this pattern and, based on these data, hourly water flow in the inlet was simulated from hourly water flow in the outlet. Based on these simulated dynamics of water flows and phosphorus concentrations, systematic effects of flow-proportional sampling controlled by outlet water flow, or time-proportional sampling during periods when this was done instead, were modelled and adjusted for in the estimations of phosphorous loads and removal based on the automatic water sampling. Nitrogen concentrations were not significantly correlated to water flow and therefore no similar adjustment was made for nitrogen.
The strategic grab sampling in 14 created wetlands was performed during five different periods of two subsequent years (May, August and November 2005; May and September 2006). Lengths of the periods were adjusted to correspond to the theoretical residence time for water in each wetland, in an attempt to include outflows reflecting inflow events. Periods therefore varied in length between 3 and 27 days. Water was sampled in inlets and outlets in each wetland at 3–4 sampling occasions (different dates) within each period. Except for one wetland with two inlets, the wetlands had one inlet and one outlet. At each sampling date, water flow was measured at both the inlet(s) and outlet if possible, or either the inlet(s) or outlet, of each wetland with a transportable flow meter. The transported mass of nitrogen and phosphorus, in in- as well as outlets of the wetlands, was calculated for each sampling date as the concentration times the water flow. If water flow was measured in inlet(s) and outlet, the mean value was used. Otherwise, water flow in the inlet(s) or the outlet was used for calculating nutrient mass transport inlet as well as outlet. Temporal variations in flow and concentrations within periods were examined to identify sudden changes in concentrations or flows that needed to be taken into account when estimating nutrient removal rates. Based on this, the last sampling date in September 2006 was excluded from the analyses for three wetlands, when inflow concentration of phosphorus more than doubled compared to the preceding sampling date in connection with increased water flow. This exclusion is motivated as there was no subsequent outflow sampling within the period that could reflect the inflow event, and not excluding the data could therefore result in a strong over-estimation of phosphorus removal. Mean loads and removal of nitrogen and phosphorus were calculated for each period, and the average of the five periods was calculated to obtain a measure of annual loads and removal rates for each wetland. However, it was expected that nitrogen removal was over-estimated in the strategic grab sampling due to over-representation of warm periods with relatively high denitrification. Phosphorus loads were expected to be under-estimated as periods with high flows were largely lacking. Therefore, the two wetlands with both automatic flow proportional sampling and strategic grab sampling were used for adjusting the values from the 12 wetlands with only strategic grab sampling to more realistic annual values. Nitrogen removal in the two wetlands with automatic as well as grab sampling was 68 and 28% higher, respectively, according to unadjusted strategic grab sampling compared to automatic flow proportional sampling. Phosphorus load was 37% and 50% lower, respectively, according to unadjusted strategic grab sampling compared to adjusted automatic flow proportional sampling. Based on this, nitrogen removal obtained in the 12 wetlands with only strategic grab sampling was divided by 1.5 and phosphorus loads in inlets as well as outlets were multiplied by 2, to obtain better estimates than by simply using the average of the five periods.
Water samples were kept cool, transported to the lab within 8 h, and stored immediately at −18 °C until further analysis. Total nutrient concentrations (Tot-N and Tot-P) of water samples were analysed by photometric methods using a flow injection analyser (FIAstar, FOSS, Sweden) after digestion to the soluble reactive phases (nitrate/nitrite-N, phosphate-P) achieved by exposure to potassium peroxide (nitrogen) combined with sulphuric acid (phosphorus).

Appendix B

Figure B1. Relationships between nitrogen load and removal (kg per hectare wetland area and year), used in an earlier evaluation and based on data from automatic time or flow proportional water sampling in six created wetlands in agricultural areas in southern Sweden [39]. R = 380L/4500 was used for loads <4500 kg ha−1 yr−1 and R = 383.59ln(L) − 2847 was used for loads >4500 kg ha−1 yr−1, where R = annual nitrogen removal per wetland area (kg ha−1 yr−1); L = annual nitrogen load per wetland area (kg ha−1 yr−1).
Water 08 00544 g004

References

  1. Alvarez, S.; Asci, S.; Vorotnikova, E. Valuing the potential benefits of water quality improvements in watersheds affected by non-point source pollution. Water 2016, 8, 112. [Google Scholar] [CrossRef]
  2. Hefting, M.M.; van den Heuvel, R.N.; Verhoeven, J.T.A. Wetlands in agricultural landscapes for nitrogen attenuation and biodiversity enhancement: Opportunities and limitations. Ecol. Eng. 2013, 56, 5–13. [Google Scholar] [CrossRef]
  3. Newcomer Johnson, T.A.; Kaushal, S.S.; Mayer, P.M.; Smith, R.M.; Sivirichi, G.M. Nutrient retention in restored streams and rivers: A global review and synthesis. Water 2016, 8, 116. [Google Scholar] [CrossRef]
  4. Verhoeven, J.T.A.; Arheimer, B.; Yin, C.Q.; Hefting, M.M. Regional and global concerns over wetlands and water quality. Trends Ecol. Evol. 2006, 21, 96–103. [Google Scholar] [CrossRef] [PubMed]
  5. Strand, J.A.; Weisner, S.E.B. Effects of wetland construction on nitrogen transport and species richness in the agricultural landscape—Experiences from Sweden. Ecol. Eng. 2013, 56, 14–25. [Google Scholar] [CrossRef]
  6. Fleischer, S.; Gustafson, A.; Joelsson, A.; Pansar, J.; Stibe, L. Nitrogen removal in created ponds. Ambio 1994, 23, 349–357. [Google Scholar]
  7. Jansson, M.; Andersson, R.; Berggren, H.; Leonardson, L. Wetlands and lakes and nitrogen traps. Ambio 1994, 23, 320–325. [Google Scholar]
  8. Thiere, G.; Milenkovski, S.; Lindgren, P.-E.; Sahlén, G.; Berglund, O.; Weisner, S.E.B. Wetland creation in agricultural landscapes: Biodiversity benefits on local and regional scales. Biol. Conserv. 2009, 142, 964–973. [Google Scholar] [CrossRef]
  9. Tonderski, K.S.; Arheimer, B.; Pers, C.B. Modeling the impact of potential wetlands on phosphorus retention in a Swedish catchment. Ambio 2005, 34, 544–551. [Google Scholar] [CrossRef] [PubMed]
  10. Li, T.; Gao, X. Ecosystem services valuation of Lakeside Wetland Park beside Chaohu Lake in China. Water 2016, 8, 301. [Google Scholar] [CrossRef]
  11. Semeraro, T.; Giannuzzi, C.; Beccarisi, L.; Aretano, R.; De Marco, A.; Pasimeni, M.R.; Zurlini, G.; Petrosillo, I. A constructed treatment wetland as an opportunity to enhance biodiversity and ecosystem services. Ecol. Eng. 2015, 82, 517–526. [Google Scholar] [CrossRef]
  12. Jenkins, W.A.; Murray, B.C.; Kramer, R.A.; Faulkner, S.P. Valuing ecosystem services from wetlands restoration in the Mississippi Alluvial Valley. Ecol. Econ. 2010, 69, 1051–1061. [Google Scholar] [CrossRef]
  13. Hansson, A.; Pedersen, E.; Weisner, S.E.B. Landowners’ incentives for constructing wetlands in an agricultural area in south Sweden. J. Environ. Manag. 2012, 113, 271–278. [Google Scholar] [CrossRef] [PubMed]
  14. Kamarinas, I.; Julian, J.; Hughes, A.O.; Owsley, B.C.; de Beurs, K.M. Nonlinear changes in land cover and sediment runoff in a New Zealand catchment dominated by plantation forestry and livestock grazing. Water 2016, 8, 436. [Google Scholar] [CrossRef]
  15. Ockenden, M.C.; Deasy, C.E.; Benskin, C.M.H.; Beven, K.J.; Burke, S.; Collins, A.L.; Evans, R.; Falloon, P.D.; Forber, K.J.; Hiscock, K.M.; et al. Changing climate and nutrient transfers: Evidence from high temporal resolution concentration-flow dynamics in headwater catchments. Sci. Total Environ. 2016, 548, 325–339. [Google Scholar] [CrossRef] [PubMed] [Green Version]
  16. Cooper, R.J.; Rawlins, B.G.; Krueger, T.; Leze, B.; Hiscock, K.M.; Pedentchouk, N. Contrasting controls on the phosphorus concentration of suspended particulate matter under baseflow and storm event conditions in agricultural headwater streams. Sci. Total Environ. 2015, 533, 49–59. [Google Scholar] [CrossRef] [PubMed] [Green Version]
  17. Johannesson, K.M.; Tonderski, K.S.; Ehde, P.M.; Weisner, S.E.B. Temporal phosphorus dynamics affecting retention estimates in agricultural constructed wetlands. Ecol. Eng. 2015. [Google Scholar] [CrossRef]
  18. Ulén, B.; von Brömssen, C.; Kyllmar, K.; Djodjic, F.; Forsberg, L.S.; Andersson, S. Long-term temporal dynamics and trends of particle-bound phosphorus and nitrate in agricultural stream waters. Acta Agric. Scand. Sect. B-Soil Plant. Sci. 2012, 62, 217–228. [Google Scholar] [CrossRef]
  19. McDowell, R.W.; Wilcock, R.J. Particulate phosphorus transport within stream flow of an agricultural catchment. J. Environ. Qual. 2004, 33, 2111–2121. [Google Scholar] [CrossRef] [PubMed]
  20. Ulén, B. Size and settling velocities of phosphorus-containing particles in water from agricultural drains. Water Air Soil Pollut. 2004, 157, 331–343. [Google Scholar] [CrossRef]
  21. Bowes, M.J.; House, W.A.; Hodgkinson, R.A. Phosphorus dynamics along a river continuum. Sci. Total Environ. 2003, 313, 199–212. [Google Scholar] [CrossRef]
  22. Uusitalo, R.; Yli-Halla, M.; Turtola, E. Suspended soil as a source of potentially bioavailable phosphorus in surface runoff waters from clay soils. Water Res. 2000, 34, 2477–2482. [Google Scholar] [CrossRef]
  23. Johannesson, K.M.; Kynkäänniemi, P.; Ulén, B.; Weisner, S.E.B.; Tonderski, K.S. Phosphorus and particle retention in constructed wetlands—A catchment comparison. Ecol. Eng. 2015, 80, 20–31. [Google Scholar] [CrossRef]
  24. Ockenden, M.C.; Deasy, C.; Quinton, J.N.; Surridge, B.; Stoate, C. Keeping agricultural soil out of rivers: Evidence of sediment and nutrient accumulation within field wetlands in the UK. J. Environ. Manag. 2014, 135, 54–62. [Google Scholar] [CrossRef] [PubMed]
  25. Ockenden, M.C.; Deasy, C.; Quinton, J.N.; Bailey, A.P.; Surridge, B.; Stoate, C. Evaluation of field wetlands for mitigation of diffuse pollution from agriculture: Sediment retention, cost and effectiveness. Environ. Sci. Policy 2012, 24, 110–119. [Google Scholar] [CrossRef]
  26. Koskiaho, J.; Ekholm, P.; Räty, M.; Riihimäki, J.; Puustinen, M. Retaining agricultural nutrients in constructed wetlands—Experiences under boreal conditions. Ecol. Eng. 2003, 20, 89–103. [Google Scholar] [CrossRef]
  27. Braskerud, B.C. Factors affecting phosphorus retention in small constructed wetlands treating agricultural non-point source pollution. Ecol. Eng. 2002, 19, 41–61. [Google Scholar] [CrossRef]
  28. Eskelinen, R.; Ronkanen, A.-L.; Marttila, H.; Kløve, B. Assessment of uncertainty in constructed wetland treatment performance and load estimation methods. Environ. Monit. Assess. 2016, 188, 365. [Google Scholar] [CrossRef] [PubMed]
  29. Weisner, S.; Johannesson, K.; Tonderski, K. Näringsavskiljning i anlagda våtmarker i jordbrukslandskapet—Analys av mätresultat och effekter av landsbygdsprogrammet; Report 2015:7; Swedish Board of Agriculture: Jönköping, Sweden, 2015.
  30. Johnsson, H.; Larsson, M.; Lindsjö, A.; Mårtensson, K.; Persson, K.; Torstensson, G. Läckage av näringsämnen från svensk åkermark; Report 5823; Swedish Environmental Protection Agency: Stockholm, Sweden, 2008.
  31. Arheimer, B.; Brandt, M. Modelling nitrogen transport and retention in the catchments of southern Sweden. Ambio 1998, 27, 471–480. [Google Scholar]
  32. Land, M.; Granéli, W.; Grimvall, A.; Hoffmann, C.C.; Mitsch, W.J.; Tonderski, K.S.; Verhoeven, J.T.A. How effective are created or restored freshwater wetlands for nitrogen and phosphorus removal? A systematic review. Environ. Evid. 2016, 5. [Google Scholar] [CrossRef]
  33. Shih, S.-S.; Hong, S.-S.; Chang, T.-J. Flume experiments for optimizing the hydraulic performance of a deep-water wetland utilizing emergent vegetation and obstructions. Water 2016, 8, 265. [Google Scholar] [CrossRef]
  34. Li, P.; Zhang, J.; Xie, H.; Hu, Z.; He, H.; Wang, W. Effects of Misgurnus anguillicaudatus and Cipangopaludina cathayensis on pollutant removal and microbial community in constructed wetlands. Water 2015, 7, 2422–2434. [Google Scholar] [CrossRef]
  35. Weisner, S.E.B.; Thiere, G. Effects of vegetation state on biodiversity and nitrogen retention in created wetlands: A test of the biodiversity—Ecosystem functioning hypothesis. Freshwater Biol. 2010, 55, 387–396. [Google Scholar] [CrossRef]
  36. Braskerud, B.C. The influence of vegetation on sedimentation and resuspension of soil particles in small constructed wetlands. J. Env. Qual. 2001, 30, 1447–1457. [Google Scholar] [CrossRef]
  37. Engelhardt, K.A.M.; Ritchie, M.E. Effects of macrophyte species richness on wetland ecosystem functioning and services. Nature 2001, 411, 687–689. [Google Scholar] [CrossRef] [PubMed]
  38. Weisner, S.E.B.; Eriksson, P.G.; Granéli, W.; Leonardson, L. Influence of macrophytes on nitrate removal in wetlands. Ambio 1994, 23, 363–366. [Google Scholar]
  39. Weisner, S.; Thiere, G. Mindre fosfor och kväve från jordbrukslandskapet; Report 2010:21; Swedish Board of Agriculture: Jönköping, Sweden, 2010.
Figure 1. Relationship between nitrogen load and removal (kg per hectare wetland area and year), based on water sampling in inlet and outlet of 15 created wetlands in agricultural areas in southern Sweden. Data from automatic flow proportional water sampling in 3 wetlands and strategic grab sampling in 12 wetlands are indicated with different symbols. The regression model R = 229.41ln(L) − 1405.3, where R = annual nitrogen removal per wetland area (kg ha−1 yr−1) and L = annual nitrogen load per wetland area (kg ha−1 yr−1) was used for modelling of nitrogen removal in 60 selected wetlands.
Water 08 00544 g001
Figure 2. Relationship between phosphorus load and removal (kg per hectare wetland area and year), based on water sampling in inlet and outlet of 15 created wetlands in agricultural areas in southern Sweden. Data from automatic flow proportional water sampling in 3 wetlands and strategic grab sampling in 12 wetlands are indicated with different symbols. The regression model R = −0.0003L2 + 0.4584L, where R = annual phosphorus removal per wetland area (kg ha−1 yr−1) and L = annual phosphorus load per wetland area (kg ha−1 yr−1) was used for modelling of phosphorus removal in 60 selected wetlands.
Water 08 00544 g002
Figure 3. Phosphorus accumulation (kg per hectare wetland area and year) in eight created wetlands in agricultural areas in southern Sweden, based on measurements on sedimentation plates. Average values and standard deviations are shown for the six wetlands with two years of measurements.
Water 08 00544 g003
Table 1. The removal effects (kg nitrogen or phosphorus per hectare created wetland area and year) of the wetlands granted support within the Swedish Rural Development Program 2007–2013, according to model calculations on 60 wetlands within the program. The regression models obtained for removal of nitrogen as well as phosphorus in relation to loads for the 15 wetlands with automatic flow proportional sampling and/or strategic grab sampling are designated as N1 and P1, respectively. The multiple regression model based on measurements on sedimentation plates in eight wetlands is designated as P2. The model on the nitrogen removal in relation to load, used in earlier evaluations and based on data from automatic water sampling in six created wetlands, is designated as N2.
Effect ScaleN1N2P1P2
Removal in wetlands46323.56.0
Decreased transport to the sea38272.74.5
Table 2. Removal effects (kg nitrogen or phosphorus per hectare created wetland area and year) in wetlands granted support within the Swedish Rural Development Program 2007–2013, according to model calculations on 60 wetlands within the program, divided on the main purpose with individual wetlands as stated in decisions from authorities. Improved biodiversity was included as a main purpose, solely or in combination with nutrient removal, for 37 wetlands and nutrient removal was stated as the only main purpose for 23 wetlands. The models are designated as in Table 1.
Main PurposeN1N2P1P2
Improved biodiversity 1 (n = 37)21101.83.9
Nutrient removal only (n = 23)3372983045
Notes: 1 includes wetlands for which improved biodiversity was mentioned as the sole purpose or in combination with nutrient removal.

