1. Introduction
The northeast region, especially in the Songliao River Basin, is one of China’s main flood disaster areas. According to the records of historical flood, since 1856 there have been 15, causing heavy casualties and property losses. At present, the basic flood control engineering system of dike-based reservoir regulation, flood storage, and flood detention is in the northeast region, and effective non-engineering measures have been taken, which is of great significance to exert the flood control function [
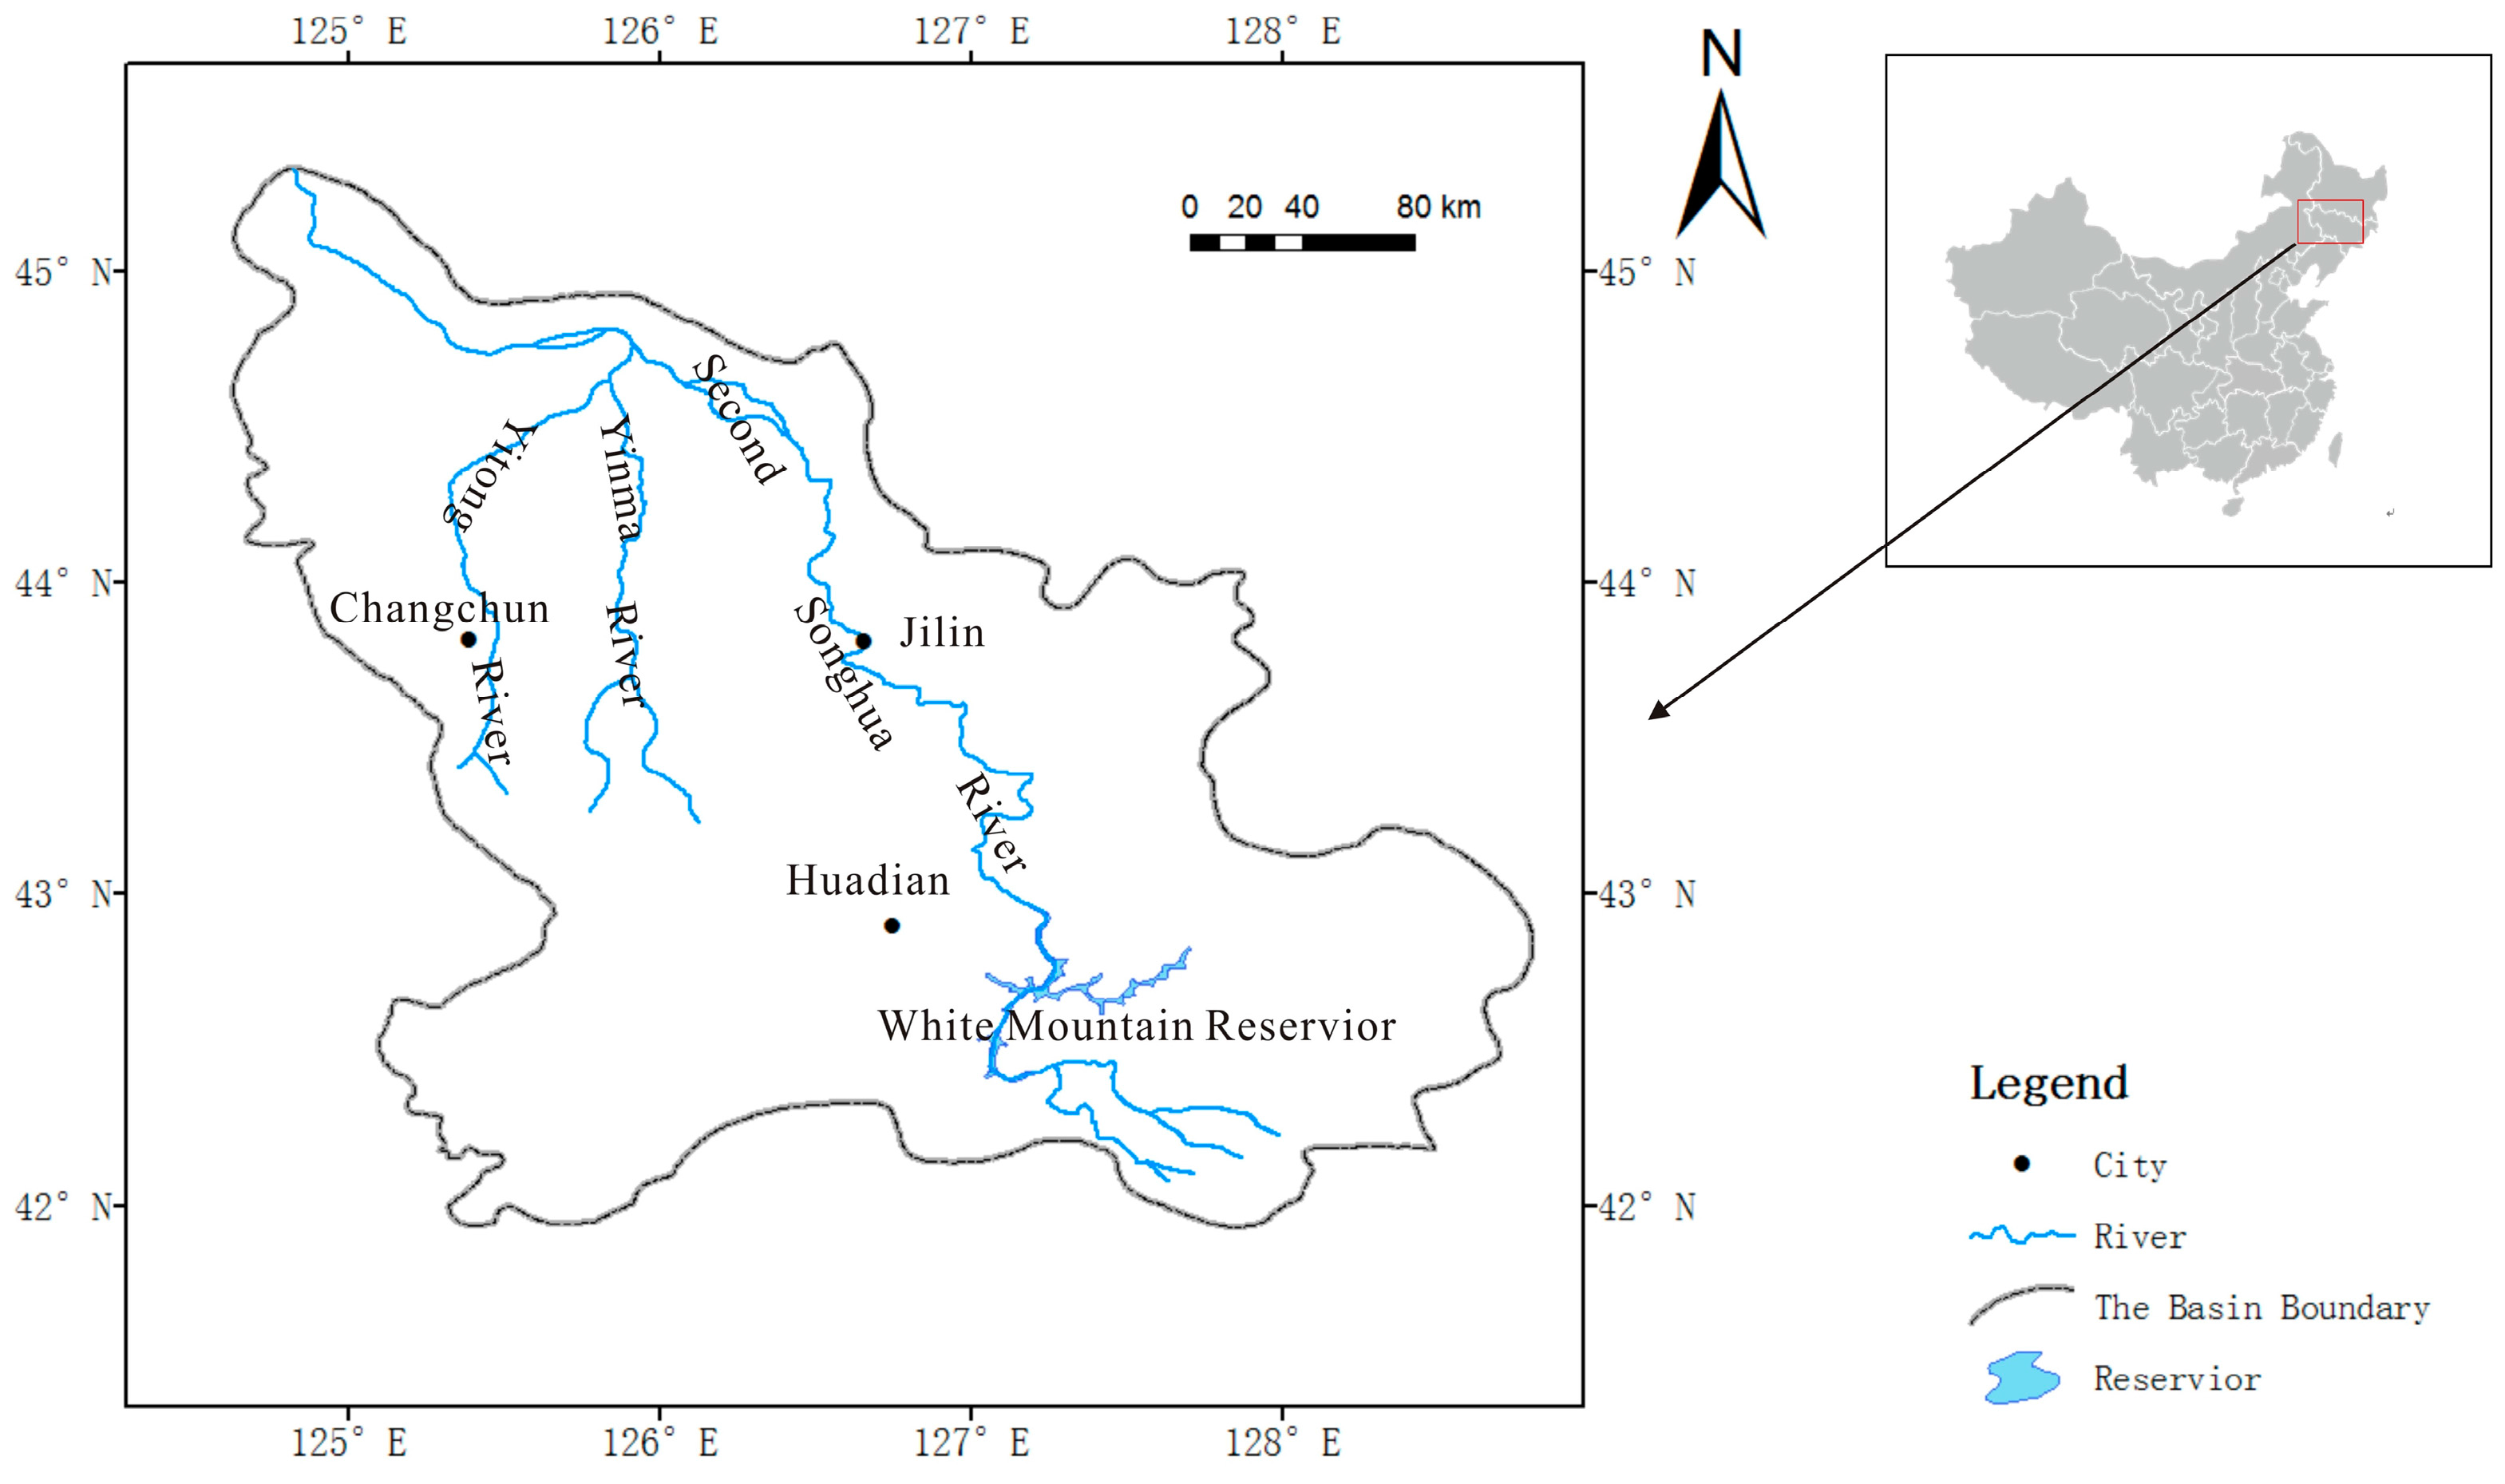
1]. The Second Songhua River provides irrigation water for major grain producing areas in Northeastern China and provides industrial water and domestic water for the main cities in the province of Jilin. In addition, the river also generates 5.5 billion kWh of electricity annually. Furthermore, reservoirs such as White Mountain, Fengman, Xinlicheng, and Shitoukoumen build flood protection for Changchun, Jilin City, and Harbin, as well as for embankments along, and mainstream of, Songhua River, also play a role in environmental protection, tourism, and other comprehensive social benefits. Reducing flood disaster, effectively utilizing the rain flood resources, and performing good flood forecasting are important. However, the rainstorm weather classification is the basis of rainstorm forecasts [
2]. Rainstorm weather systems and storm flood characteristics [
3,
4,
5] in the river basin were studied, and the periodicity of catastrophic years was then identified using the commensurability method, which can provide technical support for flood control and disaster mitigation.
The long-term flood forecast [
6,
7] includes two components: (1) the amount of flood size prediction (such as peak flow, peak water level, etc.) and (2) flood time prediction [
8]. With the rapid development of modern science and technology, computer science, geographic information systems, and remote sensing information technology has been gradually applied to hydrology, flood forecasting technology has been rapidly developed, and people have begun to simulate the hydrological cycle process using mathematical languages and methods. Thus, the concept of watershed hydrological model has arisen at an historic moment. However, these models still lack research. The forecast success rate is low because most of the current long-term forecast models do not easily simulate the laws of disastrous floods [
9]. It is worth mentioning that the information regarding the history of the occurrence of disastrous floods is lacking. Understanding and learning the principles of the occurrence of disastrous floods is, however, very important and would be useful. Long-term forecasting models are commonly used without considering historical floods. If there is no flood information in the model, it is difficult to forecast extra-large values. At present, most models use peak flow, peak water level, etc. as the forecast object, and then forecast the time when the maximum amount is predicted as the time of occurrence. However, in the case of disastrous floods, a certain standard is determined in advance, such as flood discharge or warning level, etc., Disasters occur when floods greater than this standard occur. In this case, the annual flood size is not important; the key is to determine which year will see floods above the standard amount. This can be done if you can predict flood occurrences, which has important implications for flood control. Weng [
10] founded a theory in 1984 that was based on information prediction, and this method, unique to the natural disaster prediction, simple, and practical, is an important means of carrying out long-term natural disaster predictions. Hydrological phenomena have an obvious periodicity, and hydrological abrupt event predictions based on the commensurability method has been increasingly used.
Therefore, the aim of this paper is to analyze the rainstorm weather systems and storm flood characteristics in the Second Songhua River Basin (Northeastern China) and to explore the relationships between the rainstorm weather system, the type of rainstorm, the cause of the flood, and the time of occurrence. Basic characteristics of rainstorm floods of the river basin are summarized. In order to make better use of historical flood data, “flood-causing precipitation years” refers to the water abundance during July and August. Then, the periodicity of catastrophic years is identified using the commensurability method and is shown to have an average of 11 years. Compared with simple flood forecasting, flood-causing precipitation has a longer forecast period, which can gain the requisite time to discharge a reservoir and regain storage capacity, lower the limitation level, and manage the occurrence of flooding.
3. Basic Theory and Method of Commensurability
3.1. The Origin of the Commensurability
Commensurability not only exists in the movement of celestial bodies but also in the natural phenomena of the earth. Based on this idea, Weng founded a prediction theory in 1984 that was based on information prediction [
10]. The occurrence of floods is commensurable, so the principle of commensurability is applied to flood forecasting. In 1984, the Yangtze flood in 1991 was successfully predicted. This method has advantages (including simple calculations, intuitiveness, effectiveness, and minimal information distortion) such that commensurability can be seen as a kind of natural order, an information system, and a cyclical expansion, that is, almost periodic.
3.2. The Expression of Commensurability
In the objective world, there is no absolute correct result, but error ranges need to be considered. The same applies to the periodic component of the physical process. This component may not be fully periodic but approximate periodic. The error is represented by the variable ε.
According to the literature [
23], commensurability can be generally expressed using Equation (1):
where
and
, that is to say,
is a number that is different from
i in the subscript set
,
is an element of
that is different from
Xi;
i,
n, and
are both integers. Among them,
n is the sample size;
L is a commensurable cardinal number; and
is a pre-determined feasible threshold.
Equation (1) reveals the “commensurability principle,” that is to say, “all real objects and events are composed by their basic units, which can be counted by natural numbers. Some events only happen time and again, and cannot [sic] occur half a [sic] time. If we use a function to indicate the entity, those events mentioned in the former instance are discrete and discontinuous, as well as non-differentiable.”
3.3. Commensurability and Periodicity
Weng’s unpublished document, titled “From Commensurability to Periodicity,” is summarized by Xu [
24], and treats commensurability as an expansion of periodicity.
For a time variable
y(
t), if there is an time duration
p that makes
then
p is viewed as a period. If there is a time interval
e that makes
then
p is an almost-period. If the almost-period has a physical meaning, then
e must be less than a certain confidence level, thus denying its contingency.
If the time variable
y(
t) reduced to time series
y(
i), Equation (2) becomes one of its discrete special cases; meanwhile, the unary relation is expanded to a multivariate polynomial. In addition,
where
a(
i) is an integer. Then, the discrete time series
y(
i) has an approximate commensurability, and
e is the same as defined above. If
e = 0, then
y(
i) has commensurability.
For a periodic time series, each period has a strict distance of p. After the degradation and expansion of cyclicality, the relationship between each point and the periodicity of this time series collection has greatly changed. Periodicity is only an extreme case of commensurability; in natural phenomena, an approximate period with a little error ε0 is more common.
The test for commensurability in the practice of hydrological catastrophe predictions has been described in detail by Xia [
25,
26] and Fan [
27].
3.4. Prediction Step of Commensurability
(1) As shown in
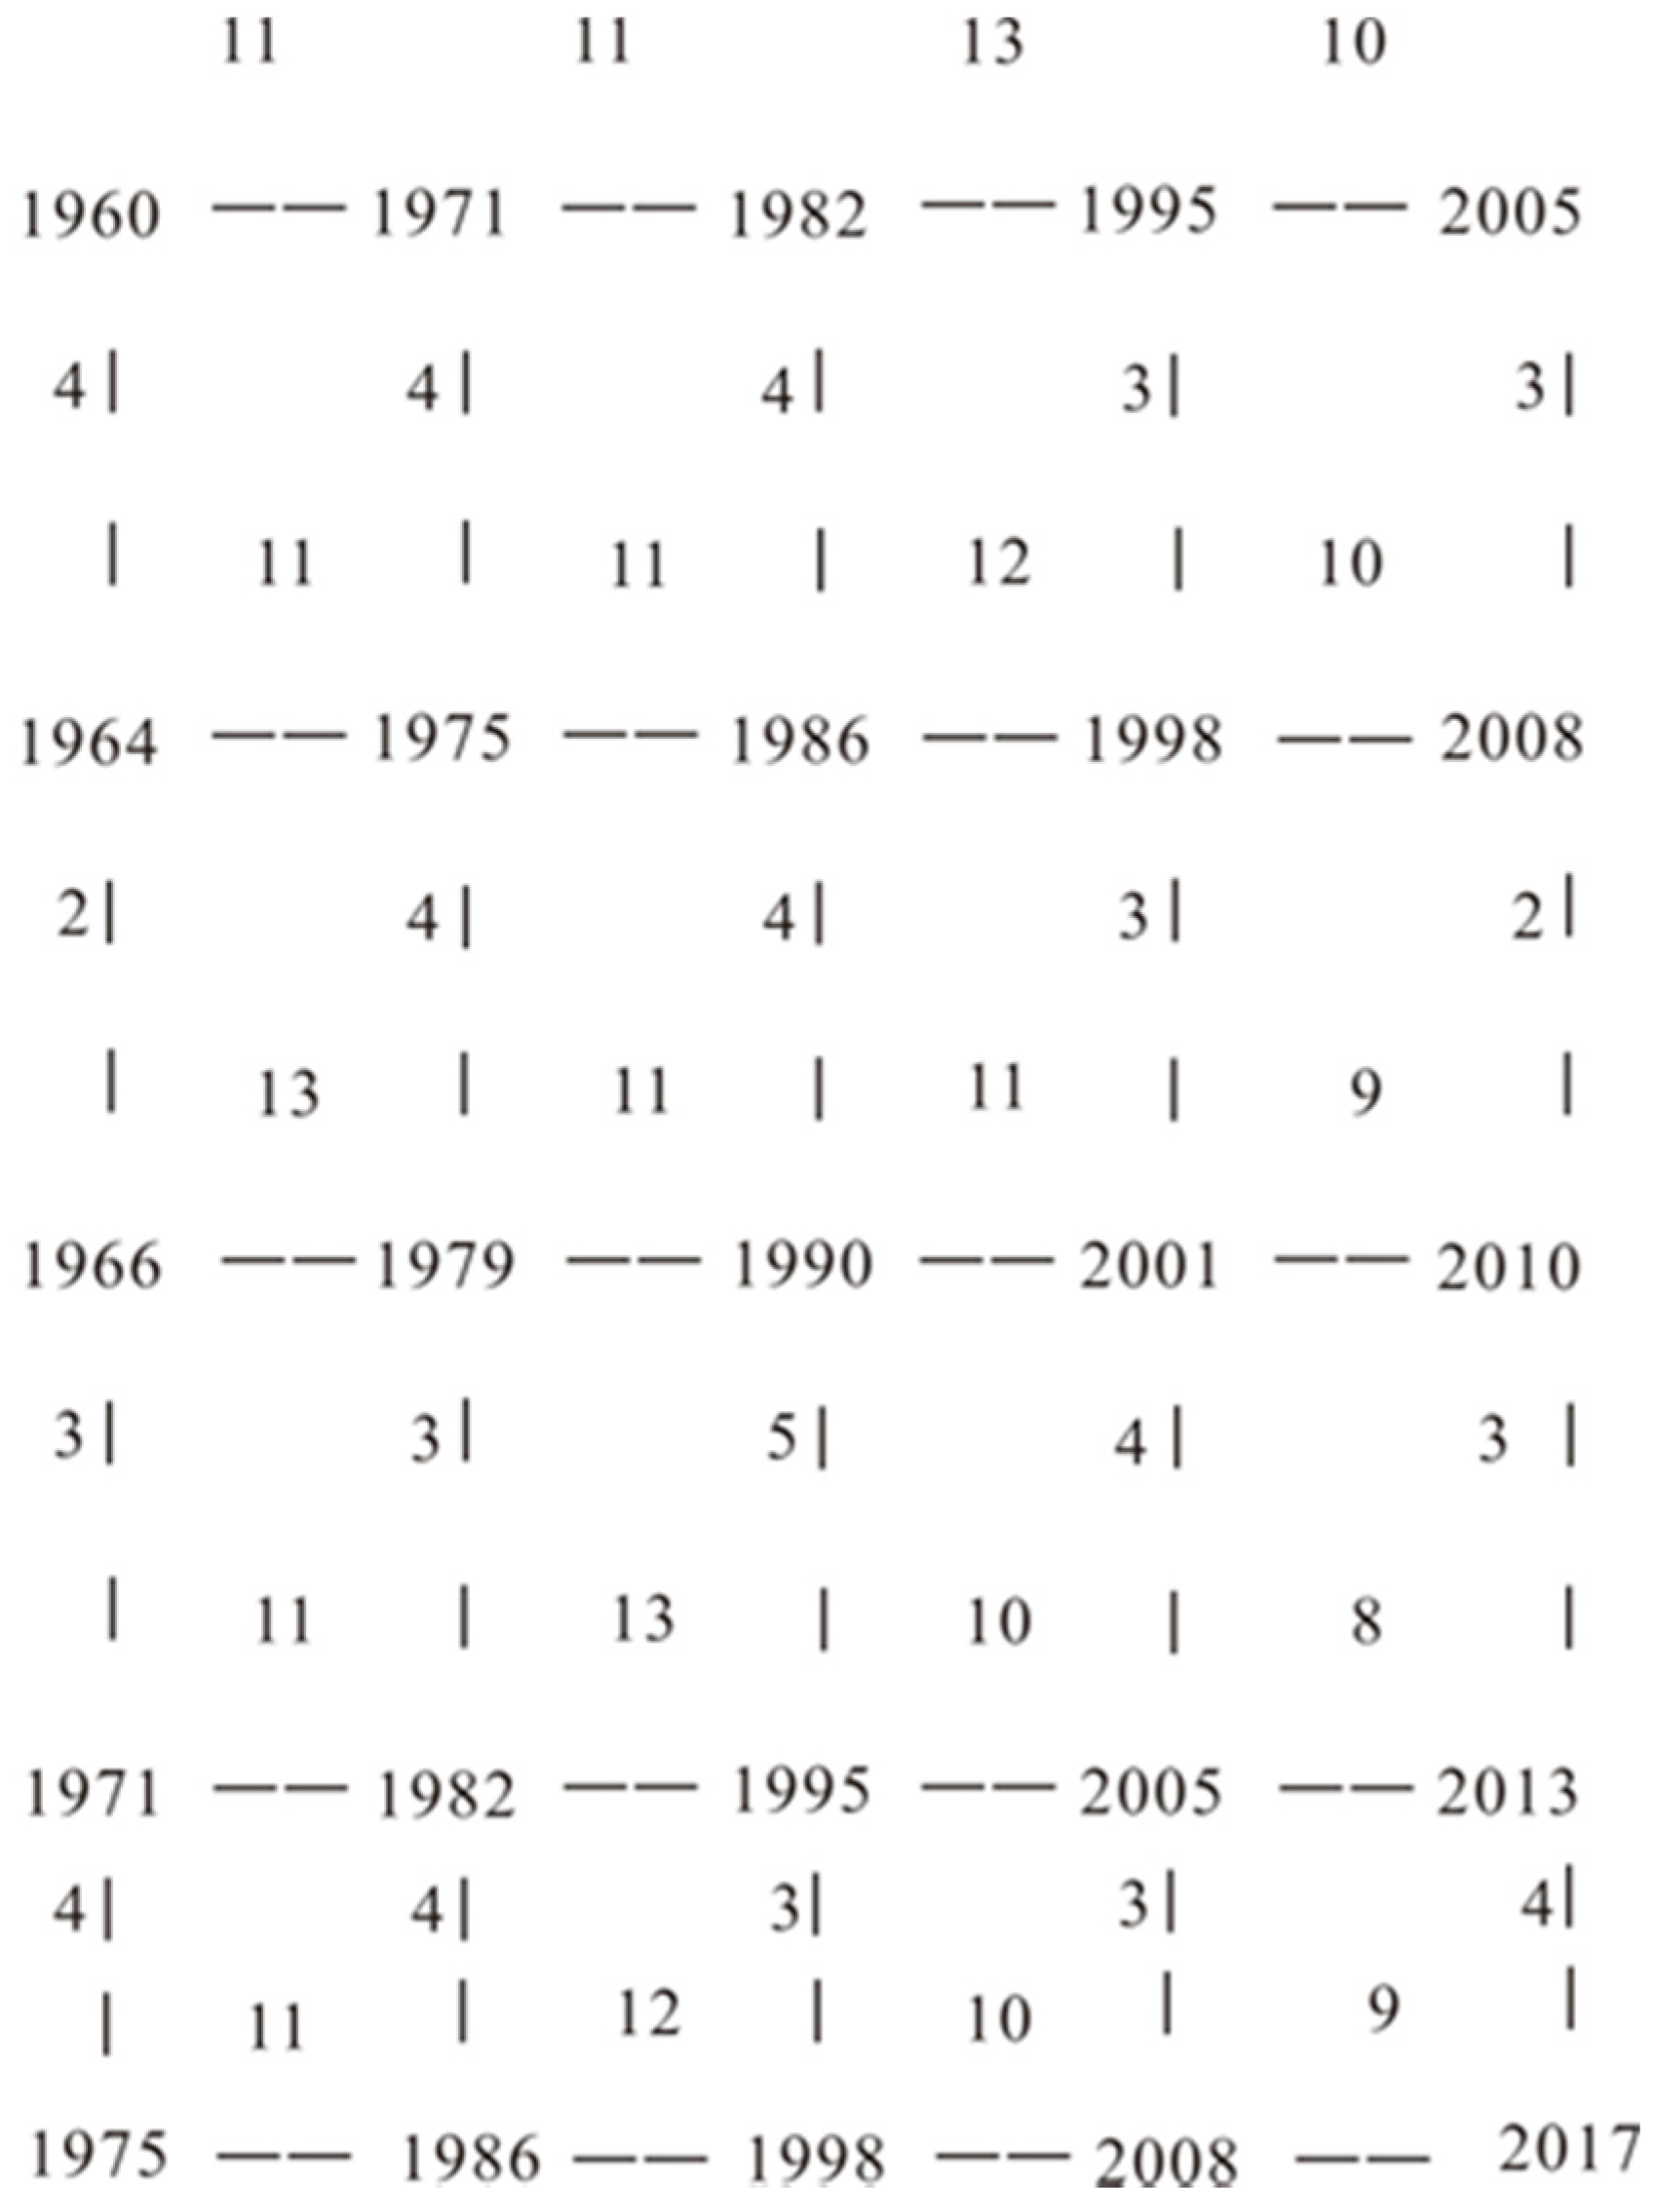
Table 2, the Chinese “Hydrological Forecasting Standard” (GB/T 22482-2008) classifies flood grades into five levels according to the “departure value” (which is the difference between the runoff in July–August and the year’s average value, divided by the year’s average). In the current study, “flood-causing precipitation years” means the water abundance during July and August, namely, 1960, 1964, 1966, 1971, 1975, 1979, 1982, 1986, 1990, 1995, 1998, 2001, 2005, 2008, 2010, and 2013.
(2) In commensurability methods, by representing flood-causing precipitation years as nodes and designating the vertical and horizontal axis as corresponding year intervals, a commensurable network can be constructed (
Figure 2).
4. Analysis
Here, we analyze the rainstorm weather systems and storm flood characteristics in the Second Songhua River Basin (Northeastern China), and explore the relationships between the rainstorm weather system, the type of rainstorm, the cause of the flood, and the time of occurrence. Basic characteristics of rainstorm floods of the river basin are summarized. Then, the periodicity of catastrophic years is identified using the commensurability method and is shown to have an average of 11 years. Compared with simple flood forecasting, flood-causing precipitation has a longer forecast period, which can gain the requisite time to discharge a reservoir and regain storage capacity, lower the limitation level, and manage the occurrence of flooding.
4.1. Rainstorm Weather Systems
Water vapor in the Second Songhua River Basin is brought in by the warm air from the Pacific Ocean and Bengal Bay in the Indian Ocean and enters from the southwest and south. In addition, typhoons are an important source of storm floods. Topography in the basin varies greatly; the upper reaches are in mountainous areas at elevations that exceed 2000 m, the middle reaches flow through hilly mountains, and the lower reaches are contained in hills and plains. Because of the mountain effect, weather systems for heavy rains in the upper, middle, and lower reaches are not the same. In the upstream region of the Toudao River and the Erdao River, because of the higher terrain, especially from northwest to southeast, the topography uplifts in stage form. A warm and wet airflow is blocked during the movement of storm systems from west to east, and the water vapor condensates and reaches the landscape before the slope; thus, rainstorms in this region are usually formed by subtropical high rear systems and northern-moving typhoons. In the middle reaches of the Yinma River and the Yitong River areas, which comprise the middle reaches of the basin, the main landform is low mountains with low watershed elevations, and the weather systems that result in large storms are frontal cyclones (including the northeast cyclone, the Mongolia cyclone, and the North China cyclone), as well as subtropical high rear systems of the Pacific Ocean. The lower reaches of the basin flow through the hilly plain area and the westerly weather system becomes the main factor influencing this area. Therefore, the weather system that causes rainstorms here is the cold vortex or frontal cyclone under the westerly trough, such as the northeast cyclone, the Mongolia cyclone, and the North China cyclone.
4.2. Storm Flood Characteristics
From the analysis of statistical rainstorm data, rainfall distributions in this basin can be characterized as follows: rainfall in upstream reaches exceeds that in downstream reaches, and rainfall in mountain areas exceeds that in plain areas. Furthermore, rainstorm centers exist in upstream areas, midstream areas, and downstream areas. The upstream areas are mainly upstream of the White Mountain Reservoir, the Toudao River, and the Erdao River. Under the influence of various weather systems and landforms, the rainstorm is most frequent in the upstream areas, such as the rainstorm that occurred in 1957, 1960, 1995, and 2010. Midstream areas have the most range, encompassing areas west of the Longgang Mountains and Zhangguangcai Range, and low mountain areas in the east of the Dahei Mountains and consisting of the Huifa River, the Jiaohe River, the Mangniu River, the Aolong River, the Fala River, and the upstream regions of the Yinma River and the Yitong River. With flat topography, downstream areas refer to the Songnen Plain located in the west of the Dahei Mountains and incorporate drought areas.
The river is the mountainous river in the upper reaches of the White Mountain Reservoir. The flood process here is usually characterized by a single-peak type with precipitous fluctuation. Moreover, in specific years, rainstorms occur continuously, affected by several successive rainfalls. Extraordinary floods generally are the single-peak type lasting for about 10 days, with the time to peak flow taking approximately two days. In addition, the flood transmission time at the lower reaches of the Fengman Reservoir becomes longer than elsewhere. The Huifa and Yinma Rivers are two large branches of the river; they are mountainous rivers and experience single-peak floods with precipitous fluctuation.
The White Mountain basin developed late, and the earliest investigated historical flood year is 1911.
Table 3 shows the top 10 floods since 1911 (according to peak flows). Six of the top 10 floods were caused by typhoons moving directly to the north, and four were caused by subtropical high rear weather systems. Therefore, the flood season typhoons and subtropical high rear systems require close attention for hydro-meteorological forecasting.
The top 10 large floods all occurred in July and August; the earliest date was 24 July and the latest was 29 August. Subtropical high rear systems are the main weather system in July, and typhoons are dominant in August. Because July–August is a period of heavy flooding, it is a critical period for reservoir operation. Flood-causing rainfalls that were studied in this research mainly consisted of the total rainfall in July and August.
4.3. Result Analysis of Commensurability
Commensurability analysis is usually used to test whether hydrological catastrophic information can be identified using the commensurability method, and usually there are three test indicators: commensurability numbers (m, which refers to the total number of the established commensurable formulas), error intervals of approximate periodicity [−ε, +ε], and commensurable credibility. In theory, the bigger the commensurability number m is, the more reliable the forecasting is; forecasting requires m > 1. Furthermore, the smaller the error ε is, the more reliable the forecasting is; forecasting requires that the error ε is not more than two years in hydrological catastrophic analysis. If commensurable numbers of the measured sequences have a mean value of , and the predicted commensurable numbers is m, then the published catastrophic forecasting generally chooses the collection in which (i.e., the commensurable credibility) exceeds 50%.
From
Figure 2, at least two commensurable relations can be created for which
m > 1: a vertical one and a horizontal one. For example, vertically (2005 + 3 + 2 = 2010), (2005 + 3 + 3 = 2011), (2005 + 4 +4 = 2013), and (2005 + 4 + 2 = 2011). Horizontally, (2001 + 9 = 2010), (2001 + 11 = 2012), and (2001 + 12 = 2013). Therefore, the intersection of the vertical and horizontal relations is 2010, so the error interval of the approximate periodicity is [−2,+2] and the commensurable credibility is far more than 50%. Thus, this hydrological catastrophic information can be analyzed using the commensurability method.
5. Results and Discussion
(1) Based on the statistical analysis of the rainstorm weather systems and storm flood characteristics in the Second Songhua River Basin (Northeastern China), the basic characteristics of flooding in the second Songhua River Basin are as follows:
- ①
Because of the mountain effect, weather systems for heavy rains in the upper, middle, and lower reaches are not the same. In the upstream region, the rainstorm weather systems are usually formed by subtropical high rear systems and northern-moving typhoons. In the middle reaches, the rainstorm weather systems that result in large storms are frontal cyclones (including the northeast cyclone, the Mongolia cyclone, and the North China cyclone) as well as subtropical high rear systems of the Pacific Ocean. The lower reaches, the rainstorm weather systems that cause rainstorms here, is the cold vortex or frontal cyclone under the westerly trough, such as the northeast cyclone, the Mongolia cyclone, and the North China cyclone.
- ②
The floods are mainly formed by heavy rainstorms. Typhoon rainstorm intensity is large, which lasts for a short time. The influence range is small, and it is easy to form local floods, mostly occurring in July and August. Subtropical high rear systems are the main weather system in July, and typhoons are dominant in August. Because July to August is the period of heavy flooding, it is a critical period for reservoir operation. Flood-causing rainfalls that were studied in this study mainly consisted of the total rainfall in July and August.
(2)
Figure 2 (for the White Mountain Reservoir) indicates that the maximum vertical interval is five years and the minimum is two years. The maximum horizontal interval is 13 years and the minimum is 8 years—an average of 11 years. The most frequently occurring period of flood-causing precipitation in White Mountain is 11 years. This 11 year approximate period can be divided into three commensurable values: the maximums are 5 years, 4 years, and 3 years; the minimums are 4 years, 3 years, and 2 years; and the averages are 4 years, 3 years, and 3 years.
(3) An analysis of flood data using the commensurability method for the upstream part of the Second Songhua River shows that flood-causing precipitation has a mean approximate periodicity of 11 years; the maximum horizontal interval is 13 years, and the minimum is 8 years. The 11 year approximate period can be divided into three commensurable values having maxima of 5 years, 4 years, and 3 years, respectively, and minima of 4 years, 3 years, and 3 years, respectively. Hong Yan Li [
28] conducted a study of drought and flood disasters and solar activity in this region, showing these disasters are significantly associated with sunspot numbers. The flood years are mainly concentrated in periods around peak years in these sunspot numbers. Periods of approximately 11 years were detected for floods and droughts, and 1 year, 4 years, and 6 years for floods. This shows that there is an average of almost 11 annual cycles of flood-causing precipitation in the second Songhua River Basin.


