Article

Transport of Silica Colloid through Saturated Porous Media under Different Hydrogeochemical and Hydrodynamic Conditions Considering Managed Aquifer Recharge

1
Key Laboratory of Groundwater Resources and Environment, Ministry of Education, Jilin University, Changchun 130021, China
2
College of Environment and Resources, Jilin University, Changchun 130021, China
*
Author to whom correspondence should be addressed.
Water 2016, 8(12), 555; https://doi.org/10.3390/w8120555
Submission received: 25 October 2016 / Revised: 22 November 2016 / Accepted: 23 November 2016 / Published: 29 November 2016
(This article belongs to the Special Issue Water Quality Considerations for Managed Aquifer Recharge Systems)

Abstract

:
Colloids may have an important role in regulating the structure and function of groundwater ecosystems, and may influence the migration of low solubility contaminants in groundwater. There is, however, a degree of uncertainty about how colloids behave under the variable hydrogeochemical and hydrodynamic conditions that occur during managed aquifer recharge. We used an online monitoring system to monitor the transport of silica colloid in saturated porous media under different hydrogeochemical conditions, including a range of pH values (5, 7, and 9), ionic strengths (<0.0005, 0.02, and 0.05 M), cation valences (Na+, Ca2+), flow rates (0.1, 0.2, and 0.4 mL/min). The results showed that silica colloid was more likely to deposit on the surface of porous media in acidic conditions (pH = 5) than in alkaline conditions (pH = 9), indicating that the risks of pollution from colloidal interactions would be higher when the pH of the recharge water was higher. Colloid deposition occurred when the ionic strength of the colloidal suspension increased, and bivalent cations had a greater effect than monovalent cations. This suggests that bivalent cation-rich recharge water might affect the porosity of the porous medium because of colloid deposition during the managed aquifer recharge process. As the flow rate increased, the migration ability of silica colloid increased. We simulated the migration of silica colloid in porous media with the COMSOL Multiphysics model.

1. Introduction

In recent years, managed aquifer recharge (MAR) has been used to mitigate a wide range of geological problems in the environment, such as ground subsidence, surface cracks, seawater intrusion, and groundwater depressions. While MAR has some clear benefits, the injection of recharge water will negatively impact the equilibrium and chemical conditions of the original groundwater, which may then have further consequences for the quality of the groundwater in the recharged aquifer [1]. Colloids are distributed widely in groundwater, and can affect the transport of heavy metal and inorganic constituents in groundwater [2,3]. It can also affect a variety of other contaminants such as organic matter, bacteria, viruses, engineered nanoparticles, etc. [4]. Despite our best efforts, to date, we still have not been able to determine the influence of changes in the groundwater dynamic and chemical conditions during MAR on colloid migration.
Natural colloids in groundwater can be divided into two types: inorganic and organic colloids. One of the most important sources of inorganic colloids in groundwater is precipitation of minerals in supersaturated conditions. Silica colloids are the most common inorganic colloids in lithofacies aquifer systems [5]. Previous studies have examined the migration of SiO2 colloids in saturated quartz sand columns [6], and found that migration of SiO2 and kaolinite colloids in groundwater increased with decreases in IS (Ionic Strength) and increases in the groundwater flow rate. This earlier study also showed that, when the IS changed and the flow rate remained the same, the response of the kaolinite colloid to the IS and flow rate was significantly higher than that of the SiO2 colloid, mainly because the kaolinite colloid particles were larger and the migration is also influenced by the change of electrostatic force [7]. Another study indicated that, as with natural colloids in water, changes in the external environment affected the migration and release of soil colloids in the water environment. For example, migration of soil colloids and heavy metals in the groundwater increased as the pH and the organic carbon and humus contents of the groundwater increased [8]. Field and laboratory studies have demonstrated that increases in the colloid particle size or decreases in the porous media diameter can result in greater colloidal adsorption, and that, depending on the size of the colloidal particles, pore spaces may become blocked [9]. Therefore, natural colloid migration in groundwater should be studied in a stable water environment.
Previous research has indicated that the transport and physicochemical properties of colloidal were affected by pH, IS, flow rate, and the medium through which it was flowing [10]. However, there is a lack of information about the transport and deposition of silica colloid during MAR, and, to date, we do not have a systematic understanding of how silica colloid is transported in porous media under different hydrochemical and hydrodynamic conditions. The objective of this study, therefore, was to use a range of experiments to investigate the influence of hydrochemical and hydrodynamic conditions on the transport and deposition of colloids in porous media during MAR. In the experiments, silica colloid was passed through columns packed with negatively-charged media (glass beads) using different pH values (5, 7, and 9), suspension ionic strengths (<0.0005, 0.02, and 0.05 M), cation valences (Na+, Ca2+), and flow rates (0.1, 0.2, and 0.4 mL/min) to simulate different recharge conditions. We also used COMSOL Multiphysics numerical simulation software to quantitatively analyze colloid migration in groundwater.

2. Materials and Methods

2.1. Experimental Procedure

In this study, we selected individual glass beads with a diameter of 0.45 mm that were similar in size to the porous media (0.35–0.50 mm) found at the field experimental site. The glass beads were soaked in 0.1 M HNO3 for 3 h and then rinsed in ultrapure water to remove impurities from their surfaces. After this, they were soaked in 0.1 M NaOH for a further 3 h and then rinsed with ultrapure water. After rinsing, the beads were dried in an oven at less than 105 °C [11].
We chose a nanometer silicon with a purity of 99.5% (30 nm, national standard material network) for the inorganic colloid suspension. Dry silicon nanoparticles (1000 mg) were added to 1000 mL of deionized water, and the mixture was subjected to ultrasonic treatment for 30 min to ensure the suspension was evenly distributed. Then based on the concentration level, total organic carbon in groundwater, and the chemical composition of silicon, the preparation of silica colloid, dioxide in suspension was diluted to 20 mg/L by deionized water. To reflect changes in the hydrochemical conditions during MAR, HCl, and NaOH were used to regulate the pH value at 5, 7, and 9, and NaCl and CaCl2 in various ionic strengths were used as background solutions at <0.0005, 0.02, and 0.05 M. After modification, the samples were treated in the ultrasonic bath once again. They were then stored in the dark at a temperature of 4 °C. Because changes in the particle diameter may influence the potential of the silicon, the particle size and potential of the samples were tested under different hydrochemical conditions with a zetasizer (Nano ZetaSizer, Malvern, UK) at an angle of 173° and with a 633 nm wavelength light source. Each sample was analyzed in triplicate, and the average value was taken as the final result. The physical and chemical properties of silica colloid under different hydrochemical conditions are shown in Figure 1 and Table 1.

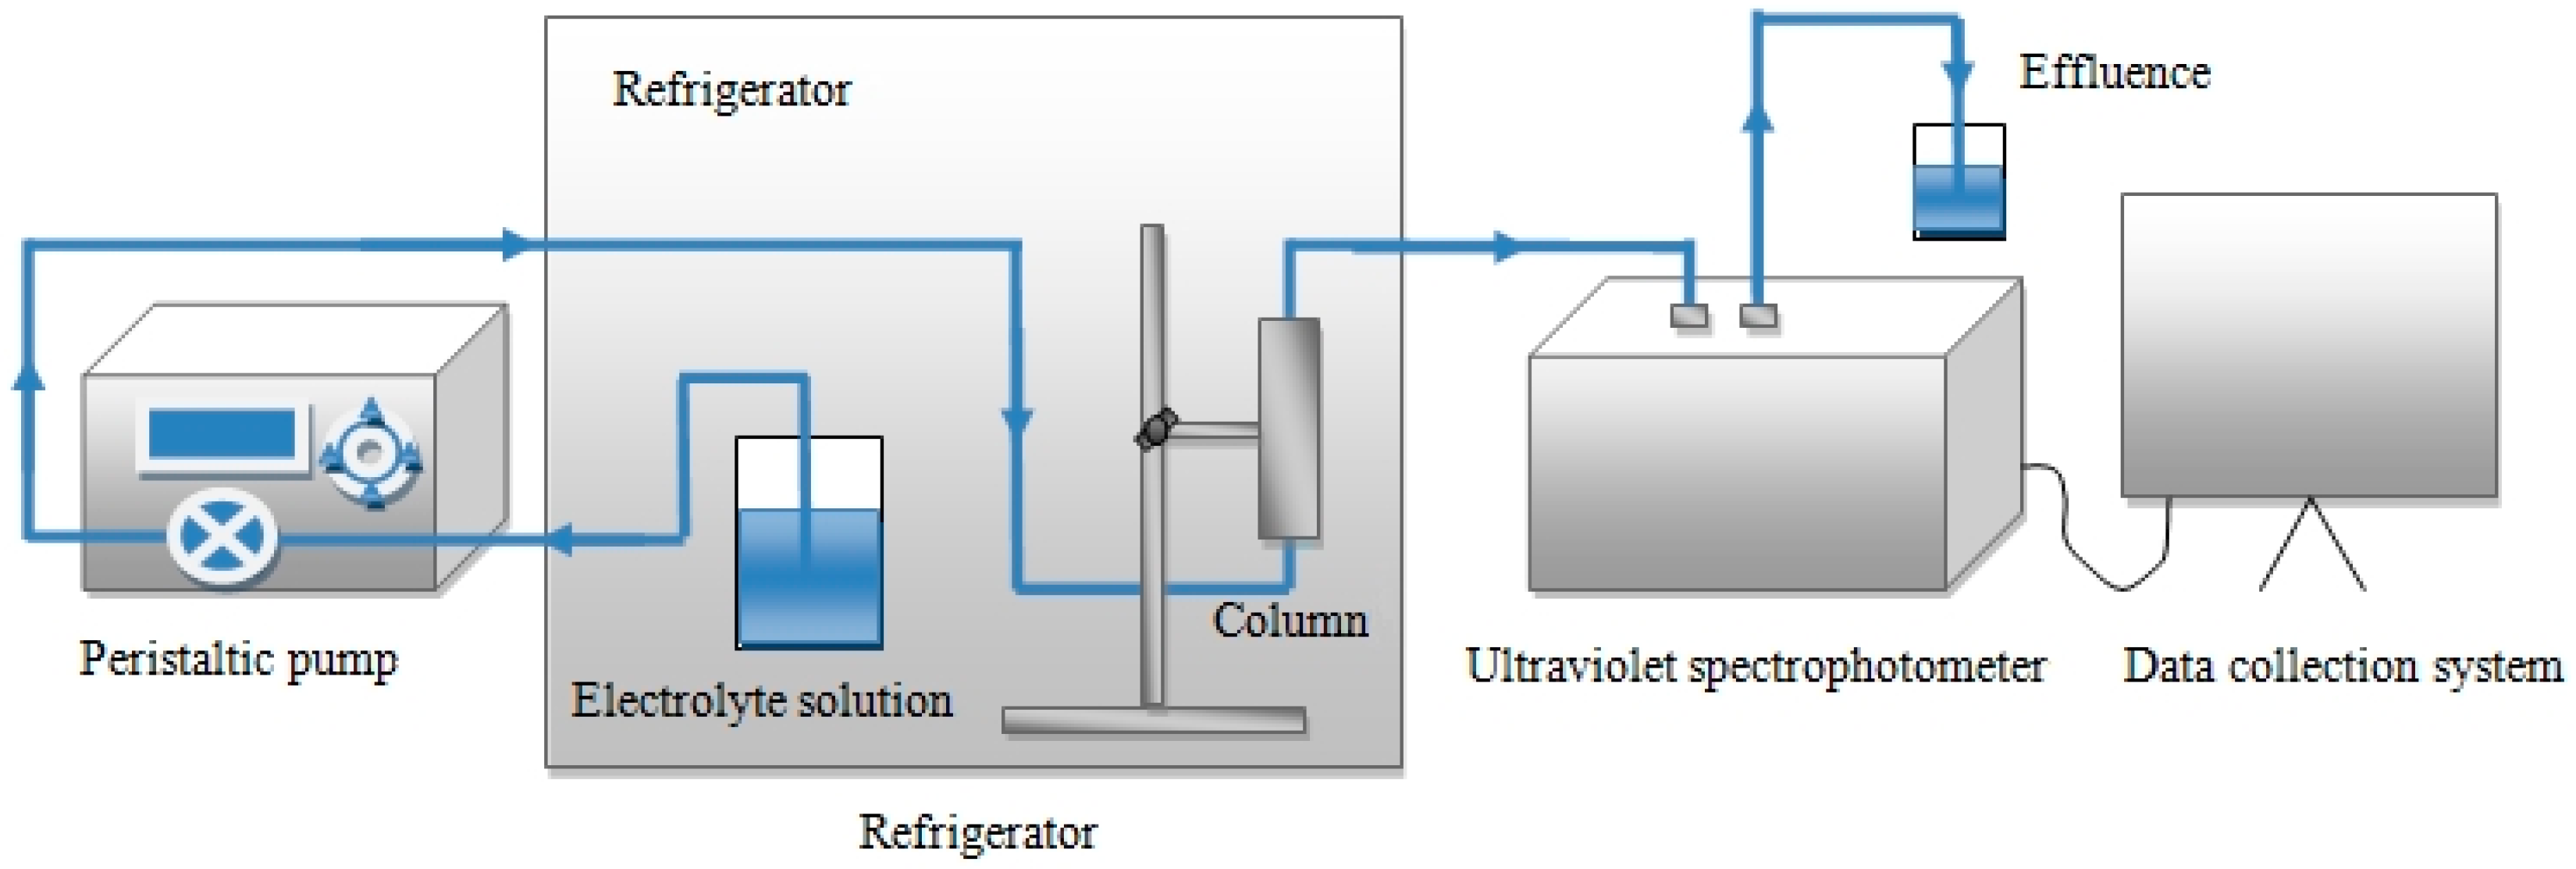
2.1.1. Experimental Equipment

In this experiment, we used two columns, 3.2 cm in diameter and 10.0 cm long and an effective filling length of 6.0 cm to replicate the aquifer. Water was supplied with a 500 mL beaker and a peristaltic pump. One side of the peristaltic pump was connected to a water supply beaker with a PVC pipe, while the other side was connected to the column below, so that the experimental water (ultra-pure water/colloidal suspension) flowed upwards through the column from the bottom under the force of the peristaltic pump, because it is conducive to saturation and driven out of bubbles. In this study, we used a UV on-line monitoring system (UV-1800, Shimadzu, Japan) to monitor the inorganic colloidal concentrations throughout the experiment. The effluent liquid was passed by an ultraviolet (UV) spectrophotometer that was connected to a computer at a wavelength of 212 nm. The colloid concentration absorbance standard curve was derived from the relationship between the absorbance and concentration of the silicon measured by the UV spectrophotometer, and was used to calculate changes in the silicon concentrations. Samples from the column effluent were collected every 30 min. Prior of each experiment, the column was saturated with deionized water for about 24 h to avoid air bubbles. The whole experiment system was then placed in a constant temperature device at 10 °C.
The experimental setup is shown in Figure 2.

2.1.2. Experimental Methods

A controlled variable method was used in this experiment. The flow rate was maintained constant at 0.2 mL/min, as this was closest to the groundwater flow rate, and was equivalent to a Darcy velocity of 1 m/day. To reflect the different recharge scenarios, the flow rate was adjusted from 0.1 to 0.4 mL/min during experiment (4).
We used four main groups of experiments in this study to determine:
(1)
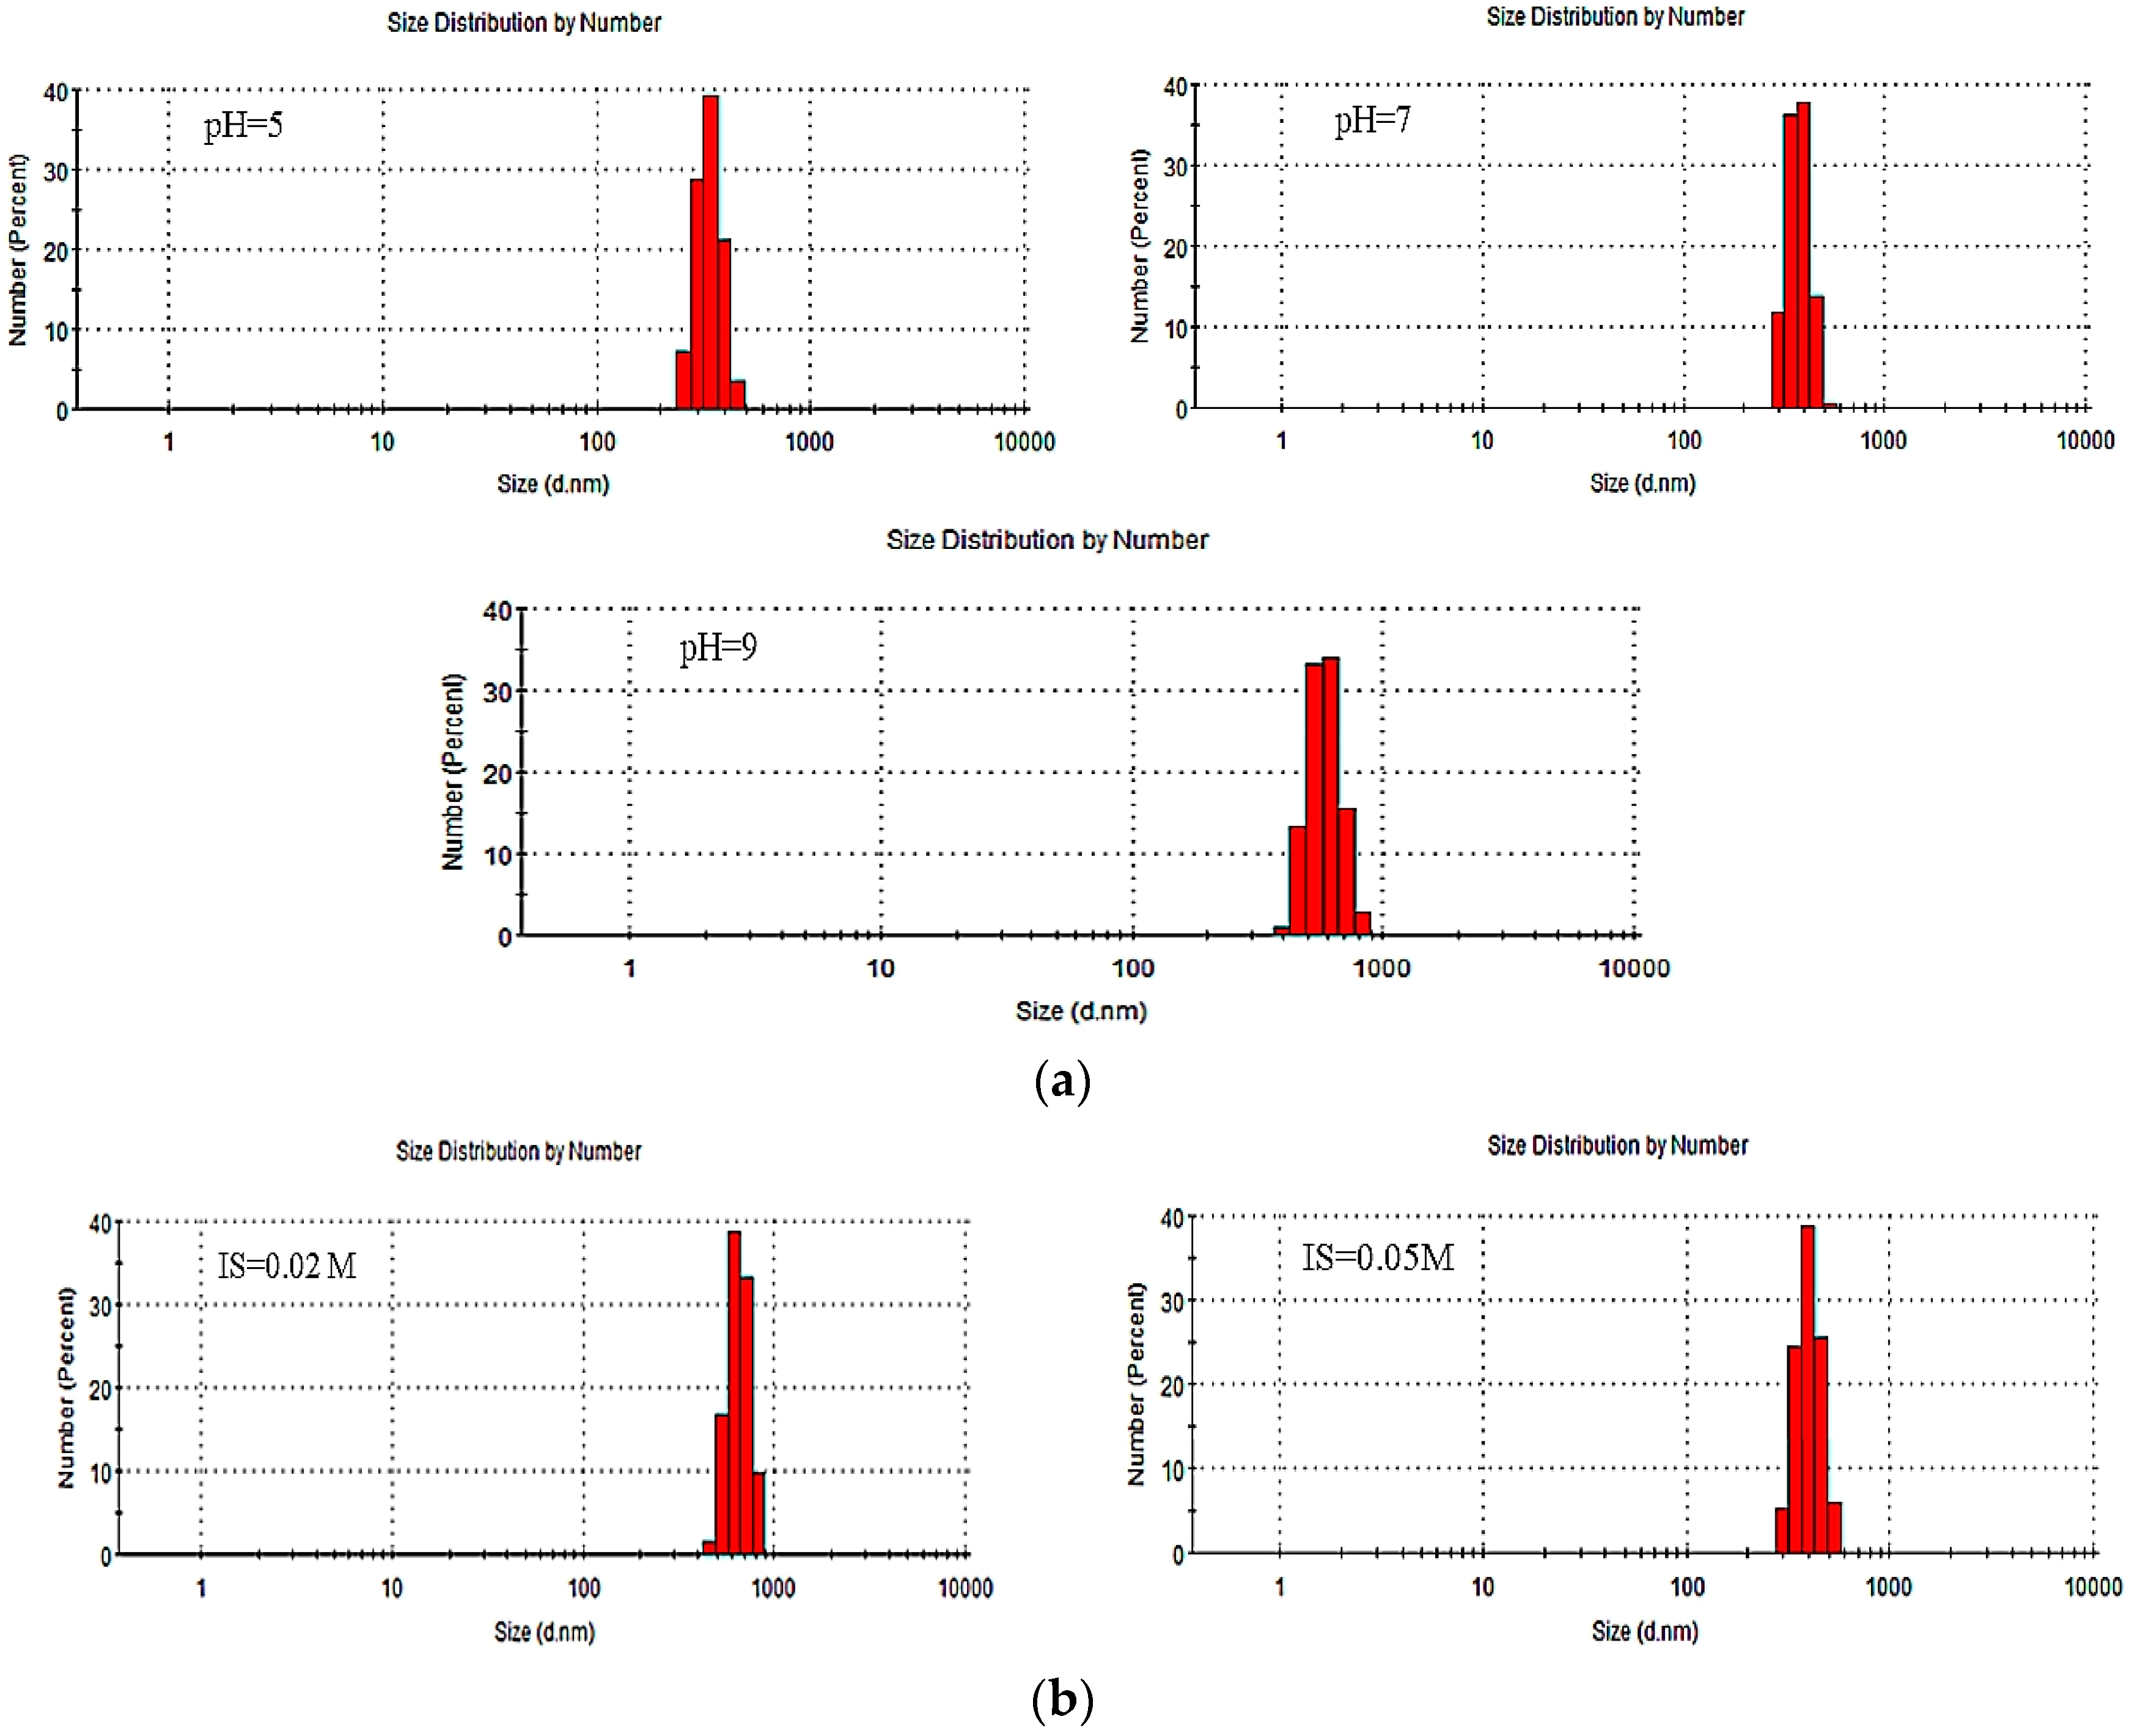
The effect of different pH values (pH = 5, 7, and 9);
(2)
The effect of variations in ionic strength (IS < 0.0005, 0.02, and 0.05 M);
(3)
The effect of cation valence (Na+, Ca2+), and
(4)
The effect of flow rate (0.1, 0.2, and 0.4 mL/min) on the transport of silica colloid in groundwater.
Each of the above experiments was divided into two parts. During stage I we observed deposition of inorganic colloids during the groundwater migration process. In this part, four times the pore volume of the colloidal suspensions was injected to achieve the colloid breakthrough curve. During stage II, we attempted to mimic the release of inorganic colloids by washing with more than 20 times the pore volume of deionized water.

2.2. Colloidal Deposition Rate Coefficient

In line with the primary sedimentary dynamics hypothesis and convection-diffusion equation, a deposition coefficient K was used to illustrate the amount of silica colloid deposited in the column. We calculated the colloidal deposition rate coefficient K with formula (1) [12]:
K = U ε L ln ( C C 0 )
where U is the flow rate (m/s), ε is the porosity of the porous medium (-), L is the effective length of column (m), and C C 0 corresponds to the fraction of colloids recovered in the effluent after the breakthrough curve reached a plateau.

2.3. Simulating Colloid Migration in the Aquifer

Numerical models specially developed to describe the migration of colloids in groundwater can be used to simulate and predict the colloid migration in groundwater. They can also be used to examine the effect of colloids on the migration of pollutants and other elements. In this study, we used COMSOL Multiphysics numerical simulation software to quantify the migration of colloids in groundwater and to investigate variations in the parameters in each reaction, so that we could obtain a theoretical basis for the migration of pollutants and other elements in ground water.
Using the results of this study as the input data, the convection diffusion equations for the finite element method were used to establish the layer of inorganic colloids, including deposition, ripening, and blocking, as follows [13]:
( θ C ) t + ( ρ B F d ) t + ( ρ B F R ) t + ( ρ B F S ) t = x [ θ D C x θ v C ]
( ρ B F d ) t =   k a t t ( 1 F d F m a x ) C k d e t ρ B F d
( ρ B F R ) t = k r i p F d c k r i p d ρ B F R
( ρ B F S ) t =   λ s θ v C
C—concentration of colloids in suspension; Fd—colloid concentration on solid media; FR—the concentration of filtration and the aging process; FS—blocked colloidal solid concentration; katt—colloid deposition rate constant; kdet—colloid release rate constant; krip—the colloid filtration and ripening rate constant; λs—colloid blocking filtration coefficient; ρB—dry bulk density of porous media (2400 kg/m3); θ—porosity of porous media; D—dispersion coefficient [14]; x—colloid migration distance; v—average velocity of groundwater.

3. Results and Discussion

We followed the experimental design of this study and completed 10 groups of migration experiments. Each experiment was repeated two or three times to ensure the results were reliable and consistent. The experiment number, conditions, and results are shown in Table 2 along with the specific calculation results. The particle diameter and potential of the silica colloid were tested under three different pH levels (5, 7, and 9) and three different IS conditions (<0.0005, 0.02, and 0.05 M).

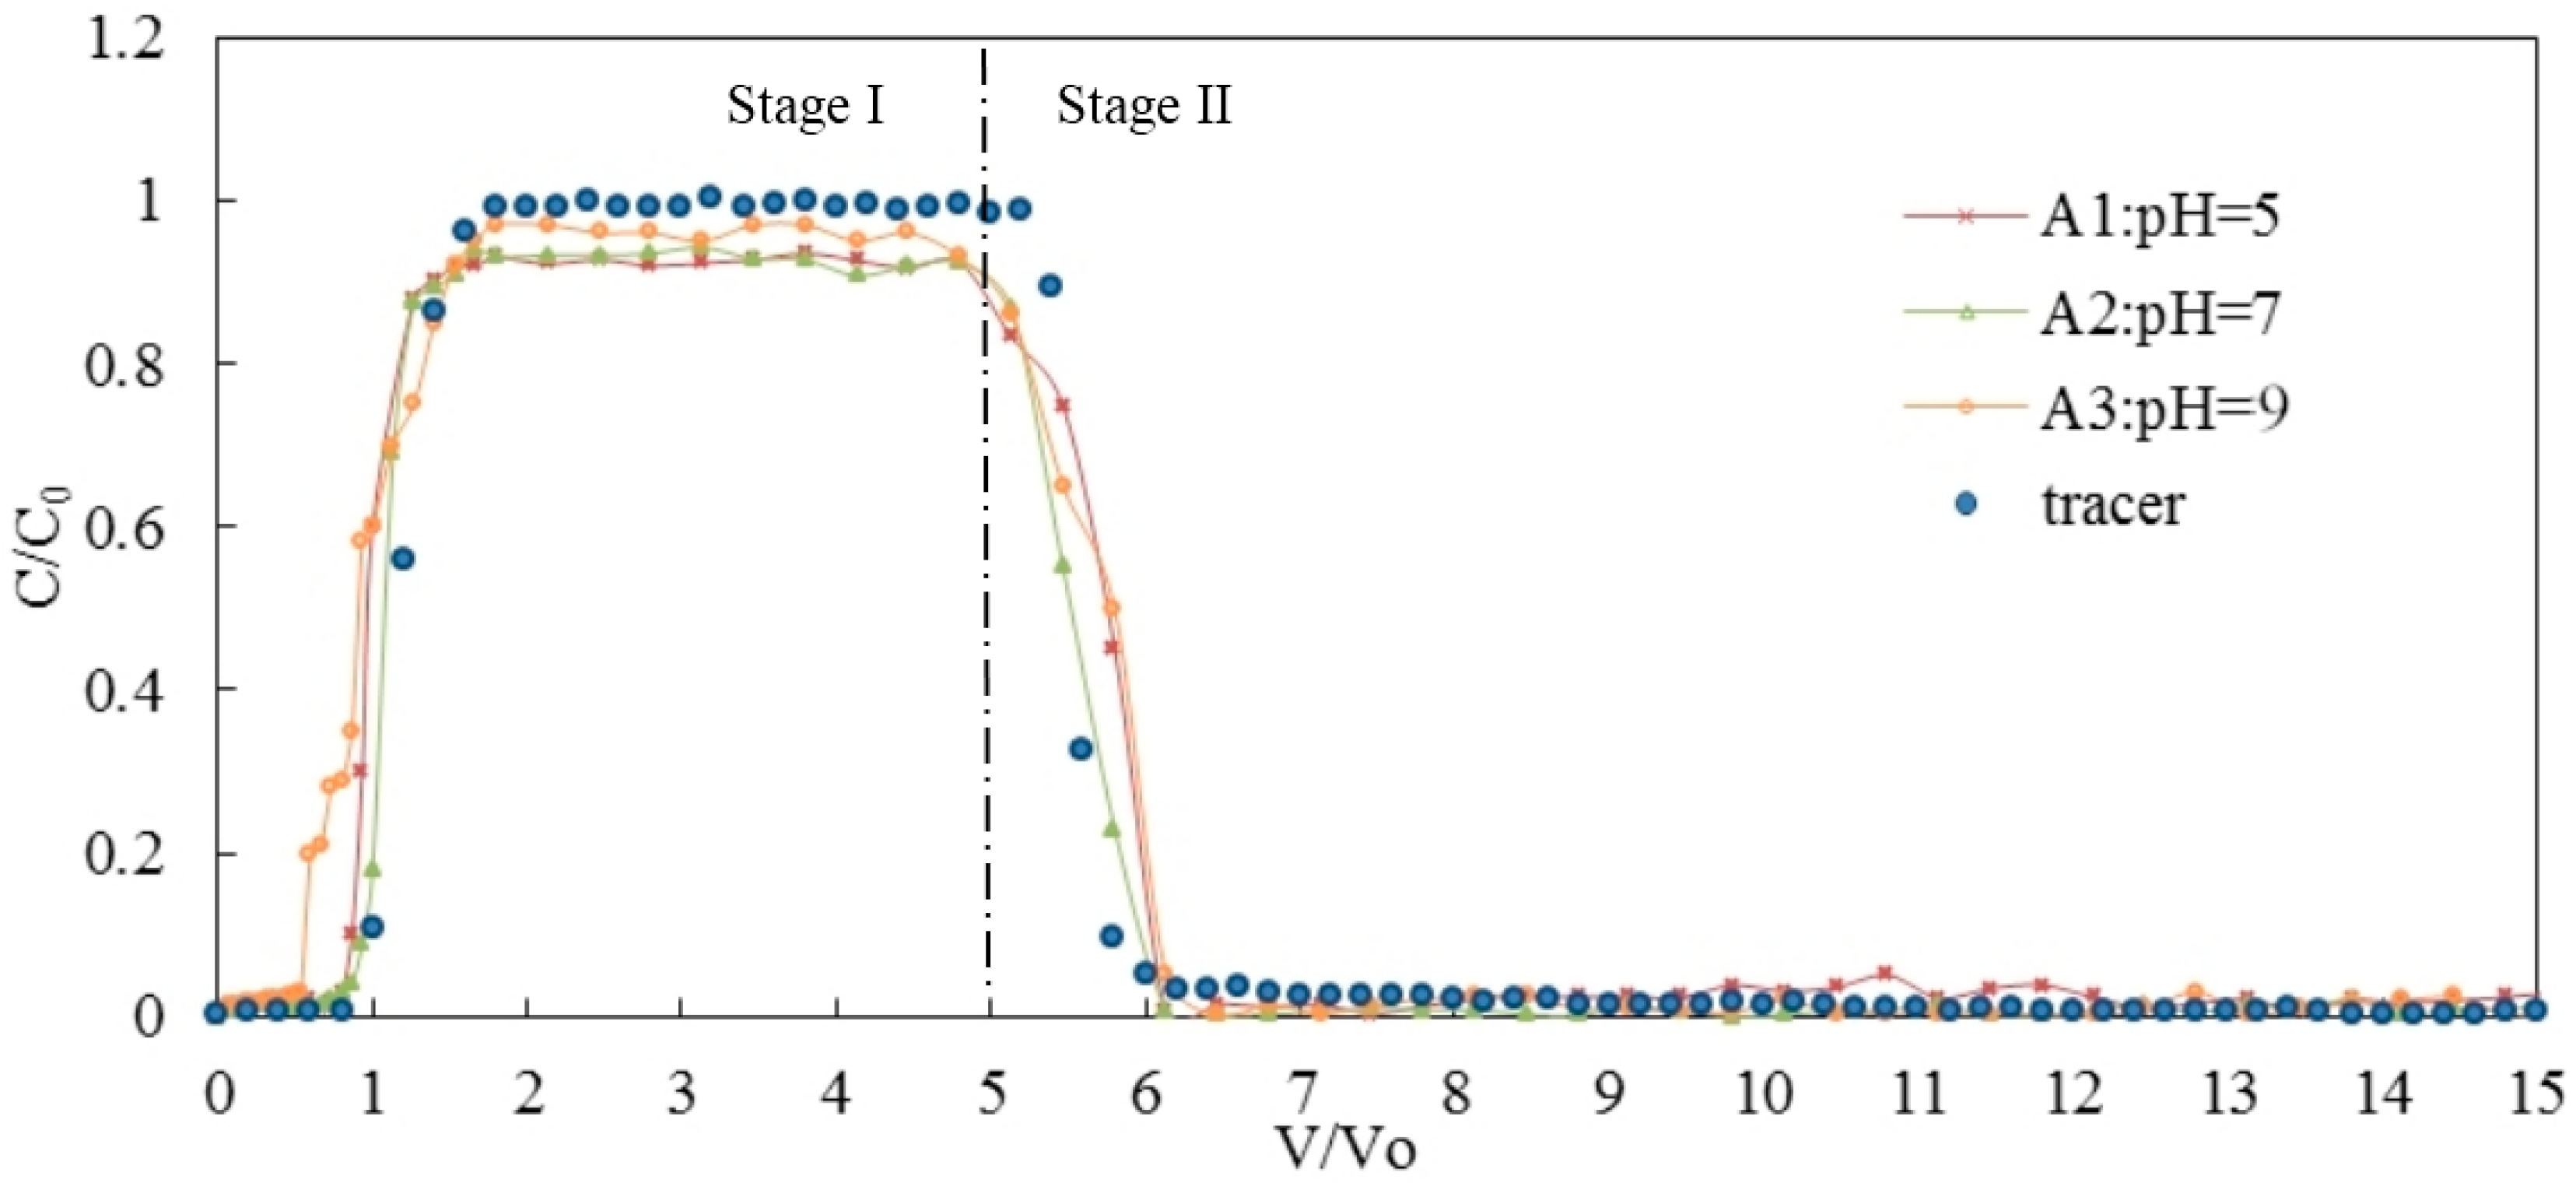
3.1. Effects of pH on the Transport of Silica Colloid

During this part of the experiment, the IS (IS < 0.0005 M) and the flow rate were kept constant, and the pH of the silica colloid suspensions was adjusted to either 5, 7, or 9 to investigate silica colloid migration patterns in the porous medium under different pH conditions.
As shown in Figure 3, as the pH value of the silicon suspension increased, the peak value of the breakthrough curve increased. After the silicon injection, the peak values of the breakthrough curve were 93%, 95%, and 97% for pH values of 5, 7, and 9, respectively. Out of the three experiments, a stable state was only achieved when the pH was 9 (−32.1 mV).
The results show that the mass recovery of A1 silica colloid reached 75% and 4% remained in the porous medium; the mass recovery of A2 silica colloid reached 84% and 6% remained in the porous medium, and the mass recovery of A3 silica colloid reached 86% and 3% remained in the porous medium. In the three groups, the ratios for the silicon that remained in the medium were almost equal, which is consistent with the results from previous studies [15]. According to the colloid deposition kinetics, the deposition rate coefficients of the silica colloid were 2.79 × 10⁻⁶, 2.03 × 10⁻⁶, and 1.21 × 10⁻⁶ for pH values of 5, 7, and 9, respectively.
As the pH value increased, the absolute value of the zeta potential and the particle size of the silica colloid also increased. The DLVO theory states that the repulsion between colloids increases, and colloids appear more stable and have better movement [16]. Other studies showed that increases in pH resulted in significant increases in the transport of latex colloids in Eustis sand, and the greater increases reported in earlier studies compared with those reported in this study may have been attributable to different porous media [17].

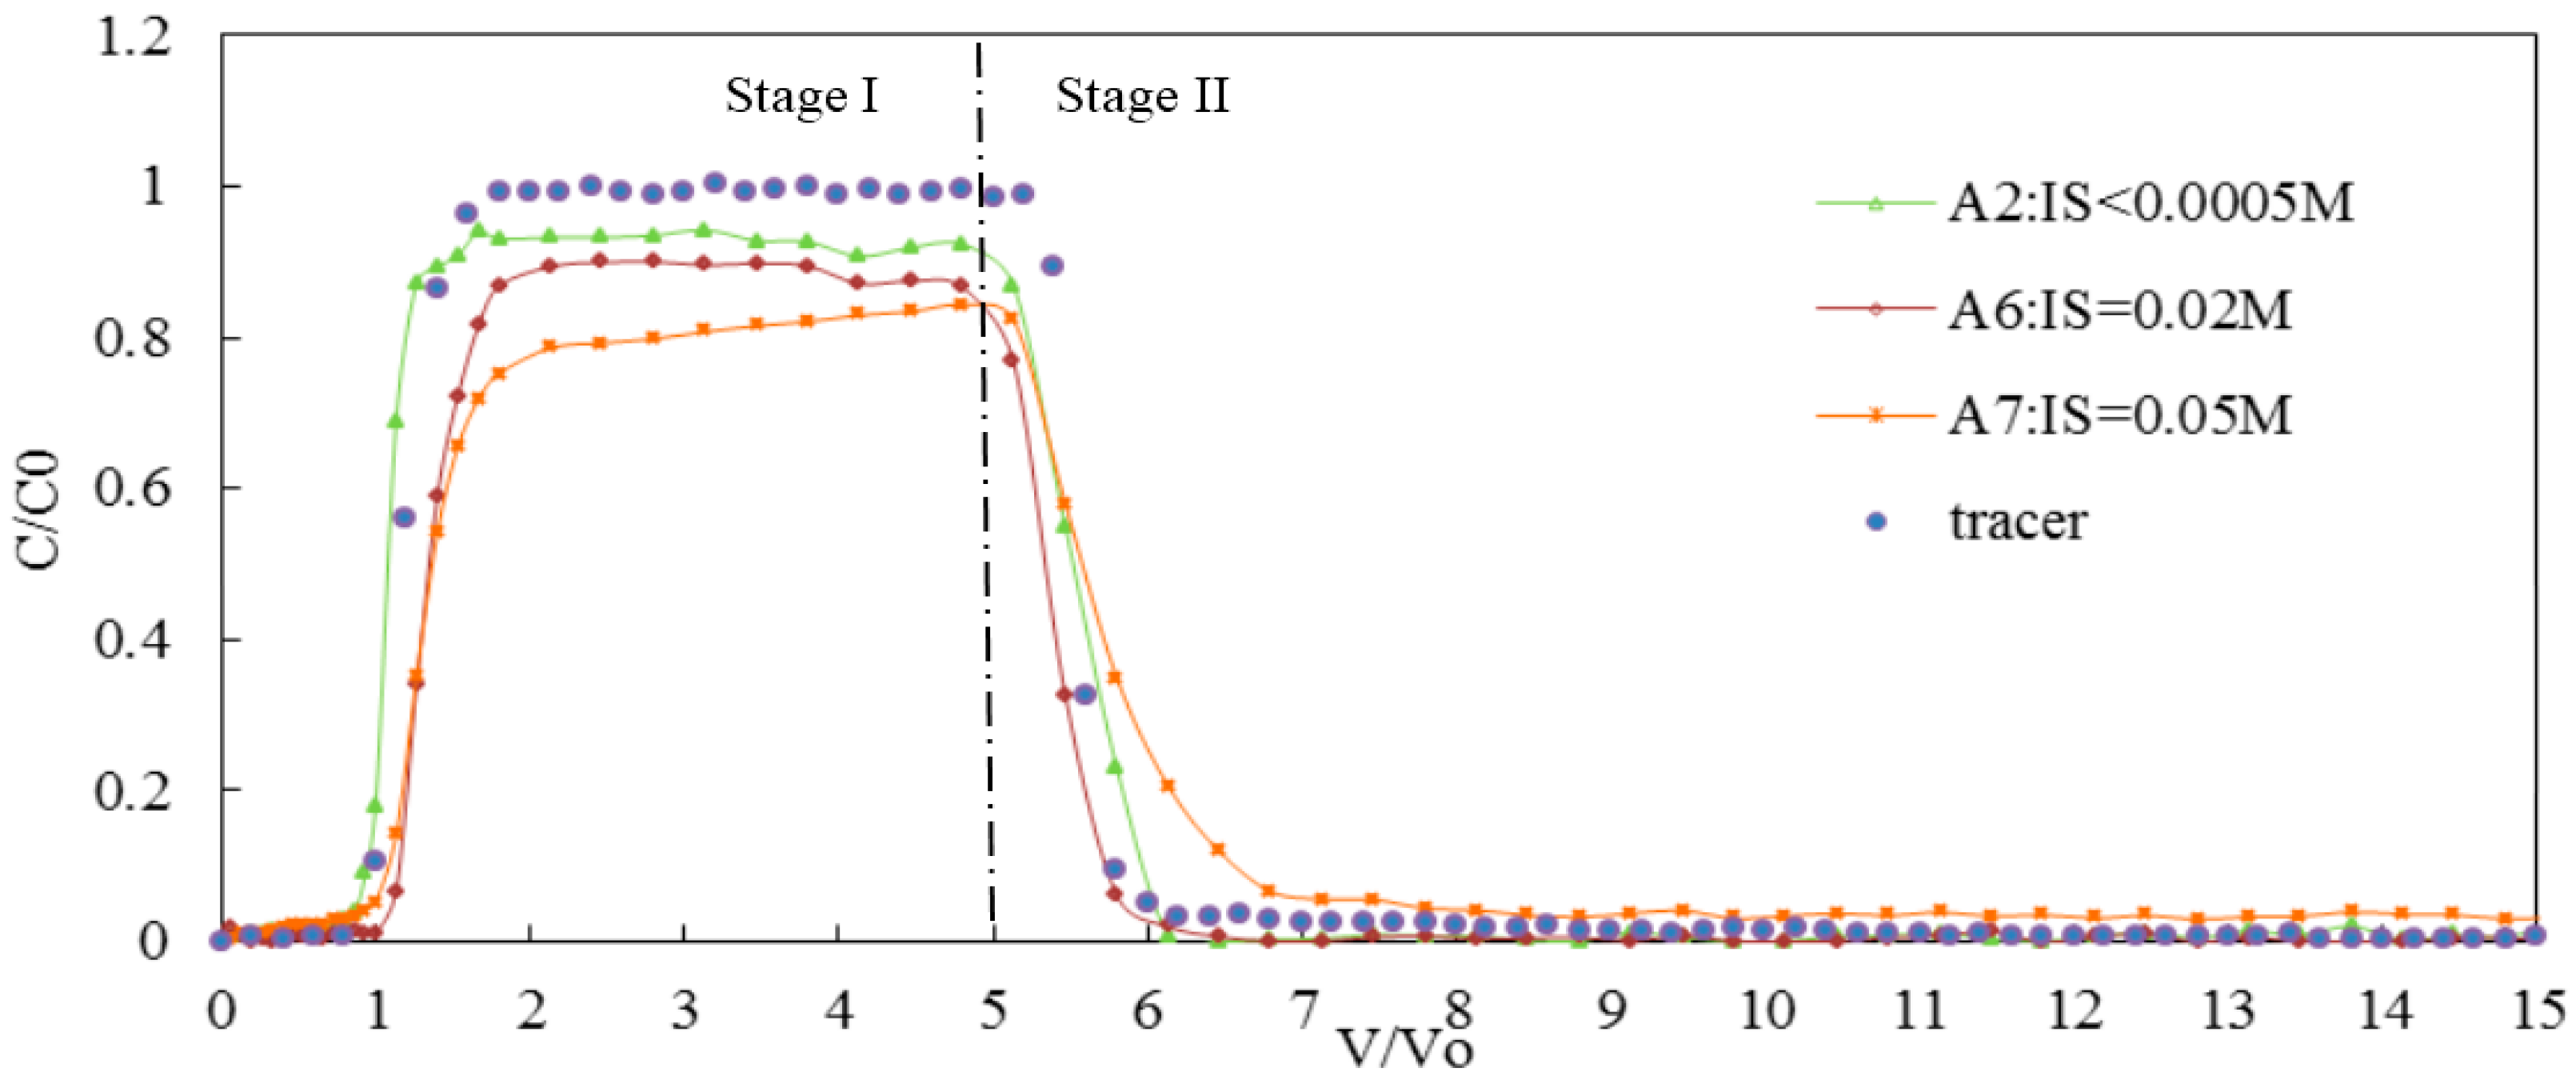
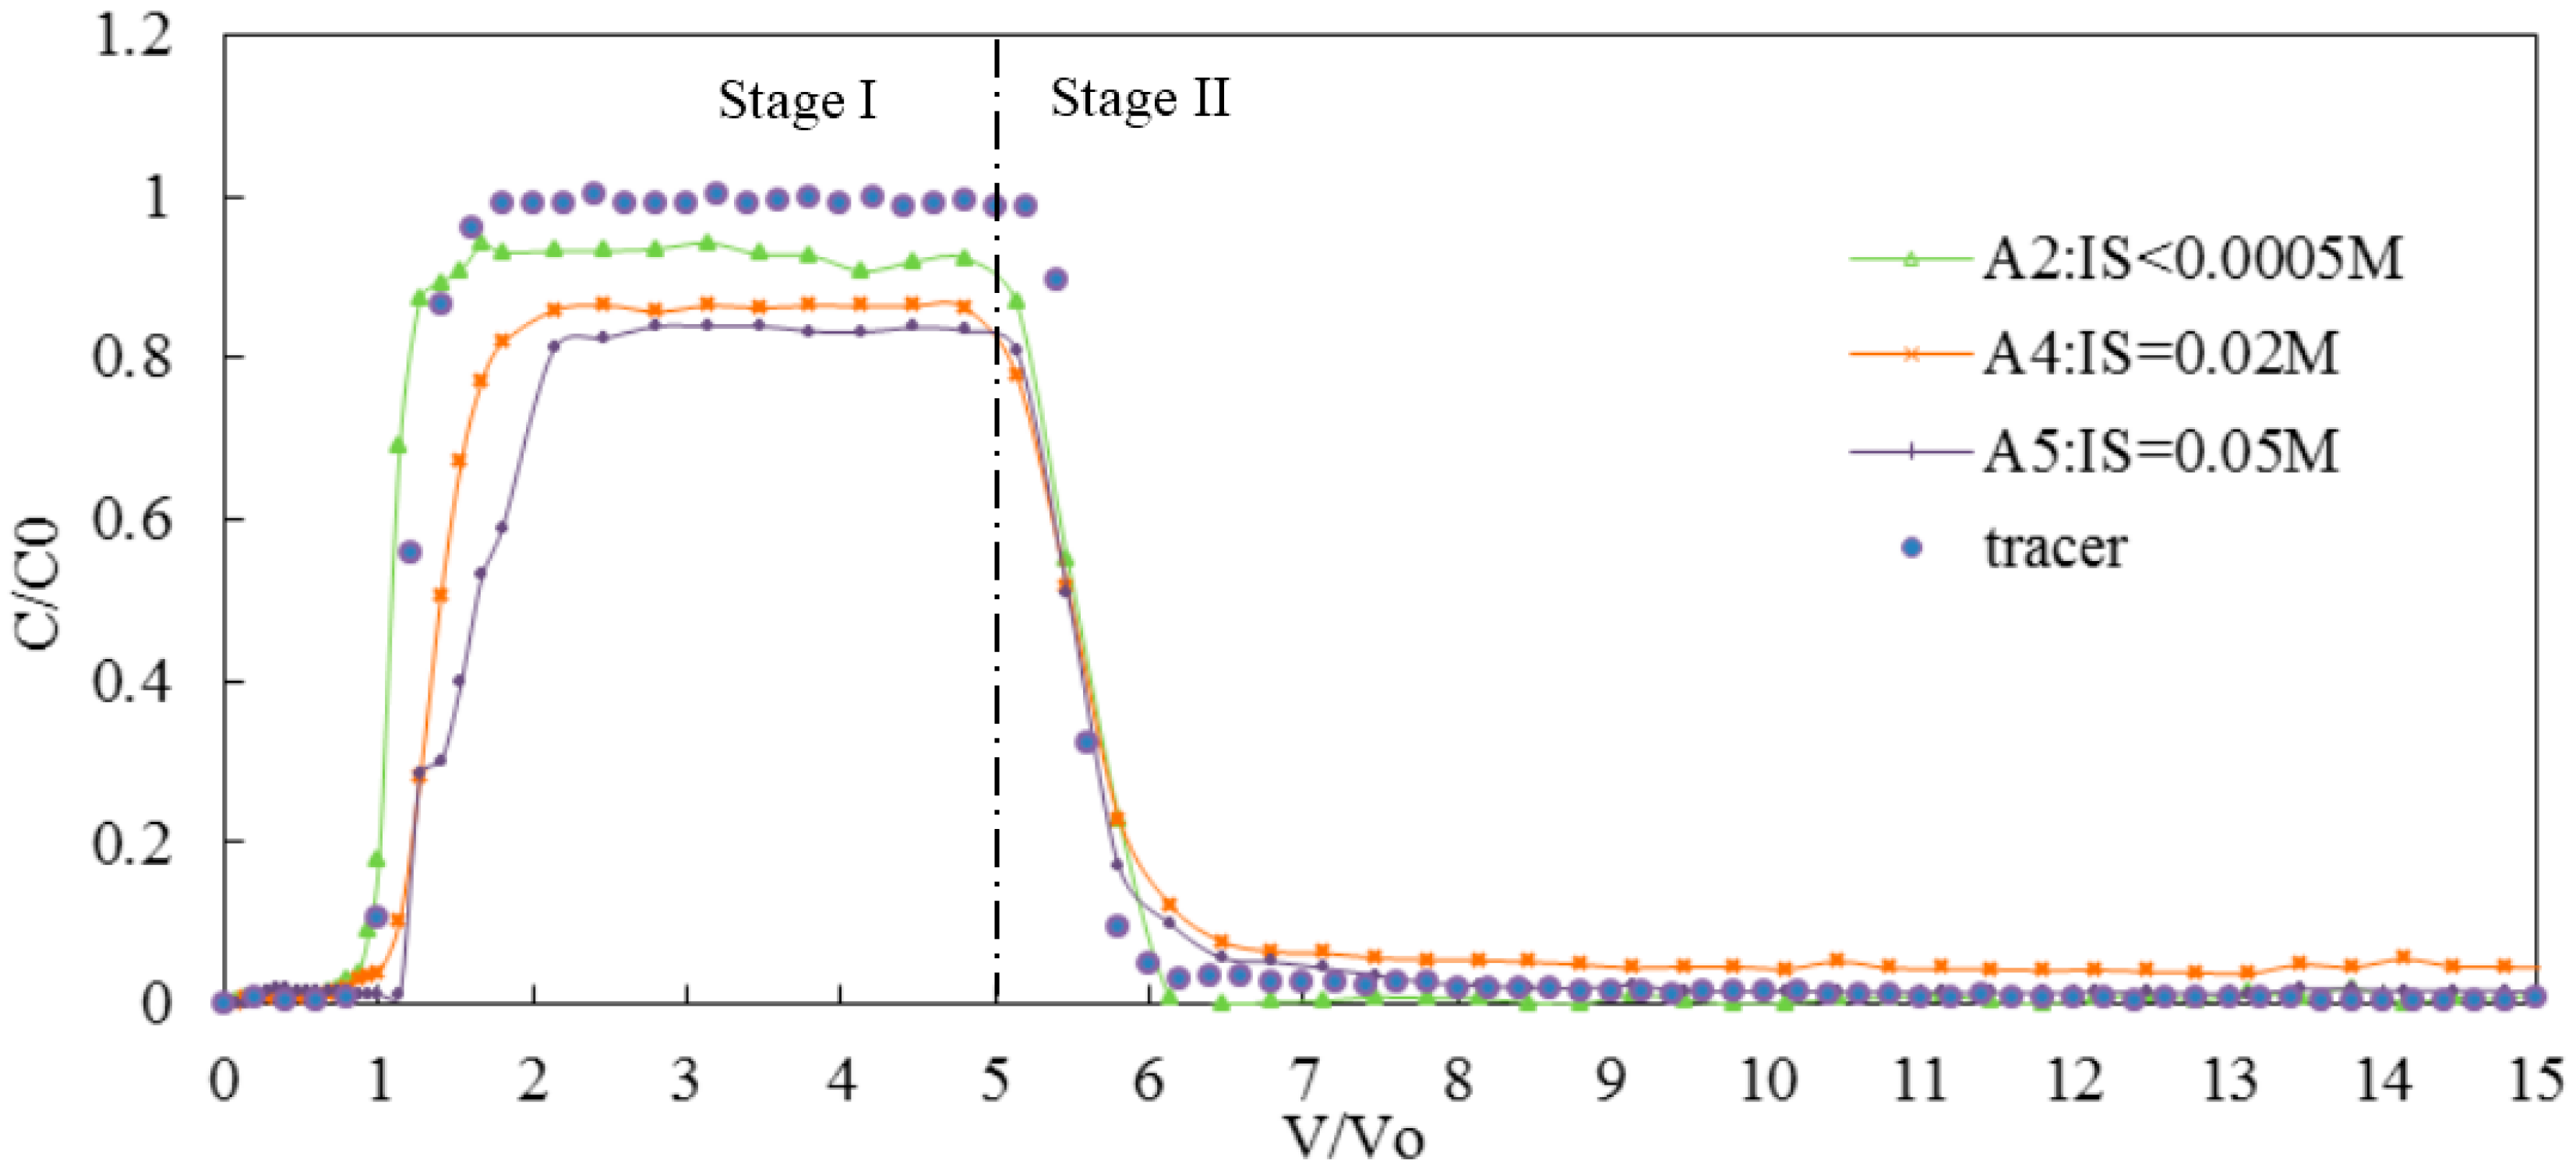
3.2. Effect of IS on Transport of Silica Colloid

3.2.1. Effect of Monovalent Cations on the Transport of Silica Colloid

During this study, the pH remained unchanged (pH = 7) in the silicon colloidal suspensions, and NaCl was used to adjust the silica colloid suspension (IS < 0.0005, 0.02, and 0.05 M), and to investigate the migration regularity of silica colloid with different IS properties in an ideal medium.
As shown in Figure 4, IS has a strong influence on the migration of silicon in porous media. There were slight differences in the results from the three silica colloid penetration velocity experiments. When the IS was less than 0.0005 M, the silica colloid breakthrough curve reached its peak concentration (0.95) after about 1 PV; when the IS was 0.02 M, the silica colloid breakthrough curve reached its peak concentration (0.89) after about 1.5 PV, and when the IS was 0.05 M, the silica colloid breakthrough curve reached its peak concentration (0.85) after about 2.5 PV. This shows that, as the IS increased, the peak of the breakthrough curve decreased, and more silica colloid was adsorbed onto the surface of porous media. Based on the different IS conditions (<0.0005, 0.02, and 0.05 M), we calculated that the colloidal deposition rate coefficients were 2.03 × 10⁻⁶, 3.47 × 10⁻⁶, and 4.37 × 10⁻⁵, respectively. With increases in IS, the ability of the silica colloid to migrate in the porous medium decreased. Previous studies have shown that the classical DLVO theory is consistent with this conclusion, and that the adsorption process depends on the interaction between the colloid and the media [16]. Because the silica colloid and glass beads are negatively charged, as the IS in the solution increased, the electrical double layer thickness decreased, electrostatic repulsion decreased, and the colloid stability decreased, with the result that more silicon was adsorbed onto the glass beads.
It is therefore clear that the migration of the silicon was smoothest for an IS value of <0.0005 M. However, when the IS was increased to 0.05 M, there was obvious adsorption, so that the peak value of the silicon breakthrough curve under the experimental conditions decreased to 85%. We can therefore conclude that the interactive force between the silicon and the medium was the main control on the colloid transport process.
When the IS was 0.005 M, 14% of the silicon was released by leaching, and 2% was retained in the porous media. For IS values of 0.02 and 0.05 M, the release rates of silicon were 18% and 15%, respectively, while 14% and 21% were retained in the porous media, respectively. The release of silica colloid was slower when the IS was 0.02 M than at the other two values (IS < 0.005 and 0.02 M), and reflects the fact that during leaching, the IS of the aquifer changed considerably, and the double layer electrostatic repulsion between the colloid and the solid medium increased, as outlined in the DLVO classical theory, and the silica colloid that had been deposited onto the surface of the solid phase was released.
The results indicate that increases in the IS are not conducive to the migration of silica colloid in the porous medium. Comparison of the silicon breakthrough curves under different IS conditions indicates that migration of silica colloid in the groundwater aquifer was influenced by IS, and that the adsorption was mostly reversible. The results of this study are consistent with those from previous studies.

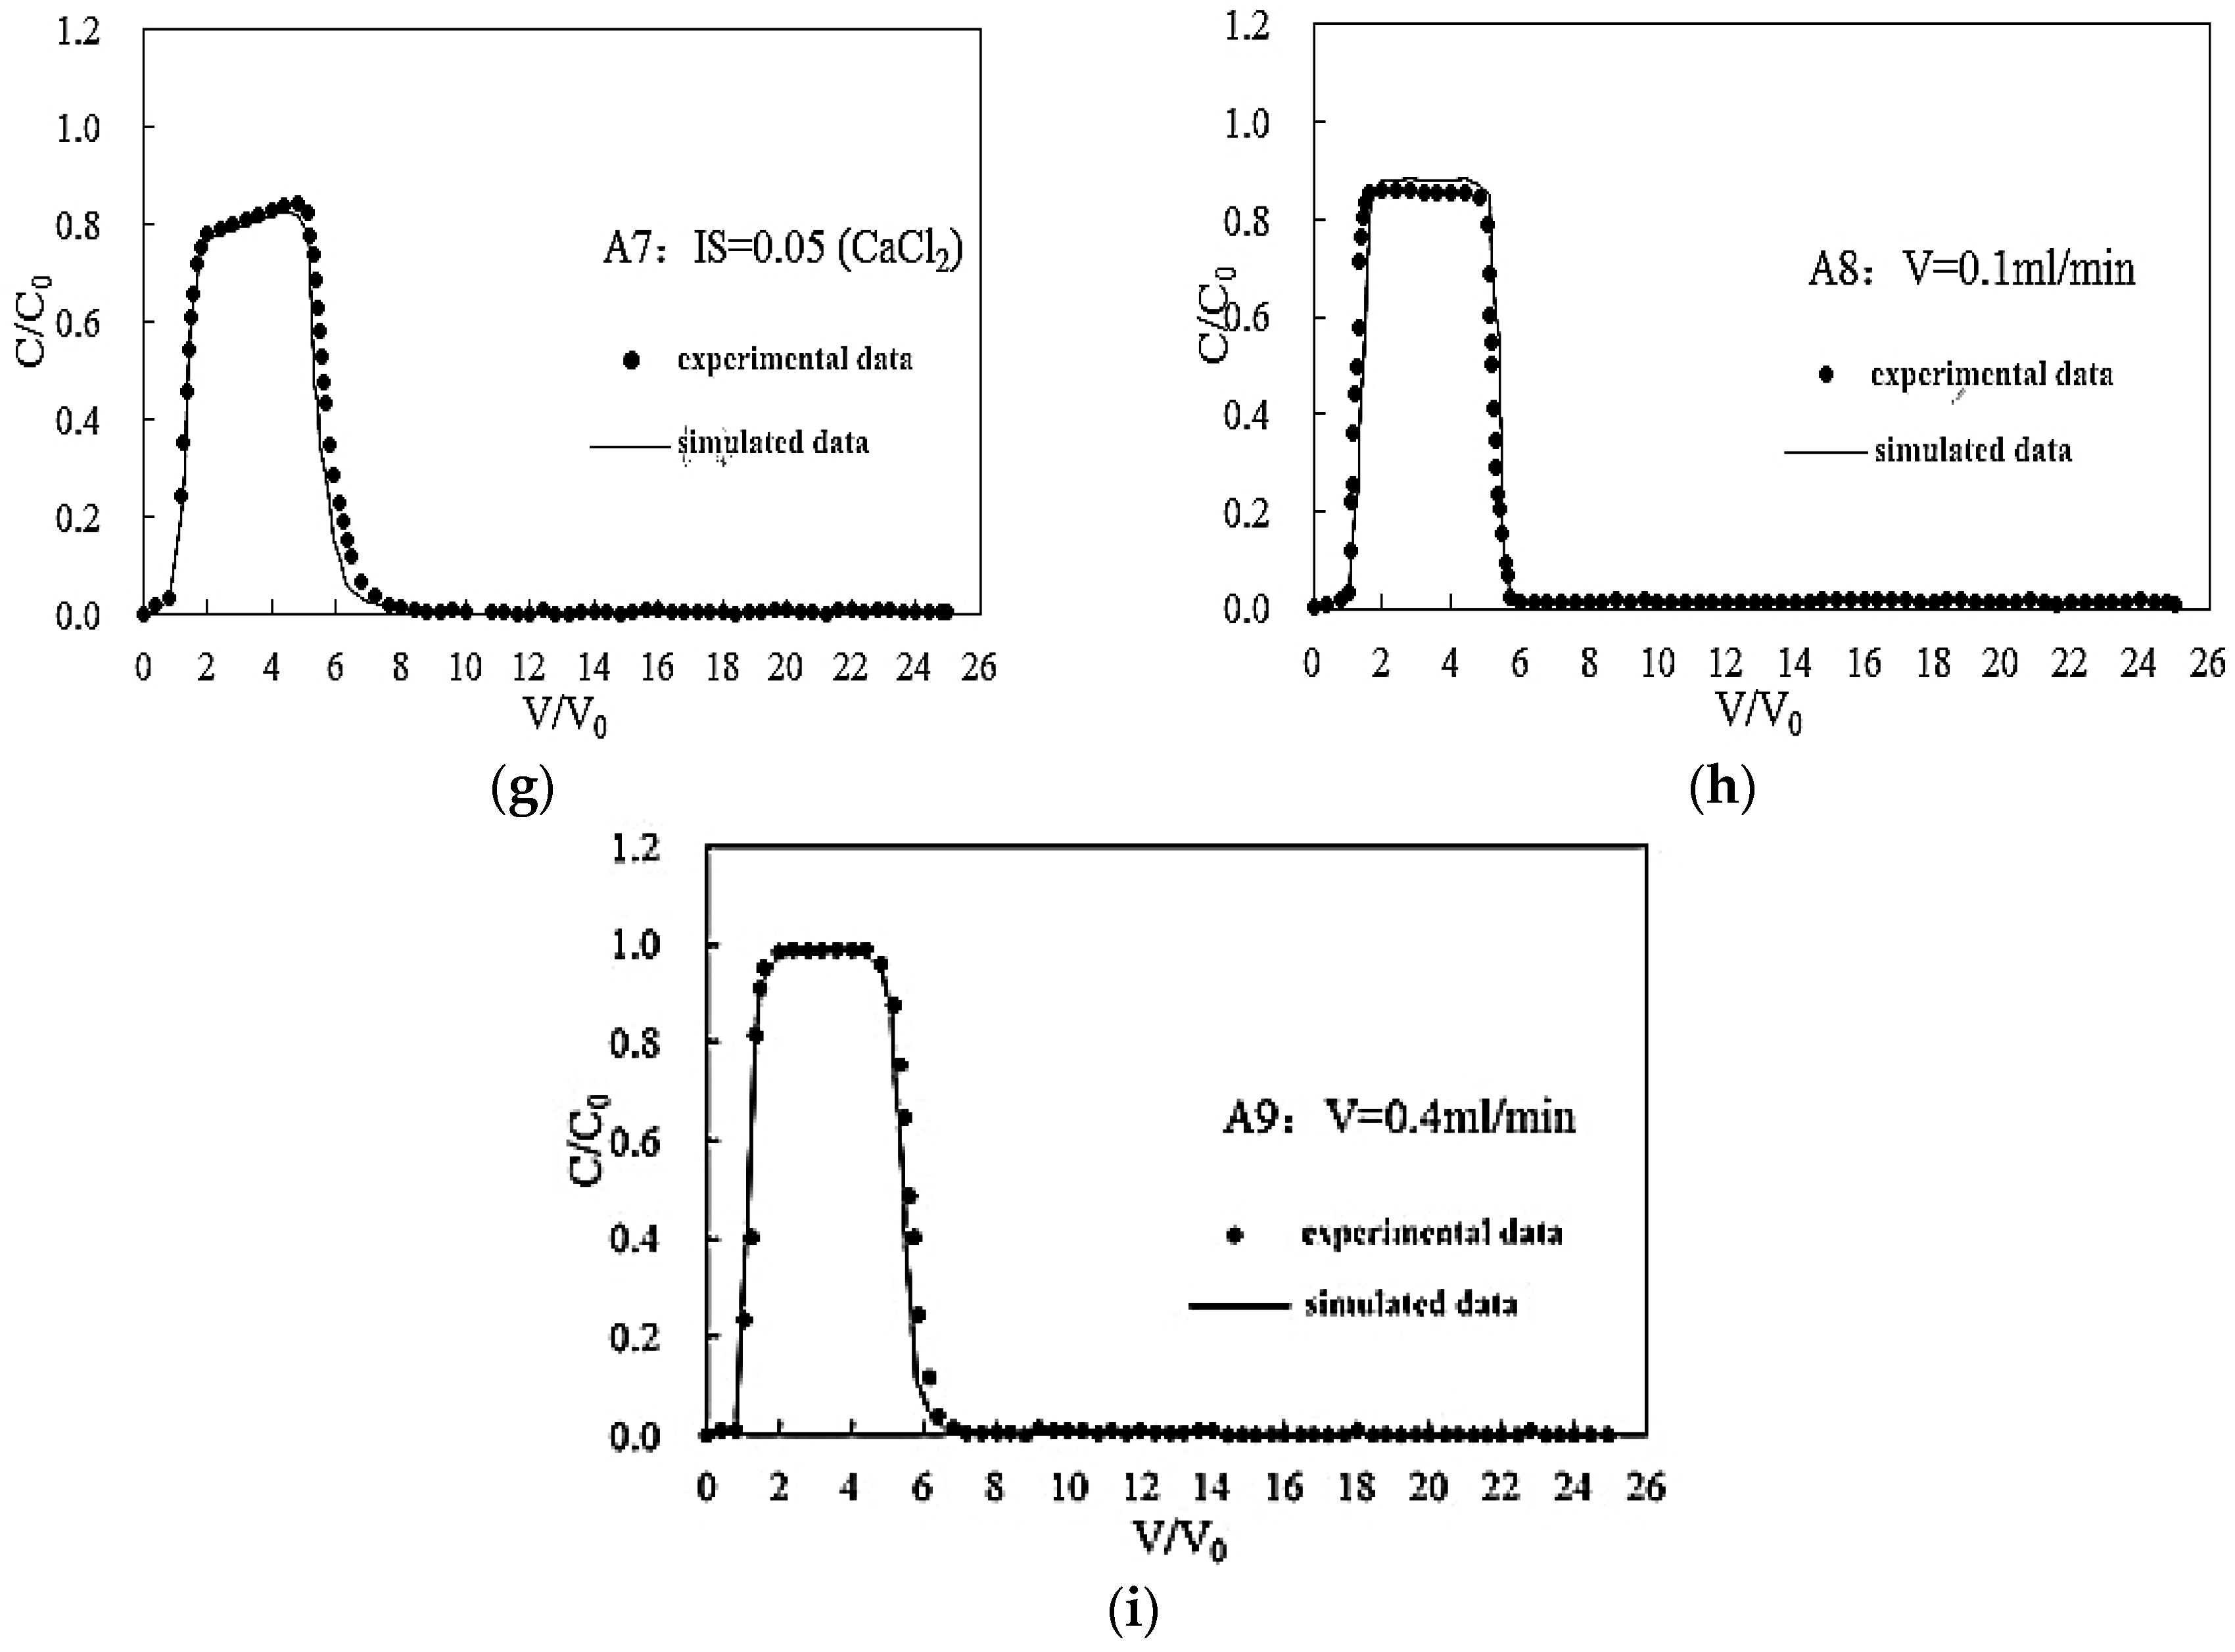
3.2.2. Effect of Bivalent Cations on the Transport of Silica Colloid

During this test, the pH in the silicon colloidal suspensions remained unchanged (pH = 7), and CaCl2 was used to adjust the silica colloid suspension (IS < 0.0005, 0.02, and 0.05 M), and to investigate the migration regularity for different IS conditions for silica colloid in an ideal medium.
When the IS was 0.0005 M (A2), the breakthrough curve reached its peak value (95%), and, compared with the other two groups, fluctuated slightly. In the subsequent deionized water leaching process, the release of silica colloid adsorbed in earlier two sets of experiments was not obvious, and was released slowly when the IS was 0.05 M (A7). The breakthrough curve reached its peak value (95%) by approximately 1 PV when the IS was less than 0.0005 M; it reached its peak value (90%) by approximately 1.5 PV when the IS was less than 0.02 M, and it reached its peak value (82%) by about 2 PV when the IS was 0.05 M.
For an IS of 0.05 M, when colloidal material was constantly injected to the column, the breakthrough curves showed an upward trend with a lower peak at the beginning, which infers that straining may have occurred in this part. Combined with previous results, the potential of the silica colloid in this condition was around −12.7 mV, which indicates that it was in an extremely unstable state. Further, the particle size of the silica colloid was about 738 nm, and was larger than that in other conditions, when it was around 350–400 nm. Previous studies have shown that, when the ratio of the colloid particle diameter and solid collector diameter was greater than 0.0012, transport of colloids was affected by straining [18]. The diameter of the porous media (glass beads) in this study was 0.45 mm, so the ratio in this condition was about 0.00164, which further confirmed this result.
Comparison of Figure 5 and Figure 6 shows that the trends in the peak and time of arrival of silica colloid were consistent. Straining, however, appeared in the presence of CaCl2, which indicates that different mechanisms influenced monovalent and bivalent cation reactions on colloids. In the presence of NaCl, when the IS increased from <0.0005 to 0.05 M, the breakthrough curve peak declined by 10%, from 0.95 to 0.85; in the presence of CaCl2, when the IS increased from <0.0005 to 0.05 M, the breakthrough curve peak decreased by 13%, from 0.95 to 0.82. Although, when compared with other inorganic colloids, silica colloid is relatively stable, the effect of the divalent cations is greater. In their study, Anderson (2014) used undisturbed soil as the experimental medium [6]. When KCl was used to adjust the IS to 0.0055 M, the silicon breakthrough curve reached its peak value (0.95) by 53 PV. When CaCl2 was used to adjust the IS to 0.0055 M, the silicon breakthrough curve reached its peak value (0.89) by 150 PV. This shows that bivalent cations can be used to regulate IS, peak concentrations were lowest when the monovalent cation regulated, and the penetration rates for silica colloid were low. In this study, the deposition coefficients for NaCl and CaCl2 were 3.47 × 10⁻⁶ and 4.19 × 10⁻⁶, respectively, when the IS was 0.02 M. The deposition coefficients for NaCl and CaCl2 were 4.37 × 10⁻⁵ and 6.43 × 10⁻⁵, respectively, when the IS was 0.05 M. These results show that the deposition coefficient of Ca2+ was significantly larger than that of Na+ for the same IS. It also shows that, when IS was regulated by Ca2+, more colloids are adsorbed, and the situation was not conducive to the migration of silicon in porous media.

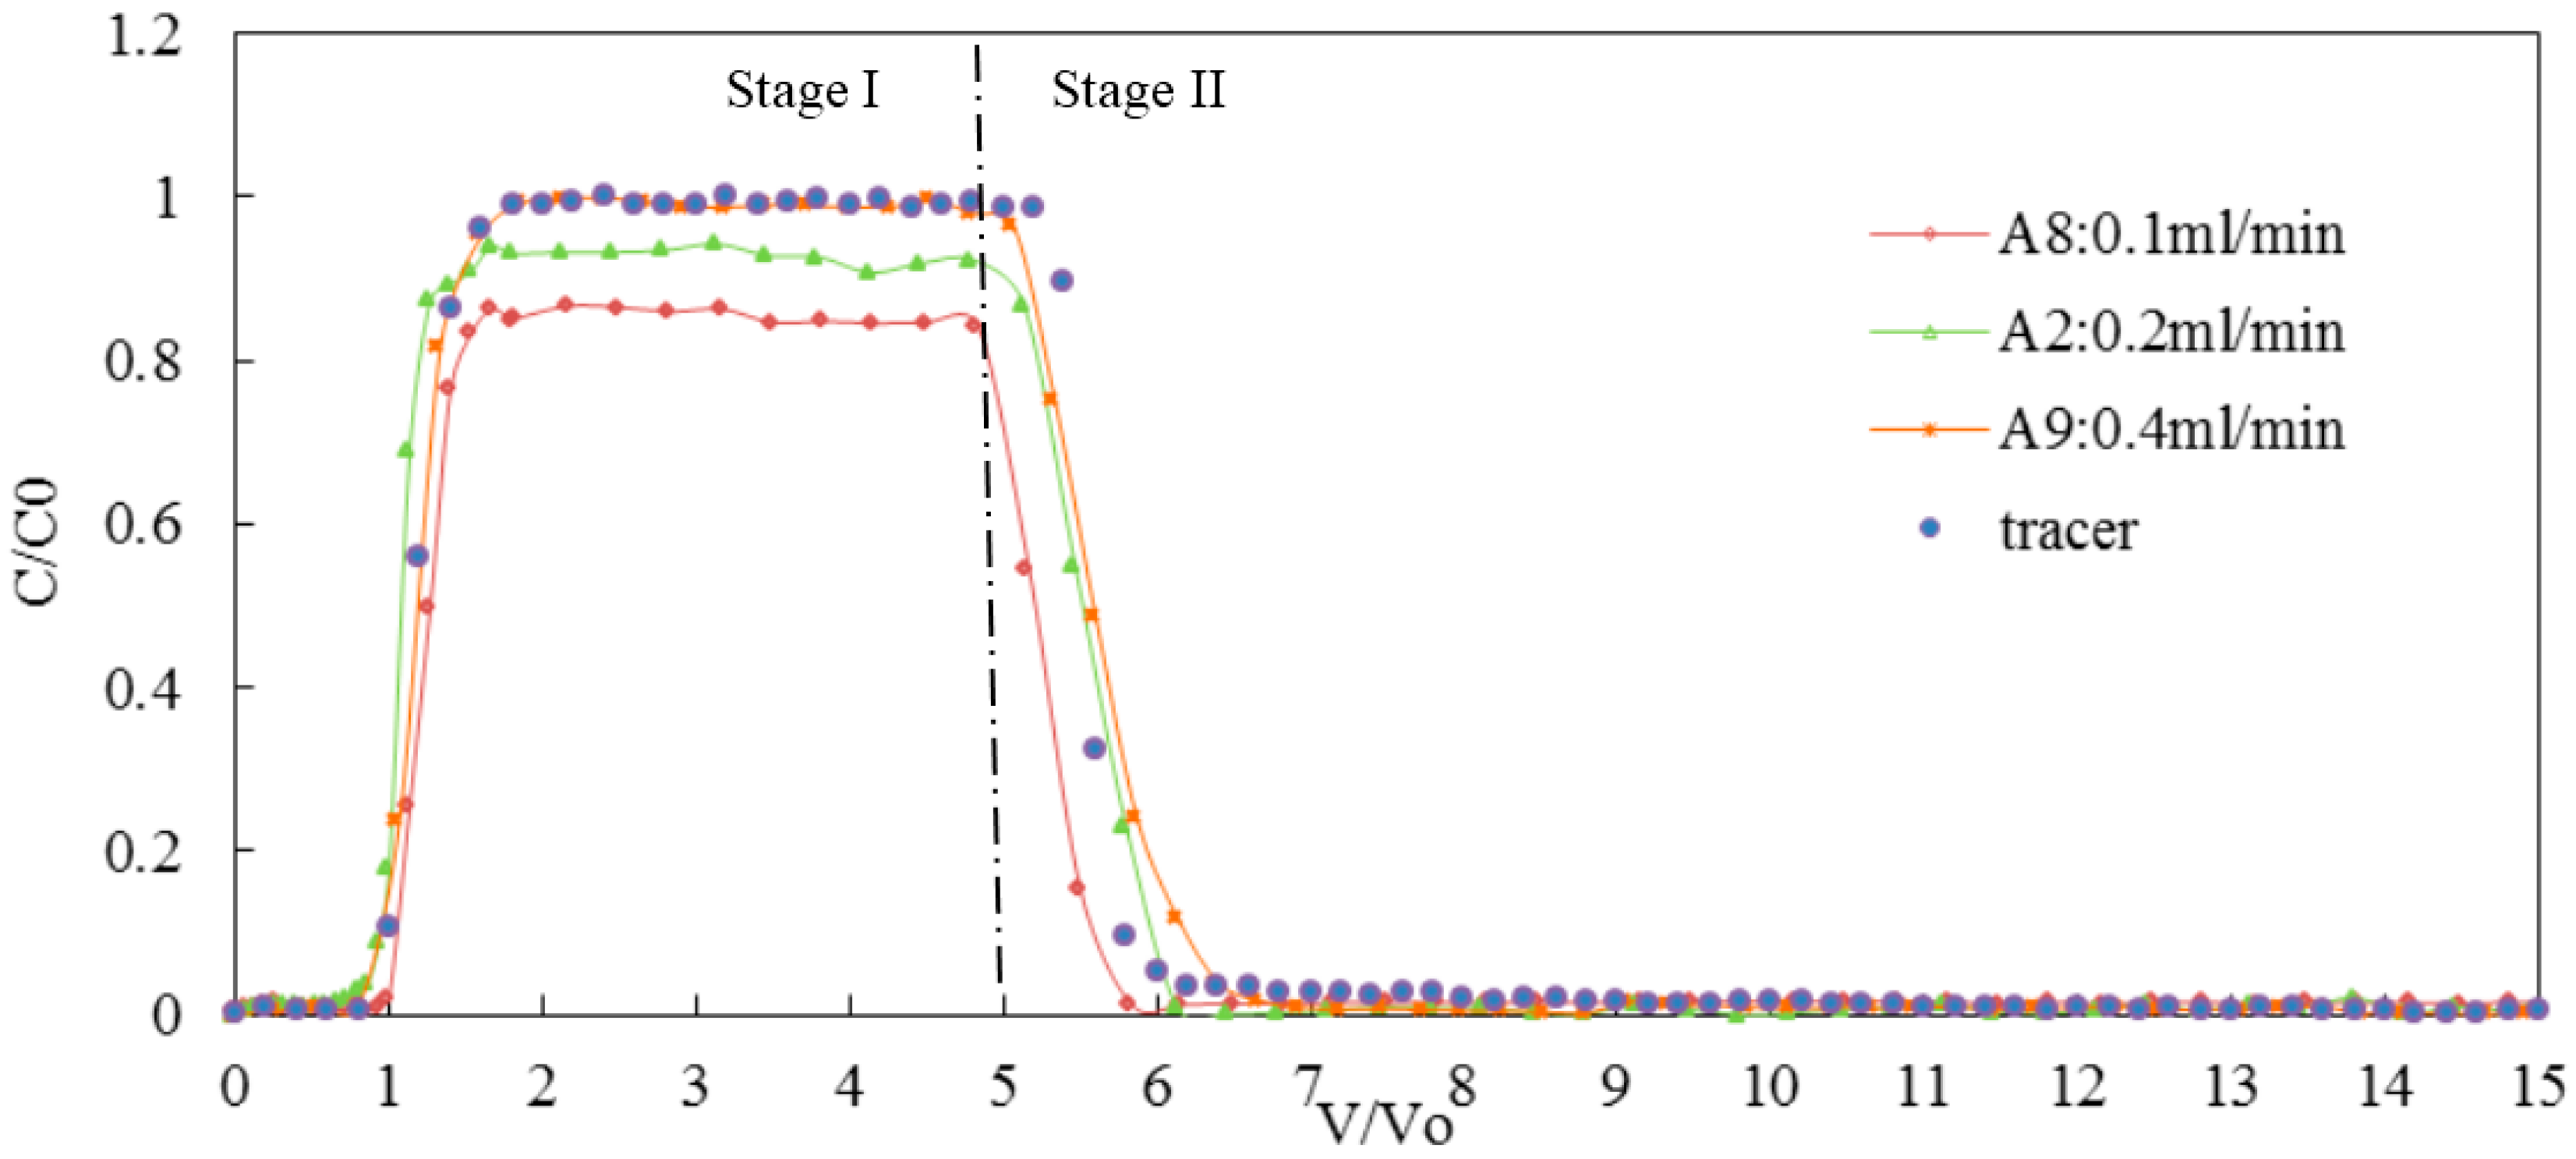
3.3. Effect of Flow Rate on the Transport of Silica Colloid

In this part of the experiment, the pH of the silica colloid suspension (pH = 7) and the IS (IS ≤ 0.0005 M) were kept constant, and a peristaltic pump was used to adjust the flow velocities in the silica colloid suspensions in the columns (V = 0.1, 0.2, and 0.4 mL/min), so that we could investigate how silicon colloids migrated in the ideal medium under different flow conditions.
As shown in Figure 7, the migration of silicon in the porous media varied as the flow rate varied. Existing research showed that, as the flow rate increased, the peak of the silicon breakthrough curve also increased [6]. In this study, the silica colloid breakthrough curve peaks were 85%, 95%, and 98% for flow rates of 0.1, 0.2, and 0.4 mL/min, respectively. As the flow rate increased, the peak of the silicon breakthrough curve increased and silicon release slowed down. The results of this study are consistent with the conclusions of the existing study [11].
Calculations show that, when the flow rate increased from 0.1 to 0.4 mL/min, the deposition coefficient of silica colloid decreased from 6.83 × 10⁻⁵ to 4.32 × 10⁻⁷, which indicates that, as the flow rate increased, deposition of silica colloid also decreased. Increases in the flow rate affect the balance of the forces between the porous medium and colloidal particles so that there is less contact time with the porous medium. This promotes the migration of silicon and reduces deposition of colloidal particles [18]. When the flow rate is increased to 0.4 mL/min, there is little increase in the peak C/C0, which suggests that a critical flow rate is needed to facilitate silica colloid transport in the porous medium [19]. Because the flow rate is the only variable in this experiment, the migration of colloids in porous media is mainly influenced by the kinetic effect. Previous analysis indicated that the migration of colloids in porous media was mainly controlled by deposition of colloids and media. When the flow rates are lower (0.1 mL/min), the hydrodynamic shear forces between the colloid and the medium are also small, resulting in an increase in the adsorption of colloids in the medium and a decrease in the colloids in the effluent. When the flow rate is increased to 0.2 mL/min, the shear stress on the solid skeleton of the glass bead from the fluid is larger than that at 0.1 mL/min, leading to a decrease in the amount of colloid deposition, and an increase in the colloid concentration in the effluent. As the flow rate continued to increase to 0.4 mL/min, the movable colloidal part in the column was mainly silicon and there was continuous adsorption to the outer layer of the glass beads. As the flow rate increased, the shear stress caused by the flow of water also increased. There was desorption of the silicon that had been adsorbed earlier to the surface of the glass beads, resulting in an increase in the silicon concentration in the effluent. Previously, column studies have shown that, as the flow rate increased, the colloid concentration in effluent also increased [20,21]. As well as having an influence on the water chemistry, the flow rate has a considerable impact on the migration of silicon in porous media. As the flow rate increases, the hydrodynamic shear force between the colloid and the medium increases, deposition is reversed, and concentrations of silicon in the effluent increase. The trend observed in this study is consistent with the results from previous research; in general, as the flow rate increases, the concentrations of silica colloid in the effluent also increase (Anderson, 2008) [6], but is beyond the scope of this study. The medium in the earlier study was red sandstone, which may have caused some differences [22].

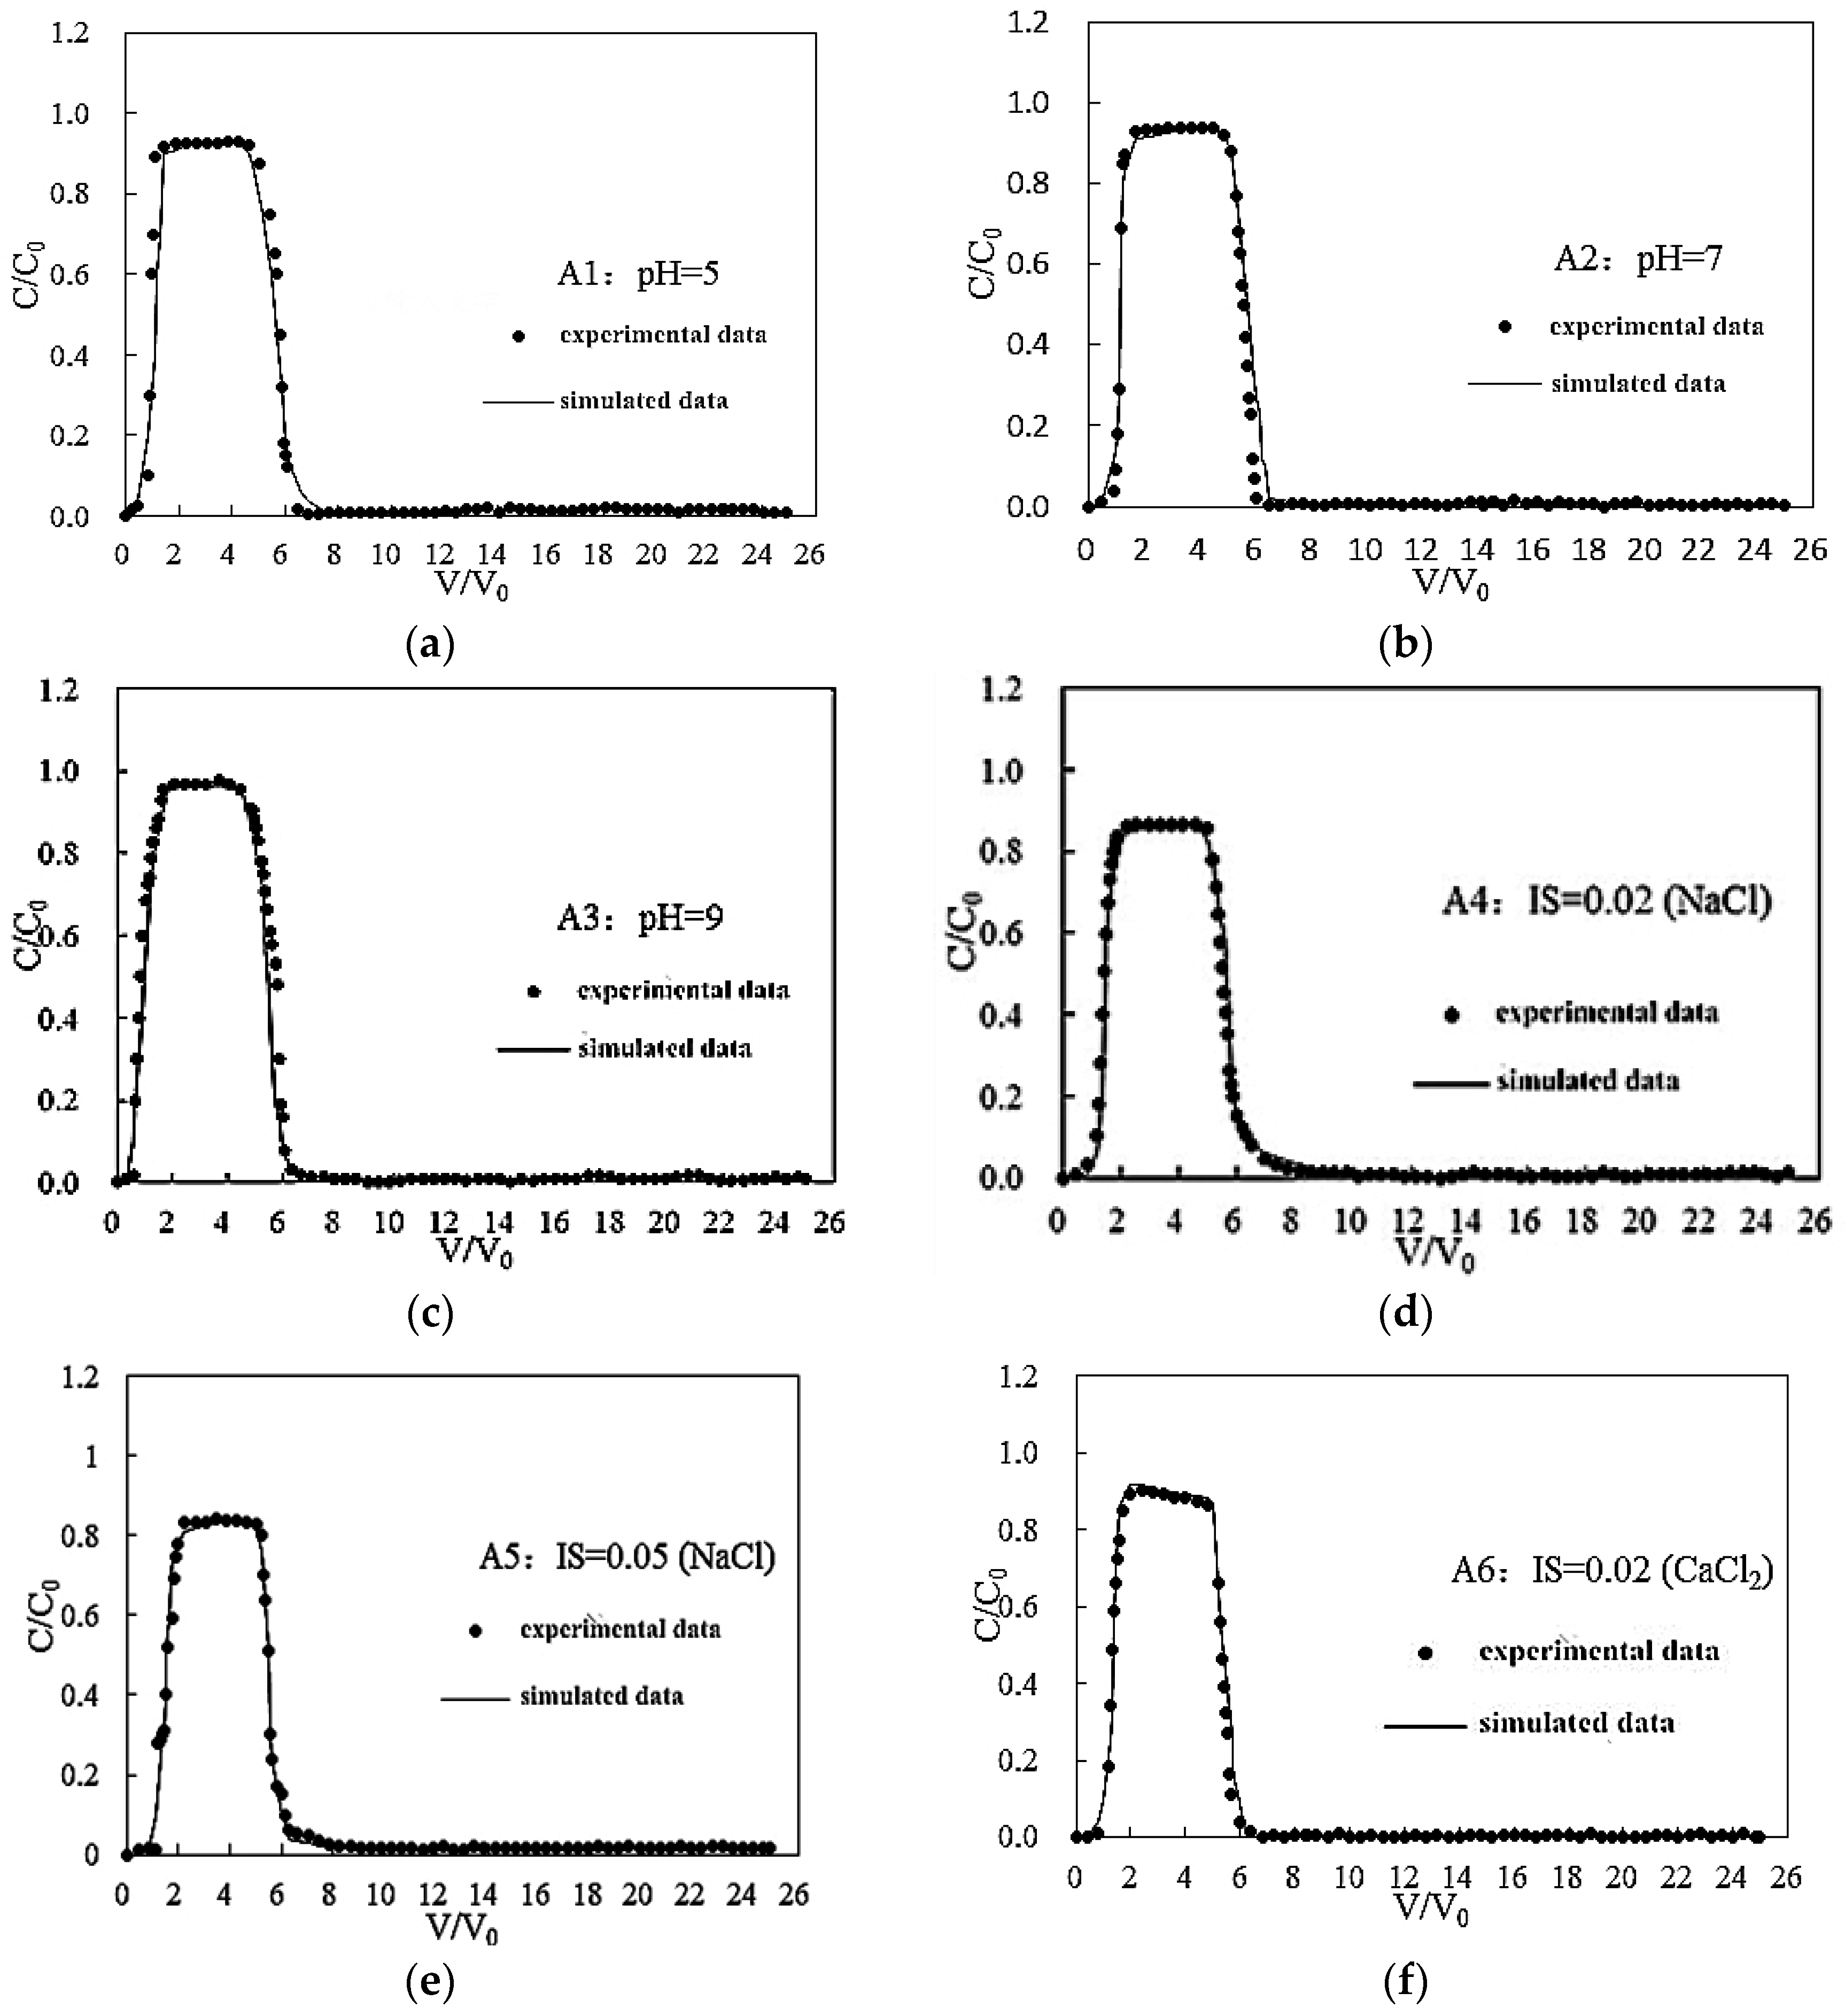
3.4. Simulation Results

The results so far show that, in each of the silicon migration experiments, colloid deposition occurred. We now present the fitting results for the experiment.
The experimental fitting parameters are presented in Table 3, which shows that the effect of pH on the deposition rate constant katt of silicon was less than that of IS. For pH values of 5, 7, and 9, the deposition rate constants were 2.79 × 10⁻⁶/s, 2.03 × 10⁻⁶/s, and 1.21 × 10⁻⁶/s, respectively. When the IS was adjusted with NaCl, the deposition rate constants were 3.47 × 10⁻⁶/s and 4.37 × 10⁻⁵/s for IS values of 0.02 and 0.05 M, respectively. When the IS was adjusted with CaCl2, the deposition rate constants were 4.19 × 10⁻⁶/s and 6.43 × 10⁻⁵/s when the IS values were 0.02 and 0.05 M, respectively.
In this experiment, straining occurred in A7. The straining coefficient of the silica colloid is 0.0016/s.
During the leaching stage, changes in the pH and flow rate of the aquifer had little effect on the secondary release of silicon. When bivalent cations were used for regulation, the IS was higher, and had a considerable influence on the second release of silicon; when the IS was 0.05 M, the release rate constant Kre of the silicon was 1.6 × 10⁻⁴/s.

4. Conclusions

By simulating different water chemical and hydrodynamic conditions, we tested the migration of inorganic colloids, represented by silica colloid in this study, in an aquifer that was receiving MAR. The four groups of experimental results showed that, under variable water chemistry and hydrodynamic conditions, the migration of silica colloid in porous media was governed by different rules. The results showed that pH, IS, cation valence, flow velocity of the water, and the medium had different effects on the rules that governed migration in porous media. When the pH of the suspension increased from 5 to 9, the peak of the silica colloid breakthrough curve increased from 0.93 to 0.97. Increasing the IS from <0.0005 to 0.05 M gave rise to obvious changes in the peak of the silica colloid penetrating curve. Also, when bivalent cations were used to modulate the IS, the silica colloid breakthrough curve peak decreased from 0.95 to 0.82. When monovalent cations were used to modulate the IS, the silica colloid breakthrough curve decreased from 0.95 to 0.85; this indicates that the bivalent cation had a greater effect on the migration of the porous medium than the monovalent cation. Further, higher flow rates were also conducive to the migration of silica colloid in porous media, because of the balance of the forces among the colloidal particles, the porous medium, and the contact time with the porous medium, as was also reported by Satmark et al. [23] and Kretzschmar and Sticher [24]. The results of the four experiments showed that the effects of pH, IS, and other factors were different for the transport of silica colloid through saturated porous media. From the results, we can conclude that, before MAR, under the conditions of natural hydrogeochemical and hydrodynamic geting rid of human interference, when the pH of the recharge water being injected during MAR is higher than the pH of the original groundwater, there is a higher risk of combined colloidal pollution. When the concentration of bivalent cations in the recharge water is higher than that of the original water, colloid deposition may occur, thereby affecting the porosity of the aqueous medium. Therefore, we recommend that the pH should be maintained at about 7 during MAR, and the flow rate should be close to, or slightly greater than, the groundwater flow rate. The aim of this study was to obtain a greater insight into the transport and deposition behavior of silica colloid during MAR, and to provide an improved scientifically sound theoretical basis to ensure the integrity of the groundwater environment is protected and maintained during MAR.

Acknowledgments

This work was supported by the National Natural Science Foundation of China (41472215). We are grateful for the support provided by the 985 Project of Jilin University, and also for the valuable comments received from the journal editors that have allowed us to improve the paper considerably.

Author Contributions

This study was designed by Zhuo Wang and Wenjing Zhang; The manuscript was prepared by Zhuo Wang; Jingjing Zhou and Shuo Li collected data; Dan Liu performed the experiments.

Conflicts of Interest

The authors declare no conflict of interest.

References

  1. Zhang, W.; Ying, H.; Yu, X.; Dan, L.; Zhou, J. Multi-component transport and transformation in deep confined aquifer during groundwater artificial recharge. J. Environ. Manag. 2015, 152C, 109–119. [Google Scholar] [CrossRef] [PubMed]
  2. Guo, H.; Wang, Y.; Guo, H. Mobilization Mechanism and the Effection on Contamination Movement of Colloids in Groundwater; China University of Geosciences: Wuhan, China, 2001. [Google Scholar]
  3. Jie, M.; Guo, H.; Mei, L.; Wan, X.; Zhang, H.; Feng, X.; Wei, R.; Tian, L.; Han, X. Blocking effect of colloids on arsenate adsorption during co-transport through saturated sand columns. Environ. Pollut. 2016, 213, 638–647. [Google Scholar]
  4. Syngouna, V.I.; Chrysikopoulos, C.V. Experimental investigation of virus and clay particles cotransport in partially saturated columns packed with glass beads. J. Colloid Interface Sci. 2015, 440, 140–150. [Google Scholar] [CrossRef] [PubMed]
  5. Higgo, J.J.W.; Williams, G.M.; Harrison, I.; Warwick, P.; Gardiner, M.P.; Longworth, G. Colloid transport in a glacial sand aquifer laboratory and field studies. Colloids Surf. A Physicochem. Eng. Asp. 1993, 73, 179–200. [Google Scholar] [CrossRef]
  6. Anderson, B.J. Manufactured Nanoparticles: Assessing the Mobility of a Future Class of Containment in Groundwaters. Ph.D. Thesis, University of Birmingham, Birmingham, UK, 2015. [Google Scholar]
  7. Liu, Q.; Xu, S.; Liu, J. Comparition between Kaolinite and SiO2 Colloid in Transport Beheavir in Suturated Porous Media; Instituteof Soil Science, Chinese Academy of Sciences: Nanjing, China, 2007. [Google Scholar]
  8. Séquaris, J.M.; Klumpp, E.; Vereecken, H. Colloidal properties and potential release of water-dispersible colloids in an agricultural soil depth profile. Geoderma 2013, 193–194, 94–101. [Google Scholar] [CrossRef]
  9. Bradford, S.A.; Simunek, J.; Bettahar, M.; Genuchten, M.T.V.; Yates, S.R. Significance of straining in colloid deposition: Evidence and implications. Water Resour. Res. 2006, 42, 3660–3668. [Google Scholar] [CrossRef]
  10. Yu, C.; Muñoz-Carpena, R.; Gao, B.; Perez-Ovilla, O. Effects of ionic strength, particle size, flow rate, and vegetation type on colloid transport through a dense vegetation saturated soil system: Experiments and modeling. J. Hydrol. 2013, 499, 316–323. [Google Scholar] [CrossRef]
  11. Liu, D.; Zhou, J.; Zhang, W.; Ying, H.; Yu, X.; Li, F.; Chen, X. Column experiments to investigate transport of colloidal humic acid through porous media during managed aquifer recharge. Hydrogeol. J. 2016, 1–11. [Google Scholar] [CrossRef]
  12. Elimelech, M.; Nagai, M.; Chunhan Ko, A.; Ryan, J.N. Relative insignificance of mineral grain zeta potential to colloid transport in geochemically heterogeneous porous media. Environ. Sci. Technol. 2000, 34, 2143–2148. [Google Scholar] [CrossRef]
  13. Syngouna, V.I.; Chrysikopoulos, C.V. Transport of biocolloids in water saturated columns packed with sand: Effect of grain size and pore water velocity. J. Contam. Hydrol. 2011, 126, 301–314. [Google Scholar] [CrossRef] [PubMed]
  14. Pang, L.; Goltz, M.; Close, M. Application of the method of temporal moments to interpret solute transport with sorption and degradation. J. Contam. Hydrol. 2003, 60, 123–134. [Google Scholar] [CrossRef]
  15. Ruben, K.; Kurt, B.; Daniel, G.; Yan, Y.; Michal, B.; Hans, S. Experimental determination of colloid deposition rates and collision efficiencies in natural porous media. Water Resour. Res. 1997, 33, 1129–1137. [Google Scholar]
  16. Sojitra, I.; Valsaraj, K.T.; Reible, D.D.; Thibodeaux, L.J. Transport of hydrophobic organics by colloids through porous media 1 experimental results. Colloids Surf. A Physicochem. Eng. Asp. 1995, 94, 197–211. [Google Scholar] [CrossRef]
  17. Roy, S.B.; Dzombak, D.A. Chemical factors influencing colloid-facilitated transport of contaminants in porous media. Environ. Sci. Technol. 1997, 31, 656–664. [Google Scholar] [CrossRef]
  18. Torkzaban, S.; Bradford, S.A.; Genuchten, M.T.V.; Walker, S.L. Colloid transport in unsaturated porous media: The role of water content and ionic strength on particle straining. J. Contam. Hydrol. 2008, 96, 113–127. [Google Scholar] [CrossRef] [PubMed]
  19. Yin, X.Q.; Sun, H.M.; Lei, Y.I.; Yi-Qing, L.U.; Wang, G.D.; Zhang, X.C. Effect of flowrate of pore water on the transport of colloid in saturated porous media. J. Soil Water Conserv. 2010, 24, 101–104. [Google Scholar]
  20. Lahav, N.; Tropp, D. Movement of synthetic microspheres in saturated soil columns. Soil Sci. 1980, 130, 151–156. [Google Scholar] [CrossRef]
  21. Puls, R.W.; Paul, C.J.; Clark, D.A. Surface chemical effects on colloid stability and transport through natural porous media. Colloids Surf. A Physicochem. Eng. Asp. 1993, 73, 287–300. [Google Scholar] [CrossRef]
  22. Anderson, B. The Mobility of Colloids in Red Sandstone: The Effect of Flow Rate and Ionic Strength. Ph.D. Thesis, University of Birmingham, Birmingham, UK, 2008. [Google Scholar]
  23. Sätmark, B.; Albinsson, Y.; Liang, L. Chemical effects of goethite colloid on the transport of radionuclides through a quartz-packed column. J. Contam. Hydrol. 1996, 21, 231–241. [Google Scholar] [CrossRef]
  24. Kretzschmar, R.; Sticher, H. Colloid transport in natural porous media: Influence of surface chemistry and flow velocity. Phys. Chem. Earth 1998, 23, 133–139. [Google Scholar] [CrossRef]
Figure 1. Particle size distribution of silica colloid under different conditions. (a) Particle size distribution of silica colloid particles under different pH conditions (IS = 0.00 M); (b) Particle size distribution of silica colloid under different IS conditions (pH = 7).
Water 08 00555 g001
Figure 2. Schematic diagram of the experimental setup.
Water 08 00555 g002
Figure 3. Breakthrough curves of silica colloid suspension under different pH values.
Water 08 00555 g003
Figure 4. Breakthrough curves of silica colloid under various concentrations of NaCl.
Water 08 00555 g004
Figure 5. Breakthrough curves of silica colloid suspension under various concentrations of CaCl2.
Water 08 00555 g005
Figure 6. Breakthrough curves of silica colloid under different flow rates.
Water 08 00555 g006
Figure 7. Experimental simulation curves. (a) A1 group experimental simulation curve; (b) A2 group experimental simulation curve; (c) A3 group experimental simulation curve; (d) A4 group experimental simulation curve; (e) A5 group experimental simulation curve; (f) A6 group experimental simulation curve; (g) A7 group experimental simulation curve; (h) A8 group experimental simulation curve; (i) A9 group experimental simulation curve.
Water 08 00555 g007aWater 08 00555 g007b
Table 1. Physical and chemical properties of silica colloid under different conditions.
Influence FactorpHISPdIPk 1 Mean Int (d.nm)Pk 2 Mean Int (d.nm)Pk 3 Mean Int (d.nm)Pk 1 Area Int (Percent)Pk 2 Area Int (Percent)Pk 3 Area Int (Percent)ZP (mV) (±0.3~1.8)
pH5<0.00050.855352.80010000−20.2
7<0.00050.742372.40010000−27.4
9<0.00050.792409.90010000−32.1
7<0.00050.742372.40010000−27.4
IS70.020.714406.20010000−24.0
(NaCl)70.050.840653.40010000−19.8
7<0.00050.742372.40010000−27.4
IS70.020.728410.50010000−22.6
(CaCl2)70.050.547738.00010000−12.7
Notes: IS is the ionic strength; PdI is the particle dispersion index; Pk Mean and Pk Area display the size and percentage by number for up to three peaks within the result; ZP is the colloidal potential.
Table 2. Experimental conditions and part results for column tests.
Influence FactorsTest No.pHIS (mol/L)Flow Rate (mL/min)MediumStage I (%)Stage II (%)Retention (%)Peak C/C0RK (s−1)
pHA15<0.00050.20GB752140.931.052.79 × 10−6
A27<0.00050.20GB841060.951.052.03 × 10−6
A39<0.00050.20GB861130.971.121.21 × 10−6
IS (NaCl)A27<0.00050.20GB841060.951.052.03 × 10−6
A470.020.20GB6818140.891.313.47 × 10−6
A570.050.20GB6415210.851.504.37 × 10−5
A27<0.00050.20GB841060.951.052.03 × 10−6
IS (CaCl2)A670.020.20GB6513220.901.254.19 × 10−6
A770.050.20GB5618260.821.816.43 × 10−5
Flow rateA87<0.00050.1GB679240.851.036.83 × 10−5
A27<0.00050.2GB841060.951.052.03 × 10−6
A97<0.00050.4GB871030.981.054.32 × 10−7
Notes: IS indicates ionic strength; stage I is the relative mass recovery in the effluents during silicon colloid injection process; Stage II is the relative mass recovery in the effluents during the deionized water washing process; Retention is the relative mass withheld in the glass beads; Peak C/C0 is the peak value of colloids recovered in the effluent after the breakthrough curve silicon colloid reached a plateau; R is the retardation coefficient calculated from the breakthrough curve; K is the deposition rate coefficient; GB is glass bead.
Table 3. Fitting parameters of the experiments in each group.
Variable No.A1A2A3A4A5A6A7A8A9
Katt[1/s]2.79 × 10−62.03 × 10−61.21 × 10−63.47 × 10−64.37 × 10−54.19 × 10−66.43 × 10−56.83 × 10−54.32 × 10⁻⁷
Kre[1/s]0000001.6 × 10−400
λs[1/s]0000000.001600
Notes: V is the Darcy velocity Katt is the attachment rate; Kripi is the ripening rate; Kre is the release rate; λs is the filter coefficient.

