Article

Distribution and Potential Health Risks of Arsenic, Selenium, and Fluorine in Natural Waters in Tibet, China

1
Lhasa National Ecological Research Station, Key Laboratory of Ecosystem Network Observation and Modelling, Institute of Geographic Sciences and Natural Resources Research, Chinese Academy of Sciences, Beijing 100101, China
2
Institute of Geographic Sciences and Natural Resources Research, Chinese Academy of Sciences, Beijing 100101, China
3
University of Chinese Academy of Sciences, Beijing 100049, China
4
State Key Laboratory of Resources and Environmental Information System, Institute of Geographic Sciences and Natural Resources Research, Chinese Academy of Sciences, Beijing 100101, China
5
Ministry of Science and Technology, Beijing 100862, China
*
Authors to whom correspondence should be addressed.
Water 2016, 8(12), 568; https://doi.org/10.3390/w8120568
Submission received: 18 October 2016 / Revised: 23 November 2016 / Accepted: 29 November 2016 / Published: 3 December 2016
(This article belongs to the Special Issue Water Quality and Health)

Abstract

:
The contents of major and trace elements were analyzed in 204 different types of water samples in 138 villages across 51 counties and cities of Tibet. The average concentrations of arsenic (As), selenium, and fluorine for each water category decreased in the following order: arsenic (in μg/L: hot spring 241.37 > lake 27.46 > stream 22.11 > shallow well 11.57 > deep well 6.22), selenium (in μg/L: deep well 0.85 > shallow well 0.68 > stream 0.62 > hot spring 0.39 > lake 0.36), and fluorine (in mg/L: hot spring 2.10 > lake 1.06 > deep well 0.45 > stream 0.20 > shallow well 0.15). The distribution of arsenic in Tibetan waters ranged between 77.35 μg/L in Ali prefecture and 1.17 μg/L in Chamdo prefecture, with intermediate values of 4.39, 2.52, 2.10, 1.68, and 1.51 μg/L in the prefectures of Shigatse, Nagchu, Lhasa, Lhoka, and Nyingchi, respectively. Carbonatite is a major source of elements in these waters. The non-carcinogenic risk in Tibet caused by heavy metals in drinking water is low overall, except in Ali prefecture’s surface and shallow ground waters, which contain high levels of As. Thus, deep well water in Tibet is safe to drink.

1. Introduction

As a main part of the Qinghai–Tibet Plateau and located in a mountainous region with ample precipitation and runoff, Tibet has abundant supplies of surface and ground waters. According to China’s Water Resource Report published in 2007, the average volume of surface water in Tibet is 4.394 × 10¹¹ m3 per year, which accounts for 17% of the total surface waters of China’s mainland, while the total volume of ground water resources is around 9.661 × 10¹⁰ m3 [1].
In recent years, several studies have reported the hydrochemical characteristics of natural waters in Tibet [2,3] and the associated distribution of arsenic (As) [4,5,6], selenium (Se) [7,8,9,10] and fluorine (F) [11,12,13,14,15]. Wang et al. [4] showed that arsenic concentrations exceeded 10 μg/L in 43.2% of stream water samples, as well as in all the samples from hot springs, saline lakes, well waters of the Seng-ge Kambab (upstream of the Indus River) and Yarlung Tsangpo (upstream of the Brahmaputra River) areas, and other drainage basins. Li et al. [5] found very high concentrations of arsenic in waters from two hot springs and seven alkaline salt lakes in western Tibet, reaching maximum values of 5985 μg/L and 10,626 μg/L, respectively. Tian et al. [3] also reported nine water samples with high arsenic levels (mean value 113.23 μg/L) in Damxung, Shuanghu, Gerze, Geji, and Seng-ge Kambab in northern Tibet and low selenium concentrations (maximum of 0.898 μg/L and mean of 0.154 μg/L) in all water samples collected in central and western Tibet (n = 60). Guo and Wang [7] analyzed 30 drinking water samples from Sangri, Nyêmo, Xaitongmoin, and Gongbo’gyamda counties. They found selenium concentrations ranging from 0.07 to 1.12 μg/L and arsenic concentrations ranging from 0.3 to 10.7 μg/L. Cao et al. [12] reported fluoride concentrations ranging from 0.02 to 0.18 mg/L in some rivers and well waters of central Tibet (n = 60), suggesting that most drinking water sources in Tibet are low in fluoride.
Previous studies have provided precious measurements from some areas of Tibet and laid a foundation for future studies of hydrochemical characteristics and distribution of arsenic, selenium, and fluorine in Tibet. There have also been some recent studies using real-life case studies on sustainability elsewhere [16,17,18,19,20,21]. However, these previous studies are generally limited to a small region or to a prefecture, focused on a single or a few chemical elements. There have been few systematic studies of the elemental composition and distribution in different types of natural waters (surface, shallow well, deep well, lake water, and hot spring) that have been conducted across all Tibetan prefectures. To our knowledge, there has not yet been a study assessing the quality and potential health risk of natural waters in Tibet.
In August and November 2014, 204 water samples, including 104 samples from surface waters, 84 from shallow well waters (depth < 50 m), nine from deep well waters (depth > 50 m), four from lake waters, and three from hot spring waters, were collected in 138 villages and towns, across 51 counties and regions such as Lhasa City (Shigatsey), Shigatse (Xigazê) prefecture, Chamdo (Qamdo) prefecture, Lhoka (Shannan) prefecture, Nyingchi (Nyingtri) prefecture, Nagchu (Nagqu) prefecture, and Ali (Ngari) prefecture in Tibet (Figure 1). The water samples were analyzed for major and trace elements. Concentrations of arsenic, selenium, and fluorine were examined more particularly. The distribution, source, and hydrochemical characteristics of sampled waters are discussed in this study, along with the water quality and the potential health risk associated with drinking water in each prefecture of Tibet.

2. Materials and Methods
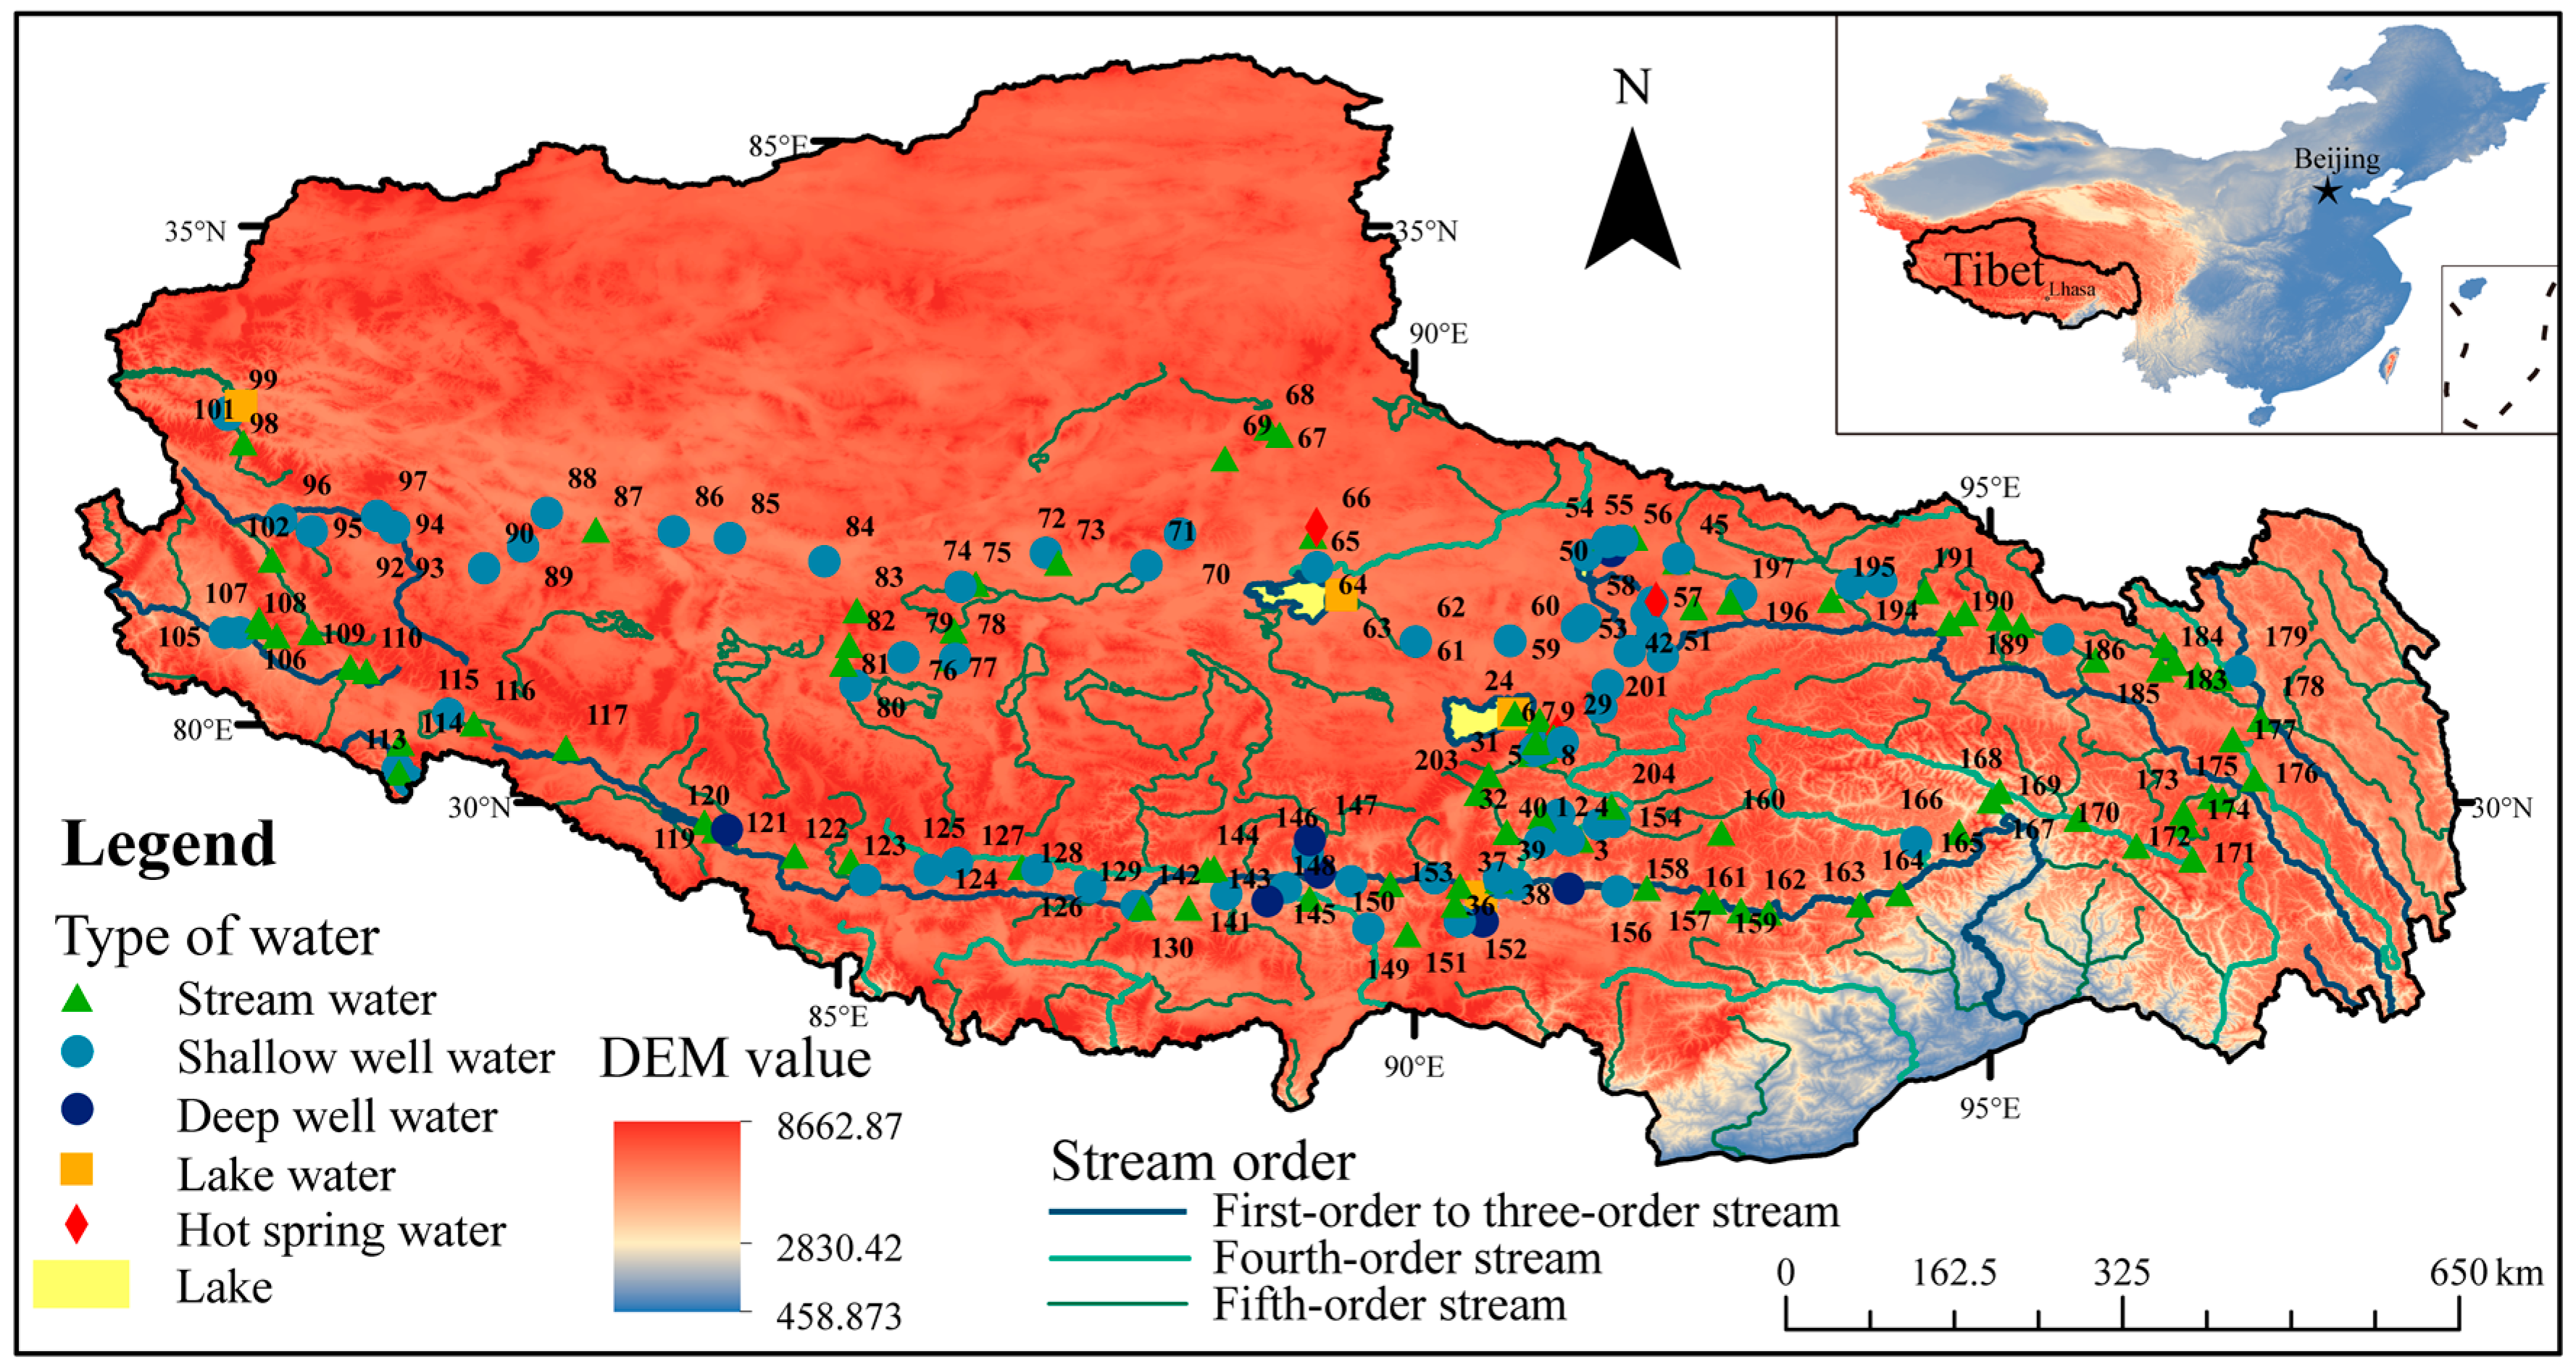
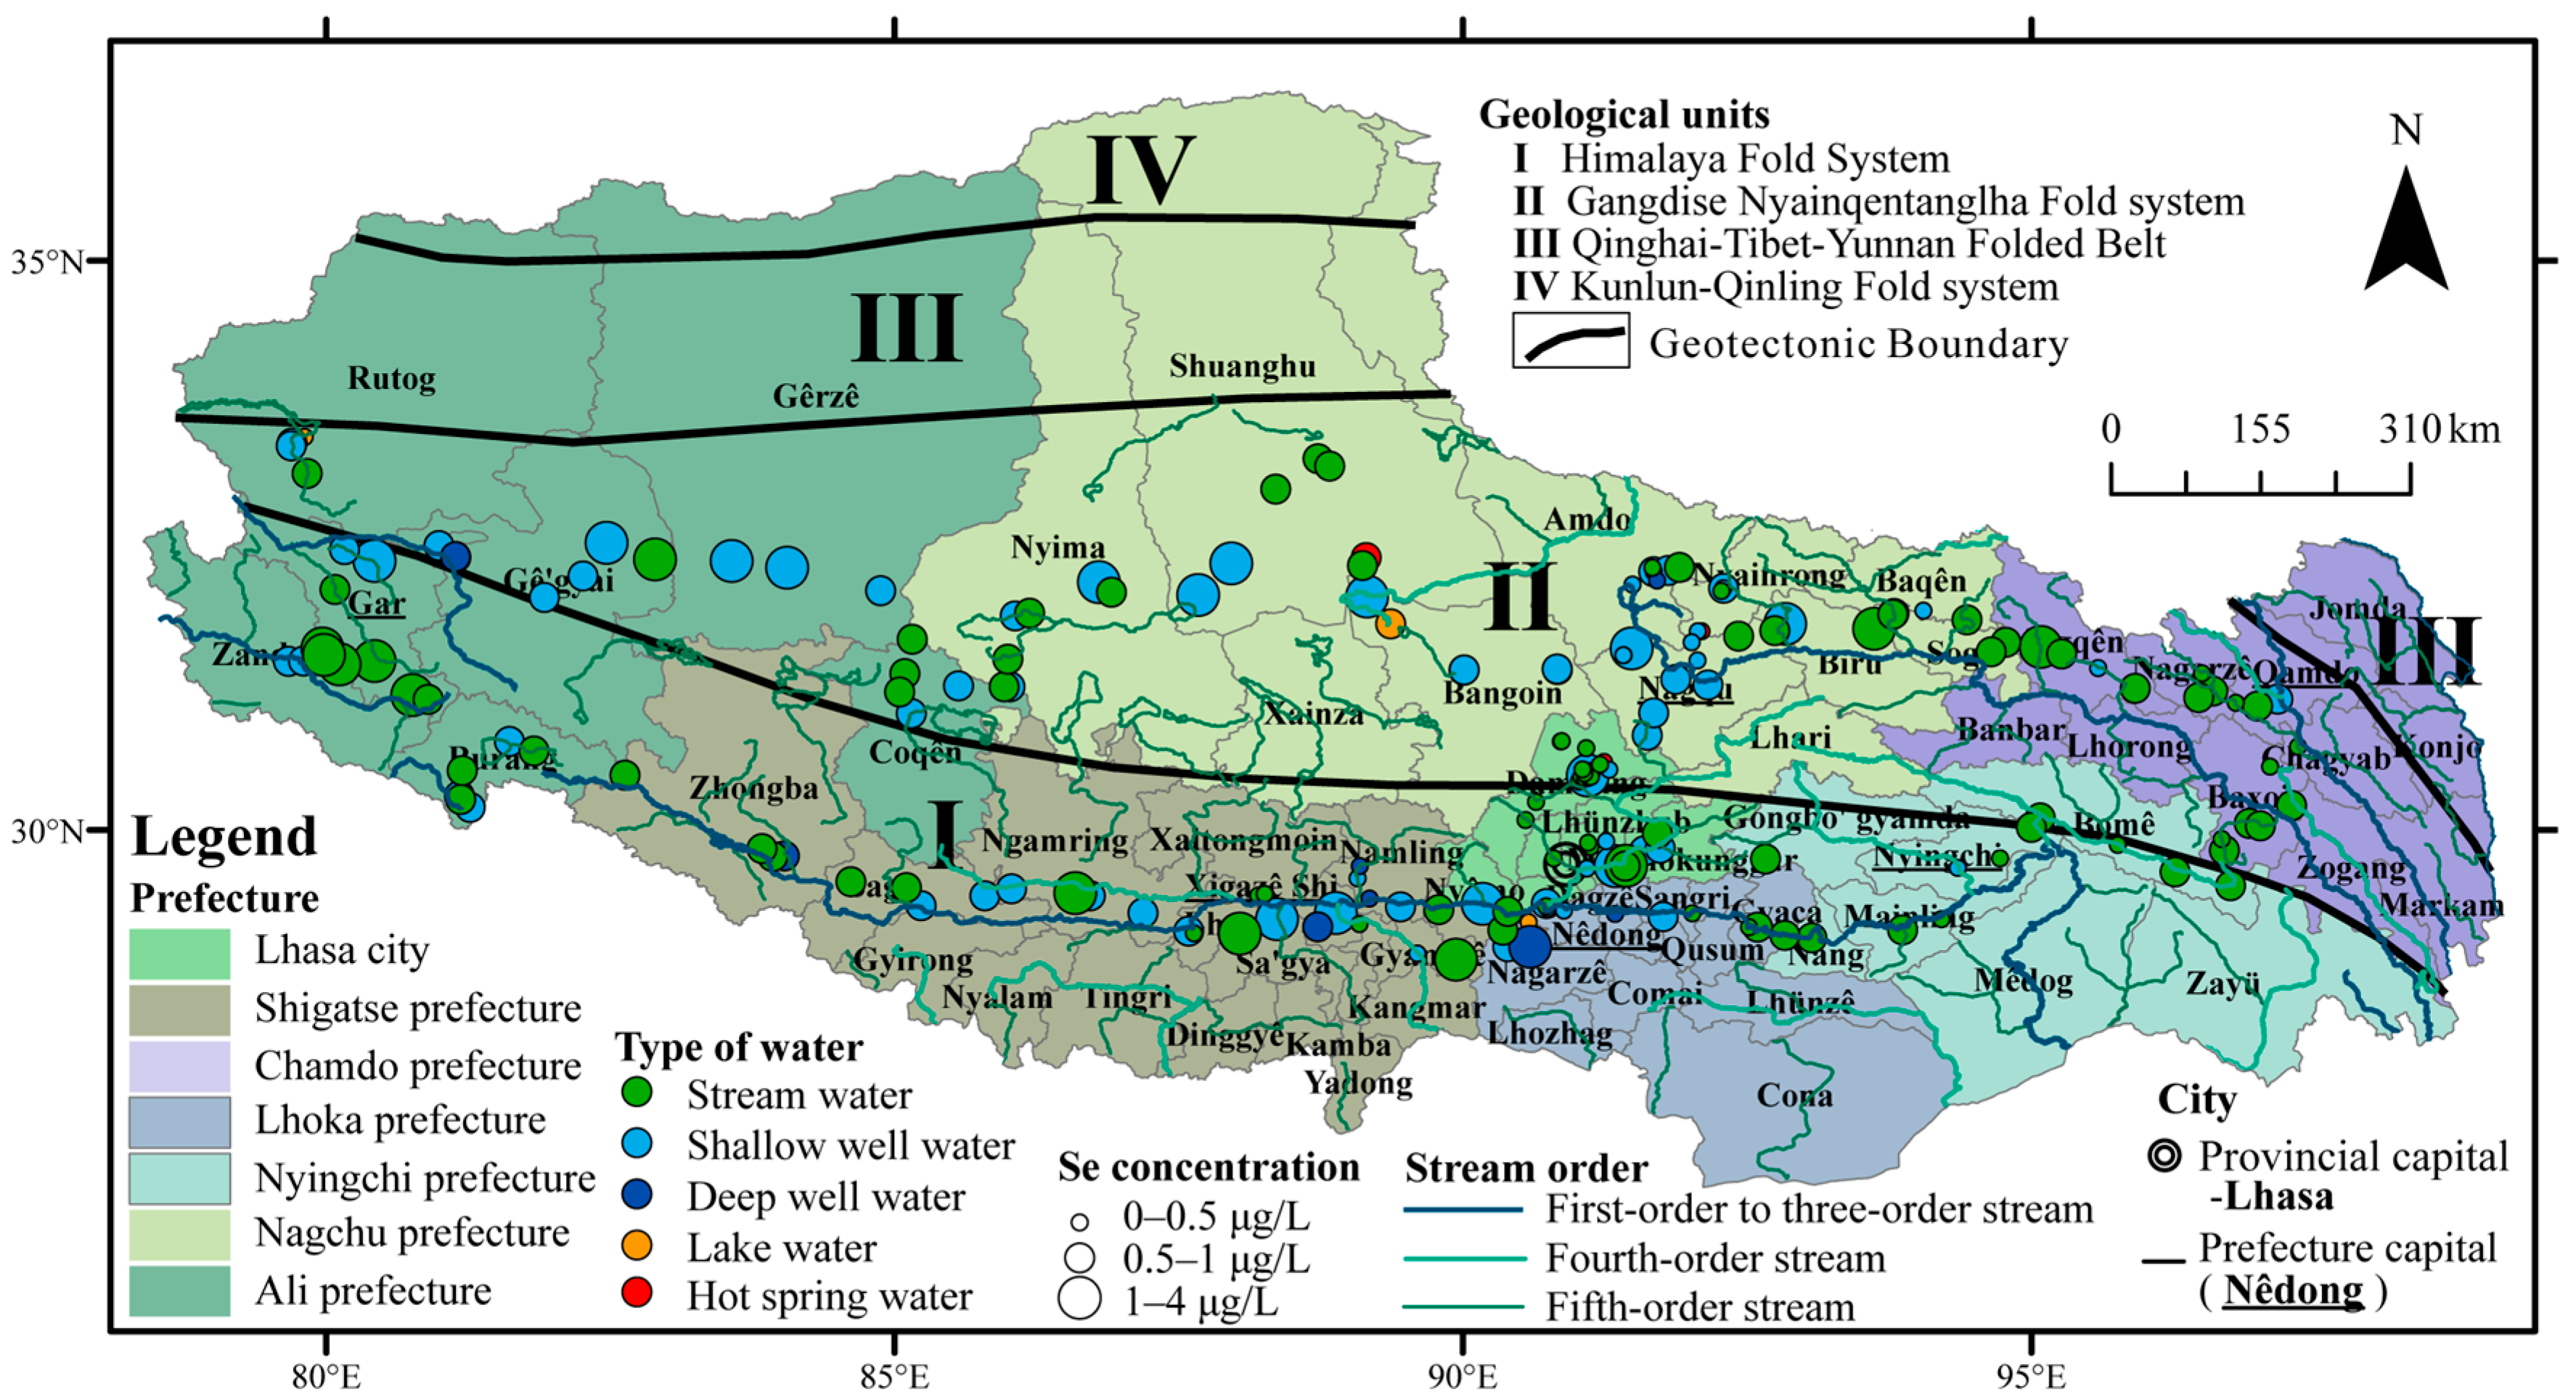
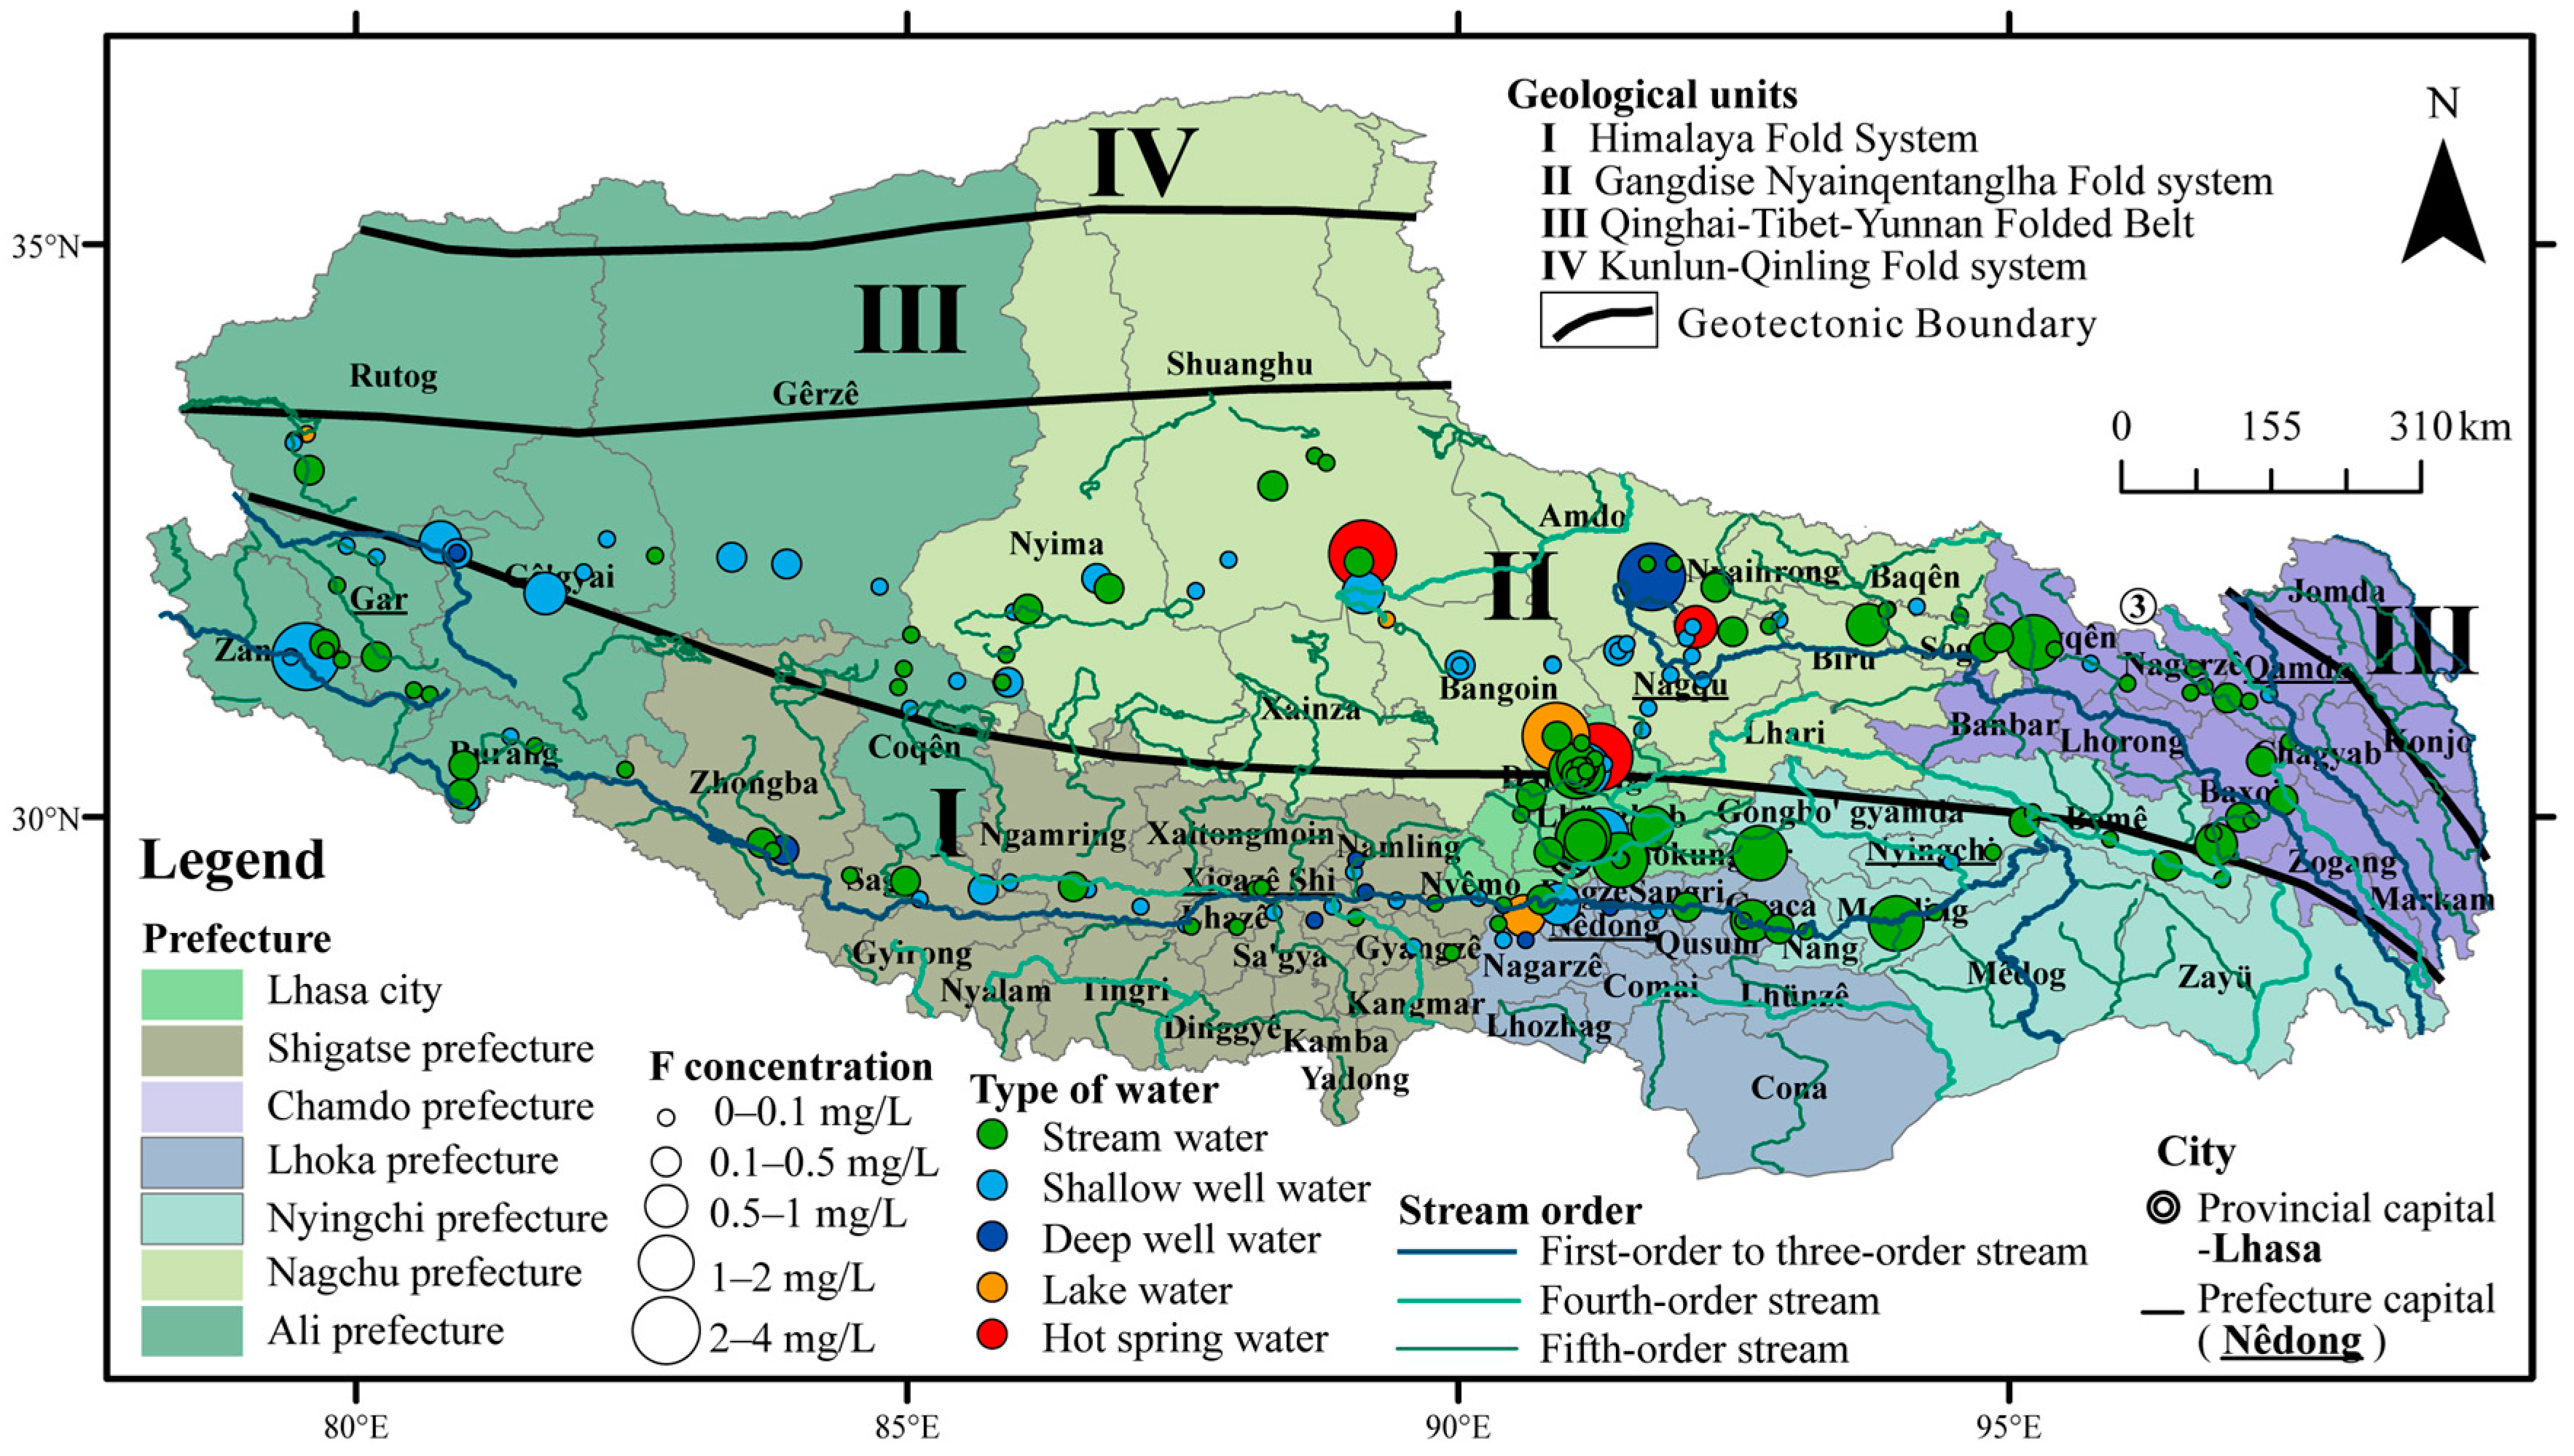
2.1. Study Area

The Autonomous Region of Tibet (26°44′–36°32′ N, 78°25′–99°06′ E) is located on the Qinghai–Tibet Plateau on the southwestern border of China. It has a land area of 1.22 × 10⁶ km2, with an average elevation higher than 4 km above sea level.

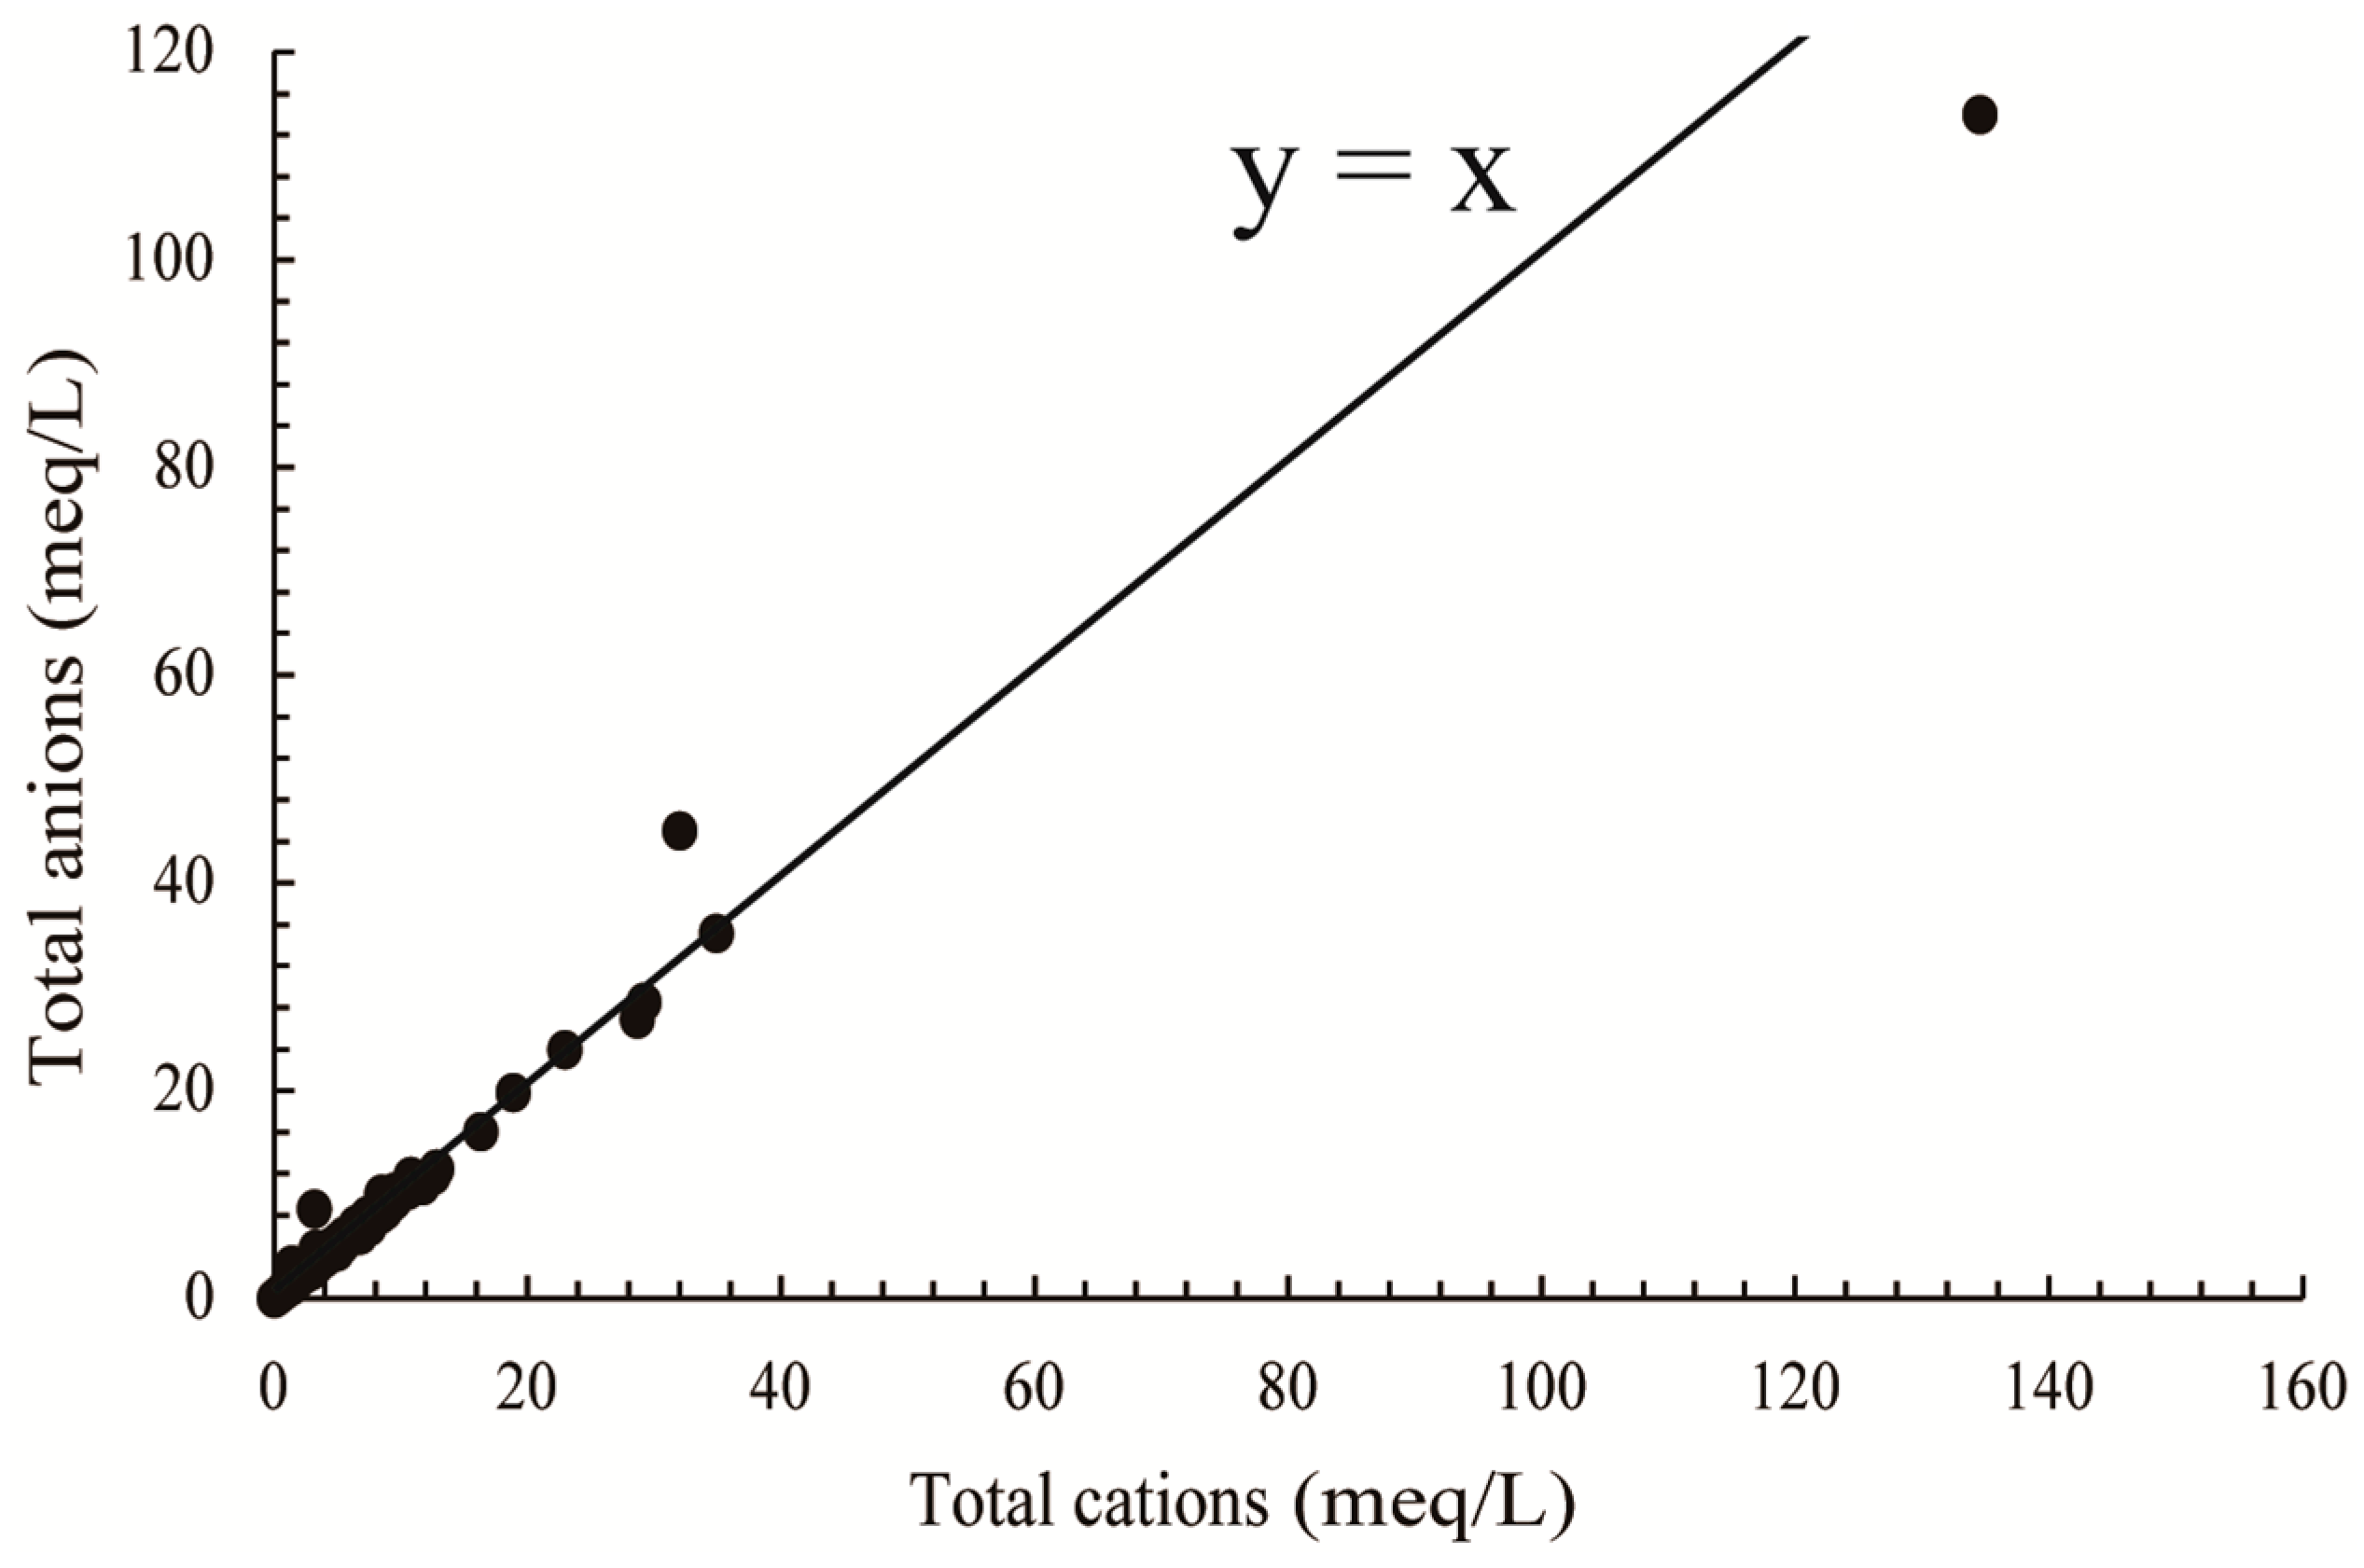
2.2. Sampling and Field Measurement

The Global Position System (GPS) location at each collection point was recorded using a handheld device (Rino 530HCx, GARMIN, Taipei, Taiwan). The pH, electrical conductivity (Ec), resistivity (RES), salinity (SAL), total dissolved solids (TDS), temperature (T), and Oxidation Reduction Potential (ORP) were determined using a pH tester (SevenGo SG2, Mettler Toledo, Zurich, Switzerland), Ec tester (SevenGo SG3, Mettler Toledo, Zurich, Switzerland), and ORP tester (SevenGo SG2), respectively. All water samples were stored in polyethylene bottles that had been previously cleaned with deionized water and maintained at 4 °C following collection. We collected and stored the water sample on the basis of the Standard Examination Methods for Drinking Water (GB/T 5750-2006) [22].

2.3. Laboratory Analysis

The alkalinity (HCO3 and CO32−) was determined using an acid–base titration [22,23]. Anions (F, Cl, SO42−, H2PO4, NO3, NO2, and Br) were analyzed using ion chromatography (ICS-900, Thermo Fisher Scientific, Waltham, MA, USA. Limit of detection (LOD): 0.001 mg/L) at the Institute of Geographic Sciences and Natural Resources Research, Chinese Academy of Sciences (IGSNRR, CAS), following the method 300.0 published by the U.S. Environmental Protection Agency [24]. Major cations (Ca, Mg, Na, K, P, Sr, B and SiO2) were determined using Inductively Coupled Plasma Optical Emission Spectrometry (ICP-OES, Optima 5300 DV, PerkinElmer, Waltham, MA, USA. LOD: 0.001 mg/L). The concentrations of trace elements (Li, Zn, U, Rb, Ba, Bi, Co, Cs, Ga, In, Ti, V, Ag, Al, Be, Cd, Cr, Cu, Fe, Hg, Mn, Mo, Ni, Pb, and Tl) were determined using Inductively Coupled Plasma Mass Spectrometry (ICP-MS, DRC-e, PerkinElmer, Waltham, MA, USA. LOD: 0.001 μg/L). Selenium and arsenic concentrations were determined using Hydride Generation Atomic Fluorescence Spectrometry (HG-AFS, AFS-9780, (HG-AFS, AFS-9780, Beijing Haiguang, Beijing, China. LOD: 0.01 μg/L) [22,23]. Quality assurance and control were performed using certified external standard solutions, internal standards, and replicated sample measurements during the analysis. For each method used, an additional sample was run every 20 samples to verify the stability of the results. External standard solutions for Al, As, Ba, Be, Bi, Ca, Cd, Co, Cr, Cs, Cu, Fe, Ga, In, K, Li, Mg, Mn, Ni, Pb, Rb, Se, Na, Ag, Sr, Ti, V, U, and Zn were prepared from Multi-element ICP-MS Calibration Standards (Lot# 15-76JB, Cat# N9300233). External standard solutions for F, Cl, SO42−, H2PO4, NO3, NO2, and Br were prepared from GBW(E)080549, GBW(E)080268, GBW(E)080266, GBW(E)080435, GBW(E)080264, GBW(E)080223, and BW3063 (GB stands for National Standards obtained from the Certified Reference Material Center, China), respectively.

3. Results and Discussion

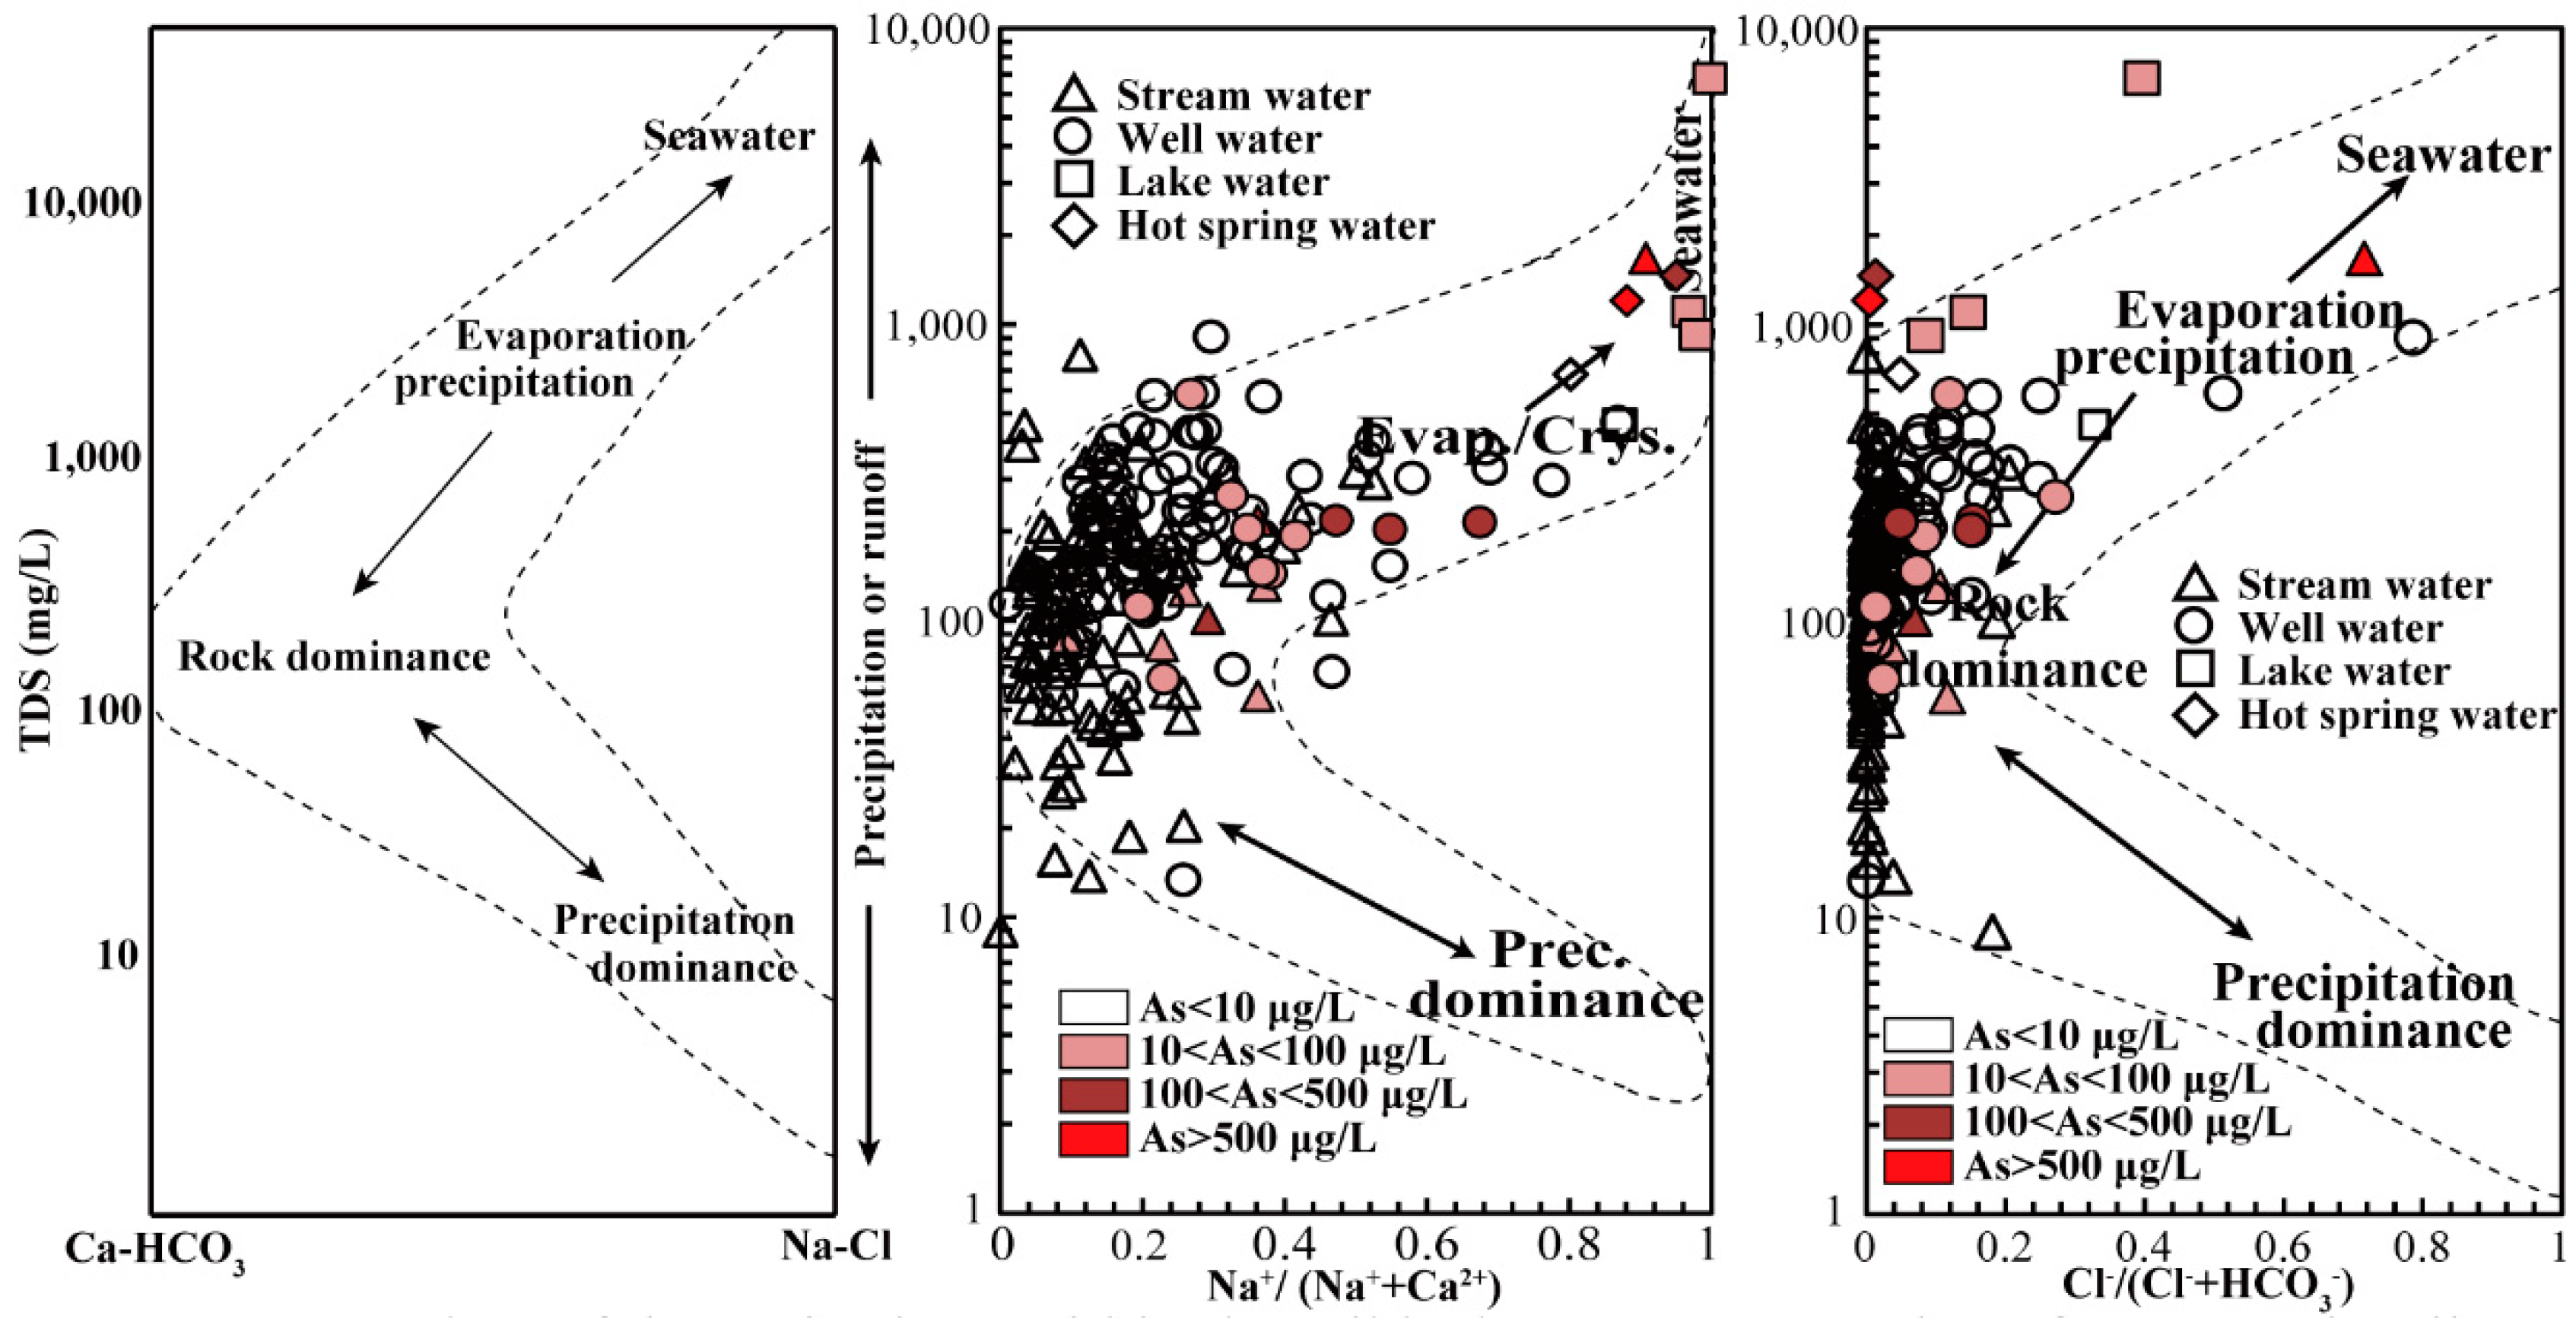
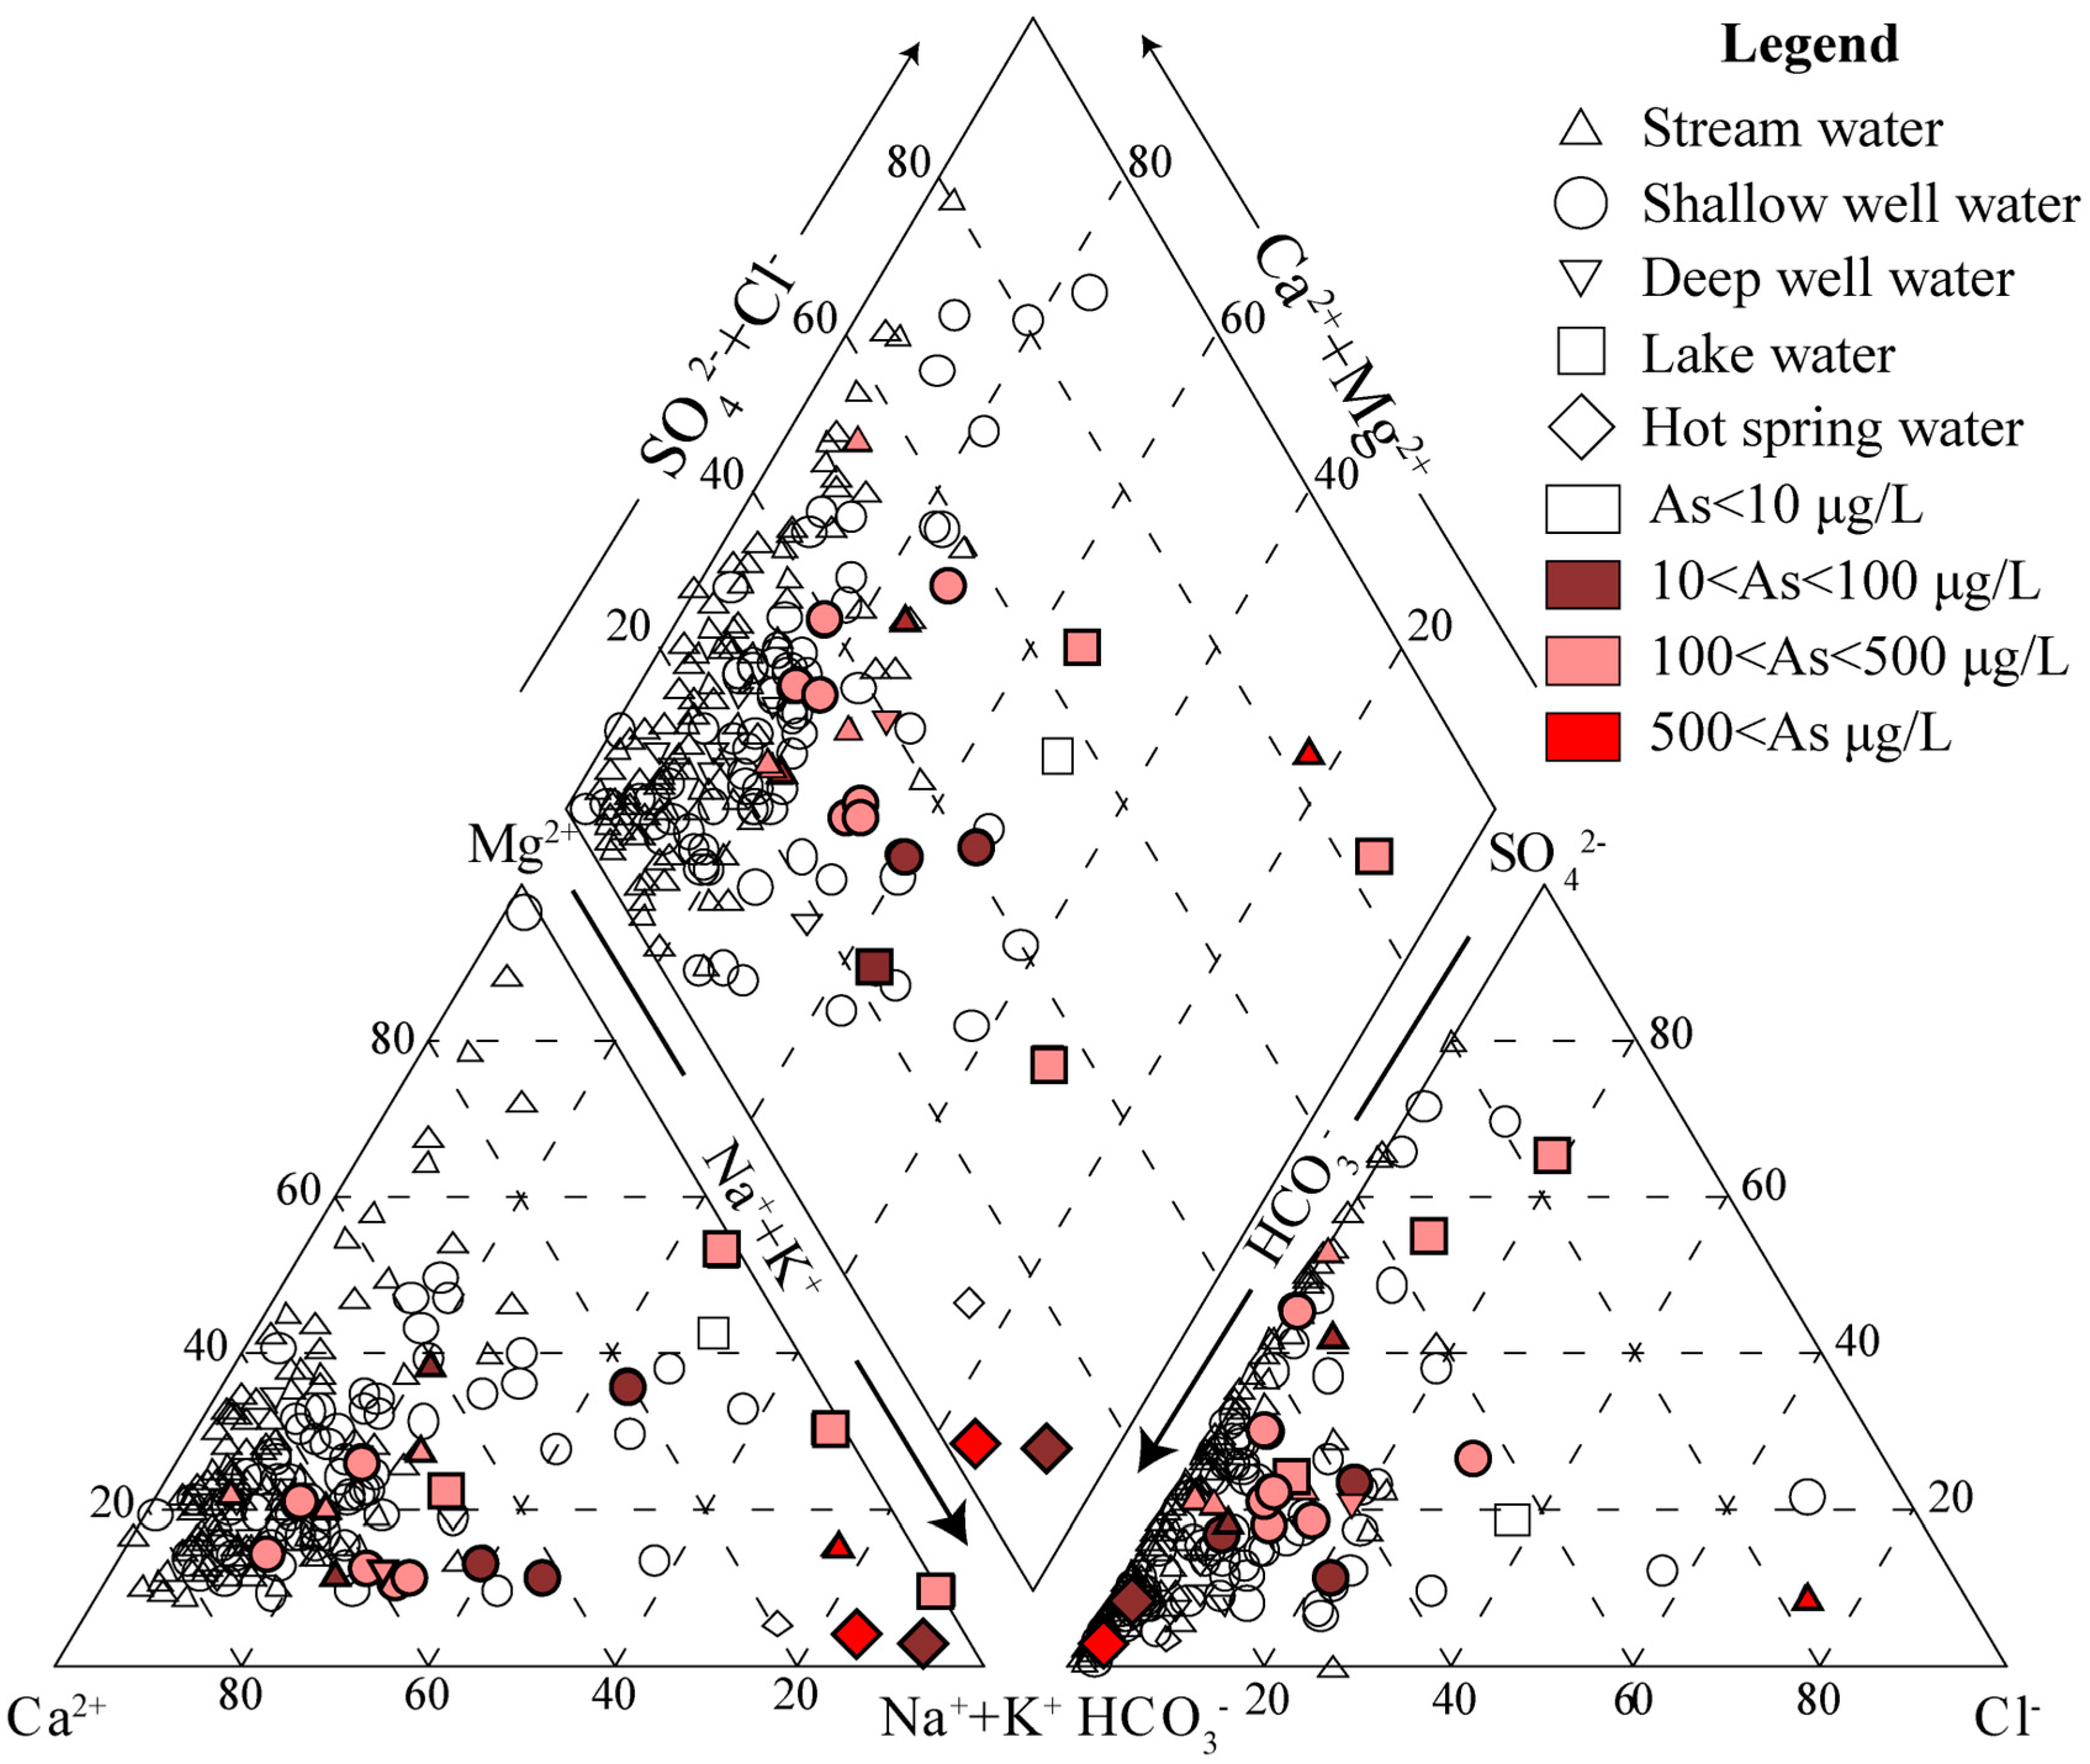
3.1. Water Chemistry

The percentage relative error of anion and cation concentrations measured in 203 out of 204 samples ranged from 0.03% to 4.7%, i.e., less than 5% (Figure 2). Sample 63, collected at Siling Lake, constituted an exception, with an 8.3% relative error. Therefore, it can be said that our data are accurate and dependable [25].
The water samples collected from Tibet have good hydrochemical and sensory characteristics (Table S1). The pH in these samples ranged from 5.1 to 8.9, with a mean value of 7.8, and the average TDS was 213.0 mg/L. Because the majority of our water samples were collected from stream runoff and dug wells, which are mainly recharged by melted ice or snow, we also estimated the hardness (TH) of the samples. This ranged from 0.99 mmol/L (very soft water) to 781 mmol/L (very hard water), with a mean value of 165.3 mmol/L. Two out of the four lake water samples had a particularly high TH of 781.0 mmol/L (Yamdrok Lake) and 681.4 mmol/L (Siling Lake).

3.2. Concentrations of Arsenic in Different Types of Water and Different Prefectures

The average arsenic concentrations in the different types of water are, in decreasing order (Figure 3): hot spring (241.4 μg/L, n = 3), lake (27.5 μg/L, n = 4), stream (22.1 μg/L, n = 104), shallow well (11.6 μg/L, n = 84), and deep well (6.2 μg/L, n = 9). Twenty-four out of 204 Tibet water samples contained arsenic concentrations higher than the World Health Organization (WHO) drinking water guideline value of 10 μg/L.
In addition to displaying high levels of As, Na+ and HCO3 are the dominating major cation and anion, respectively, for three hot spring water samples (Table S1) The arsenic concentrations measured in the hot spring waters of Chongga village, Gongtang township, and Damxung county (30.59011° N, 91.24375° E, altitude: 4300 m, temperature: 50 °C) are very low, at 3.0 μg/L.
In lake waters, arsenic concentrations ranged from 6.4 to 54.9 μg/L (Table S1), with an average of 27.5 μg/L. Three out of the four lake water samples had arsenic concentrations higher than the WHO drinking water guideline threshold for arsenic (10 μg/L).
The average arsenic concentrations of stream and dug well waters per prefecture, in order from highest to lowest, are (Figure 3): Ali (77.4 μg/L, n = 38), Shigatse (4.4 μg/L, n = 28), Nagchu (2.5 μg/L, n = 47), Lhasa City (2.1 μg/L, n = 42), Lhoka (1.7 μg/L, n = 13), Nyingchi (1.5 μg/L, n = 10), and Chamdo (1.2 μg/L, n = 19). More than 42% of stream and well waters from Ali prefecture displayed As concentrations above 10 μg/L, which is the WHO drinking water guideline threshold. In Ali prefecture, the average values of arsenic concentrations in stream and dug well waters is 132.3 μg/L (n = 16) and 37.4 μg/L (n = 22), respectively.
The results show that the distribution of arsenic in Tibet’s natural waters is unbalanced, and regional characteristics appear clearly. Overall, the arsenic concentrations in Tibet’s natural waters tend to follow a westward gradient, with higher values in the west than in the east. Most of the streams and ground waters in the prefectures of Shigatse, Nagchu, Lhasa, Lhoka, Nyingchi, and Chamdo have low arsenic levels, which will not be able to affect the health of human body. The highest arsenic concentrations were measured in the Ali prefecture area, exceeding the safe levels for arsenic (10 μg/L). Therefore, it is essential to carry out further research on endemic arsenic poisoning in prefectures with a high arsenic exposure risk, as well as on the genesis of waters with a high arsenic concentration.

3.3. Concentrations of Selenium in Different Types of Water and Different Prefectures

The average selenium concentrations measured in different types of waters, from highest to lowest, are (Figure 4): deep well (0.85 μg/L, n = 9), shallow well (0.68 μg/L, n = 84), stream (0.62 μg/L, n = 104), hot spring (0.39 μg/L, n = 3), lake (0.36 μg/L, n = 4) waters. None of the 204 water samples collected across Tibet showed selenium concentrations higher than the WHO drinking water guideline threshold for selenium (10 μg/L).
The average selenium concentrations per prefecture, in order from highest to lowest, are (Figure 4): Ali (0.87 μg/L, n = 39), Shigatse (0.78 μg/L, n = 28), Nagchu (0.71 μg/L, n = 50), Lhoka (0.68 μg/L, n = 14), Chamdo (0.66 μg/L, n = 19), Nyingchi (0.46 μg/L, n = 10) prefectures, and Lhasa City (0.30 μg/L, n = 44).
The results show that the selenium concentrations in all types of water and prefectures are very low, and that western shallow well waters display slightly higher levels than eastern shallow well waters. Low selenium concentrations can affect the health of the human body and cause endemic diseases, such as Kashin–Beck Disease (KBD), the most serious endemic disease of Tibet. Therefore, it is essential to carry out further research on the extent of KBD in Tibet, as well as on the genesis of water with low selenium concentration.

3.4. Concentrations of Fluorine in Different Types of Water and Different Prefectures

The average fluorine concentrations in each type of water, in decreasing order, are (Figure 5): hot spring (2.1 mg/L, n = 3), lake (1.1 mg/L, n = 4), deep well (0.45 mg/L, n = 9), stream (0.20 mg/L, n = 104), and shallow well (0.15 mg/L, n = 84). Thirteen out of the 204 samples contained fluorine concentrations higher than the WHO drinking water guideline value for fluorine (1 mg/L).
The average fluorine concentrations in streams and dug well waters per prefecture, from highest to lowest, are (Figure 5): Lhasa City (0.29 mg/L, n = 42), Lhoka (0.23 mg/L, n = 13), Nagchu (0.19 mg/L, n = 50), Chamdo (0.18 mg/L, n = 19), Nyingchi (0.18 mg/L, n = 10), Ali (0.18 mg/L, n = 38), and Shigatse (0.05 mg/L, n = 28).
The results show that the distribution of fluorine in Tibet natural waters is unbalanced. Overall, fluorine concentrations are more elevated in the midland than in the western and eastern regions. However, most shallow and deep well waters in the Tibet midland display low concentrations of fluorine, while in the west, the levels of fluorine in shallow well waters is higher than in deep well and surface waters. Concentrations of fluorine in lakes ranged from 0.00 to 3.7 mg/L (Table S1). Two out of the three hot spring water samples had higher fluorine concentrations higher than the WHO drinking water guideline value for fluorine (1 mg/L).

3.5. Elemental Concentration and Hydrochemical Characteristics of Tibet’s Natural Waters

According to the World Health Organization (WHO) drinking water guideline and Chinese national standards [27,28], the “optimum” or recommended concentrations of arsenic, selenium, and fluorine in drinking water are below 10 μg/L (arsenic), above 10 μg/L (selenium), and below 1 mg/L (fluorine). The selenium concentrations measured in Tibet’s natural waters meet both the Chinese national standard and the international standard.
The ratio of major ions in water samples can be clearly shown with a Piper diagram [29], and the percentage of major ions determines the hydrochemical characteristics of water [29,30,31]. Most stream and well waters sampled are slightly alkaline, with an average pH of 7.8 (Table S1), and Ca–Mg–HCO3 (n = 45), Ca–Mg–HCO3–SO4 (n = 33), Ca–HCO3 (n = 31), and Ca–HCO3–SO4 (n = 21) as most water types of these water samples.
Lake waters are dominated by Na–Mg–HCO3–SO4, Mg–Na–SO4–HCO3, Na–SO4, and Na–Mg–HCO3–Cl, with an average pH of 8.2, while Na–HCO3 is the water type of all hot spring water samples, with an average pH of 7.4. Water samples with high arsenic concentrations (>10 μg/L) generally contain high proportions of Na+, K+, and Cl ions (Figure 6).

3.6. Preliminary Discussion of the Causes of Variation in Tibetan Water Samples

The boomerang envelope model [32] describes three types of water: (1) water from evaporation/crystallization; (2) water from rock weathering; and (3) water from atmospheric precipitation.
The chemical composition of Tibet waters is mainly controlled by rock weathering (Figure 7), which is consistent with other studies led in Tibet [3] and other places of the world, including the Yangtze River, the Amazon River, and the Ganges [32]. The Gibbs boomerang envelope plot shows that the main process controlling the composition of streams is rock weathering. Compared to stream waters, well waters in Tibet are more close to evaporation or crystallization, and they seem fragmented, which suggests that the chemical composition of groundwater is diverse and originates from complex processes. Water from the salt lakes of Namtso, Siling, and Pangong is similar to seawater. However, the water in Yamdrok (freshwater lake) results from evaporation, which is different from salt lakes. As a result of the high temperatures, elements in the hot spring waters are found in high concentrations and these water samples are close to seawater in the Gibbs boomerang envelope.

3.7. Correlations of Elemental Concentrations

Pearson’s correlation coefficient provides an estimate of a linear relationship. It is one of the most widely used statistical quantities in all the natural sciences [33]. We calculate the Pearson’s coefficient using IBM SPSS (Statistic Package for Social Science) for linear correlations between the concentrations of arsenic, selenium, fluorine concentration, and other major and trace elements. The results (Table 1) show that arsenic is highly correlated with Cl (0.73), Li (0.83), Tl (0.74), Cs (0.94), Rb (0.94), Hg (0.95), and B (0.93). However, there is no statistically significant correlation between selenium, fluorine, and the other elements, respectively.
Thallium is also highly thiophile, and it contributes to non-ferrous metals and precious metal mineralization via the formation of deposits with Hg, Rb, As, Cu, Pb, Zn, Fe, Au, and Ag [34]. Thallium is also strongly thiophile, and its participation in non-ferrous metals and precious metal mineralization of deposit with Hg, Rb, As, Cu, Pb, Zn, Fe, Au, and Ag [35]. This may be the reason why arsenic concentrations have a high correlation with Tl, Cs, Rb, and Hg concentrations. Therefore, it is essential to carry out further research on the genesis of water with a high arsenic concentration.

3.8. Assessment of Potential Health Risk in Tibet’s Natural Waters

3.8.1. Exposure Assessment

The exposure of human beings to trace metals occurs via three main pathways including direct ingestion, inhalation through mouth and nose, and dermal absorption through skin exposure. Exposure by ingestion is common from drinking water. The dose received through the individual pathway considered was determined using Equation (1), modified from the U.S. Environmental Protection Agency [36]:
ADD = Cw × IR × ABS g × EF × ED ( BW × AT ) ,
where ADD is the average daily dose by ingestion (μg/kg/day); Cw, the average concentration of trace metals in water (μg/L); IR, the ingestion rate (L/day); ABSg, the gastrointestinal absorption factor (no dimension); EF, the exposure frequency (days/year); ED, the exposure duration (years); BW, the body weight (kg); and AT, the average time (days). Standard values for each variable are found in the U.S. EPA materials [36] as: IR = 2 L/day, ABSg = 100%, EF = 365 days/year, ED = 30 years, BW = 70 kg, AT = 25,550 days. We calculated the average daily dose by ingestion from different types of natural water (surface and ground) from different Tibetan cities (see Table 2).

3.8.2. Non-Carcinogenic Risk

The risk was characterized and quantified into carcinogenic and non-carcinogenic risks. Potential non-carcinogenic risks, reflected by the hazard quotient (HQ), were estimated by comparing the exposure or the average intake of contaminants via ingestion with the corresponding reference dose (RfD) using Equation (2). If HQ exceeds 1, there might be concern for non-carcinogenic effects. To evaluate the total potential non-carcinogenic risks posed by more than one pathway, the hazard index (HI) was introduced, estimated as the sum of the HQs from all applicable pathways using Equation (3). HI above 1 indicated a potential for adverse effect on human health or the necessity of further study [37]:
HQ = ADD RfD
HI = k = 0 n HQ ,
where RfD originates from a risk-based concentration table established by the U.S. EPA in April 2009 [36] (Table 3).
Based on the HQ values obtained for single paths and elements, the non-carcinogenic risk caused by heavy metals in drinking water is lower than 1, except for As in Ali prefecture. The HQ of both surface (HQ1) and ground (HQ2) waters in Ali prefecture are above 1 (Table 3), with HQ1 even reaching 5.4, which constitutes a prominent non-carcinogenic risk. The non-carcinogenic risk assessment indicated that As was the most important pollutant in the Ali prefecture.

3.8.3. Carcinogenic Risk

Carcinogenic risks were evaluated using Equation (4), and the detailed calculation process described in Li and Zhang [37], De Miguel et al. [38] and Wu et al. [39] was followed. The estimated value was the incremental probability of an individual developing any type of cancer over a lifetime, due to carcinogenic exposure.
Carcinogenic   risks = ADD × CSF
where CSF = cancer slope factor. In the carcinogenicity classification system of chemicals from the International Agency for Research on Cancer (IARC) and the World Health Organization (WHO), the carcinogenic slope factor (CSF) is 1500 (μg/kg/day)−1 [36].
The range of acceptable carcinogenic risks varies from one country to another. The range of carcinogenic risks labeled as acceptable or tolerable by the U.S. EPA was 10−6 to 10−4 [36], while the control standards in some European Union countries are around 1 × 10⁻⁶ [40]. The carcinogenic risks of As in natural waters of Tibet differs in the various prefectures, as listed in Table 4. Considering that the different forms of As have different physicochemical properties and toxicity, we make a conservative evaluation of possible carcinogenic risks linked to the levels of total As in Tibet’s natural waters. This indicates that the ingestion of water over a long lifetime, especially in Ali prefecture, could increase the probability of cancer.

4. Conclusions

Most stream and well waters are slightly alkaline, with an average pH of 7.8, and the dominant cation and anion in these water samples are Ca2+ and HCO3, respectively. The mean value of TDS in water samples is 213.0 mg/L; therefore, the majority of natural waters in Tibet are suitable for drinking. The TH (hardness) of these samples ranged from 0.99 (very soft water) to 781 (very hard water), with a mean value of 165.3 mmol/L.
The Gibbs boomerang envelope shows that the chemical composition of surface and ground waters in Tibet is controlled by rock weathering. The source of surface and ground water elements in Tibet is dominated by carbonatite.
Arsenic concentrations display a westward gradient, with the highest values measured in Ali prefecture. Selenium concentrations in all types of water and all prefectures are very low, and a regional pattern was found in shallow well waters, with higher concentrations in the west than in the east. Fluorine concentrations in Tibet water are overall higher in the midland compared to the western and eastern regions. The fluorine content of most shallow and deep well waters in the midland of Tibet is low, and fluorine is more abundant in shallow wells than in deep wells, and in surface waters in western Tibet. The deep well waters in Tibet have the highest selenium content, the lowest arsenic content, and low fluorine. Thus, the deep well waters in Tibet are relatively safe to drink.
Arsenic concentrations are highly correlated with Cl, Li, Tl, Cs, Rb, Hg, and B concentrations, which are elements interacting with arsenic during its process of diagenesis. No statistically significant correlation was found between selenium, fluorine, and other elements. This shows that the original rocks make a low contribution to selenium and fluoride content in groundwater, and that the enrichment or lack of selenium and fluorine may be associated with geographic and climatic factors.
Except for the As measured in Ali prefecture, the non-carcinogenic risk in Tibet caused by heavy metals in drinking water is below 1. The HQ1 and HQ2 in Ali prefecture is higher than 1, which corresponds to a prominent non-carcinogenic risk. The ingestion of water over a long lifetime, especially in Ali prefecture, could increase the probability of cancer.
Tibet is a well-known tectonic activity area set across four geological units: The Himalaya Fold System (Figure 3, I), the Gangdise Nyainqentanglha Fold system (Figure 3, II), the Qinghai–Tibet–Yunnan Folded Belt (Figure 3, III), and the Kunlun–Qinling Fold system (Figure 3, IV). Different geological units have different geological background, strata framework, and geologic processes [26], which implies that the material basis of the geological units is diverse and may cause the trace elements content in water to be different [41,42]. Meanwhile, Tibet is a pure land with few human activities and low influence, so a diverse background of geological units most probably leads to different trace elements content, and high As or F concentrations, especially, are imputable to geogenic origin. Therefore, it is essential to carry out further research on the origin of the water’s trace elements and their relations with the geological background in Tibet.
Other fields that need further research attention are the health effect of arsenic, selenium, and fluorine poisoning in prefectures with high and low exposure risks, as well as the genesis of water with high or low concentrations of elements (arsenic, selenium, and fluorine). Risks linked to arsenic should be closely monitored for local residents, with special care for sensitive children. Measures must be taken for a more sustainable and healthy aquatic ecosystem.

Supplementary Materials

The following are available online at www.mdpi.com/2073-4441/8/12/568/s1, Table S1: Chemical composition of water.

Acknowledgments

This research was supported by the National Key Basic Research Program of China (973 Program) (No. 2014CB238906), the National Natural Science Foundation of China (Grant No. 41472322, 41172310), the National Key Technologies R&D Program in the 12th Five-Year Plan of China (No. 2014BAD14B006, No. 2011BAD17B05-4), and the Natural Science Foundation of Tibet (No. 2016ZR-15-76). The authors thank Hongzhi Zhang, Chengshuo Zhang, Runxiang Ni, Xun Zhou, Pengda Wu, Liyan Tian, Jie Ma, and Yange Wang for valuable assistance in the laboratory and field. The authors are also grateful to Kunli Luo’s laboratory and Qinjun Guo’s laboratory in IGSNRR, CAS for laboratory analysis of all of the water samples.

Author Contributions

Chengqun Yu, Kunli Luo and Yuan Tian conceived and designed the experiments; Yuan Tian, Jianshuang Wu and Chujian Feng collected the samples; Yuan Tian and Xinjie Zha performed the experiments; Yuan Tian analyzed the data; Yuan Tian and Xinjie Zha contributed reagents/materials/analysis tools; Yuan Tian wrote the paper; Kunli Luo, Chengqun Yu, Xinjie Zha and Xing Gao revised the manuscript. All the authors have contributed to this work.

Conflicts of Interest

The authors declare no conflict of interest.

References

  1. Ministry of Water Resources of the People’s Republic of China (MWR). China’s Water Resource Report in 2007; MWR: Beijing, China, 2009.
  2. Sheng, Y.; Rui, Y.; Yu, Y. Heavy metal pollution in water of rivers and lake in Tibet by ICP-MS. Asian J. Chem. 2012, 24, 5403–5404. [Google Scholar]
  3. Tian, Y.; Yu, C.; Luo, K.; Zha, X.; Wu, J.; Zhang, X.; Ni, R. Hydrochemical characteristics and element contents of natural waters in Tibet, China. J. Geogr. Sci. 2015, 25, 669–686. [Google Scholar] [CrossRef]
  4. Wang, M.; Li, S.; Wang, H.; Xiao, T.; Zheng, B. Distribution of arsenic in surface water in Tibet. Environ. Sci. 2012, 33, 3411–3416. [Google Scholar]
  5. Li, S.; Wang, M.; Yang, Q.; Wang, H.; Zhu, J. Enrichment of arsenic in surface water, stream sediments and soils in Tibet. J. Geochem. Explor. 2012, 135, 104–116. [Google Scholar] [CrossRef] [PubMed]
  6. Li, S.; Xiao, T.; Zheng, B. Medical geology of arsenic, selenium and thallium in China. Sci. Total Environ. 2012, 421, 31–40. [Google Scholar] [CrossRef] [PubMed]
  7. Guo, Q.; Wang, Y. Hydrochemical anomaly of drinking waters in some endemic kashin-beck disease areas of Tibet, China. Environ. Earth Sci. 2012, 65, 659–667. [Google Scholar] [CrossRef]
  8. La Grange, M.; Mathieu, F.; Begaux, F.; Suetens, C.; Durand, M.-C. Kashin-beck disease and drinking water in central Tibet. Int. Orthop. 2001, 25, 167–169. [Google Scholar] [CrossRef] [PubMed]
  9. Moreno-Reyes, R.; Suetens, C.; Mathieu, F.; Begaux, F.; Zhu, D.; Rivera, M.T.; Boelaert, M.; Nève, J.; Perlmutter, N.; Vanderpas, J. Kashin–beck osteoarthropathy in rural tibet in relation to selenium and iodine status. N. Engl. J. Med. 1998, 339, 1112–1120. [Google Scholar] [CrossRef] [PubMed]
  10. Li, S. Study on the relationship between selenium concentrations in drinking water and kashin-beck disease in Tibet. Chin. J. Epidemiol. 2006, 25, 428–429. [Google Scholar]
  11. Cao, J.; Zhao, Y.; Liu, J.; Xirao, R.; Danzeng, S. Environmental fluoride content in Tibet. Environ. Res. 2000, 83, 333–337. [Google Scholar]
  12. Cao, J.; Zhao, Y.; Liu, J.; Xirao, R.; Danzeng, S. Fluoride concentrations of water sources in Tibet. Fluoride 2000, 33, 205–209. [Google Scholar]
  13. Cao, J.; Zhao, Y.; Liu, J. Brick tea consumption as the cause of dental fluorosis among children from Mongol, Kazak and Yugu populations in China. Food Chem. Toxicol. 1997, 35, 827–833. [Google Scholar] [CrossRef]
  14. Cao, J.; Zhao, Y.; Liu, J.; Bai, X.; Zhou, D.; Fang, S.; Jia, M.; Wu, J. Fluorine intake of a Tibetan population. Food Chem. Toxicol. 1996, 34, 755–757. [Google Scholar] [CrossRef]
  15. Cao, J.; Bai, X.; Zhao, Y.; Liu, J.; Zhou, D.; Fang, S.; Jia, M.; Wu, J. The relationship of fluorosis and brick tea drinking in Chinese Tibetans. Environ. Health Perspect. 1996, 104, 1340–1343. [Google Scholar] [CrossRef] [PubMed]
  16. Zhao, M.Y. Multiple criteria data envelopment analysis for full ranking units associated to environment impact assessment. Int. J. Environ. Pollut. 1998, 41, 2279–2280. [Google Scholar] [CrossRef]
  17. Xie, J.X. A hybrid adaptive time-delay neural network model for multi-step-ahead prediction of sunspot activity. Int. J. Environ. Pollut. 2006, 28, 364–381. [Google Scholar] [CrossRef]
  18. Wu, C.L.; Chau, K.W.; Li, Y.S. Methods to improve neural network performance in daily flows prediction. J. Hydrol. 2009, 372, 80–93. [Google Scholar] [CrossRef]
  19. Wang, W.C.; Xu, D.M.; Chau, K.W.; Lei, G.J. Assessment of river water quality based on theory of variable fuzzy sets and fuzzy binary comparison method. Water Resour. Manag. 2014, 28, 4183–4200. [Google Scholar] [CrossRef]
  20. Muttil, N.; Chau, K.W. Machine-learning paradigms for selecting ecologically significant input variables. Eng. Appl. Artif. Intell. 2007, 20, 735–744. [Google Scholar] [CrossRef] [Green Version]
  21. Chau, K.W.; Wu, C.L. A hybrid model coupled with singular spectrum analysis for daily rainfall prediction. J. Hydroinf. 2010, 12, 458–473. [Google Scholar] [CrossRef]
  22. GB/T 5750-2006 Standards Examination Methods for Drinking Water; China Standards Press: Beijing, China, 2007.
  23. Chinese SEPA. Methods for Chemical Analysis of Water and Waste Water, 4th ed.; China Environmental Science Press: Beijing, China, 2002. [Google Scholar]
  24. U.S. Environmental Protection Agency (EPA). Determination of Inorganic Anions by Ion Chromatography; Environmental Protection Agency Environmental Monitoring Systems Laboratory Office of Research and Development: Cincinnati, OH, USA, 1993.
  25. Shen, Z.; Zhu, W.; Zhong, Z. Hydrogeochemical Basis; Geological Publishing House: Beijing, China, 1986. [Google Scholar]
  26. Ma, L.; Qiao, X.; Liu, N. Geological atlas of China; Geological Publishing House: Beijing, China, 2002. [Google Scholar]
  27. GB 5749-2006 Standards for Drinking Water Quality; China Standards Press: Beijing, China, 2007.
  28. World Health Organization. Guidelines for Drinking-Water Quality; World Health Organization: Geneva, Switzerland, 2008. [Google Scholar]
  29. Piper, A.M. A graphic procedure in the geochemical interpretation of water-analyses. Eos Trans. Am. Geophys. Union 1944, 25, 914–928. [Google Scholar] [CrossRef]
  30. Chen, L.; Wang, G.; Hu, F.; Wang, Y.; Liu, L. Groundwater hydrochemistry and isotope geochemistry in the Turpan basin, northwestern China. J. Arid Land 2014, 6, 378–388. [Google Scholar] [CrossRef]
  31. Zhu, B.; Yang, X.; Rioual, P.; Qin, X.; Liu, Z.; Xiong, H.; Yu, J. Hydrogeochemistry of three watersheds (the Erlqis, Zhungarer and Yili) in northern Xinjiang, NW China. Appl. Geochem. 2011, 26, 1535–1548. [Google Scholar] [CrossRef]
  32. Gibbs, R.J. Mechanisms controlling world water chemistry. Science 1970, 170, 1088–1090. [Google Scholar] [CrossRef] [PubMed]
  33. Mudelsee, M. Correlation. In Climate Time Series Analysis; Springer: Berlin, Germany, 2010; Volume 42, pp. 285–338. [Google Scholar]
  34. Wedepohl, K.H.; Correns, C.W. Handbook of Geochemistry; Elsevier: Amsterdam, The Netherlands, 1969. [Google Scholar]
  35. Peter, A.J.; Viraraghavan, T. Thallium: A review of public health and environmental concerns. Environ. Int. 2005, 31, 493–501. [Google Scholar] [CrossRef] [PubMed]
  36. U.S. Environmental Protection Agency (EPA). Risk Assessment Guidance for Superfund Volume I: Human Health Evaluation Manual (Part E, Supplemental Guidance for Dermal Risk Assessment) Final; EPA/540/R/99/005 OSWER 9285.7-02EP PB99-963312; Office of Superfund Remediation and Technology Innovation U.S. Environmental Protection Agency: Washington, DC, USA, 2004.
  37. Li, S.; Zhang, Q. Risk assessment and seasonal variations of dissolved trace elements and heavy metals in the upper Han River, China. J. Hazard. Mater. 2010, 181, 1051–1058. [Google Scholar] [CrossRef] [PubMed]
  38. Miguel, E.D.; Iribarren, I.; Chacón, E.; Ordoñez, A.; Charlesworth, S. Risk-based evaluation of the exposure of children to trace elements in playgrounds in Madrid (Spain). Chemosphere 2007, 66, 505–513. [Google Scholar] [CrossRef] [PubMed]
  39. Wu, B.; Zhao, D.Y.; Jia, H.Y.; Zhang, Y.; Zhang, X.X.; Cheng, S.P. Preliminary risk assessment of trace metal pollution in surface water from Yangtze River in Nanjing section, China. Bull. Environ. Contam. Toxicol. 2009, 82, 405–409. [Google Scholar] [CrossRef] [PubMed]
  40. Pez, D.R.; Castro-Rojo, R. Science and transscience in carcinogen risk assessment—The European Union regulatory process for trichloroethylene. J. Toxicol. Environ. Health B 2003, 6, 257–277. [Google Scholar]
  41. Luo, K.; Zhang, S.; Yuan, T.; Gao, X. Arsenic distribution pattern in different sources of drinking water and their geological background in Guanzhong basin, Shaanxi, China. Acta Geol. Sin. 2014, 88, 984–994. [Google Scholar] [CrossRef]
  42. Liu, Y.L.; Luo, K.L.; Lin, X.X.; Gao, X.; Ni, R.X.; Wang, S.B.; Tian, X.L. Regional distribution of longevity population and chemical characteristics of natural water in Xinjiang, China. Sci. Total Environ. 2014, 473–474, 54–62. [Google Scholar] [CrossRef] [PubMed]
Figure 1. Geographical location, different types of water, and distribution of water sampling points in Tibet.
Water 08 00568 g001
Figure 2. Total cations versus total anions in water samples from Tibet.
Water 08 00568 g002
Figure 3. Administrative division, geological characteristics [26], and arsenic concentrations of different types of water in Tibet.
Water 08 00568 g003
Figure 4. Administrative division, geological characteristics [26], and selenium concentrations of different types of water in Tibet.
Water 08 00568 g004
Figure 5. Administrative division, geological characteristics [26], and fluorine concentrations of different types of water in Tibet.
Water 08 00568 g005
Figure 6. Piper diagrams for water from Tibet. The symbols indicate various types of water. The colors indicate the arsenic concentration range for each water sample.
Water 08 00568 g006
Figure 7. Plots of the major ions within the Gibbs boomerang envelope for waters in Tibet.
Water 08 00568 g007
Table 1. Correlations between arsenic and other elements.
SeClFNO3SO42−HCO3AgAlBaBeCdCoCr
Pearson Correlation0.15 *0.73 **0.00–0.020.060.27 **0.27 **–0.010.130.45 **0.12–0.010.14 *
Sig. (2-tailed)0.030.001.000.740.410.000.000.860.060.000.080.930.04
N204204204204204204204204204204204204204
CuLiMnNiPbTlVCsGaInRbUBi
Pearson Correlation0.28 **0.83 **0.020.14 *–0.020.74 **0.090.94 **0.18 **0.24 **0.94 **–0.02–0.01
Sig. (2-tailed)0.000.000.790.050.800.000.210.000.010.000.000.740.86
N204204204204204204204204204204204204204
MoZnFeTiHgBCaKMgNaPSiO2Sr
Pearson Correlation0.03–0.030.000.060.95 **0.93 **0.030.26 **0.130.26 **0.050.52 **0.18 **
Sig. (2-tailed)0.700.700.960.420.000.000.710.000.060.000.520.000.01
N204204204204204204204204204204204204204
Notes: * Correlation is significant at the 0.05 level (two-tailed); ** Correlation is significant at the 0.01 level (two-tailed).
Table 2. The average daily dose of limited indicators from ingestion of Tibet’s natural water.
ElementsAlAs–NCBaCd-NCCoCr-NCCuFeMnNi-NCPbSeSrV
ADD-LhasaADD11.0300.0270.1885.23 × 10−59.07 × 10−40.0406.76 × 10−32.0750.0376.72 × 10−31.78 × 10−33.18 × 10−30.9320.000
ADD20.0220.0230.2209.80 × 10−59.84 × 10−40.0800.0111.5490.0410.0141.16 × 10−34.77 × 10−32.7310.012
ADD-ShigatseADD11.3190.0400.0983.01 × 10−59.98 × 10−40.0384.06 × 10−32.0340.0188.03 × 10−31.29 × 10−30.0101.9680.039
ADD20.0270.0660.3499.22 × 10−51.07 × 10−30.0804.96 × 10−31.4651.07 × 10−30.0131.31 × 10−59.21 × 10−32.8570.020
ADD-ChamdoADD13.5250.0320.4445.33 × 10−52.56 × 10−30.0647.71 × 10−34.8530.4320.0232.12 × 10−39.40 × 10−32.7120.017
ADD20.0290.0300.6786.16 × 10−51.79 × 10−30.1017.94 × 10−32.1127.56 × 10−30.0201.22 × 10−48.51 × 10−35.0120.011
ADD-NagchuADD13.5250.0320.4445.33 × 10−52.56 × 10−30.0647.71 × 10−34.8530.4320.0232.12 × 10−39.40 × 10−32.7120.017
ADD20.0300.0310.6986.16 × 10−51.71 × 10−30.0997.59 × 10−32.0314.04 × 10−30.0191.28 × 10−48.66 × 10−35.0350.012
ADD-LhokaADD10.0260.0150.0636.33 × 10−53.88 × 10−40.0281.34 × 10−31.4772.22 × 10−33.53 × 10−32.45 × 10−55.38 × 10−31.2910.056
ADD20.0140.0250.1764.37 × 10−55.67 × 10−40.0444.34 × 10−41.2000.0277.57 × 10−30.0000.0113.0360.023
ADD-NyingchiADD10.1340.0200.0634.08 × 10−54.00 × 10−40.0230.0000.7475.86 × 10−40.0120.0006.00 × 10−34.1640.024
ADD20.0576.50 × 10−30.0201.22 × 10−49.80 × 10−50.0127.71 × 10−40.1497.35 × 10−59.43 × 10−40.0002.14 × 10−30.1860.022
ADD-AliADD10.4901.6200.2001.09 × 10−49.46 × 10−40.0206.94 × 10−32.0710.0170.0155.08 × 10−40.0123.3120.006
ADD20.0310.4580.3097.63 × 10−51.21 × 10−30.0465.56 × 10−31.5770.0220.0145.23 × 10−50.0104.1610.006
Notes: ADD1: average daily dose by surface water ingestion; ADD2: average daily dose by ground water ingestion; NC: Non-carcinogenic.
Table 3. The hazard quotient and hazard index of Tibet’s natural water in different prefectures.
ElementAlAs-NCBaCd-NCCoCr-NCCuFeMnNi-NCPbSeSrV
RfD10000.32000.50.334070024201.456005
HQ-LhasaHQ11.03× 10−30.0919.38 × 10−41.05 × 10−43.02 × 10−30.0131.69 × 10−42.96 × 10−31.52 × 10−33.36 × 10−41.27 × 10−36.36 × 10−41.55 × 10−30.000
HQ22.15 × 10−50.0771.10 × 10−31.96 × 10−43.28 × 10−30.0272.77 × 10−42.21 × 10−31.73 × 10−37.23 × 10−48.29 × 10−49.55 × 10−44.55 × 10−32.47 × 10⁻³
HQ-ShigatseHQ11.32 × 10−30.1324.88 × 10−46.03 × 10−53.33 × 10−30.0131.02 × 10−42.91 × 10−37.38 × 10−44.01 × 10−49.20 × 10−42.03 × 10−33.28 × 10−37.76 × 10⁻³
HQ22.68 × 10−50.2201.74 × 10−31.84 × 10−43.56 × 10−30.0271.24 × 10−42.09 × 10−34.44 × 10−56.44 × 10−49.33 × 10−61.84 × 10−34.76 × 10−34.08 × 10⁻³
HQ-ChamdoHQ14.37 × 10−50.0411.51 × 10−31.47 × 10−42.07 × 10−37.57 × 10−39.49 × 10−61.02 × 10−31.55 × 10−44.49 × 10−42.73 × 10−51.64 × 10−32.93 × 10−32.21 × 10⁻³
HQ21.47 × 10−50.1061.68 × 10−30.0001.45 × 10−38.97 × 10−33.90 × 10−51.12 × 10−30.0002.04 × 10−41.31 × 10−51.48 × 10−31.25 × 10−22.05 × 10−3
HQ-NagchuHQ13.53 × 10−30.1062.22 × 10−31.07 × 10−48.54 × 10−30.0211.93 × 10−46.93 × 10−31.80 × 10−21.16 × 10−31.51 × 10−31.88 × 10−34.52 × 10−33.42 × 10⁻³
HQ22.89 × 10−50.1013.39 × 10−31.23 × 10−45.96 × 10−30.0341.98 × 10−43.02 × 10−33.15 × 10−49.90 × 10−48.75 × 10−51.70 × 10−38.35 × 10−32.26 × 10⁻³
HQ-LhokaHQ12.58 × 10−50.0513.13 × 10−41.27 × 10−41.29 × 10−39.38 × 10−33.36 × 10−52.11 × 10−39.26 × 10−51.76 × 10−41.75 × 10−51.08 × 10−32.15 × 10−31.12 × 10⁻²
HQ21.36 × 10−50.0848.79 × 10−48.75 × 10−51.89 × 10−30.0151.08 × 10−51.71 × 10−31.12 × 10−33.79 × 10−40.0002.30 × 10−35.06 × 10−34.56 × 10−3
HQ-NyingchiHQ11.34 × 10−40.0663.14 × 10−48.16 × 10−51.33 × 10−37.55 × 10−30.0001.07 × 10−32.44 × 10−55.85 × 10−40.0001.20 × 10−36.94 × 10−34.76 × 10−3
HQ25.66 × 10−50.0221.01 × 10−42.45 × 10−43.27 × 10−44.15 × 10−31.93 × 10−52.13 × 10−43.06 × 10−64.71 × 10−50.0004.29 × 10−43.10 × 10−44.40 × 10−3
HQ-AliHQ14.90 × 10−45.4009.98 × 10−42.19 × 10−43.15 × 10−36.79 × 10−31.73 × 10−42.96 × 10−37.23 × 10−47.44 × 10−43.63 × 10−42.35 × 10−35.52 × 10−31.28 × 10⁻³
HQ23.14 × 10−51.5261.55 × 10−31.53 × 10−44.03 × 10−30.0151.39 × 10−42.25 × 10−39.29 × 10−47.18 × 10−43.74 × 10−52.02 × 10−36.94 × 10−31.26 × 10⁻³
HI-Lhasa1.05 × 10−30.1682.04 × 10−33.00 × 10−46.30 × 10−30.0404.46 × 10−45.18 × 10−33.25 × 10−31.06 × 10−32.10 × 10−31.59 × 10−36.11 × 10−32.47 × 10⁻³
HI-Shigatse1.35 × 10−30.3522.23 × 10−32.45 × 10−46.89 × 10−30.0392.26 × 10−45.00 × 10−37.82 × 10−41.05 × 10−39.29 × 10−43.88 × 10−38.04 × 10−30.012
HI-Chamdo5.84 × 10−50.1463.19 × 10−31.47 × 10−43.52 × 10−30.0174.85 × 10−52.13 × 10−31.55 × 10−46.53 × 10−44.04 × 10−53.12 × 10−30.0154.25 × 10−3
HI-Nagchu3.55 × 10−30.2075.61 × 10−32.30 × 10−40.0150.0553.91 × 10−49.95 × 10−30.0182.15 × 10−31.60 × 10−33.58 × 10−30.0135.69 × 10−3
HI-Lhoka3.94 × 10−50.1351.19 × 10−32.14 × 10−43.18 × 10−30.0244.45 × 10−53.82 × 10−31.21 × 10−35.55 × 10−41.75 × 10−53.37 × 10−37.21 × 10−30.016
HI-Nyingchi1.91× 10−40.0884.15 × 10−43.27 × 10−41.66 × 10−30.0121.93 × 10−51.28 × 10−32.75 × 10−56.33 × 10−40.0001.63 × 10−37.25 × 10−39.16 × 10−3
HI-Ali5.21 × 10−46.9262.54 × 10−33.71 × 10−47.18 × 10−30.0223.12 × 10−45.21 × 10−31.65 × 10−31.46 × 10−34.00 × 10−44.36 × 10−31.25 × 10−22.54 × 10⁻³
Notes: HQ1: hazard quotient of surface water; HQ2: hazard quotient of ground water.
Table 4. The carcinogenic risks of Arsenic in natural waters of Tibet’s different prefectures.
Carcinogenic RiskClassificationThe Estimated Value of Cancer Risk
Carcinogenic risk-LhasaCR11.81 × 10−5
CR21.55 × 10−5
Carcinogenic risk-ShigatseCR12.64 × 10−5
CR24.40 × 10−5
Carcinogenic risk-ChamdoCR18.15 × 10−6
CR22.11 × 10−5
Carcinogenic risk-NagchuCR12.12 × 10−5
CR22.02 × 10−5
Carcinogenic risk-LhokaCR11.03 × 10−5
CR21.67 × 10−5
Carcinogenic risk-NyingchiCR11.32 × 10−5
CR24.33 × 10−6
Carcinogenic risk-AliCR11.08 × 10−3
CR23.05 × 10−4

