Article

The Origin of the Natural Water Chemical Composition in the Permafrost Region of the Eastern Slope of the Polar Urals

National Research Tomsk Polytechnic University, Lenina Avenue 30, Tomsk 634050, Russia
Water 2016, 8(12), 594; https://doi.org/10.3390/w8120594
Submission received: 25 August 2016 / Revised: 4 December 2016 / Accepted: 5 December 2016 / Published: 14 December 2016

Abstract

:
This article presents the results of the study of water chemical composition and formation processes in the eastern slope of the Polar Ural where permafrost is widely spread. To date, this region has not been studied in detail. However, it is very important to have information on the natural waters in this region because they play a significant role in all geochemical processes, including climate formation. For this study, 107 water samples were collected from lakes, rivers and active layer waters. The studied waters are ultrafresh; total dissolved solids vary from 14 to 438 mg/L. pH ranges from 3.5 to 9.0. The chemical type of the studied waters is mostly HCO3–Ca–Mg. The geochemical environment of the studied waters contributes to the accumulation of such trace elements as Fe, Mn, Al, Ni, Au, Co, Li, Sc, Ti, Cr, Sr, Nb, Mo, Cs, La, Eu, Lu, Hg, and Se. The chemical composition peculiarities of active layer waters, rivers, lakes and waters of stone pits and exploration trenches and the description of their chemical composition formation processes are given in the present study. The water–rock interaction is a dominant process of water chemical composition formation in the studied region. The obtained results have both potential theoretical and practical applications.

1. Introduction

The Polar Urals is a region of northern Russia on which great hopes are pinned for the development and renewal of the mineral resource base of the Russian Federation [1,2,3]. This remote region has not been studied well, particularly with respect to hydrogeochemical aspects. The specific feature of this region is widespread permafrost, as in other northern regions including Canada and the USA.
The formation of the natural water composition in the northern regions, where permafrost is widely spread, occurs under specific conditions. The natural waters of this region are in close contact with the atmosphere; they undergo seasonal phase changes and they are in solid phase most of the year. These and other factors determine the peculiarities of water composition formation processes in the permafrost region. The problems of water geochemistry in regions with a cold climate and permafrost have been well studied.
The geochemical processes occurring in the temperate region also operate in the permafrost region [4]. Cationic denudation in the permafrost regions is substantially higher than the world average [5] indicating the intensity of chemical weathering in such an environment [6,7,8,9]. Evidently the low average temperatures do not inhibit chemical weathering reactions.
According to [10,11,12,13] the main geochemical processes that control both surface water and groundwater chemistry in the studied regions are silicate weathering: the dissolution of freshly weathered, easily soluble rocks (mainly gypsum, anhydrite, calcite, dolomite, halite and limestone) sometimes combined with sulfide oxidation [14]. Moreover, the weathering rate is determined by the permafrost degradation factor [15,16]. Soluble cations in permafrost and the active layer of static cryosols at recently disturbed sites were two orders of magnitude higher than in the active layer at undisturbed sites [16].
The detailed analysis [17] of Sr isotopic composition and river chemical composition shows that silicate weathering reactions are not the only mechanisms that control solute concentrations. An atmospheric component, constituted by the dissolution of evaporate and carbonate aerosols, is necessary to explain the dispersion of chemical ratios such as Ca/Na, Mg/Na, Sr/Na and Cl/Na. These aerosols are probably of local origin.
Different aspects of hydrogeochemistry of permafrost regions are described in these works including specificity of water–rock (sulphate, carbonate, aluminosilicates) interaction and water chemical composition formation during phase transformations etc. The study of water chemical composition formation based on the research of water–rock interaction is up-to-date. Not enough attention has been paid to the role of dissolved organic matter in the processes of water chemical composition formation in the permafrost regions. Data on water enrichment in dissolved organic matter in the arctic regions are given in some articles [18,19,20,21,22,23,24,25]. Most of them focus on studying river water composition, while less attention is paid to groundwater research, and lake water chemical composition formation has not been studied at all. The lakes of the arctic zone are unique objects worth studying and there are some publications on lake water balance characteristics and their influence on permafrost [26,27].
Little work has been done on the geochemistry of water of the Polar Urals. Previous studies on lake waters circulating in this area have been carried out [28] and aimed at investigating the distribution and size of lakes on the eastern slope of the Polar Urals, but there is no information on the origin of lake water chemical composition. Nevertheless, the lake, river and groundwater geochemistry of the arctic regions has not been well studied yet.
The purpose of this work is to study the geochemical characteristics of water in order to identify the main hydrogeochemical processes controlling the chemical composition based on major ion chemistry. Another aim of the study is to assess the concentration of trace elements in lakes, rivers and groundwater on the eastern slope of the Polar Urals in order to evaluate the regional geochemical background. This study would be useful for conducting hydrogeochemical prospecting for ore deposits on the eastern slope of the Polar Urals, and for investigating sources of drinking-water.

2. Site Description and Methods
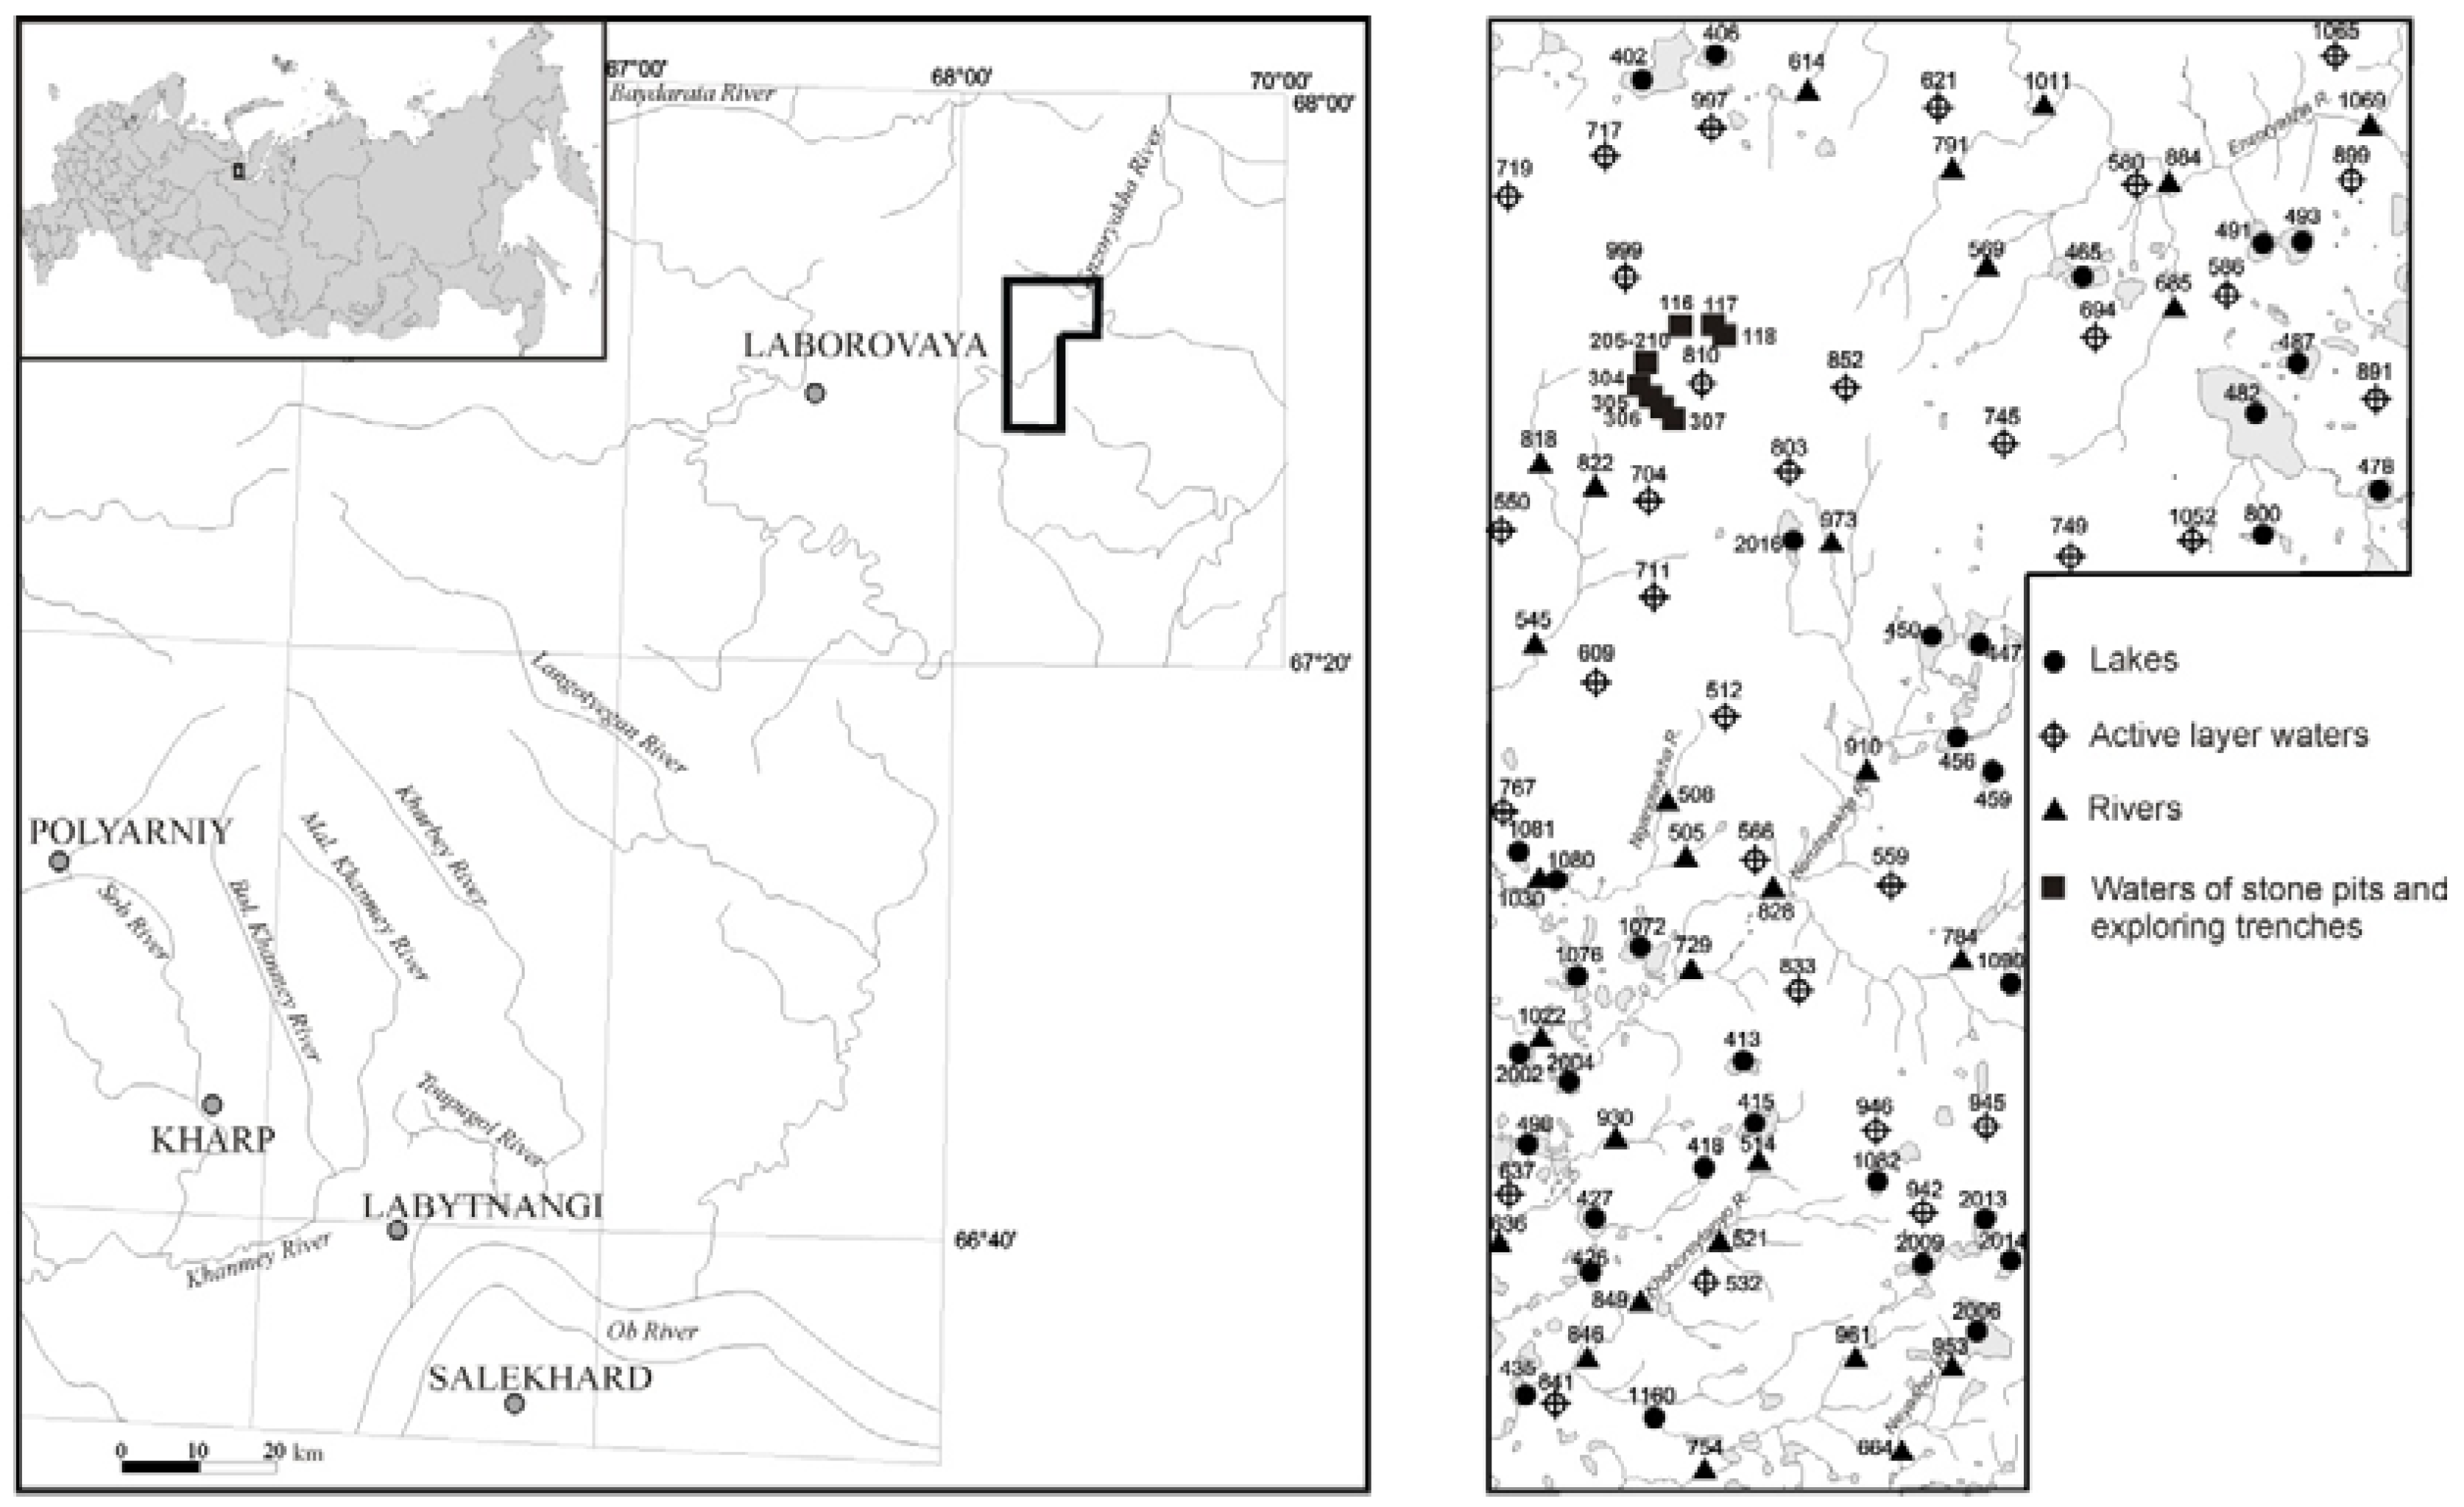
2.1. Study Area

The study site covers an area of approximately 170 km2 on the eastern slope of the Polar Urals, between latitudes 67°36′29′′ N and 67°46′48′′ N and longitudes 68°08′50′′ E and 68°25′58′′ E (Figure 1). The morphology status of the region is a denudation plain; the elevation range is from 55 m to 202 m. The studied area covers the watershed of the rivers Enzoryakha and Yunyakha. The climate of the studied area is subarctic. The mean annual air temperature is about −5 °С. The annual precipitation is 400–600 mm. In the region, the continuous permafrost thickness varies between 100 and 320 m [29]. The thickness of the active layer, the layer of soil above the permafrost thawing out during the summer, reaches a maximum 2.5 m.
The groundwater stratification is not so much determined by geological structure and water bearing rocks as by permafrost thickness and framework and its temperature regime [30]. According to the groundwater localization in relation to permafrost in the studied area, the following types of groundwater can be distinguished: suprapermafrost (water saturated part of the active layer), intra- and subpermafrost waters. In the present study only suprapermafrost waters are described, which refer to the active layer waters in the present research.
Several large rivers flow in the studied area, such as the Nganotaykha, Nerutsyakha, Khohoreytanyo and Neyashor; all of these are within the Ob basin. These rivers are fed by snowmelt waters, precipitation and permafrost thawing. Besides these rivers, about 140 lakes are situated here. They are located in clusters having different sizes. The water surface of the largest lake is 0.87 km2, other lakes have smaller water surfaces which are less than 0.25 km2. The depth of the lakes is not more than 2–3 m, while the depth of a few shallow lakes is less than 1 m. Only few lakes are connected to rivers.
From the geological point of view, the studied area consists of two structure levels such as the Paleozoic and the Mesozoic (Figure 2). The Paleozoic structural level is represented by three structural stages such as the Lodlow-lower Eifelian, the upper Eifelian-Givetian and the Givetian-mid-Carboniferous. The Lodlow-lower Eifelian stage is composed of the rhyolite-andesit-basaltic unit intruded by gabbroid. The upper Eifelian-Givetian stage lies unconformably and is represented by bituminous limestones intruded by gabbro-diorite unit. The Givetian-mid-Carboniferous stage is represented by terrigenous rocks. The Mesozoic stratified rocks are represented by the Carnian-Norian stage of the Triassic period [31].

2.2. Sampling and Analysis

The waters were sampled for chemical characterization during the summer period with 107 samples collected from active layer waters (32 samples), rivers (29 samples), lakes (34 samples) and waters of stone pits and exploration trenches (12 samples). The locations of the water sampling points are shown in Figure 1. At each point, two water samples were collected. The samples for ionic analyses were stored in 500 mL clean polyethylene bottles which were rinsed twice by the sampled water. The samples for trace elements analyses were stored in 50 mL clean polyethylene bottles. Each sample was filtered in situ through a 0.45 µm acetate cellulose membrane filter of 30 mm in diameter using a pre-cleaned syringe. First, 5 mL of the filtered water was eliminated at the beginning of filtration. The samples were immediately acidified with concentrated HNO3 in order to prevent metal precipitation.
The field measurements including the water temperature, pH and redox potential (Eh) were carried out using a portable device Water Test (Hanna Instruments, Cluj-Napoca, Romania). The pH measurements were performed after calibration with pH 4.01 (HI 7004) and 7.01 (HI 7007) buffer solutions. The accuracy of the instrument is ±0.2 pH and ±5 mV. The concentration of HCO3 was determined by titration with 0.01 N solution of HCl against methyl orange indicator. The titration method was used for the determination of the fulvic and humic acid concentration. Cations and anions, including SO42−,Cl, Ca2+, Mg2+, Na+, K+ were analyzed by Dionex 1000 and 2000 ion chromatographs. Dissolved trace elements were determined by inductively coupled mass spectrometry (ICP-MS, ELAN-DRC-e, Perkin Elmer, Shelton, CT, USA). All the standard solutions for it were prepared with ultra-pure deionized water and Perkin Elmer Multi Element Standard Solutions.
The physico-chemical modelling program HydroGeo [32] was used for calculation of the ion activities in the studied waters. To show the water saturation state with respect to key mineral phases, the diagrams of some secondary and primary mineral stability fields were used. Statistica, version 8.0, was used to perform statistical analyses. Correlation was estimated using the Pearson correlation coefficient (R-coefficient) with statistical significance p = 0.05. The mean content of chemical elements was determined according to their distribution laws with the use of excess and asymmetry coefficients.

3. Results and Discussion

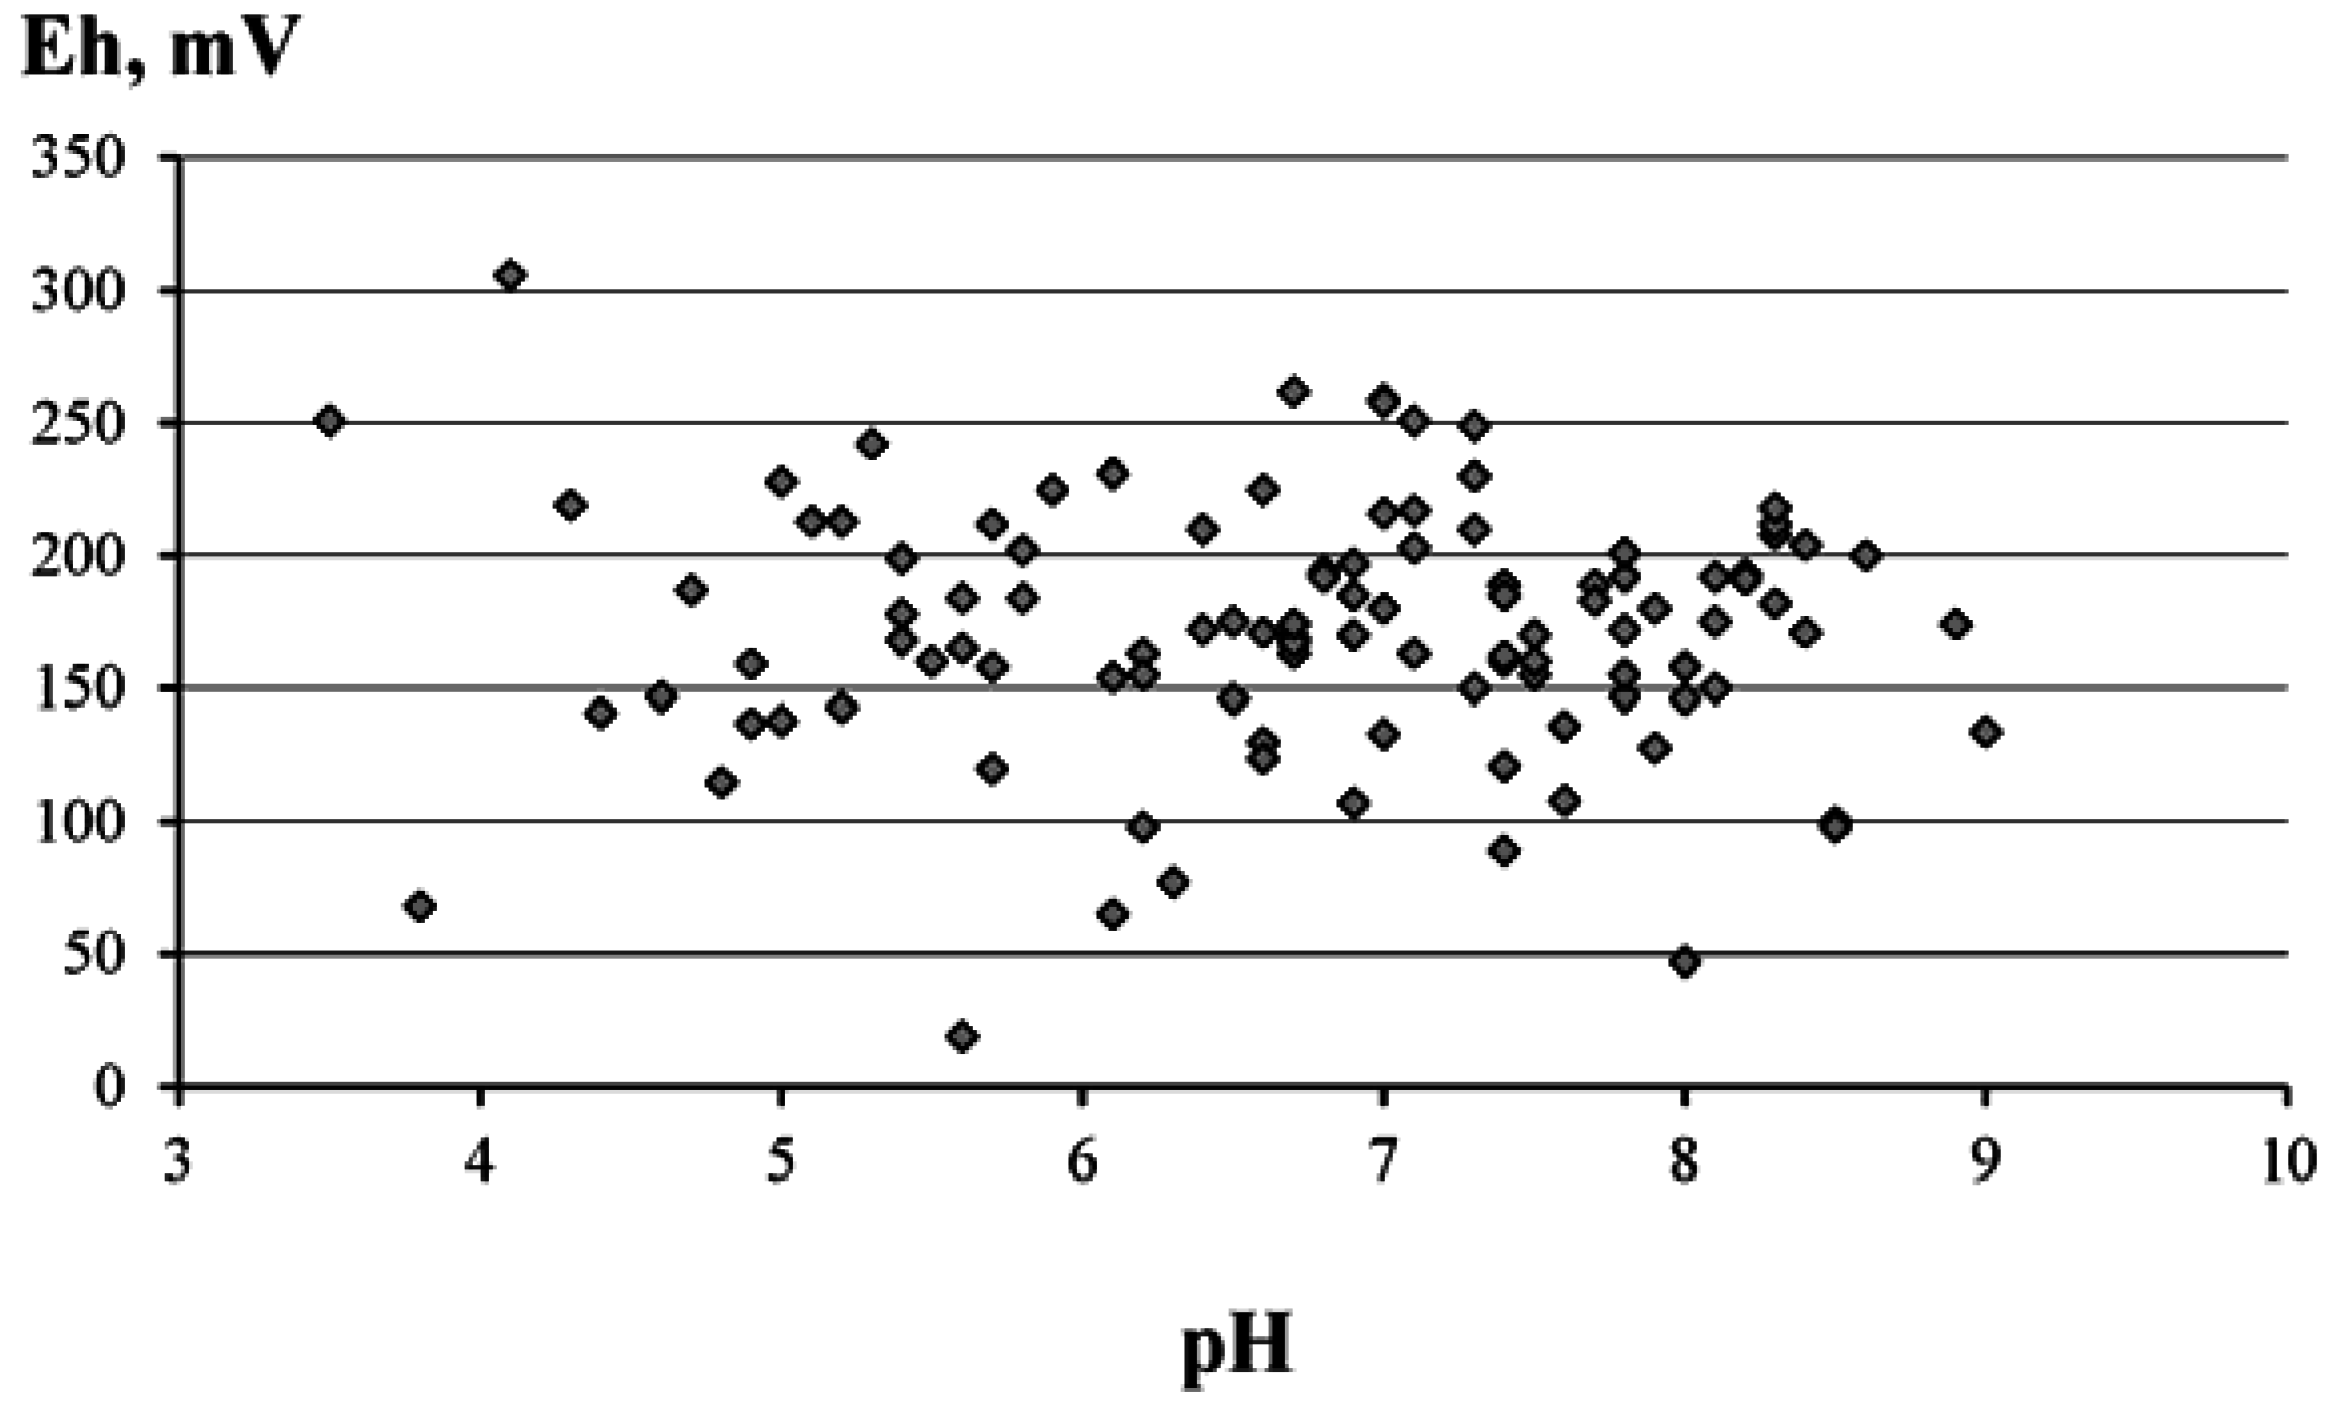
3.1. General Characteristics of Waters

The results of the chemical composition analysis and field measurement are given in Appendix A. Total dissolved solids (TDS) range from 14 to 438 mg/L. Most waters (at 94 points) of the studied area are fresh and have TDS of less than 200 mg/L. pH values are from 3.5 to 9.0 (Figure 3). Most waters in the region have pH 6.5–7.5. The lowest pH values 3.5–4.9 were obtained in a wetland area. Lake waters are mostly alkaline with pH ranging from 8.5 to 9.2.
The redox conditions are characterized by values Eh −68 to 347 mV. There is a weakly positive relationship between Eh and pH (R2 = 0.0032) (Figure 3) in the studied waters. This pH and Eh relationship is not typical for the natural water; it is caused by the wide variety of the chemical composition of the studied waters. The most common waters in the studied area have the values of redox potential of 150–200 mV. More oxygenated environments (where Eh is greater than 200 mV) are formed mainly in acidic and neutral waters in watershed areas and upstreams, where water exchange is more active. More reducing conditions (where Eh is below 200 mV) are formed in water with low water exchange intensity. The enrichment processes of organic substances in water play a significant role in the formation of the reduction environment [33].
The concentrations of fulvic and humic acids at a number of points are shown in Table 1. The fulvic acid concentrations in waters vary from 1.3 to 19.4 mg/L and humic acid concentrations vary from 0.5 to 2.8 mg/L. The highest fulvic acid concentrations are found in waters with a reducing environment where Eh value is less than 200 mV (Figure 4). The maximum concentrations of fulvic acid are noted in the most acidic waters with a pH less than 5.5. The fulvic acid concentrations decrease with an increase in pH. The behavior of soluble humic acid is practically independent of geochemical parameters of the aquatic environment [33,34].
Among inorganic anions bicarbonate is predominant, the concentrations of which range from 2.6 to 325 mg/L. Waters with HCO3 concentrations less than 150 mg/L are widely spread. The second most abundant anion is SO4, ranging from 0.5 to 50 mg/L. The Cl content is low (less than 0.3–0.5 mg/L). Ca and Mg are the most abundant cations with concentrations of 1.6–91.7 mg/L and 0.7–21.2 mg/L, respectively (Appendix A). The concentrations of Na range from 0.4 to 15.9 mg/L. K is the least abundant major cation with a content of 0.01–7.1 mg/L.
Hydrogeochemical types of the studied waters are shown in Figure 5. Thus, the HCO3 contents are mostly more than 70% of the total anion, except for a few data points (50%–70%). At these points, the SO4 concentration (30%–50%) increases and these waters belong to HCO3–SO4 type. The waters with a higher concentration of SO4 (10%–50%) are widely spread in the north-western part of the studied area. The Cl content increase in waters in the north-western part of the study are.
The cation composition mostly varies between Ca, Ca–Mg, Mg–Ca and Ca types. A significant feature of cation composition of the studied waters is largely a function of rock composition. Mostly magnesium waters (with Mg of more than 50%) are located in the area with widely spread granite and gabbro. Calcium waters (with Ca of more than 50%) are widely spread in the area with carbonates. Na concentration is generally less than 10% in the studied waters. The waters with Na concentration of more than 10% have low TDS and they are located in the northern part of the studied area.
The silicon concentrations vary from 0.16 to 28.75 mg/L. A significant feature of these waters is hydrolysable cation accumulation such as Al, Fe, and Mn. Their mean concentrations are high for waters with such low TDS and reach 0.03, 0.25, and 0.01 mg/L respectively.
The average concentrations of trace elements in the studied waters correspond to both the average of world rivers and mean contents in groundwaters of tundra landscapes [33]. The average concentrations of Sc, Eu, Fe, Ho, Dy, Tb, Gd, Pr, Er, Yb, Sm, Se, Nd, Lu, Nb, Tm, Ce, Mn, La, and Ni in the studied waters exceed the average of world rivers by 1.5–10 times (Table 2).
The trace element concentrations in the studied waters are lower than those in waters of tundra landscape; exceptions are Sc, Fe, Mn, and Ni concentrations. The Cu, V, As, Sr, I, and Ba concentrations in the studied waters are close to those in waters of tundra landscape. Moreover, new information about Bi, Cd, Pt, B, Ge, Se, Br, Y, Rh, Pd, Te, Cs, TR, Hf, Ta, W, Re, Ir, Hg, Tl, and Th distribution in the natural waters in the eastern slope of the Polar Urals was found (see Table 2).
Figure 6a,b show the concentration of the main ions plotted against TDS. On the whole, the data show a strong positive linear correlation pointing to the significant dependence of HCO3 and Ca on TDS (R = 0.97 and R = 0.90, p = 0.05 respectively).
The dependence of the calcium concentration on the bicarbonate concentration, with a positive connection (R = 0.87, p = 0.05), is shown in Figure 6c. However, water enrichment in these ions is not determined only by simple calcite dissolution but it is controlled by the processes of aluminosilicates hydrolyses because this type of rock is widely spread in the studied area (Figure 6d). The exception is waters in stone pits and exploration trenches. Calcium entering in these waters occurs primarily due to the calcium dissolution processes.
No strong dependence of other ions on TDS was found (Table 3). However, there are positive correlations between K and Al, K and Si, demonstrating likely their common source.
In Table 3, a positive correlation between Al and Si (R = 0.85, p = 0.05) is observed in the study waters: concentrations of Al increase with the growth of Si.

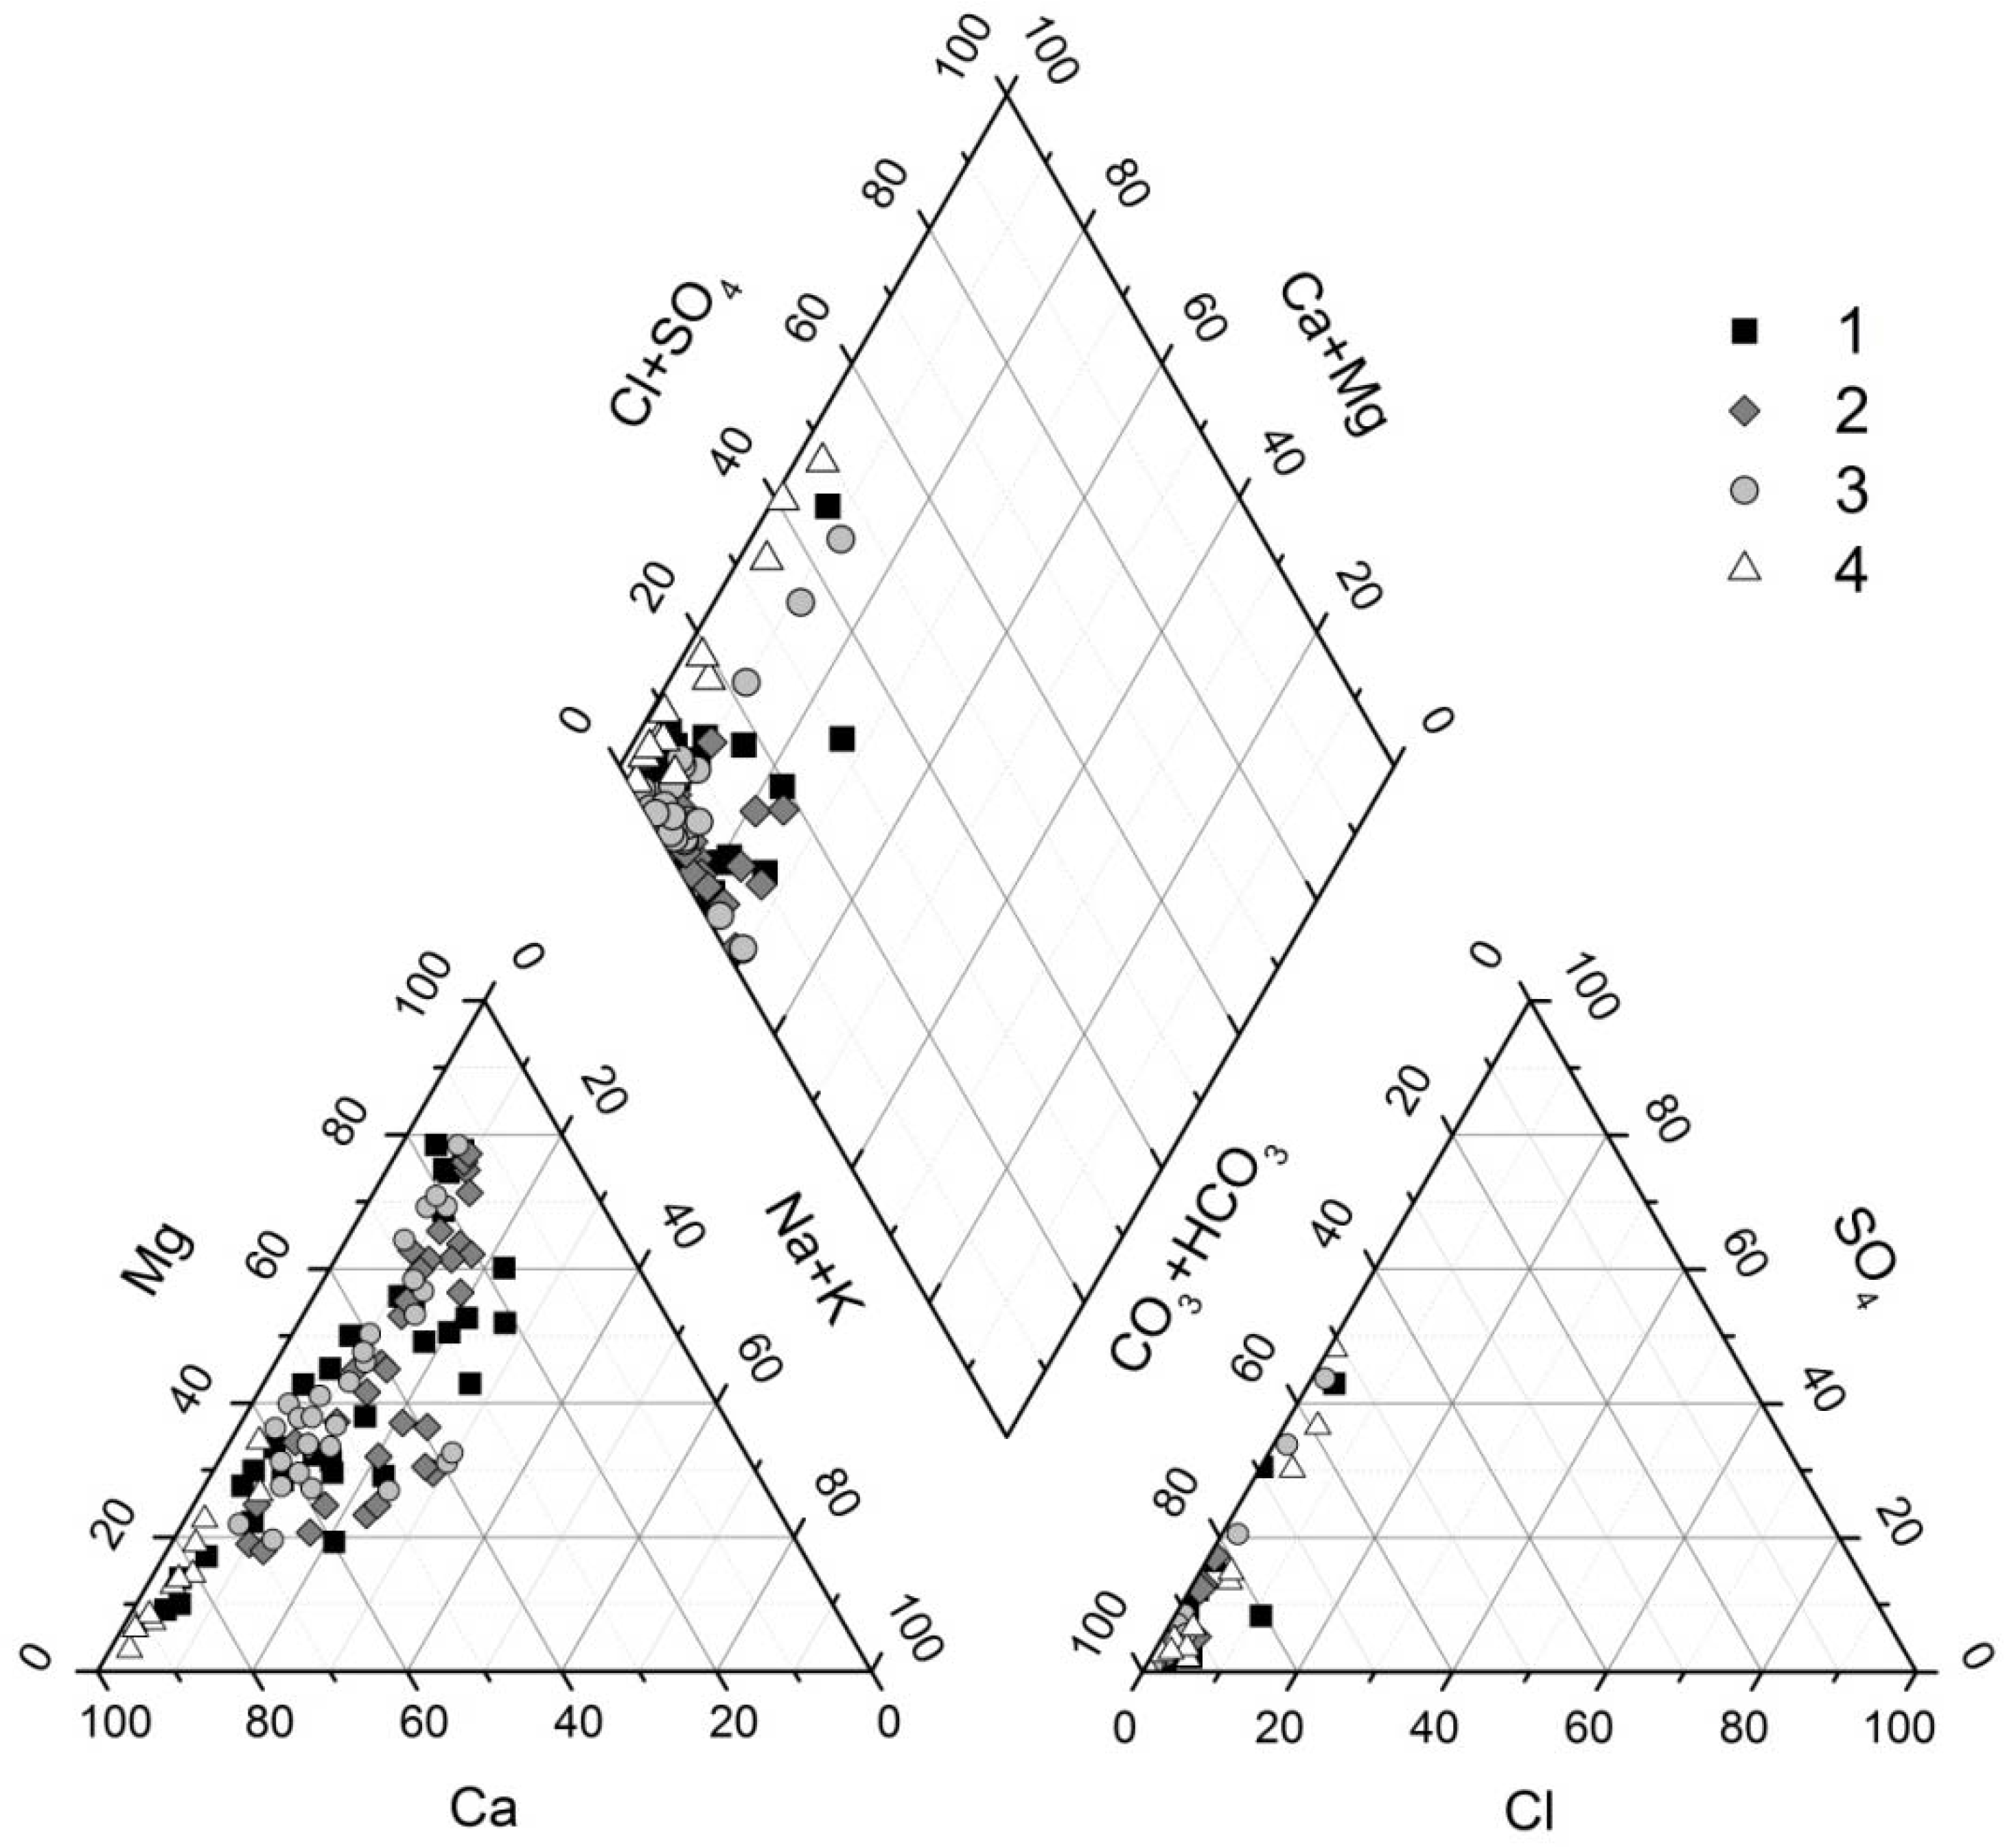
3.2. Chemical Composition of Water Types

Chemical composition variety of the studied waters is determined by various existence factors and processes in the study area. The chemical compositions of rivers, lakes and groundwaters (waters of active layer) form in natural conditions of landscape. At the same time, chemical composition of waters in stone pits and exploration trenches form in other hydrodynamic and physico-chemical conditions, which are mostly the result of anthropogenic activity. Meanwhile, the specific feature of the study area is the absence of a great anthropogenic influence. Therefore, it is necessary to describe each type of the studied waters separately.
Waters of the active layer are presented by small swampy land sometimes with water table, but more often by water-bearing peat soils. These waters have a color similar to “strong tea”, which is conditioned by high concentrations of organic matter. Active layer waters are mostly weak-acid or neutral, pH values range from 3.5 to 7.5. Their TDS vary from 24.1 to 273.0 mg/L, average TDS is 96.2 mg/L (Appendix A). On average, the chemical composition of active layer waters is close to that in river waters. The values of TDS were estimated using only main inorganic ions, but for this type of water, organic matter plays a significant part in chemical composition. In this manner, values of TDS can be increased more than 10%. The studied waters are characterized by HCO3 type with various ratios of Ca and Mg.
The high concentrations of such elements as Si, Ag, Bi, Cu, Cd, Pb, Be, Sc, Rb, Y, Nb, Te, Cs, Eu, Lu, Hf, Ta, W, Th, V, Ga, Ge, As, I, and Ba are observed in this type of water (Table 2).
It should be noted that the concentrations of Mn, Co, Zn, Pd, La, Tl, Sn, Fe, and Ir are significantly higher in active layer waters than those in rivers and lakes.
The lake waters are ultrafresh; the maximum value of TDS is less than 200 mg/L. Geochemical environment of lake waters is characterized by pH from 5.3 to 9.2 with an average value of 7.3, and Eh from 47 to 341 mV with an average value of 175 mV. The values of these parameters are very close to those in rivers in the studied area. Calcium and magnesium are the dominant cations in lake waters; together they account for 72%–92% of the cations measured (Figure 5). Anion chemistry is dominated by HCO3 constituting from 80% to 99% of the major anions. Higher concentrations are characteristic of some trace elements in lake waters among which are lithophilous elements—Li, Be, B, Ti, Cs, La, Eu, I, Ba and chalkophilous elements—Pb, Rb, Pd, Te, Hg, Tl, and As (Table 2). For siderophilous elements, only Ni reveals a higher content. The high concentration of Ni in the waters is a one of the specific features of the studied area [35].
The river waters are characterized by values of Eh from 65 to 225 mV. Measured pH values range from 4.8 to 8.2. The average value of TDS is 80 mg/L, which is equal that of active layer waters. The maximum value of TDS is 319.2 mg/L. River waters belong to HCO3-Ca hydrogeochemical type. Geochemical conditions in river waters are appropriate for enrichment in lithophilous elements—Si, Al, Mn, Sc, Cr, Y, Zr, Nb, Hf, Ta, W, and U, chalkophilous elements—Au, Zn, Cu, Cd, Sb, V, and Se, and siderophilous elements— Co, Pt, Mo, Ru, Rh, Ir, Re, and Ge (Table 2).
Waters in stone pits and exploration trenches are characterized by different chemical composition in all studied water types. The measured pH values are neutral to alkaline, ranging from 7.4 to 8.9. The water exhibit redox potential characteristic of a more oxygenated environment; measured values of Eh vary from 121 to 218 mV. On the whole, TDS (45 < TDS < 438 mg/L; average 218 mg/L) levels are greater than those of all studied water types. As in the previous water type, bicarbonate is the most abundant major anion; its values range from 32.9 to 330.4 mg/L. However, the highest contents of sulfate are observed in waters in stone pits and exploring trenches for all studied water types; their content ranges from 1.0 to 50.0 mg/L. The dominant cations are calcium and magnesium. Therefore, these waters belong to the HCO3-SO4-Ca-Mg type. The highest concentrations of Cl and K (up to 6.3 and up to 5.7 mg/L respectively) were found in this type of water. Also among all the studied water types, the maximum concentrations of such elements as Al, Fe, Au, Pt, Ti, Ni, Cr, Sr, Mo, Ru, Rh, Sb, Re, Ir, and U were detected in the waters of stone pits and exploring trenches.

3.3. Water-Rock Interaction

According to the dependence of TDS on Na/(Ca + Na) [36] (Figure 7), study waters are characterized by low values of Na/(Na + Ca) at less than 0.5, with moderate TDS values of less than 250 mg/L, typical of rock-dominated waters. Several regularities can be identified in Figure 5. On one hand, values of Na/(Na + Ca) decrease with TDS growth in active layer waters. On the other hand, a Na/(Na + Ca) value decrease does not lead to TDS increase in river and lake waters. It may be conditioned by dilution waters with precipitation. Moreover, waters in stone pits and exploration trenches with minimum values of Na/(Na + Ca) are characterized by maximum values of TDS. Therefore, in the studied area, water chemical composition formation is mostly dominated by rock weathering processes. The point positions in Figure 7 confirm this fact.
In the studied area, aluminosilicate rocks are mostly predominant, whereas carbonate rocks are less common. Thus, the main process of water chemical composition formation is hydrolysis of aluminosilicate minerals and less the dissolution of carbonates. These processes lead to the release of chemical elements in solution and secondary mineral precipitation. For the study of these processes, the major component activities of the water samples were plotted on diagrams of some secondary and primary mineral stability fields (Figure 8).
The point positions outside the anorthite, albite, Mg-chlorite, analcim, and muscovite stability fields (Figure 8) indicate that all the analyzed waters are not in equilibrium with these minerals of primary rocks. Therefore, the studied waters are likely to promote dissolution of primary aluminosilicate minerals and constantly dissolve them. Weathering of aluminosilicate minerals is a slow process [37], releasing chemical elements in solution from primary rocks and also producing secondary minerals; removing chemical elements from solution. As previously reported [33], the processes of water–rock interaction have a stage character, one of the main factors in which is water–rock interaction time, determined by water exchange intensity.
The chemical composition formation of the studied waters occurs under different conditions of water–rock interaction. Active layer waters, rivers, lakes and waters of stone pits and exploration trenches are characterized by different time of interaction with rocks and therefore they reach different water–rock interaction stages. In Figure 8, the point positions in the gibbsite, kaolinite, montmorillonites, calcite stability fields demonstrate that the studied waters are in equilibrium with the products of primary rock weathering. Each point position in the secondary mineral stability fields shows that the studied waters reach four stages of water–rock interaction [38].
The relatively short time of interaction between waters and rocks defines the development of water–rock system until the first stage, namely water equilibrium with mineral groups of oxides, hydroxides. At this stage of water–rock interaction, the aluminosilicates hydrolyses processes can be described by following reactions:
NaAlSi3O8 + H+ + 7H2O = 3H4SiO4 + Al(OH)3 + Na+
CaAl2Si2O8 + 2H+ + 6H2O = Ca2+ + 2H4SiO4 + 2Al(OH)3
KAlSi3O8 + H+ + 7H2O = 3H4SiO4 + Al(OH)3 + K+
In the first stage of water–rock interaction, the primary aluminosilicates of various compositions actively dissolve by water. This leads to the release of a great quantity of chemical elements in solution. The accumulation of Al, Si and other chemical elements in waters occurs until saturation with respect to the least soluble secondary mineral—gibbsite, ferrihydrite, geothite and other minerals of the oxides, hydroxides group. According to the diagram in Figure 8, the large part of samples is located in the gibbsite stability field. This is characteristic, especially in acid lake waters and rivers and partly for active layer waters. In addition, studied waters are in equilibrium with goethite; the average value of SI is 32.
In the state of saturation with respect to gibbsite, the Al content growth slows down because of its removal from solution with the formation of secondary phase but it does continue. Accumulation of Si in solution occurs during the continued aluminosilicate hydrolyses. When the appropriate ion activity product is gained, waters reach the state of saturation with respect to kaolinite, the second stage of water–rock interaction. It can be shown by following reactions:
2Al(OH)3 + 2H4SiO40 = Al2Si2O5(OH)4 + 5H2O
or
CaAl2Si2O8 + 2H+ + H2O = Al2Si2O5(OH)4 + Ca2+
2NaAlSi3O8 + 4Al(OH)3 + H2O = 3Al2Si2O5(OH)4 + 2Na+ + 2OH
This stage is mostly reached by active layer waters and rivers at the floodplain areas.
With the Si accumulation in solution, the degree of water saturation with respect to clay minerals grows and the water–rock system can reach the next stage—saturation with respect to montmorillonites. However, the waters are oversaturated with respect to montmorillonites only in single points among all the studied water samples (Figure 8).
The behavioral peculiarity of Al and Si during the process of interaction between studied waters and rocks is plotted on Figure 9. The expected rise of Al concentration in solution occurs with the Si content growth and therefore with the increase of interaction time between water and aluminosilicate minerals (Figure 9). The intensive growth of the Al content with the Si content growth is observed for the active layer waters, the water chemistry of which is mostly determined by the water–rock interaction processes. Meanwhile, the staging of Al removal from solution during the formation of secondary mineral phase is shown in Figure 9. In the first stage of water–rock interaction there are at least three limitations for Al accumulation in the studied waters: water saturation with respect to gibbsite, kaolinite and montmorillonites. In Figure 9a, the points of the Al content or accumulation rate decreases can be noted at the Si concentrations of 2.5 and 6–15 mg/L, which correspond to the points of saturation with respect to kaolinite and montmorillonites [37]. This dependence is characteristic, mostly for active layer waters. However, it should be noted that the Al accumulation rate decreases with Si content increase in river waters. In addition, there is no dependence of Al content on Si concentration in waters of stone pits and exploring trenches, because their water chemistry is dominated by mostly carbonate rock dissolution processes. The expected Si decrease in solution during secondary mineral precipitation in all mentioned stages of water–rock interaction does not occur; this is because silica concentration in primary minerals is higher than that in clay minerals [39].
The point position in Figure 8 shows that the studied waters are mostly undersaturated with respect to calcite, but the saturation is indicated in the single points, corresponding mainly to waters of stone pits and exploring trenches. In addition, alkaline lake waters are oversaturated with respect to calcite, or in a state close to saturation. The state of water saturation with respect to calcite is not typical for natural waters in the permafrost regions [33]. The state of studied waters is conditioned by the influence of local factors such as interaction between water and carbonates and weak water exchange. Weak water exchange is caused by flat land surface and presence permafrost layer, which do not assist to precipitation infiltration. Active layer waters and rivers are far from saturation with respect to calcite.
The presented results of the thermodynamic calculations of water–rock interaction are proven by field observations of precipitation of the secondary minerals in the studied permafrost region or under similar conditions, presented in publications. Thus, under similar conditions in the Bolshezemelskaya tundra, the presence of highly dispersed clay minerals, aluminium and iron colloids in large amounts were found in the active layer rocks [40,41]. These published data, our thermodynamic calculations and field observations show the ability of mentioned secondary mineral formation in permafrost regions.

3.4. Mechanisms of Water Chemical Composition Formation

According to our investigation, the main process of water chemical composition formation is the interaction between water and rocks.
As it was shown in the present study, the main anion in the studied water is HCO3. Water enrichment in HCO3 results the neutralization of alkalinity, forming as a result of aluminosilicates hydrolysis, by the products of organic matter mineralization [42].
MSiAlOn + H2O → Mn+ + OH + HAlSiOn
OH + CO2 → HCO3
The neutralization reaction may also occur in the presence of organic acids existing in essential amounts in waters.
The main source of SO4 in the studied waters is the oxidation processes. It is the result of oxidation processes of sulfide ores, which are in contact with the atmosphere, especially in stone pits and exploring trenches.
MeS + 2O2 + H2O → Me(OH)+ + SO42− + H+
The formation of active layer water chemical composition occurs under the influence of different factors and processes, with differing results. On one hand there is weak water exchange because of flat ground surface on the studied area. On the other hand, there is a process of seasonal freezing–melting of water-bearing rocks. This determines the water existence in the solid state for the most part of the year. For that reason, water–rock interaction time decreases and water enrichment in chemical elements is low.
However, in the waters of active layer there are favorable conditions for chemical element accumulation, such as acid conditions and high concentrations of organic matter. Acidic environment of the studied waters defines the water aggressivity on water-bearing rocks and organic acids contribute to formation of organic species of chemical elements.
Various chemical compositions of the studied waters predefine the peculiarity of water–rock interaction. Those active layer waters are oversaturated with respect to gibbsite and kaolinite. The degree of saturation with respect to these minerals increases with a water exchange intensity decrease—from watershed to river floodplain. Waters in watershed areas are characterized by low TDS and pH values, because the water–rock interaction time is very short. Waters on river floodplain areas have higher pH values, which is defined by water enrichment in OH and chemical elements, forming as a result of water–rock interaction.
The lake water chemistry is mostly dominated by dissolution of carbonates. This process defines the geochemical peculiarities of lake waters such as the highest values of pH and the lowest values of TDS among all the studied waters. Moreover, more alkaline lakes with pH 7.3–9.2 are located at the upper main river parts where carbonates are widely spread. These lake waters are very close to saturation with respect to calcite. This is one of the main peculiarities of lake waters. Among alkaline lakes, there are lakes with low pH (4.6–7.0). These lakes are located at the floodplain of main rivers, where lake waters enrich in organic matter, resulting in the decrease of pH. At the same time, the lowest values of TDS may be conditioned by dilution waters with precipitation. Thus, the main factors and processes of lake water chemical composition formation are carbonate dissolution, morphology position, scant quantity of organic matter, and short time of water–rock interaction.
As for waters in stone pits and exploring trenches, the main processes and factors of water chemical composition formation are weak water exchange, scant quantity of organic matter and active oxidation processes. According to the lithology of the studied area, marble rocks with sulfide inclusions are widely spread.
Oxidation of sulfide minerals causes water enrichment with the sulfate ion. The result of this process is a pH decrease [43], whereas the studied waters are characterized by high pH values. This is due to the neutralization processes accompanying water interaction with carbonated rocks according to following reactions.
H+ + CaCO3 = Ca2+ + HCO3
H+ + MgCO3 = Mg2+ + HCO3
It should be noted that waters of stone pits and exploration trenches are oversaturated with respect to calcite. This is due to the weak intensity of water exchange, assisted to reach this stage of water–rock interaction.
Thus, chemical composition of waters in stone pits and exploration trenches is mostly conditioned by natural factors which were intensified by negligible exploration activity in the studied area.

4. Conclusions

The present investigation shows that the studied waters are ultrafresh with TDS from 14 to 438 mg/L. Geochemical environment is characterized as typical for swamp and groundwaters. The pH values range from 3.5 to 9.0, Eh values vary from −68 to 347 mV. The fulvic acid concentrations in waters vary from 1.3 to 19.4 mg/L and humic acids from 0.5 to 2.8 mg/L. The studied waters mostly belong to HCO3–Ca–Mg or HCO3–Mg–Ca chemical water types, rarely do waters have SO4–HCO3–Ca composition.
The studied water types are namely active layer waters; rivers, lakes and waters of stone pits and exploration trenches have their own chemical composition peculiarities caused by the different conditions of chemical composition formation. For example, active layer waters are enriched with organic matter more strongly than other water types in the studied area. However, lakes and waters of stone pits and exploration trenches are more alkaline.
The geochemical environment of studied waters assists in the accumulation of such trace elements as Fe, Mn, Al, Ni, Au, Co, Li, Sc, Ti, Cr, Sr, Nb, Mo, Cs, La, Eu, Lu, Hg, and Se, with concentrations much higher than the average for rivers around the world.
The chemical composition of the studied waters is the result of chemical element enrichment mainly during the processes of alunimosilicate hydrolysis and carbonate dissolution. The presented thermodynamic calculations of water equilibrium with rocks show that the studied waters are undersaturated with respect to primary minerals and oversaturated with respect to secondary minerals such as Al, Mn, Fe oxides, hydroxides, kaolinite, rarely montmorillonites and calcite.

Acknowledgments

This work is funded within the state assignment of the Ministry of Education and Science of Russia for 2014–2016 TPU No. 5.1931.2014/K. The REE research was supported by Grant of Russian Scientific Fund No. 14-17-00415.

Conflicts of Interest

The author declares no conflict of interest.

Appendix A.

Table A1. Analytical Data on Water Samples: Physico-Chemical Parameters and Major Components. Redox Potential (Eh, mV), Total Dissolved Solids (TDS) and Ionic Concentration in mg/L.
TypeSamplepHEhHCO3ClSO4CaMgNaKTDSSiAlMnFe
Active layer waters5125.820235.40.20.52.55.01.20.4445.880.390.060.60
5326.377213.40.30.533.219.34.13.427428.759.520.2617.45
5505.618449.44.04.03.57.41.76.0766.760.852.403.80
5597.5155186.71.912.055.45.71.72.12669.383.191.202.75
5666.6130134.20.60.57.521.22.10.416612.01.500.080.91
5803.525138.20.30.54.23.81.71.5503.750.690.716.21
5864.321949.30.31.010.13.40.51.2661.660.700.119.79
6096.123153.31.51.02.68.91.30.9696.160.621.563.20
6214.130618.40.30.51.81.91.20.4242.010.260.153.49
6376.216389.70.30.519.25.41.50.51173.680.041.396.88
6947.3249148.90.32.043.22.82.30.22003.340.040.030.33
7046.726238.00.36.08.22.92.00.9584.460.080.190.14
7115.922536.20.30.52.15.51.10.1455.690.250.050.42
7175.419945.80.34.05.14.44.02.0666.991.990.241.88
7195.3242138.50.348.014.020.815.97.324533.8321.216.9523.37
7455.214327.10.90.55.61.11.51.3383.570.291.776.02
7494.913736.40.33.08.22.30.91.0522.020.160.521.30
7675.516031.90.40.51.94.90.80.2402.050.190.050.35
8036.514627.20.23.07.11.41.00.1403.060.060.271.74
8105.221319.10.712.05.53.20.60.7427.322.170.345.09
8334.4141146.40.37.026.513.32.21.519710.973.0411.34108.64
8416.1154113.80.31.025.66.41.70.815011.502.172.78218.26
8525.417845.60.33.012.61.70.41.1652.530.201.698.61
8915.022841.50.30.56.43.22.20.5540.730.240.370.77
8995.416855.20.30.510.03.33.10.3722.790.180.691.92
9426.716343.30.30.53.74.63.30.4563.790.260.301.51
9455.712076.30.30.58.38.63.00.4973.140.390.8612.70
9465.61996.60.30.510.010.84.50.61235.050.340.721.71
9974.718725.30.30.53.62.60.70.1330.260.190.102.22
9995.616529.20.30.55.41.91.20.2381.810.120.260.58
10523.868104.20.30.528.92.12.00.41383.760.222.5615.19
10655.013861.30.30.59.83.65.00.4804.210.450.188.36
Mean6.017357.50.41.58.64.51.90.480.03.690.190.261.58
Lakes4027.021633.60.34.05.42.92.80.5501.030.660.040.64
4068.917460.50.310.09.55.46.50.5930.250.290.061.08
4138.320897.50.30.510.910.44.50.41240.310.020.030.20
4157.718971.00.30.511.85.33.20.3920.930.210.020.50
4188.117596.90.32.013.29.24.90.51270.340.040.020.32
4267.918033.70.30.54.92.91.50.5440.470.020.010.09
4277.819278.20.30.510.84.78.30.31030.350.070.010.30
4357.416067.20.30.59.86.12.60.3862.340.300.030.66
4477.817251.00.30.511.32.61.50.2671.080.030.010.20
4507.814742.90.30.57.92.91.60.2560.880.050.010.21
4567.517031.70.30.54.22.91.70.2411.130.070.030.47
4597.416245.10.32.02.27.51.40.3591.130.070.010.35
4657.718335.40.34.09.51.61.30.5530.160.030.010.14
4788.014644.10.30.59.11.92.80.1580.350.020.040.21
4828.115033.80.30.56.61.72.10.2450.400.020.040.17
4876.517510.90.30.51.60.71.10.2150.270.050.020.23
4918.510034.00.32.06.51.72.90.5480.260.030.050.25
4937.820134.40.300.55.91.72.90.5460.250.030.050.30
4987.025929.60.30.52.13.81.20.9381.050.320.060.69
8004.614725.90.30.56.00.91.20.1340.270.030.040.10
10729.013443.80.30.53.65.02.41.2560.320.110.110.62
10767.120347.30.30.57.53.13.11.0620.530.060.080.14
10806.716980.60.30.55.510.15.10.31020.830.080.020.47
10816.716738.70.30.51.95.91.30.3480.580.150.010.50
10826.417252.30.30.54.16.52.90.2660.360.080.030.31
10906.819433.00.31.01.75.301.10.2430.460.050.020.35
11606.919732.90.30.53.53.691.30.4422.270.170.050.62
20027.025845.70.30.52.07.141.40.5570.720.050.050.27
20047.125141.70.30.52.26.021.80.4520.350.180.050.51
20068.59834.40.31.02.74.751.20.6450.980.410.201.22
20096.717432.10.30.52.84.001.30.4410.530.150.010.31
20138.04779.00.31.07.410.142.50.61010.760.450.091.80
20147.815570.70.30.56.68.523.10.1890.230.080.030.29
20167.912884.00.30.515.95.782.40.51093.210.450.080.81
Mean7.317547.00.30.25.43.72.00.3570.670.080.030.40
Rivers5056.622555.50.21.02.68.91.60.01704.180.100.010.25
5087.121772.20.20.55.410.02.20.1904.480.100.000.18
5697.013360.80.31.012.13.423.30.03816.100.030.020.22
6147.321063.20.31.013.33.62.30.2843.010.020.020.26
6366.918536.10.30.53.54.21.60.6460.850.230.100.78
6856.9107240.30.39.055.99.912.00.33286.810.020.201.08
7544.811519.10.34.03.22.50.70.4301.220.130.100.82
7844.915927.40.20.52.63.60.80.1351.290.110.030.55
7915.721224.20.30.54.31.71.20.1322.230.170.010.71
8225.715831.40.513.09.52.92.00.1594.960.040.000.08
9307.0180104.50.30.520.37.61.80.11354.160.040.040.25
9616.617127.30.31.03.13.11.40.3370.850.070.040.67
10306.298108.40.30.57.215.13.90.51362.690.250.090.88
7296.917092.80.30.516.97.41.60.11196.250.030.010.10
5147.418564.20.30.510.84.82.90.3830.740.130.060.54
5217.48989.30.30.513.57.83.60.31153.990.060.070.34
5457.6108133.40.20.524.210.13.50.21726.820.030.010.09
6645.818454.30.32.03.98.11.60.4711.590.130.061.49
8186.612440.10.33.08.13.01.70.1563.400.130.020.13
8285.121360.20.31.010.84.71.90.2792.200.050.010.18
8466.819268.30.30.59.66.42.80.4882.820.240.030.49
8497.516055.40.31.07.85.52.10.2723.140.320.030.54
8847.116350.10.30.56.53.25.50.3661.430.080.040.64
9107.613648.80.33.010.63.31.60.1681.560.030.040.26
9536.421015.90.310.02.93.40.90.7341.230.400.171.41
9737.323062.21.13.015.72.91.90.02873.730.010.010.25
10117.315047.30.30.55.93.15.20.2621.270.120.050.85
10226.215598.10.30.516.48.12.80.41262.340.060.040.31
10696.16560.30.30.59.73.35.40.3791.890.070.030.50
Mean6.917064.80.31.810.94.21.90.2802.320.130.0260.4
Waters of stone pits and exploration trenches1168.2193138.64.418.044.64.93.00.42142.70.0030.000030.56
1177.412163.40.647.036.21.81.50.31511.10.0060.00040.41
1188.0158330.41.91.091.78.52.92.34385.80.0070.2581.09
2058.3212102.84.450.052.32.40.70.32131.10.0020.0030.60
2068.620059.81.91.016.42.40.70.2820.50.0110.0040.22
2078.1192172.01.97.039.69.84.12.12361.80.0080.1060.88
2088.4204116.14.442.047.94.92.20.32181.70.0030.0020.60
2098.3218152.44.422.058.01.21.60.32403.90.0010.0020.80
3048.2191233.31.95.059.510.92.20.33131.50.0010.0040.12
3057.418932.90.81.07.22.40.40.1450.60.0390.0120.65
3068.3182138.41.93.542.62.41.20.31900.40.0010.0120.21
3078.417187.61.95.029.31.20.60.11260.70.0070.0060.05
Mean8.1186135.62.516.843.84.41.80.62061.80.0070.0340.52

References

  1. Pašava, J.; Knésl, I.; Vymazalová, A.; Vavřín, I.; Gurskaya, L.I.; Kolbantsev, L.R. Geochemistry and mineralogy of platinum-group elements (PGE) in chromites from Centralnoye I, Polar Urals, Russia. Geosci. Front. 2011, 2, 81–85. [Google Scholar] [CrossRef]
  2. Soloviev, S.G.; Kryazhev, S.G.; Dvurechenskaya, S.S. Geology, mineralization, stable isotope geochemistry, and fluid inclusion characteristics of the Novogodnee–Monto oxidized Au–(Cu) skarn and porphyry deposit, Polar Ural, Russia. Miner. Deposita 2013, 48, 603–627. [Google Scholar] [CrossRef]
  3. Vasil’ev, N.V.; Chevychelov, V.Y.; Zaraisky, G.P.; Borodulin, G.P.; Udoratina, O.V. Tantalum-Niobium mineralization of the Taikeu ore cluster, the Polar Urals. Geol. Ore Depos. 2009, 51, 537–548. [Google Scholar] [CrossRef]
  4. Ugolini, F.C. Pedogenic zonation in the well-drained soils of the arctic regions. Quat. Res. 1986, 26, 100–120. [Google Scholar] [CrossRef]
  5. Hodson, A.; Tranter, M.; Vatne, G. Contemporary rates of chemical denudation and atmospheric CO2 sequestration in glacier basins: An Arctic perspective. Earth Surf. Process. Landf. 2000, 25, 1447–1471. [Google Scholar] [CrossRef]
  6. Reynolds, R.C., Jr.; Johnson, N.M. Chemical weathering in the temperate glacial environment of the Northern Cascade Mountains. Geochim. Cosmochim. Acta 1972, 36, 537–554. [Google Scholar] [CrossRef]
  7. Drever, J.I.; Zobrist, J. Chemical weathering of silicate rocks as a function of elevation in the southern Swiss Alps. Geochim. Cosmochim. Acta 1992, 56, 3209–3216. [Google Scholar] [CrossRef]
  8. Anderson, S.P.; Drever, J.I.; Humphrey, N.F. Chemical weathering in glacial environments. Geology 1997, 25, 399–402. [Google Scholar] [CrossRef]
  9. Anderson, S.P.; Drever, J.I.; Frost, C.D.; Holden, P. Chemical weathering in the foreland of a retreating glacier. Geochim. Cosmochim. Acta 2000, 64, 1173–1189. [Google Scholar] [CrossRef]
  10. Anderson, S.P.; Longacre, S.A.; Kraal, E.R. Patterns of water chemistry and discharge in the glacier-fed Kennicott River, Alaska: Evidence for subglacial water storage cycles. Chem. Geol. 2003, 202, 297–312. [Google Scholar] [CrossRef]
  11. Hodson, A.; Tranter, M.; Gurnell, A.; Slark, M.; Hagen, J.O. The hydrochemistry of Bayelva, a high Arctic proglacial stream in Svalbard. J. Hydrol. 2002, 257, 91–114. [Google Scholar] [CrossRef]
  12. Millot, R.; Gaillardet, J.; Dupré, B.; Allègre, C.J. Northern latitude chemical weathering rates: Clues from the Mackenzie River Basin, Canada. Geochim. Cosmochim. Acta 2003, 67, 1305–1329. [Google Scholar] [CrossRef]
  13. Dragon, K.; Marciniak, M. Chemical composition of groundwater and surface water in the Arctic environment (Petuniabukta region, central Spitsbergen). J. Hydrol. 2010, 386, 160–172. [Google Scholar] [CrossRef]
  14. Cooper, R.J.; Wadhama, J.L.; Trantera, M.; Hodgkinsb, R.; Petersc, N.E. Groundwater hydrochemistry in the active layer of the proglacial zone, Finsterwalderbreen, Svalbard. J. Hydrol. 2002, 269, 208–223. [Google Scholar] [CrossRef]
  15. Savichev, O.G.; Kolesnichenko, L.G.; Saifulina, E.V. The ecologo-geochemical state of water bodies in the Taz-Yenisei interfluve. Geogr. Nat. Resour. 2011, 32, 333–336. [Google Scholar] [CrossRef]
  16. Kokelj, S.V.; Smith, C.A.S.; Burn, C.R. Physical and chemical characteristics of the active layer and permafrost, Herschel Island, western Arctic Coast, Canada. Permafr. Periglac. Process. 2002, 13, 171–185. [Google Scholar] [CrossRef]
  17. Millot, R.; Gaillardet, J.; Dupré, B.; Allègre, C.J. The global control of silicate weathering rates and the coupling with physical erosion: New insights from rivers of the Canadian Shield. Earth Planet. Sci. Lett. 2002, 196, 83–98. [Google Scholar] [CrossRef]
  18. Lobbes, J.M.; Fitznar, H.P.; Kattner, G. Biogeochemical characteristics of dissolved and particulate organic matter in Russian rivers entering the Arctic Ocean. Geochim. Cosmochim. Acta 2000, 64, 2973–2983. [Google Scholar] [CrossRef]
  19. Kawahigashi, M.; Kaiser, K.; Kalbitz, K.; Rodionov, A.; Guggenberger, G. Dissolved organic matter in small streams along a gradient from discontinuous to continuous permafrost. Glob. Chang. Biol. 2004, 10, 1576–1586. [Google Scholar] [CrossRef]
  20. Cory, R.M.; McKnight, D.M.; Chin, Y.P.; Miller, P.; Jaros, C.L. Chemical characteristics of fulvic acids from Arctic surface waters: Microbial contributions and photochemical transformations. J. Geophys. Res. 2007, 112, G04S51. [Google Scholar] [CrossRef]
  21. Holmes, R.M.; McClelland, J.W.; Raymond, P.A.; Frazer, B.B.; Peterson, B.J.; Stieglitz, M. Lability of DOC transported by Alaskan rivers to the Arctic Ocean. Geophys. Res. Lett. 2008, 35, L03402. [Google Scholar] [CrossRef]
  22. Spencer, R.G.M.; Aiken, G.R.; Wickland, K.P.; Striegl, R.G.; Hernes, P.J. Seasonal and spatial variability in dissolved organic matter quantity and composition from the Yukon River basin, Alaska. Glob. Biogeochem. Cycles 2008, 22, GB4002. [Google Scholar] [CrossRef]
  23. Spencer, R.G.M.; Aiken, G.R.; Butler, K.D.; Dornblaser, M.M.; Striegl, R.G.; Hernes, P.J. Utilizing chromophoric dissolved organic matter measurements to derive export and reactivity of dissolved organic carbon exported to the Arctic Ocean: A case study of the Yukon River, Alaska. Geophys. Res. Lett. 2009, 36, L06401. [Google Scholar] [CrossRef]
  24. Balcarczyk, K.L.; Jones, J.B., Jr.; Jaffeґ, R.; Maie, N. Stream dissolved organic matter bioavailability and composition in watersheds underlain with discontinuous permafrost. Biogeochemistry 2009, 94, 255–270. [Google Scholar] [CrossRef]
  25. Shirokova, L.S.; Pokrovsky, O.S.; Kirpotin, S.N.; Desmukh, C.; Pokrovsky, B.G.; Audry, S.; Viers, J. Biogeochemistry of organic carbon, CO2, CH4, and trace elements in thermokarst water bodies in discontinuous permafrost zones of Western Siberia. Biogeochemistry 2013, 113, 573–593. [Google Scholar] [CrossRef]
  26. Niu, F.; Lin, Z.; Liu, H.; Lu, J. Characteristics of thermokarst lakes and their influence on permafrost in Qinghai–Tibet Plateau. Geomorphology 2011, 132, 222–233. [Google Scholar] [CrossRef]
  27. Karlsson, J.M.; Lyon, S.W.; Destoun, G. Thermokarst lake, hydrological flow and water balance indicators of permafrost change in Western Siberia. J. Hydrol. 2012, 464–465, 459–466. [Google Scholar] [CrossRef]
  28. Kirpotin, S.N.; Polishchuk, Y.M.; Bryksina, N.A. Dynamics of areas of thermokarst lakes in perennial and nonperennial cryolithic zones of West Siberia under global warming condition. Vestn. Tomsk. Gos. Univ. 2008, 311, 185–189. (In Russian) [Google Scholar]
  29. Kuzin, A.V.; Tulenina, Y.V. Permafrost thickness on the eastern slope of the Polar Urals by the VES data. Environ. Geosci. 2011, 5, 474–476. (In Russian) [Google Scholar]
  30. Dobinski, W. Permafrost. Earth Sci. Rev. 2011, 108, 158–169. [Google Scholar] [CrossRef]
  31. Glavtyumengeologiya. The Results of Geological Survey of the Basin Area of Schuchya River (the Polar Urals); Report of the Schuchya Geological Field Company; Glavtyumengeologiya: Tyumen, Russia, 1973. (In Russian) [Google Scholar]
  32. Bukaty, M.B. Software development for solution of hydro-geological problems. Bull. Tomsk Polytech. Univ. 2002, 305, 348–365. (In Russian) [Google Scholar]
  33. Shvartsev, S.L. Geochemistry of fresh groundwater in the main landscape zones of the Earth. Geochem. Int. 2008, 46, 1285–1398. [Google Scholar] [CrossRef]
  34. Kambalina, M.G.; Scvortsova, L.N.; Mazurova, I.S.; Guseva, N.V.; An, V.V. Study of aqueous chemical forms of silicon in organic-rich waters. Procedia Chem. 2014, 10, 36–42. [Google Scholar] [CrossRef]
  35. Kataeva, M.N.; Alexeeva-Popova, N.V.; Drozdova, I.V.; Beljaeva, A.I. Chemical composition of soils and plant species in the Polar Urals as influenced by rock type. Geoderma 2004, 122, 257–268. [Google Scholar] [CrossRef]
  36. Gibbs, R.J. Mechanisms controlling world water chemistry. Science 1970, 170, 1088–1090. [Google Scholar] [CrossRef] [PubMed]
  37. Shvartsev, S.L.; Ryzhenko, B.N.; Alekseev, V.A.; Dutova, E.M.; Kondrateva, I.A.; Kopylova, Y.; Lepokurova, O.E. Geological Evolution and Self-Organization of the Water–Rock System; Publishing House of Siberian Branch of the Russian Academy of Sciences: Novosibirsk, Russia, 2007. (In Russian) [Google Scholar]
  38. Guseva, N.V.; Kopylova, Y.G.; Khvashchevskaya, A.A. Geochemical types of natural waters in the interfluve of the Enzor’yakhi and the Yun’yakhi (eastern slope of the Polar Urals). Water Resour. 2013, 40, 417–425. [Google Scholar] [CrossRef]
  39. Garrels, R.M.; Christ, C.L. Solutions, Minerals and Equilibria; Harper & Row: New York, NY, USA, 1965. [Google Scholar]
  40. Borovitskiy, V.I. Trace elements behavior in active layer and hydrogeochemical prospecting ore deposits in permafrost region. In Proceedings of the 5-th Meeting of Groundwater of Siberia and the Far East, Irkutsk, Russia, 21–26 June 1967; SB AS USSR: Irkutsk, Russia, 1967; pp. 109–110. (In Russian)[Google Scholar]
  41. Vozhov, V.I. The results of hydrogeochemical research in Talnahskoye Cu-Ni deposit. In Proceedings of the Conference of Hydrogeochemical and Paleohydrogeological Research Methods for Ore Deposit Prospecting, Tomsk, Russia, 15–18 February 1965; Tomsk University Publishing House: Tomsk, Russia, 1969; pp. 95–98. (In Russian)[Google Scholar]
  42. Klaminder, J.; Grip, H.; Morth, C.-M.; Laudon, H. Carbon mineralization and pyrite oxidation in groundwater: Importance for silicate weathering in boreal forest soils and stream base-flow chemistry. Appl. Geochem. 2011, 26, 319–325. [Google Scholar] [CrossRef]
  43. Dongarrà, G.; Manno, E.; Sabatino, G.; Varrica, D. Geochemical characteristics of waters in mineralised area of Peloritani Mountains (Sicily, Italy). Appl. Geochem. 2009, 24, 900–914. [Google Scholar] [CrossRef]
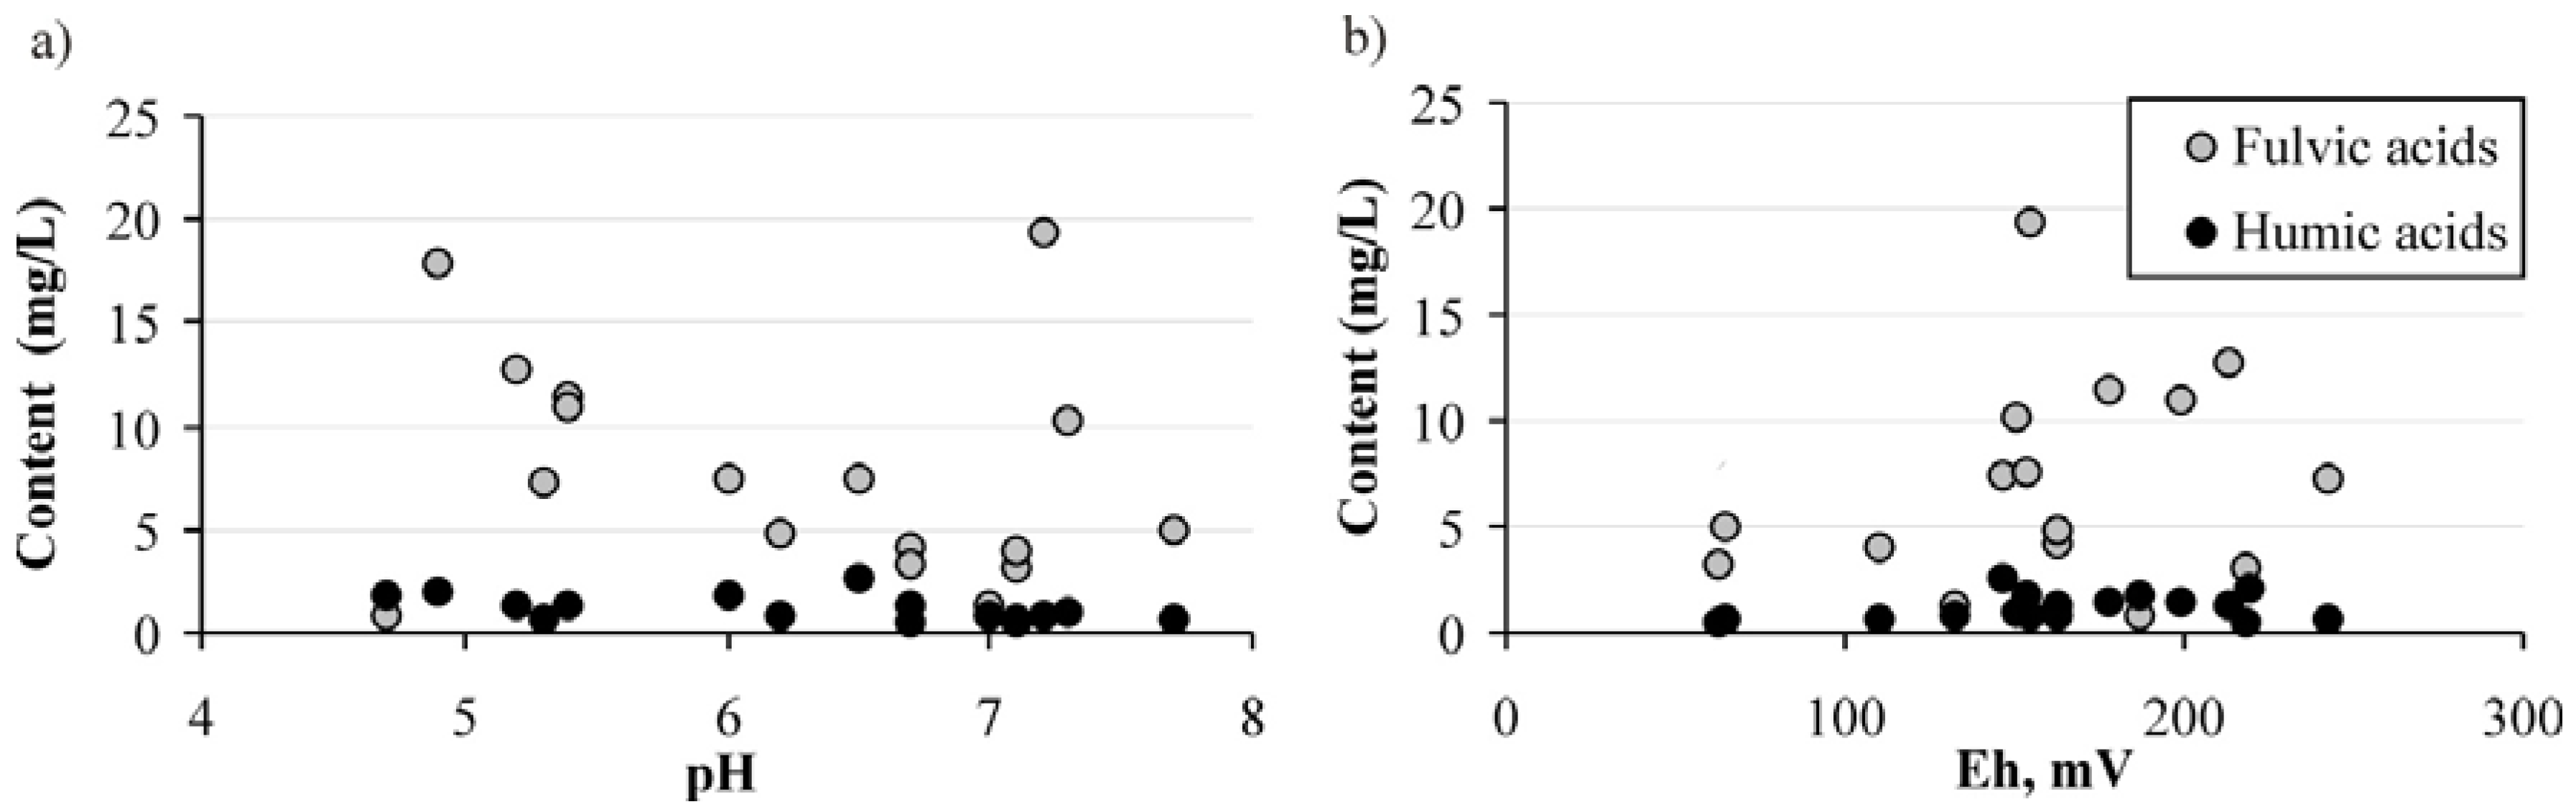
Figure 1. Sketch map of the studied area showing the sampling sites. Inset shows location of the study area in the Russian Federation.
Water 08 00594 g001
Figure 2. Lithology sketch-map of the studied area.
Water 08 00594 g002
Figure 3. pH vs. redox potential (Eh) plot for the studied area.
Water 08 00594 g003
Figure 4. Relationship of organic acid content vs. pH (a); organic acid content vs. Eh (b) for same water points from the studied area
Water 08 00594 g004
Figure 5. Piper diagram showing anion and cation compositions of the studied waters. 1—waters of active layer; 2—lakes; 3—rivers; 4—waters of stone pits and exploration trenches.
Water 08 00594 g005
Figure 6. Relationships HCO3 vs. TDS (a); Ca vs. TDS (b); Ca vs. HCO3 (c); Ca vs. Si (d) for waters from the studied area. Symbols as in Figure 5. TDS—total dissolved solids
Water 08 00594 g006
Figure 7. Gibbs plots indicating the mechanisms that determine major-ion composition of the studied waters. Symbols as in Figure 5.
Water 08 00594 g007
Figure 8. Selected activity diagram in K2O–SiO2–Al2O3–H2O (a); Na2O–SiO2–Al2O3–H2O (b); CaO–SiO2–Al2O3–H2O (c); MgO–SiO2–Al2O3–H2O (d) systems and calcite equilibrium diagram (e) at 25 °C and 1 bar. Symbols as in Figure 5.
Water 08 00594 g008
Figure 9. Relationships Al vs. Si for lakes, rivers, waters of stone pits and exploration trenches (a) and for waters of active layer (b). Symbols as in Figure 5.
Water 08 00594 g009
Table 1. The physico-chemical parameters and fulvic and humic acid contents in several water points in the studied area.
Water TypeEhpHFulvic Acids (mg/L)Humic Acids (mg/L)
river1507.310.20.9
river1557.219.40.7
river1337.001.30.8
river1117.104.00.6
river647.705.00.7
waters of active layer1256.507.42.7
waters of active layer1636.74.21.3
waters of active layer1785.411.51.3
waters of active layer1995.410.901.4
waters of active layer2135.212.81.3
waters of active layer1636.24.80.8
waters of active layer2194.917.82.0
waters of active layer2425.37.20.6
waters of active layer2187.13.10.5
waters of active layer1536.07.51.8
waters of active layer626.703.30.5
Average for waters of the Vasugan swamp [33]25.17.06
Table 2. Trace elements content in the studied waters, μg/L ( min max average ) .
ElementsWaters of Active LayerRiversLakesWaters of Stone Pits and Exploring TrenchesAverage of World Rivers [33]ElementsWaters of Active LayerRiversLakesWaters of Stone Pits and Exploring TrenchesAverage of World Rivers [33]
Li 0.13 54.17 2.07 0.07 25.67 1.6 0.14 20.61 2.6 0.06 6.81 0.5 2.5Br 0.1 31.9 8.30 0.1 84.47 6.61 0.1 28.97 6.62 0.2 151.53 57.68 20.0
Be 0.002 2.72 0.024 0.0016 0.54 0.010 0.002 0.21 0.013 0.0002 0.25 0.004 -Rb 0.03 56.1 0.75 0.003 6.1 0.30 0.008 2.4 0.30 0.04 2.9 0.20 2.0
B 0.04 270.81 5.40 1.18 146.72 6.59 1.39 45.57 9.55 -20Sr 3.4 366.9 30.8 6.84 113.93 22.90 3.93 69.84 13.40 12.02 378.32 75.0 50.0
Sc 0.18 28.12 1.92 0.09 10.38 1.19 0.03 2.43 0.41 0.2 4.91 0.78 0.004Y 0.009 26.9 0.36 0.008 5.02 0.10 0.0063 0.69 0.09 0.001 2.42 0.02 0.7
Ti 0.43 155.70 3.13 0.21 117.71 1.9 0.40 13.71 2.0 0.17 249.02 60.4 3.0Zr 0.1 6.2 0.2 0.012 1.13 0.14 0.006 0.62 0.07 0.0065 3.49 0.19 2.6
V 0.0003 4.35 0.21 0.0003 2.28 0.18 0.0003 2.04 0.05 0.001 6.35 0.28 1.0Nb 0.002 0.47 0.01 0.0007 0.081 0.007 0.0005 0.16 0.005 0.0009 0.26 0.005 0.001
Cr 0.01 66.96 1.42 0.01 18.96 1.2 0.01 8.09 0.5 0.84 11.64 3.1 1.0Mo 0.001 2.5 0.06 0.1 31.9 8.30 0.1 31.9 8.30 0.1 31.9 8.30 1.0
Co 0.07 363.39 2.13 0.03 23.53 0.21 0.05 1.35 0.20 0.01 1.03 0.08 0.3Ru 0.003 0.02 0.0006 0.0001 0.04 0.0005 0.0003 0.005 0.0004 0.0001 0.0059 0.001 -
Ni 0.003 219.19 1.3 0.003 22.42 0.8 0.003 13.23 2.4 0.52 6.69 1.4 2.5Rh 0.0003 0.0289 0.002 0.0002 0.01 0.0013 0.0003 0.0079 0.001 0.0007 0.014 0.003 -
Cu 0.30 80.04 3.0 0.34 34.69 1.5 0.26 4.66 1.4   0.34 21.48 1.7 7.0Pd 0.002 0.08 0.007 0.002 0.03 0.005 0.002 0.03 0.005 0.002 0.27 0.003 -
Zn 0.66 410.90 18.9 0.55 205.00 4.8 0.16 326.40 4.6 0.43 51.88 2.5 20.0Ag 0.0003 0.6 0.01 0.0003 0.099 0.003 0.0003 0.05 0.002 0.0013 0.11 0.007 0.2
Ga 0.00005 0.21 0.006 0.00005 0.045 0.0028 0.00005 0.066 0.003 -0.1Cd 0.002 3.51 0.06 0.002 0.37 0.01 0.002 0.16 0.01 0.0013 0.21 0.005 0.2
Ge 0.00005 0.042 0.0016 0.00005 0.037 0.0013 0.00005 0.018 0.0007 -0.07Sn 0.00005 0.37 0.01 0.00005 0.14 0.005 0.00005 0.04 0.005 0.0007 0.09 0.004 0.04
As 0.19 4.31 0.53 0.007 2.08 0.37 0.12 2.86 0.44 0.23 9.50 1.03 2.0Sb 0.03 2.3 0.20 0.031 1.26 0.19 0.02 0.52 0.15 0.084 4.7 0.37 1.0
Se 0.001 13.91 0.50 0.001 11.36 0.45 0.001 9.88 0.35 0.16 7.38 0.80 0.2Te 0.0004 0.17 0.002 0.0001 0.03 0.0009 0.0004 0.038 0.001 0.0001 0.048 0.0004 -
Cs 0.0006 0.64 0.009 0.0003 0.36 0.002 0.0003 0.068 0.003 0.0003 0.31 0.00078 0.03Pt 0.0001 0.004 0.0002 0.00008 0.02 0.0002 0.0001 0.001 0.0002 0.0004 0.06 0.005 -
Ba 1.35 44.3 7.6 1.15 10.13 5.51 0.90 9.72 5.82 1.24   16.31 7.36 30.0Au 0.00005 0.007 0.0004 0.00005 0.03 0.0007 0.00005 0.007 0.0006 0.0008 1.13 0.004 0.002
La 0.006 34.28 0.3 0.002 5.99 0.059 0.008 0.98 0.087 0.0008 0.82 0.005 0.05Hg 0.002 0.85 0.03 0.002 0.75 0.02 0.002 0.26 0.03 0.002 3.91 0.02 0.07
Eu 0.0004 1.82 0.02 0.0004 0.43 0.005 0.0004 0.064 0.007 0.00035 0.036 0.002 0.001Tl 0.0003 0.21 0.002 0.0002 0.05 0.0007 0.0002 0.007 0.0007 0.0002 0.02 0.0009 1.0
Lu 0.0003 0.47 0.008 0.0002 0.89 0.0024 0.0003 0.013 0.0021 0.0002 0.013 0.0003 0.001Pb 0.01 39.6 0.8 0.001 4.3 0.17 0.042 2.19 0.31 0.002 2.05 0.04 1.0
Hf 0.0003 0.21 0.007 0.0003 0.032 0.004 0.0003   0.022 0.003 0.0003 0.083 0.003 -Bi 0.0003 0.19 0.004 0.00002 0.03 0.001 0.0003 0.01 0.0009 0.000015 0.03 0.0013 -
Ta 0.0001 0.02 0.0006 0.0001 0.0084 0.0006 0.0001 0.0051 0.0004 --Th 0.0004 2.17 0.04 0.0005 0.22 0.03 0.003 0.23 0.02 0.0002 0.63 0.002 0.1
W 0.001 0.07 0.005 0.001 0.03 0.003 0.001   0.44 0.002 0.0009 66.85 0.014 0.03U 0.0005 6.39 0.01 0.0005 2.18 0.02 0.0006 0.11 0.01 0.00005 18.06 0.04 0.5
Re 0.0003 0.009 0.0005 0.0003 0.054 0.0005 0.00025 0.0015 0.0003 0.0006 0.21 0.008 -------
Table 3. Correlation matrix for water chemical composition in the study area (n = 107, p = 0.05, R = 0.5).
ElementHCO3ClSO42−Ca2+Mg2+Na+K+TDSSiAlMnFe
HCO31
Cl0.151
SO42−0.160.011
Ca2+0.870.160.351
Mg2+0.560.110.220.181
Na+0.54−0.050.390.450.241
K+0.230.130.290.150.280.241
TDS0.970.150.390.900.550.600.281
Si0.430.120.260.300.470.240.580.451
Al0.190.00030.260.140.270.140.610.240.851
Mn0.150.200.100.100.190.030.400.160.320.301
Fe0.080.010.080.080.08−0.00040.270.090.300.330.391

