1. Introduction
Point-source hydrocarbon spills are a significant environmental concern worldwide, whether they are from deep sea drilling rigs such as the Deepwater Horizon, bulk transport shipping or local dumping [
1,
2,
3]. On a smaller scale, research from Johns Hopkins Bloomberg School of Public Health raises concerns that significant amounts of fuel spilt at petrol (gas) refilling stations can be carried away with stormwater runoff into drainage networks or groundwater causing environmental and public health concerns [
4,
5]. International research has confirmed the presence of hydrocarbons in stormwater runoff from urban surfaces, in conjunction with heavy metals, nutrients and sediment [
6,
7,
8,
9,
10]. With the higher risk of fuel leaks and spills associated with refueling stations, many environmental protection agencies have implemented procedures and policies for the capture, treatment and removal/disposal of potentially contaminated runoff [
11,
12].
Management measures vary from a blind sump to capture all runoff and spills for later removal by vacuum truck; to “soft” engineered systems such as bioretention areas; and engineered technologies relying on retention time and coalescing media [
7,
13]. A blind sump consists of an underground concrete tank that collects the drainage from the bunded and covered forecourt (refueling) area and the bunded refill-box where tankers unload to the underground fuel tanks. A bund is any raised area, embankment or wall typically surrounding an area to keep spills contained or external overland flows out. Some bunds are vertical walls, whilst others can be formed in the pavement to drive over. Any fuel spills and wind-driven rain that falls within these bunded areas is captured by the blind sump, and must be regularly emptied by vacuum truck. The disadvantage of the blind sump is that, once full of rainwater, if a spill occurs, the capture volume available is reduced and could possibly result in overflow to drainage networks and the environment. The blind sump also is susceptible to human error in that it relies on inspection of the water level and engagement of a vacuum truck to remove the oily water as soon as possible after the rain event.
The function of natural vegetation and microbial action for hydrocarbon control has been demonstrated in several marine environments [
14,
15]. Less information is available on the field performance of natural systems in fresh (stormwater) environments. Bench-scale laboratory testing of bioretention columns for hydrocarbon removal, at the University of Maryland, observed that a 3 cm mulch layer provided a removal efficiency of approximately 80% for simulated storms [
13]. They indicate that the mulch is an essential ingredient in effective hydrocarbon removal. The disadvantage of this approach is that without a mulch layer, it could potentially lead to soil contamination over time and possibly costly remediation.
A variety of proprietary technologies have been developed internationally for medium to high risk vehicle refueling sites such as service station forecourts and underground petroleum tank fill points. This paper presents results of several case studies testing hydrocarbon capture for a separator technology that utilizes hydrodynamic separation and coalescing media on Stormwater and compares against the requirements of the Class 1 criteria from BS EN858.1-2002 [
16]. Testing has been undertaken in both laboratory and field installations across a number of different sites and model sizes.
2. European Standards for Hydrocarbon Capture Testing
Hydrocarbon separator systems have a specific test procedure known as the European Standard BS EN858-1:2002 Separator systems for light liquids (e.g., Oil and petrol). This Standard is recognized and implemented throughout most of Europe. The Construction Products Regulations require that new proprietary treatment systems must satisfy the requirements of BS EN858-1. Under the standard there are two classes of separator technologies determined by the outcomes of testing under standard conditions;
Class 1 separators, under standard test conditions, are designed to achieve <5 mg/L of oil in the effluent, and are designed to discharge to stormwater drainage networks and/or the environment;
Class 2 separators have a lower standard of treatment and are designed to achieve a discharge criteria of <120 mg/L of oil, but must discharge to sanitary sewers instead of stormwater.
The BS EN 858-1:2002 test procedure involves filling a full-scale model of the separator with potable water, in the laboratory, and running the treatment flowrate through the device for a period of time. This period is equivalent to the length of time necessary to exchange the volume of the device four times plus a “running in” period of 5 min. During the test period, oil is dosed into the constant test flow rate to produce a mixed hydrocarbon/water concentration of 5 mL/L (±5%). The oil should be in accordance with ISO8217, designation ISO-F-DMA and have a density of 0.85 ± 0.015 g/cm3 at 12 °C. At the full treatment flow rate of the device, samples are manually collected at 1 min intervals from the inlet and outlet to produce a minimum of 5 samples. Samples are analysed by infrared spectroscopy or gas chromatography in accordance with Standard Methods. The effluent concentration from the system is then evaluated against the 5 mg/L criteria using the average concentrations of the effluent samples.
3. Background
From a range of possible treatment options, one technology investigated is a gravity-type, passive, full retention system that treats all flows through two chambers. Low velocity laminar flow provides quiescent conditions in the separator enabling the entrained hydrocarbons to separate due to the difference in density and length of retention time. Water passes from the primary chamber via a submerged outlet into the secondary chamber and finally via underflow through a coalescing filter mounted in the invert of the secondary chamber. The coalescer filter media is an oleoliphic polyethylene sponge-like material that filters and subsequently repels hydrocarbons from water. The treatment technology is sized to treat a maximum design treatment flowrate from the catchment and capture hydrocarbon spills. The auto-closure device (ACD) in the first chamber has been designed and fabricated to float at the oil/water interface in a specific gravity of 1 and is sensitive to liquid density change. Should an emergency spill occur, the increasing hydrocarbon level on the water surface will displace the ACD and seal off the first chamber, preventing release of captured hydrocarbons via the device outlet into the downstream stormwater network. Spills are then retained in the first chamber of the device and upstream drainage network. Annual maintenance of the coalescing filter is recommended to ensure optimal operation. Refer to
Figure 1 for more details.
Figure 1.
Typical schematic of the Separator technology.
Figure 1.
Typical schematic of the Separator technology.
The separator technology is sized to treat a flow rate, not a specific rainfall event, as these are spatially and temporally variable. Further the catchment area treated is unique to each site. Often the device is sized to capture a design spill volume (e.g., 10,000 L) and a specific maximum flow rate expected from the refueling catchment.
4. Laboratory Testing to BS EN858-1:2002—Case Studies
HR Wallingford, in the United Kingdom, were engaged to undertake laboratory testing of several full-scale separators to determine their Class under EN BS858-1:2002 [
17]. The University of South Australia (UniSA) [
18] were engaged to undertake laboratory testing on a P010C1C2 model to also determine its performance according to the EN BS858-1:2002 standard [
16]. A schematic of the UniSA test rig is shown in
Figure 2 below.
The results of the UK laboratory testing are presented in
Table 1 [
17]. Six different models (P004/1CSC—P030/1CSC) were tested against the standard at their design treatment flow rates. In compliance with the EN BS 858-1:2002 criteria, all units demonstrate effluent discharge concentrations less than 5 mg/L from influent concentrations of ~4250 mg/L, thereby satisfying the Class 1 requirement.
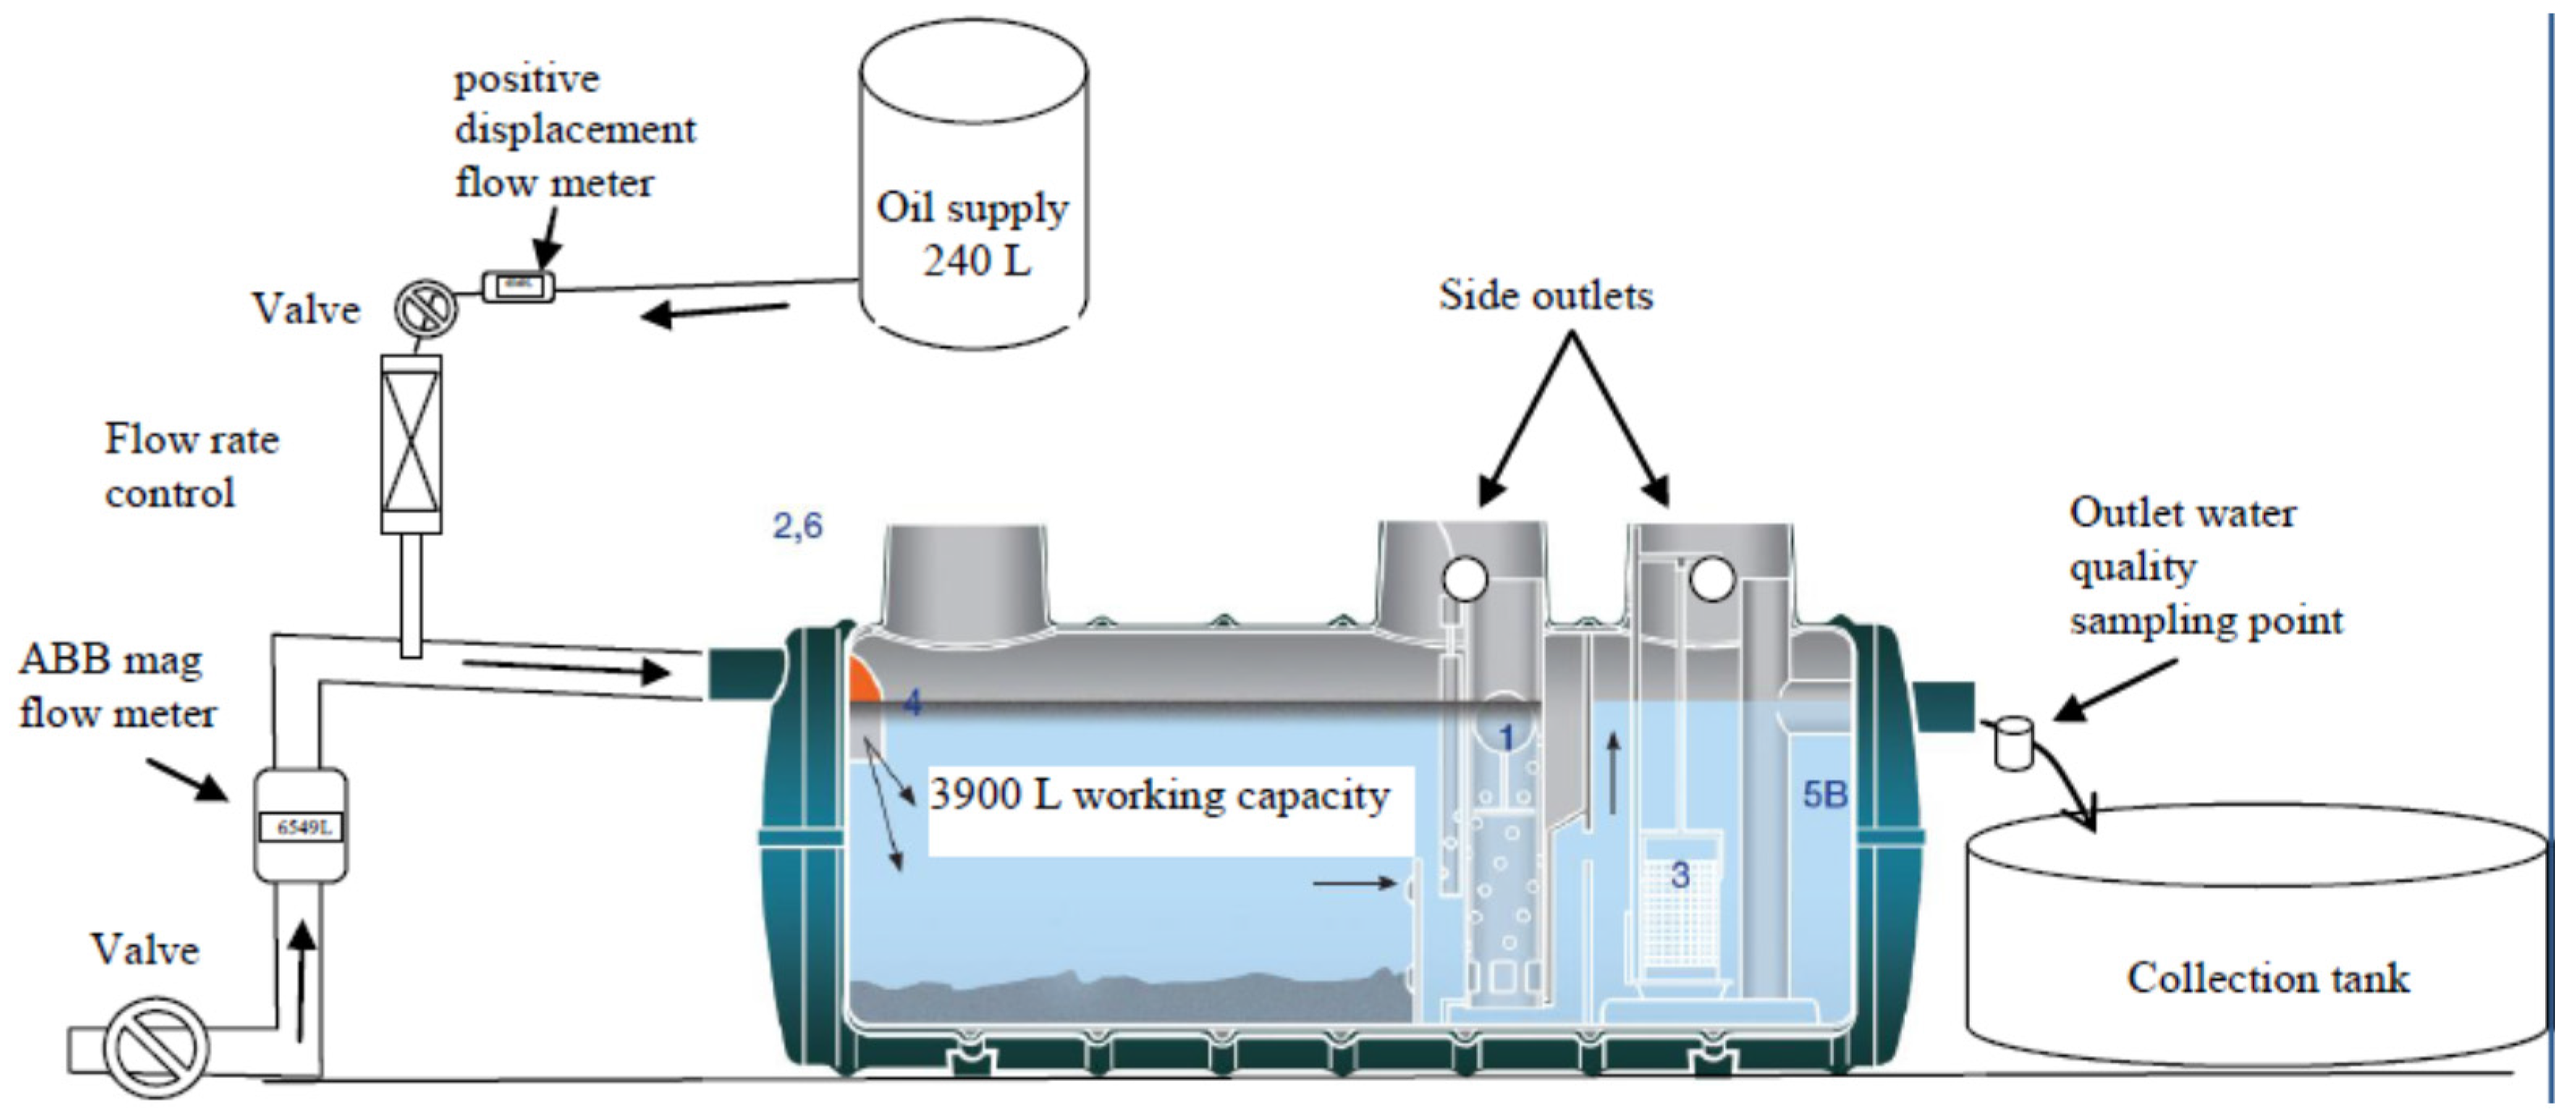
Figure 2.
Typical schematic of the Puraceptor™ Test Rig—side view [
18].
Figure 2.
Typical schematic of the Puraceptor™ Test Rig—side view [
18].
Table 1.
HR Wallingford Water Quality Results.
Table 1.
HR Wallingford Water Quality Results.
| Model Number | P004/1CSC | P006/1CSC | P010/1C | P020/2CSC | P020/2CSC | P030/1CSC |
|---|
| Flow Rate (L/s) | 4 | 6 | 10 | 20 | 24 | 30 |
|---|
| Limits of Detection (mg/L) | 0.1 | 0.1 | 0.1 | 0.1 | 0.1 | 0.1 |
|---|
| Sample | Out (mg/L) | Out (mg/L) | Out (mg/L) | Out (mg/L) | Out (mg/L) | Out (mg/L) |
|---|
| 1 | <0.1 | <0.1 | 1.4 | 1.5 | 1.3 | 0.2 |
| 2 | <0.1 | <0.1 | 1.0 | 2.0 | 1.1 | 0.1 |
| 3 | <0.1 | <0.1 | 1.3 | 1.8 | 1.1 | 0.1 |
| 4 | <0.1 | <0.1 | 1.3 | 1.8 | 1.4 | 0.3 |
| 5 | <0.1 | <0.1 | 0.9 | 2.2 | 1.6 | 1.7 |
| Mean | <0.1 | <0.1 | 1.18 | 1.86 | 1.3 | 0.5 |
The results of the UniSA laboratory testing are presented in
Table 2 [
18]. The UniSA testing was performed on a single model (P010/1CSC) at the design treatment flow rate (10 L/s). The unit was dosed with Nytro Libra insulating oil consisting of 65%–85% hydrotreated light napthenic distillate, 15%–35% hydrotreated light napthenic distillate and <5% solvent refined light napthenic distillate with an overall density of 886 kg/m
3 at 15 °C, to achieve an overall Total Petroleum Hydrocarbons (TPH) concentration of ~5700 mg/L. The results presented in
Table 2 break down the TPH fractions on the inlet and outlet to indicate the performance of the tested unit on each specific fraction. The tested unit demonstrates effluent discharge concentrations less than 5 mg/L from the varying influent concentration between 0.15 mg/L and >5570 mg/L for all TPH fractions. The results confirm compliance with the EN BS 858-1:2002 Class 1 criteria. Efficiency Ratio (ER) is calculated from the function:
Table 2.
University of South Australia Water Quality Results.
Table 2.
University of South Australia Water Quality Results.
| | P010/1CSC | |
|---|
| Flow Rate (L/s) | 10 | |
|---|
| TPH Fraction | C6–C9 | C10–C14 | C15–C28 | C29–C36 | Total |
|---|
| Limits of Detection (mg/L) | 0.02 | 0.04 | 0.1 | 0.1 | |
|---|
| Sample | Out (mg/L) | Out (mg/L) | Out (mg/L) | Out (mg/L) | Out (mg/L) |
|---|
| 1 | <0.02 | <0.04 | <0.1 | <0.1 | ND |
| 2 | <0.02 | <0.04 | 0.162 | <0.1 | 0.162 |
| 3 | <0.02 | <0.04 | <0.1 | <0.1 | ND * |
| 4 | <0.02 | <0.04 | <0.1 | <0.1 | ND * |
| 5 | <0.02 | <0.04 | <0.1 | <0.1 | ND * |
| Mean | <0.02 | <0.04 | 0.032 | <0.1 | 0.032 |
| Inflow Fraction Concentration (mg/L) | 0.15 | 125.43 | 5570.62 | 3.42 | 5699.62 |
| Efficiency Ratio | >86% | >99% | >99% | >97% | >99.99% |
5. Australian Field Case Studies
Several field installations of the technology have been monitored in Australia in compliance with development approval conditions. These sites are petrol (gas) refueling stations where the device has been used instead of a blind sump and discharges to the stormwater drainage network. The Separator technology at each site treats runoff from the under-canopy, car refuelling area that receives windblown rain and entrained water from vehicles in wet weather. The tanker refilling points that are often exposed to rain are also connected to the Separator technology. Aside from annual maintenance of the coalescing filter, none of the sites have required removal of hydrocarbon spills or treatment chamber contents. The sites have been in operation for between 2 and 5 years.
5.1. Service Station, Bomaderry, New South Wales (NSW)
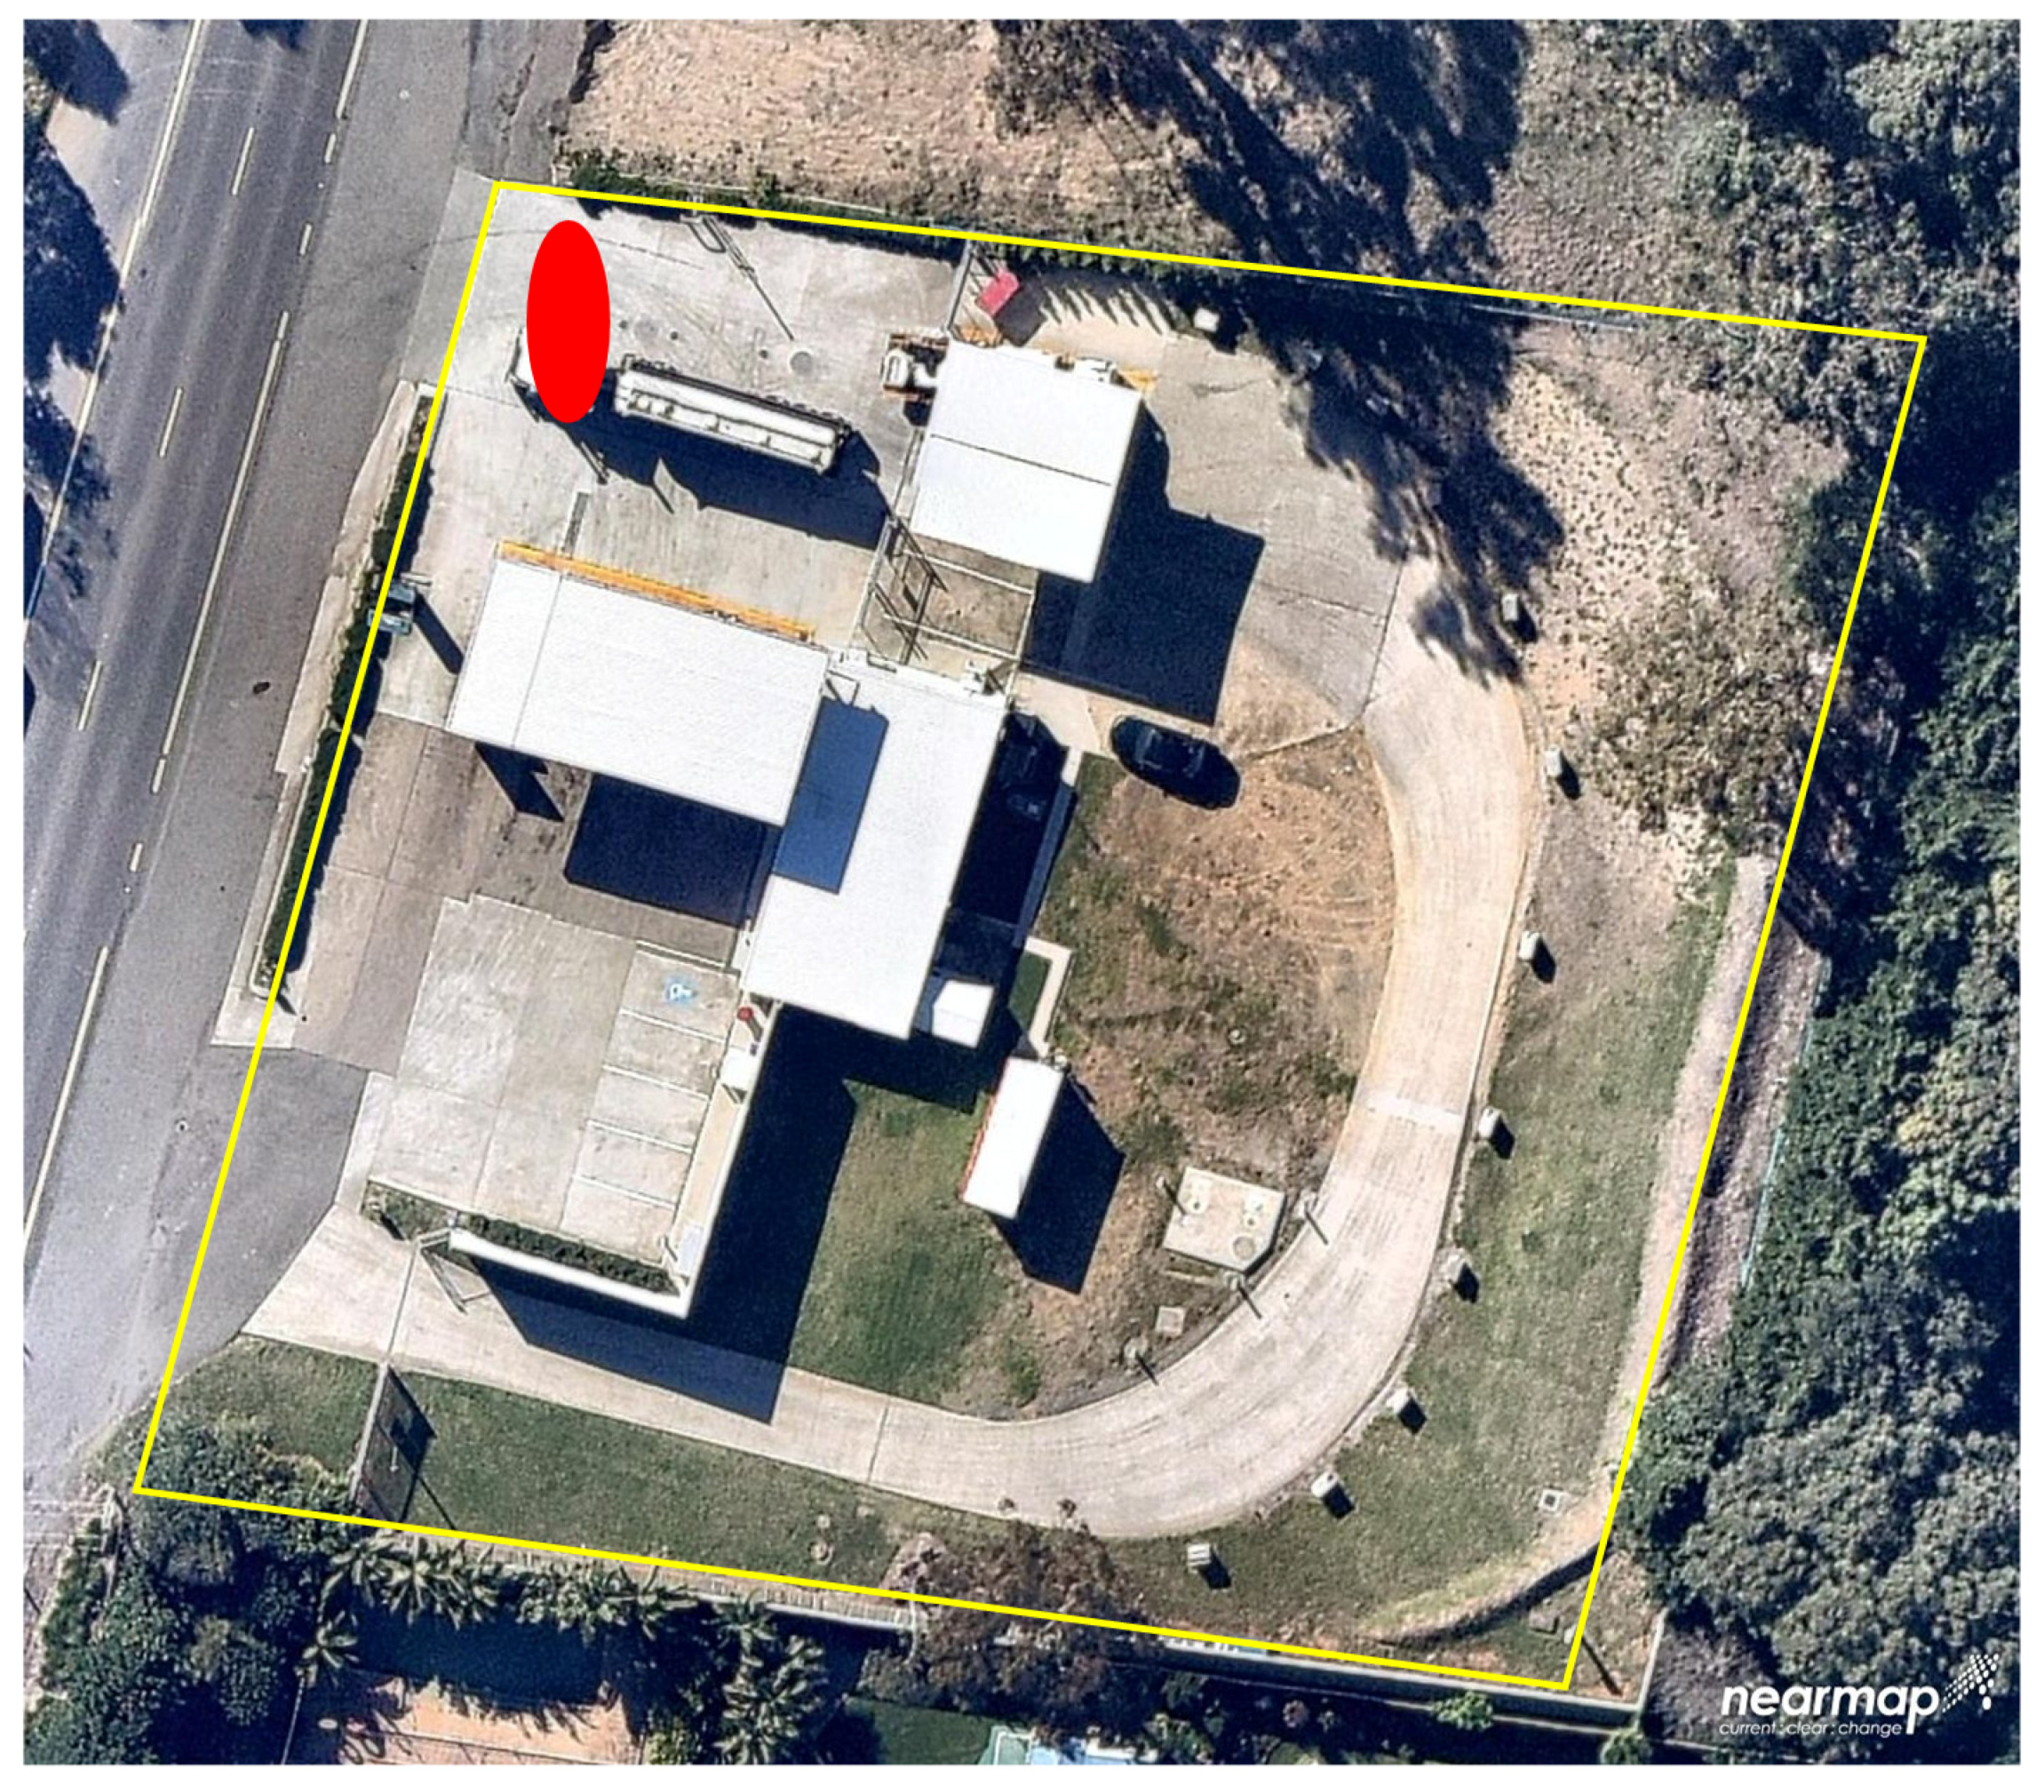
The Fuel station at Bomaderry is located at 246 Princes Highway, Bomaderry, NSW, Australia. The site is approximately 3600 m
2 and predominantly hardstand with a canopy over the refueling area (2073 m
2) with some landscaped area to the rear of the site (1527 m
2). The treatment device is located in the north-western corner of the site, shown on
Figure 3 by a red dot.
Figure 3.
Aerial Photograph of Bomaderry site with approximate property boundary shown by yellow line.
Figure 3.
Aerial Photograph of Bomaderry site with approximate property boundary shown by yellow line.
5.2. Fuel Station, Lakewood, New South Wales
The Lakewood Fuel refilling station site is located at 108 Sirius Drive, Lakewood, NSW, Australia. The 1297 m
2 site is predominantly hardstand with a canopy over the refueling area (997 m
2) with some landscaped area (300 m
2) to the rear and north-eastern side of the site. The treatment device is located in the south-western corner of the site, shown on
Figure 4 by a red dot.
Figure 4.
Aerial photograph of Lakewood refuelling site with approximate property boundary shown by yellow line.
Figure 4.
Aerial photograph of Lakewood refuelling site with approximate property boundary shown by yellow line.
5.3. Fuel Station, Warner, Queensland
The Warner Fuel station site is located at the north-west corner of the intersection between Old North Rd and Samsonvale Rd, Warner, QLD. The 2238 m
2 site is predominantly hardstand with a canopy over the refueling area (1660 m
2) with some landscaped area (578 m
2) to the site boundaries and a shop area. The treatment device is located in the north-eastern portion of the site, shown on
Figure 5 by a red dot.
Figure 5.
Aerial photograph of the Warner refueling site with approximate property boundary shown by yellow line.
Figure 5.
Aerial photograph of the Warner refueling site with approximate property boundary shown by yellow line.
5.4. Sampling Methodology
Grab sampling is usually preferred when the target pollutants (e.g., hydrocarbons) do not lend themselves to automated, composite sampling [
11]. When hydrocarbons are the pollutant of concern, grab sampling allows the sample collector to skim the water surface and target any film that may be present [
19]. Therefore, grab samples have been collected from each of these sites immediately after rainfall events. Inlet samples have been taken from the Oil Retention Chamber shown on
Figure 5 at point A. Outlet samples have been collected from inside the treated flow pipe from the coalescer immediately before it discharges the device, shown on
Figure 6 at point B.
Figure 6.
Section through treatment device showing sample points at inlet (A) and outlet (B).
Figure 6.
Section through treatment device showing sample points at inlet (A) and outlet (B).
Samples were collected in 500 mL amber glass bottles and 50 mL clear glass vials preserved with hydrochloric acid. The samples were then chilled and transported to a NATA-registered laboratory for analysis. Samples were analysed for TPH/Total Recoverable Hydrocarbons (TRH) via Headspace Gas Chomatography (HS-GC) Flame Ionisation Detection (FID) in accordance with standard methods (USEPA 3510/8015 GC/FID, USEPA 5030/8260 HS/GC/MS/FID, APHA 5520F) [
20].
Table 3.
Grab sample Water Quality Results.
Table 3.
Grab sample Water Quality Results.
| | Bomaderry | Lakewood | Warner |
|---|
| Parameter | In (mg/L) | Out (mg/L) | In (mg/L) | Out (mg/L) | In (mg/L) | Out (mg/L) |
|---|
| TRH C6–C9 | 6.9 | 0.16 | 16,000 | 0.3 | <0.02 | <0.02 |
| TRH C10–C14 | 1400 | 0.08 | 1700 | <0.05 | 0.06 | <0.05 |
| TRH C15–C28 | 4900 | 0.3 | 14,000 | 0.3 | 0.37 | <0.1 |
| TRH C29–C36 | 4.5 | <0.1 | 150 | <0.1 | 0.20 | <0.05 |
| TRH C10–C36 (TOTAL) | 6300 | 0.4 | 0.18 | <0.02 | 0.63 | <0.05 |
| Naphthalene | 0.44 | <0.02 | <0.02 | <0.02 | <0.02 | <0.02 |
| TRH C6–C10 | 16 | 0.17 | 5900 | <0.05 | <0.02 | <0.02 |
| TRH C6-C10 less BTEX (F1) | 10 | 0.08 | 5900 | <0.05 | <0.1 | <0.1 |
| TRH>C10–C16 | 2900 | 0.11 | 10,000 | 0.3 | 0.51 | <0.1 |
| TRH > C10–C16 less Naphthalene (F2) | 2900 | 0.11 | 87 | <0.1 | <0.1 | <0.1 |
| TRH > C16–C34 | 3700 | 0.3 | 0.25 | 0.04 | 0.51 | <0.1 |
| TRH > C34–C40 | <0.1 | <0.1 | 0.15 | 0.04 | <0.1 | <0.1 |
As can be seen from the results in
Table 3 above, even at very low influent concentrations, all hydrocarbon fractions in the outlet samples are below the 5 mg/L criteria. The efficiency ratios for these parameters are between 73% and 99.9%.
6. Australian Flow-Weighted Field Case Study
Field testing is underway on a refueling station in Southport, Gold Coast, Queensland, Australia. The site is approximately 71 km south-east of the Brisbane central business district (CBD). Runoff from the tanker fill box and under-canopy area (approximately 50 m
2) enters the drainage network via grated inlets and is transported to a P040.C1C2.F.300 model for hydrocarbon capture prior to discharge into further detention systems and downstream stormwater network. The site has a total area of 3373 m
2 with approximately 1178 m
2 of roof area (35%), 2037 m
2 of impervious driveway (60%), and 158 m
2 of landscaping (5%). An aerial photograph of the site is shown in
Figure 7. The location of the treatment device is shown indicatively as a red dot.
Figure 7.
Southport field monitoring site (approximate site boundary shown by yellow line).
Figure 7.
Southport field monitoring site (approximate site boundary shown by yellow line).
A monitoring protocol was developed in collaboration with Griffith University (GU) and is presented in
Table 4, based on the Auckland Regional Council Proprietary Device Evaluation Protocol and Washington State Department of Environment (WasDoE) Technology Acceptance Protocol—Ecology (TAPE) and the US Stormwater BMP Database protocols [
21,
22,
23] and is tabulated below. The objective of the field testing is to evaluate the performance of the treatment train for removal of a range of typical, non-volatile, stormwater pollutants anticipated from the fuel station. Hence, in this particular installation flow-weighted auto-samplers have been used to collect a series of aliquots across rainfall events. However, to provide additional information on hydrocarbons, samples were also tested for these analytes. The auto-samplers store the composite samples in 9 L, sterilized glass bottles within a secure cabinet. The 9 L composite samples are sealed and collected by Griffith University as soon as possible (e.g., 1–2 h), subject to safe work practices, following each rainfall event and transported to the laboratory for analysis. Due to the local regulatory focus on other non-volatile pollutants, the experimental setup and constraints may slightly reduce accuracy for volatile pollutants.
The monitoring program has been underway since April 2015. Sampling and flow monitoring equipment failure has troubled the installation during that period. Following extensive troubleshooting and replacement of faulty items (auto-samplers and ultrasonic flow probes), as of September 2015, the site is functional again. Subsequently, two protocol-compliant rainfall events have been captured and tested. The results of the flow-weighted testing are presented below.
Table 4.
Southport Field Testing Protocol Requirements.
Table 4.
Southport Field Testing Protocol Requirements.
| Parameter | Details |
|---|
| Minimum Storm Duration | 5 min |
| Stormwater Treatment Device Type | Puraceptor P040.C1C2.F.300 |
| Target Number of Storm events | 15 |
| Minimum rainfall depth per event | 5 mm |
| Minimum inter-event period | 24–72 h, depending on influent concentrations > Limit of Detection (LOD) |
| Minimum hydrograph sampling | First 60% of hydrograph |
| Flow rates tested | At least 3 events >75% of the treatable flow rate (TFR) with 1 exceeding the TFR. |
| Minimum number of water sub-samples collected per event | Prefer 8 aliquots for each event. (However, as few as 3 may be acceptable provided aliquots are distributed across the hydrograph, for short duration low volume events) |
| Sampling method | ISCO GLS Auto-sampler, flow-weighted |
| Data Management | Campbell Scientific CR1000 Data logger with Ethernet Modem |
| Particle Size Distribution (PSD) analysis via Laser Diffraction | Continuously stirred, without chemical dispersion or sonication |
| Total Suspended Solids (TSS) | American Public Health Association (APHA) (2005) 2540 D [20] |
| Total Nitrogen (TN) and species (water samples only) | APHA (2005) 4500 N, APHA (2005) 4500 NH3, APHA (2005) 4500 NO3 |
| Total Phosphorus (TP) and Orthophosphate (water samples only) | APHA (2005) 4500 P |
| pH and Electrical Conductivity (EC) | Handheld probe, calibrated to manufacturer’s specifications |
| Glycols | GC/FID |
| TPH | HS-GC/MS |
| Total Metals (As, Cd, Cr, Cu, Mn, Pb, Ni, Zn, Al, Fe, Se) | USEPA 6020, ICP/MS |
| Anionic and Non-anionic surfactants | APHA 5540 B, C & D |
The preliminary results from the field testing at Southport, presented in
Table 5 above, support the laboratory findings that hydrocarbon levels in the outlet from the treatment device are below 5 mg/L. This conforms to the EN BS858-1:2002 requirements for a Class 1 hydrocarbon treatment device. It should be noted that only the event on 29 April 2015 has influent concentrations greater than 5 mg/L, and that at the observed, very low influent concentrations, volatilization or analytical error may be responsible for the reduction observed at the outlet. Further testing is underway.
Table 5.
Southport Water Quality Results.
Table 5.
Southport Water Quality Results.
| Event | | 2/4/15 | 29/4/15 |
|---|
| Rainfall (mm) | | 26.2 | 2.4 |
|---|
| Duration (minutes) | | 92 | 99 |
|---|
| Peak Rainfall Intensity (mm/h) | | 13.8 | 0.4 |
|---|
| Parameter | LOD1 (μg/L) | In (μg/L) | Out (μg/L) | In (μg/L) | Out (μg/L) |
|---|
| C6–C9 Fraction | 20 | <20 | <20 | 90 | 60 |
| C10–C14 Fraction | 50 | 220 | <50 | 1890 | 110 |
| C15–C28 Fraction | 100 | 2540 | 500 | 11,000 | 470 |
| C29–C36 Fraction | 50 | 380 | 100 | 200 | 70 |
| C10–C36 Fraction (sum) | 50 | 3140 | 600 | 13,090 | 650 |
| Anionic Surfactants as MBAS | 0.5 | 8 | 1 | 1 | 0.4 |
| Non-ionic Surfactants as CTAS | 0.5 | <0.5 | <0.5 | <0.5 | <0.5 |
| Efficiency Ratio % Reduction |
| C6–C9 Fraction | | 30% | | | |
| C10–C14 Fraction | | 94% | | | |
| C15–C28 Fraction | | 93% | | | |
| C29–C36 Fraction | | 71% | | | |
| C10–C36 Fraction (sum) | | 92% | | | |
| Anionic Surfactants as MBAS | | 84% | | | |
| Non-ionic Surfactants as CTAS | | ND | | | |
7. Conclusions
Evaluation of alternate hydrocarbon treatment technologies in Europe are subject to laboratory testing to the EN BS858-1:2002 standard. Several models of a proprietary hydrocarbon capture technology have been tested to this Standard in Europe and Australia and confirmed to comply with the Class 1 criteria of <5 mg/L hydrocarbons in the outlet sample. Field testing has been undertaken in Australia on a variety of installations utilizing site specific device sizes. Grab samples immediately following rainfall events on a variety of field installation sites in Australia also confirm compliance with the <5 mg/L hydrocarbon Class 1 criteria on outlet samples. Flow-weighted, automated field testing underway in Australia is evaluating hydrocarbon performance as well as other pollutants including TSS, TN and TP. The results to date also confirm compliance with the EN BS858-1:2002 Class 1 criteria of <5 mg/L hydrocarbons in the outflow. These results across several laboratory tests and field case studies suggest that the technology is a promising alternative for hydrocarbon capture for stormwater treatment.
Acknowledgments
The authors acknowledge the contribution to this research by HR Wallingford, UniSA, and Griffith University, including Rodger Tomlinson, Sally Obst, Dan Ware.
Author Contributions
Darren Drapper has been engaged to project manage the Australian field research; Andy Hornbuckle is the Asia Pacific Team Leader—Water Quality for SPEL Environmental and pioneered the site selection, approvals, financing and regulator liaison for the Southport project. Both authors have contributed to the preparation of this journal article.
Conflicts of Interest
The research behind this paper was independently undertaken by HR Wallingford, UniSA, and GU under funding arrangements with SPEL Environmental, Australia and SPEL UK.
References
- Burns, K.A.; Codi, S. Contrasting Impacts of Localized Versus Catastrophic Oil Spills in Mangrove Sediments; Magroves and Salt Marshes, 2, 63–74; Kluwer Academic Publishers: Amsterdam, The Netherlands, 1998. [Google Scholar]
- Calligeros, M. Grounded ship: 3km oil spill on Great Barrier Reef. Available online: http://www.smh.com.au/environment/grounded-ship-3km-oil-spill-on-great-barrier-reef-20100404-rlec.html (accessed on 11 November 2015).
- Camilli, R.; Reddy, C.M.; Yorger, D.R.; Van Mooy, B.A.S.; Jakuba, M.V.; Kinsey, J.C.; McIntyre, C.P.; Sylva, S.P.; Maloney, J.V. Tracking Hydrocarbon Plume Transport and Biodegradation at Deepwater Horizon, Science. AAAS 2010, 330, 201–204. [Google Scholar]
- Hilpert, M.; Breysse, P.N. Infiltration and evaporation of small hydrocarbon spills at gas stations. J. Contam. Hydrol. 2014, 170, 39–52. [Google Scholar] [CrossRef] [PubMed]
- Hilpert, M.; Mora, B.A.; Ni, J.; Rule, A.M.; Nachman, K.E. Hydrocarbon Release during Fuel Storage and Transfer at Gas Stations: Environmental and Health Effects. Curr. Environ. Health Rep. 2015, 2, 412–422. [Google Scholar] [CrossRef] [PubMed]
- Borden, R.C.; Black, D.C.; McBlief, K.V. MTBE and aromatic hydrocarbons in North Carolina Stormwater runoff. Environ. Pollut. 2002, 118, 141–152. [Google Scholar] [CrossRef]
- Faram, M.; Andoh, R.Y.G. Quantification of persistent pollutants captured by proprietary Stormwater sediment interceptors. In Proceedings of the 10th International Specialised Conference on Diffuse Pollution and Sustainable Basin Management, Istanbul, Turkey, 18–22 September 2006.
- Wong, T.; Breen, P.; Lloyd, S. Water Sensitive Road Design; Technical Report, Report 00/1; Cooperative Research Centre for Catchment Hydrology: Melbourne, Australia, 2000. [Google Scholar]
- Drapper, D.W.; Tomlinson, R.; Williams, P. Pollutant Concentrations in Road Runoff: Southeast Queensland Case Study. J. Environ. Eng. 2000, 126, 313–320. [Google Scholar] [CrossRef]
- Campbell, N.; D’Arcy, B.; Frost, A.; Novotny, V.; Sansom, A. Diffuse Pollution: An Introduction to the Problems and Solutions; IWA Publishing: London, UK, 2005. [Google Scholar]
- United State Environmental Protection Agency (USEPA). Preventing Leaks and Spills at Service Stations: A Guide for Facilities; EPA-909-K-03-001; USEPA: San Francisco, CA, USA, 2003.
- New South Wales Environmental Protection Authority (NSWEPA). Environmental Action for Service Stations; Department of Environment & Climate Change: Sydney, Australia, 2008.
- Hong, E.; Seagren, E.A.; Davis, A.P. Sustainable Oil and Grease Removal from Synthetic Stormwater Runoff Using Bench-Scale Bioretention Studies. Water Environ. Res. 2006, 78, 141–155. [Google Scholar] [CrossRef] [PubMed]
- Duke, N.C.; Burns, K.A.; Swannell, R.P.J.; Dalhaus, O.; Rupp, R.J. Dispersant Use and a Bioremediation Strategy as Alternate Means of Reducing Impacts of Large Oil Spills on Mangroves: The Gladstone Field Trials. Mar. Pollut. Bull. 2000, 41, 403–412. [Google Scholar] [CrossRef]
- Burns, K.A.; Codi, S.; Duke, N.C. Gladstone, Australia Field Studies: Weathering and Degradation of Hydrocarbons in Oiled Mangrove and Salt Marsh Sediments with and without the Application of an Experimental Bioremediation Protocol. Mar. Pollut. Bull. 2000, 41, 392–402. [Google Scholar] [CrossRef]
- British Standards Institution. BS EN858-1:2002, Separator Systems for Light Liquids (e.g., Oil and Petrol). Principles of Product Design, Performance and Testing, Marking and Quality Control; British Standards Institution: London, UK, 2002. [Google Scholar]
- HR Wallingford. Literature Search on Oil Droplets in Oil Separators; HR Wallingford: Oxfordshire, UK, 2007. [Google Scholar]
- University of South Australia (UniSA). Performance Assessment of the Puraceptor to BS EN858-1:2002 Separation Systems for Light Liquids; University of South Australia (UniSA): Mawson Lakes, South Australia, 2010. [Google Scholar]
- Victorian Environment Protection Agency (VicEPA). Industrial Waste Resource Guidelines: Sampling and Analysis of Waters, Wastewaters, Soils and Wastes; Victorian Government: Melbourne, Australia, 2009.
- APHA. Standard Methods for the Examination of Water and Wastewater, 21st ed.; American Public Health Association Press: Washington, DC, USA, 2005. [Google Scholar]
- Auckland Regional Council. Proprietary Devices Evaluation Protocol (PDEP) for Stormwater Quality Treatment Devices, Version 3 edAuckland Regional Council: Auckland, New Zealand, 2012.
- Washington Department of Ecology. Technical Guidance Manual for Evaluating Emerging Stormwater Treatment Technologies; Technology Assessment Protocol—Ecology (TAPE); Washington Department of Ecology: Washingtion, WA, USA, 2011.
- Geosyntec Consultants and Wright Water Engineers, Inc. Urban Stormwater BMP Performance Monitoring; Geosyntec Consultants and Wright Water Engineers, Inc.: Portland, OR, USA, 2009. [Google Scholar]
© 2016 by the authors; licensee MDPI, Basel, Switzerland. This article is an open access article distributed under the terms and conditions of the Creative Commons by Attribution (CC-BY) license (http://creativecommons.org/licenses/by/4.0/).


